Abstract
Air pollution endangers human health and sustainable socio-economic development, especially in urban agglomeration (UA). The Chinese government has implemented a series of policies and standards to improve air quality. However, few studies have compared variations in PM2.5 concentrations across multiple UAs, and current research often lacks analysis relative to the clean air policies implemented by the government. In this study, we used econometric and geostatistical methods to assess the distribution and spatial evolution of PM2.5 concentrations in five UAs (the Beijing–Tianjin–Hebei UA (BTHUA), middle reaches of the Yangtze River UA (MYRUA), Chengdu–Chongqing UA (CCUA), Harbin Changchun UA (HCUA), and Beibu Gulf UA (BGUA)) in China from 2000 to 2021 to explore the effectiveness of the clean air policies implemented by the government on air pollution control, to analyze the ambient air quality of UAs, and to make recommendations for public outdoor activities. The results indicated that the clean air policy implemented by the Chinese government in 2013 achieved significant treatment results. PM2.5 concentrations were plotted as an inverted U-shaped curve based on time, which showed an upward trend before 2013 and a downward trend after 2013. PM2.5 concentrations showed a similar seasonal pattern, with a single-valley “V” shape. PM2.5 concentration was the highest in winter and the lowest in summer. The PM2.5 concentration of HCUA and BGUA was lower than that of CCUA, MYRUA, and BTHUA. The increase in PM2.5 concentration mainly occurred in autumn and winter, while the decrease mainly occurred in spring. In 2021, the PM2.5 air quality compliance rates (<35 µg/m3) in BTHUA, MYRUA, CCUA, HCUA, and BGUA were 44.57%, 80.00%, 82.04%, 99.74%, and 100%, respectively. However, in 2021, 19.19% of the five UAs still had an ambient air quality of Grade II (i.e., 50 < AQIPM2.5 < 100). People with abnormally sensitive breathing in these areas should reduce their outdoor activities. These results contribute to epidemiological studies on human health and disease prevention and suggest reasonable pathways by which governments can improve air quality through sustainable urban planning.
1. Introduction
With rapidly increasing global urbanization, it is estimated that 5.9 billion of the world’s population will be living in cities by 2030, with the proportion of urban population rising to 60.4% [1]. Industrialization and urbanization are also the most important drivers of China’s economic development. While these economic drivers have brought improved living standards, they have also led to several environmental problems, such as severe air quality deterioration and unchecked urban sprawl [2,3]. The growth of the urban population, car ownership, and industrial development have led to massive vehicle emissions and the burning of fossil fuels in factories, resulting in serious air pollution [4]. Air pollution is a major global environmental risk factor, causing approximately 7 million deaths in 2012 [5].
PM2.5 (particulate matter with an aerodynamic diameter ≤2.5 µm) has a small area, wide contact surface, strong reactivity, long duration, and tends to carry harmful substances [6,7]. PM2.5 is the primary pollutant in urban air, which seriously impacts atmospheric visibility [8], climate change [9], socio-economic development [10], and human health [11,12] and has become an essential factor hindering regional sustainable development. Many studies have shown that PM2.5 is highly correlated with morbidity and mortality, and people exposed to PM2.5-polluted air are at higher risk of lung cancer, cardiovascular disease, and other respiratory diseases [13,14,15,16,17,18]. Persistent PM2.5 pollution damages the overall image of a city, has a negative impact on attracting capital, talent, and tourism, and constrains the sustainable socio-economic development of the city [19,20,21,22]. Therefore, the potential health and economic benefits of reducing PM2.5 concentrations in the environment are unquestionable.
In recent years, frequent outbreaks of severe haze in vast areas of China have drawn widespread public attention [10]. It is estimated that 28% of China’s territory (approximately 2.72 million square kilometers) was exposed to severe PM2.5 pollution (>35 μg/m3) in 2010, including 75% of the 154 Chinese cities with more than one million inhabitants [23,24]. To improve air pollution, the Chinese government has formulated several clean air policies and standards [25], such as the Integrated Emission Standard of Air Pollutants (GB16297-1996), Emission Standard of Air Pollutants of Thermal Power Plants (GB-13223-2011), Ambient Air Quality Standards (GB3095-2012), Technical Regulation on Ambient Air Quality Index (HJ633-2012), Emission Standard of Air Pollutants for Coal-Burning Oil-Burning Gas-Fired Boiler (GB13271-2014), Air Pollution Prevention and Control Action Plan, the 13th Five-Year Plan for Ecological Environmental Protection, and the 14th Five-Year Plan for Ecological Environmental Protection. In order to assess the effectiveness of the implemented mitigation measures, long-term changes in PM2.5 concentration are generally considered to be effective response indicators [26].
Urban agglomeration (UA), the fastest developing regional type globally, has become a new regional unit, which enables countries to participate in global competition and international division of labor [27]. UA refers to an urban complex with compact space and closed economic ties formed with one megalopolis as its core and more than three surrounding metropolitan areas or large and medium-sized cities as its basic units, relying on developed infrastructure networks such as transportation and communication networks [28]. In 2013, the China’s Central Conference on Urbanization Work took UAs as the main body for the promotion of China’s new urbanization for the first time. The government’s report has regarded UAs as the new social and economic growth pole for 15 consecutive years. UAs are the focus of high PM2.5 pollution [29,30], and their environmental pollution mechanisms are more complex [31,32].
It is of great practical value to study the variation characteristics of PM2.5 concentrations in UAs to not only increase our understanding of air pollution mechanisms, but also provide scientific references for the implementation of targeted control measures [33]. Previous studies have shown that the spatial pattern of PM2.5 concentrations has evident spatial heterogeneity at different time scales [34]. The characteristic analysis of PM2.5 concentrations mainly focuses on the national scale [25,35], provincial scale [36], and urban [37] or UA [31,38] scale. Most current studies focus on exploring the spatiotemporal characteristics and driving factors of PM2.5 concentrations, with few studies comparing the variation of PM2.5 concentrations in multiple UAs [39,40,41]. At the same time, current studies often lack analyses aligned with the clean air policies implemented by the Chinese government. In addition, current studies ignore the fundamental purpose of PM2.5 concentration monitoring. To be specific, the current research (1) lacks a quantitative evaluation of the governance effect of current clean air policies and does not point out the areas that need to be focused on in future policy formulation; (2) lacks a direct correlation between public health and ambient air quality and fails to provide health guidance for public outdoor activities.
This study aims to fill the above gaps. Based on PM2.5 data with a spatial resolution of 1 km, this study assesses the distribution and spatial evolution of PM2.5 concentrations in UAs in China from 2000 to 2021 using econometric and geostatistical methods. In general, the research objectives of this study include the following three aspects. Firstly, to explore the spatial and temporal patterns of PM2.5 concentrations in UAs. Secondly, to evaluate the effectiveness of clean air policies implemented by the Chinese government on air pollution control. Third, to analyze ambient air quality in UAs and put forward suggestions for public outdoor activities. This study provides a scientific and practical way to deepen our understanding of the seasonal variation of PM2.5 concentrations in UAs in China, provides a theoretical reference for regional public health protection and disease prevention, and proposes a reasonable pathway by which the government can improve air quality through sustainable urban planning.
2. Materials and Methods
2.1. Study Area
China’s 13th Five-Year Plan and the National New Urbanization Plan (2014–2020) identified 19 UAs [42] comprising five national UAs, eight regional, medium-sized UAs, and six small, regional UAs. Considering the economic development, climatic factors, and geographical environment, three national mega UAs (Beijing–Tianjin–Hebei UA, the middle reaches of the Yangtze River UA, and Chengdu–Chongqing UA) and two regional, medium-sized UAs (Harbin Changchun UA and Beibu Gulf UA) were selected as the case study areas of this study (Figure 1 and Table 1).
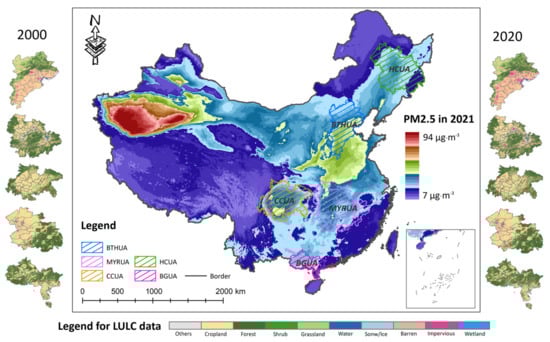
Figure 1.
UA locations in China. The left and right panels show land use and land cover (LULC) information for each UA in 2000 and 2020, respectively. The LULC data used were from the GLUD dataset (https://zenodo.org/record/5210928, accessed on 17 May 2022) developed by Yang and Huang [43].

Table 1.
Cities in the five UAs.
The Beijing–Tianjin–Hebei UA (BTHUA), located in the Bohai Bay region, is the regional economic growth pole in northern China and undertakes the strategic responsibility of leading the economic development of north China. The middle reaches of the Yangtze River UA (MYRUA) are the key region for the Chinese government’s implementation of all-round, deepening reforms and promotion of new-type urbanization. The Chengdu–Chongqing UA (CCUA) is an essential platform for the development of the west and one of the regions with the best economic foundation in the west. As an important part of the Yangtze River Economic Belt, the MYRUA and the CCUA have the geographical advantages of “connecting the east with the west and connecting the south with the north”. The Beibu Gulf UA (BGUA) and Harbin Changchun UA (HCUA) are located at the southernmost and northernmost of China’s “two horizontal and three verticals” urbanization strategy spatial layout, respectively, and are of great significance to the opening up and development of western and northeast China. In addition, the HCUA is an important grain-producing area and industrial base in China. The BTHUA has a large population scale and a high urbanization level, while the MYRUA, CCUA, and BGUA have a high population growth rate. The air quality problems caused by the high density of built-up areas and population and the aggregation of industry cannot be ignored and pose a severe threat to the sustainable development of the region [44]. Case areas with different geographical locations, population densities, and economic levels provide an excellent opportunity to accurately, objectively, and comprehensively assess the changes of ambient air quality in China over the past 20 years.
2.2. Data
The PM2.5 data used in this paper were obtained from the PM2.5 dataset (named ChinaHighPM2.5) (https://zenodo.org/record/6398971, accessed on 21 May 2022). The ChinaHighPM2.5 dataset for the period 2000–2021 was produced by Wei et al. [45,46] using an artificial intelligence approach in combination with big data products including ground-based measurements, satellite remote sensing products, atmospheric reanalysis, and model simulations. This dataset is a series of long-term, full-coverage, high-resolution, high-quality, ground-level air pollutants datasets (i.e., ChinaHighAirPollutants, CHAP) for China. The ChinaHighPM2.5 data have a spatial resolution of 1 × 1 km2 and include three time scales, daily, monthly, and annual. The cross-validation coefficient of determination (CV-R2) for this dataset is 0.92, and the daily root-mean-square error (RMSE) is 10.76 µg/m3. The geographical data and administrative boundaries of the study area were obtained from the basic geographical data of China (1.4 million items). All data were converted into a unified projection coordinate system (Albers conic equal area) and were resampled to a spatial resolution of 1 km.
2.3. Analysis Method
2.3.1. Trend Analysis
The Theil–Sen median trend analysis and Mann–Kendall non-parametric test were used to detect the trend and significance of PM2.5 concentrations. These non-parametric methods were free from data distribution or missing data. They have been widely used to analyze trends in vegetation, precipitation, and temperature [47,48]. The Theil–Sen median trend is calculated using the following equation:
where (unit: µg/m3/y) is the PM2.5 concentration trend; and and are pixel PM2.5 concentration at years and , respectively. When , the PM2.5 concentration is increasing at the pixel; otherwise, it is decreasing.
The Mann–Kendall non-parametric test is calculated as:
where is the length of the time series; and , , and are the intermediate statistic symbols. is the indicator for the significance test. The confidence level set in this study was 0.05; that is, , indicating that the changing trend of PM2.5 concentration was significant at a 0.05 confidence level.
2.3.2. Qualified Rate
The compliance rate can quantify the governance effect of the clean air policy and provide an effective reference for future air governance. The qualified rate, also known as the compliance rate, refers to the ratio of the number of standards met to the total number. The World Health Organization (WHO) points out that PM2.5 concentration in the air at 5 µg/m3 is a safe value. The Chinese government set 35 µg/m3 as the annual average concentration limit value for PM2.5 concentration in the air (https://www.mee.gov.cn/, accessed on 6 June 2022). The qualified rate is calculated by the following formula:
where is the percentage of PM2.5 concentration in the air reaching 35 µg/m3. represents the number of pixels that satisfy the condition, and is the total number of pixels. According to “Beijing 2012–2020 Air Pollution Control Measures” (http://www.beijing.gov.cn/, accessed on 10 June 2022), the limit values of PM2.5 concentration were set as 60 µg/m3, 50 µg/m3, and 35 µg/m3. It should be noted that the compliance rate for each UA represents the proportion of the area of each UA that meets the conditions.
2.3.3. Air Quality Index (AQI)
Ambient air quality is closely related to public health [49]. In 2016, the Chinese government implemented the Ambient Air Quality Index (AQI) technical regulation to protect human health and provide health guidelines to the public (https://www.mee.gov.cn/, accessed on 17 May 2022). The ambient air quality index is calculated by the following formula:
where is pixel PM2.5 concentration, as above. and are the lower and upper limit values adjacent to , respectively. and are the air quality indices corresponding to the lower and upper limit values adjacent to , respectively. When , it is Grade I (Excellent), meaning that the air quality is satisfactory and free of air pollution, and all types of people can engage in normal activities. When , it is Grade II (Good), indicating that the air quality is acceptable and people with abnormal sensitivity should reduce outdoor activities. When , it is Grade III (lightly pollution), and it is recommended that children, the elderly, and people with heart and respiratory illnesses should reduce prolonged, high-intensity outdoor exercise. When , it is Grade IV (moderate pollution), and the general public is advised to moderate their outdoor exercise. When , it is Grade V (heavy pollution), suggesting that the general public reduce outdoor exercise. For more details, please visit the website of the Ministry of Ecology and Environment of China (https://www.mee.gov.cn/, accessed on 17 May 2022).
3. Results
3.1. Temporal and Spatial Characteristics of PM2.5 Concentration in Five UAs
3.1.1. Temporal Variation of PM2.5 Concentration
As shown in Figure 2, the PM2.5 concentrations in the five UAs showed a significant decrease from 2000 to 2021. The PM2.5 concentration in the BTHUA decreased from 55.84 µg/m3 in 2000 to 36.47 µg/m3 in 2021, with a downward trend of approximately 0.85 µg/(m3/y). The maximum value of PM2.5 concentration was 76.68 µg/m3, which occurred in 2013. In the period 2000–2021, the PM2.5 concentration in the MYRUA decreased from 42.17 µg/m3 to 29.62 µg/m3, with a decreasing trend of approximately 0.83 µg/(m3/y). The maximum PM2.5 concentration was 63.23 µg/m3 in 2013. The PM2.5 concentration of the CCUA decreased from 44.63 µg/m3 in 2000 to 30.23 µg/m3 in 2021, with a declining trend of 0.90 µg/(m3/y). The maximum PM2.5 concentration was 62.68 µg/m3, which occurred in 2013. The PM2.5 concentration of the HCUA decreased from 36.93 µg/m3 in 2000 to 26.00 µg/m3 in 2021, with a decreasing trend of 0.45 µg/(m3/y). The maximum PM2.5 concentration was 48.27 µg/m3, which occurred in 2013. The PM2.5 concentration of the BGUA decreased from 30.76 µg/m3 in 2000 to 25.10 µg/m3 in 2021, with a downward trend of 0.52 µg/(m3/y). The maximum PM2.5 concentration was 45.81 µg/m3, which occurred in 2007.
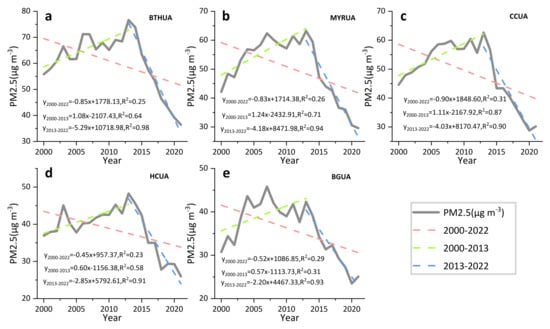
Figure 2.
Interannual variation of PM2.5 concentration at spatial average scale in (a) BTHUA, (b) MYRUA, (c) CCUA, (d) HCUA, (e) BGUA. The pink, green, and blue dotted lines in the graph represent 2000–2021, 2000–2013, and 2013–2021, respectively.
The time-based curve of PM2.5 concentration in the five UAs showed an inverted U shape, with the “left peak slope” indicating the variation from 2000 to 2005, the “peak bottom” indicating the variation from 2005 to 2013, and the “right peak slope” indicating the variation from 2013 to 2021 (Figure 2). In the period 2000–2013, the upward trends of PM2.5 concentration in the BTHUA, MYRUA, CCUA, HCUA, and BGUA were 1.08 µg/(m3/y), 1.24 µg/(m3/y), 1.11 µg/(m3/y), 0.60 µg/(m3/y), and 0.57 µg/(m3/y), respectively. In the period 2013–2021, the downward trends of PM2.5 concentration in the BTHUA, MYRUA, CCUA, HCUA, and BGUA were 5.29 µg/(m3/y), 4.18 µg/(m3/y), 4.03 µg/(m3/y), 2.85 µg/(m3/y), and 2.20 µg/(m3/y), respectively.
To explore the seasonal distribution characteristics of PM2.5 concentration in the five UAs, the monthly average PM2.5 concentrations data from 2000 to 2021 were used to calculate PM2.5 concentration in spring (March to May), summer (June to August), autumn (September to November), and winter (December to February of the following year) of each year. As seen in Figure 3, the PM2.5 concentration of the five UAs showed similar seasonal patterns, and the variation curve was a single-valley “V” shape. The PM2.5 concentration was highest in winter and lowest in summer. The PM2.5 concentration in spring and autumn was similar but slightly higher in autumn. From 2000 to 2021, the average PM2.5 concentrations for the BTHUA in spring, summer, autumn, and winter were 56.50 µg/m3, 47.50 µg/m3, 57.50 µg/m3, and 82.00 µg/m3, respectively. The average concentrations of PM2.5 in the MYRUA were 48.00 µg/m3 (spring), 33.50 µg/m3 (summer), 50.50 µg/m3 (autumn), and 70.50 µg/m3 (winter). The average PM2.5 concentrations in spring, summer, autumn, and winter for the CCUA were 46.50 µg/m3, 31.50 µg/m3, 41.50 µg/m3, and 74.00 µg/m3, respectively. The average PM2.5 concentrations in the four seasons for the HCUA were 36.50 µg/m3, 22.50 µg/m3, 35.50 µg/m3, and 56.50 µg/m3. The average PM2.5 concentration for the BGUA in the four seasons was 34.50 µg/m3, 21.50 µg/m3, 40.50 µg/m3, and 50.00 µg/m3. The BTHUA had the highest PM2.5 concentration, followed by the MYRUA and CCUA; the HCUA and BGUA had the lowest.
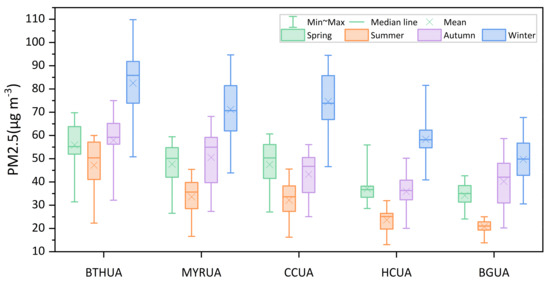
Figure 3.
Seasonal variation of PM2.5 concentrations in the five UAs over the period 2000–2021.
3.1.2. Spatial Pattern of PM2.5 Concentration
As shown in Figure 4, the PM2.5 concentration of the HCUA in northeast China and BGUA in southwest China was lower than that of the CCUA, MYRUA, and BTHUA in central China. In addition, there was significant spatial heterogeneity in PM2.5 concentration within UAs. The northwest of the BTHUA had low PM2.5 concentrations, and the southeast had high PM2.5 concentrations. Specifically, Chengde and Zhangjiakou recorded low PM2.5 concentrations, while Shijiazhuang, Baoding, Xingtai, and Handan recorded high PM2.5 concentrations. The MYRUA had high PM2.5 concentrations in the northwest and low PM2.5 concentrations in the southeast. The PM2.5 concentrations were lower in Zhuzhou, Ji’an, Fuzhou, and the west of Yichang, while those in Xiangfan, Jingmen, Jingzhou, Xiaogan, and Wuhan were higher. The PM2.5 concentrations in the CCUA showed a “bowl-shaped” spatial pattern, with high PM2.5 concentrations in the central part and low PM2.5 concentrations in the surrounding area. The PM2.5 concentrations in Ya’an, northern Dazhou, eastern Chongqing, northern Guangyuan, and western Mianyang were comparatively low. In contrast, those in Chengdu, Meishan, western Chongqing, Yibin, Zigong, and Neijiang were relatively high. The PM2.5 concentrations in the HCUA showed high PM2.5 concentrations in the middle and low PM2.5 concentrations in the surroundings. Specifically, Qiqihar, Yanbian, and Mudanjiang had lower PM2.5 concentrations, while Changchun, Harbin, Jilin, and Songyuan had higher PM2.5 concentrations. The PM2.5 concentrations in the BGUA were characterized by “high in the northwest and low in the southeast”. The PM2.5 concentrations in Haikou, Zhanjiang, and Maoming were relatively low, while those in Nanning, Qinzhou, and Yulin were high.
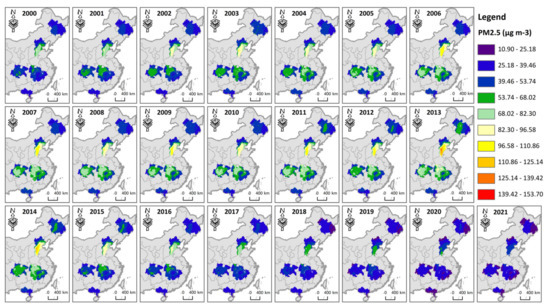
Figure 4.
Spatial pattern of PM2.5 concentrations in the five UAs during 2000–2021. PM2.5: Fine particulate matter ≤ 2.5 μm in aerodynamic diameter (unit: µg/m3).
The PM2.5 concentrations in the five UAs showed significant variations, exhibiting an upward trend from 2000 to 2013 and a downward trend from 2013 to 2021 (Figure 4). As shown in Figure 5, the PM2.5 concentrations in the southeast of the BTHUA increased in all four seasons during the period 2000–2013. The PM2.5 concentration in the west of the MYRUA showed an increasing trend in all four seasons, while that in the east showed a rising trend in spring and winter. The PM2.5 concentration of the CCUA increased in spring, summer, and winter. The PM2.5 concentration of the HCUA increased significantly in the autumn. The PM2.5 concentration in the northwest part of the BGUA showed a significant increase trend in spring. From 2013 to 2021, the PM2.5 concentrations in the southeast of the BTHUA showed a downward trend in the four seasons, while those in the northwest showed a decreasing trend in summer and autumn. The PM2.5 concentrations of the MYRUA and CCUA showed a downward trend in the four seasons. The PM2.5 concentration of the CCUA decreased significantly in spring, summer, and winter. The PM2.5 concentrations of the HCUA and BGUA showed a significant decreasing trend in spring, summer, and autumn.
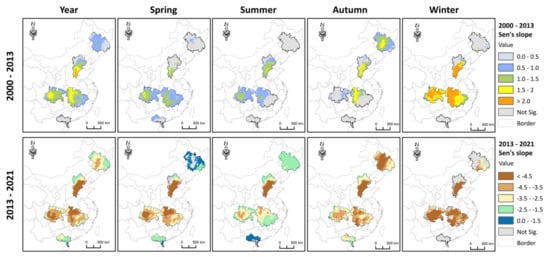
Figure 5.
Trend changes of PM2.5 concentrations in the five UAs during 2000–2013 and 2013–2021. “Not Sig.” means the confidence level was greater than 0.05. A Sen’s slope value greater than 0 indicates an increasing trend in PM2.5 concentrations, while a value less than 0 indicates a decreasing trend in PM2.5 concentrations. The unit of the Sen’s slope is µg/m3/y.
As shown in Figure 6, during 2000–2013, the trend changes of the annual average PM2.5 concentration in the study area were 0.5–1.0 (33.12%, where % represents the proportion of the five UAs) and 1.0–1.5 (28.30%). The trend changes of PM2.5 concentration in spring were 0.5–1.0 (33.78%) and 1.0–1.5 (19.59%). The trend changes of PM2.5 concentration in summer were 0.5–1.0 (30.93%) and 1.0–1.5 (14.33%). The trend changes of PM2.5 concentration in autumn were 0.5–1.0 (17.71%), 1.0–1.5 (19.76%), and 1.5–2.0 (12.62%). The trend changes of PM2.5 concentration in winter were 1.5–2.0 (18.99%) and >2.0 (15.82%). Over the period 2013–2021, the trend changes of the annual mean PM2.5 concentration in the study area were <−4.5 (21.84%), −4.5–−3.5 (26.12%), −3.5–−2.5 (32.27%), and −2.5–−1.5 (19.37%). The trend changes of PM2.5 concentration in spring were <−4.5 (19.80%), −4.5–−3.5 (20.79%), and −3.5–−2.5 (19.28%). The trend changes of PM2.5 concentration in summer were −3.5–−2.5 (27.86%) and −2.5–−1.5 (46.55%). The trend changes of PM2.5 concentration in autumn were <−4.5 (26.92%), −4.5–−3.5 (30.77%), and −3.5–−2.5 (35.57%). The trend changes of PM2.5 concentration in winter were <−4.5 (37.14%) and −4.5–−3.5 (13.05%). In general, the increase in PM2.5 concentration occurred primarily in autumn and winter, while the decrease in PM2.5 concentration occurred predominantly in spring.
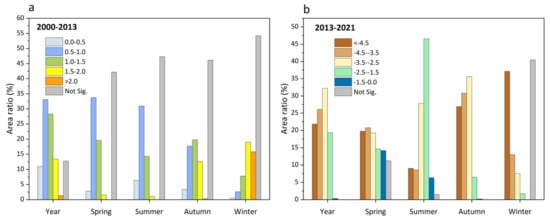
Figure 6.
Trend changes of PM2.5 concentrations in the five UAs over the period (a) 2000–2013 and (b) 2013–2021. “Not Sig.” means the confidence level was greater than 0.05. The color of the bar chart represents the Sen’s slope (unit: µg/m3/y). A Sen’s slope value greater than 0 indicates an increasing trend in PM2.5 concentrations, while a value less than 0 indicates a decreasing trend in PM2.5 concentrations.
3.2. Qualified Rate of PM2.5 Air Quality
As shown in Figure 7, there is a clear interannual variation trend in the PM2.5 air quality qualified rate for the five UAs during 2000–2021. The PM2.5 air quality qualified rate decreased during 2000–2013 and increased during 2013–2021. In 2000, the PM2.5 air quality qualified rate of the BTHUA was 14.52% (<35 µg/m3,), 28.41% (35 µg/m3–50 µg/m3), and 10.63% (50 µg/m3–60 µg/m3). The PM2.5 air quality qualified rate of the MYRUA was 19.71% (<35 µg/m3), 59.16% (35 µg/m3–50 µg/m3), and 2.05% (50 µg/m3–60 µg/m3). The PM2.5 air quality qualified rate of the CCUA was 11.65% (<35 µg/m3), 57.10% (35 µg/m3–50 µg/m3), and 31.05% (50 µg/m3–60 µg/m3). The PM2.5 air quality qualified rate of the HCUA was 47.51% (<35 µg/m3) and 52.24% (35 µg/m3–50 µg/m3). The PM2.5 air quality qualified rate of the BGUA was 95.05% (<35 µg/m3) and 4.95% (35 µg/m3–50 µg/m3). In 2013, the PM2.5 air quality qualified rate of the BTHUA was 0.01% (<35 µg/m3), 29.52% (35 µg/m3–50 µg/m3), and 11.26% (50 µg/m3–60 µg/m3). The PM2.5 air quality qualified rate of the MYRUA was 16.58% (35 µg/m3–50 µg/m3) and 29.37% (50 µg/m3–60 µg/m3). The PM2.5 air quality qualified rate of the CCUA was 2.08% (<35 µg/m3), 13.47% (35 µg/m3–50 µg/m3), and 24.44% (50 µg/m3–60 µg/m3). The PM2.5 air quality qualified rate of the HCUA was 4.43% (<35 µg/m3) and 52.73% (35 µg/m3–50 µg/m3) and 29.86% (50 µg/m3–60 µg/m3). The PM2.5 air quality qualified rate of the BGUA was 6.99% (<35 µg/m3), 86.97% (35 µg/m3–50 µg/m3), and 6.04% (50 µg/m3–60 µg/m3). In 2021, the BTHUA’s PM2.5 air quality qualified rate was 44.57% (<35 µg/m3) and 54.72% (35 µg/m3–50 µg/m3). The PM2.5 air quality qualified rate of the MYRUA was 80.00% (35 µg/m3–50 µg/m3) and 20.00% (50 µg/m3–60 µg/m3). The PM2.5 air quality qualified rate of the CCUA was 82.04% (<35 µg/m3) and 17.96% (35 µg/m3–50 µg/m3). The qualified rate of PM2.5 air quality of the HCUA was 99.74% (<35 µg/m3). The BGUA’s PM2.5 air quality qualified rate was 100% (<35 µg/m3). It can be concluded from the PM2.5 air quality qualified rate of the five UAs that the clean air policy implemented by the Chinese government in 2013 achieved significant treatment effects.
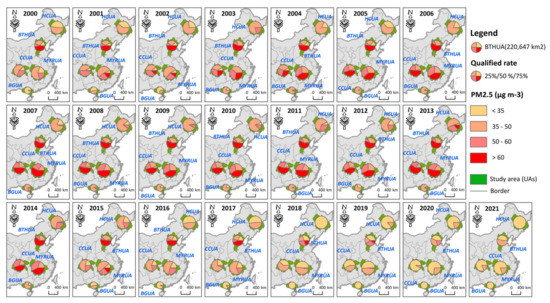
Figure 7.
Qualified rate of PM2.5 air quality in the five UAs over the period 2000–2021.
Analyzing the spatial pattern of the PM2.5 air quality compliance rate can provide a practical reference for future air governance policy formulation. As shown in Figure 8, there was obvious spatial heterogeneity in the PM2.5 air quality qualified rate within UAs. By 2015, the BTHUA’s PM2.5 air quality did not reach the standard (i.e., PM2.5 concentration > 60 µg/m3), including in Beijing, Tianjin, Shijiazhuang, Tangshan, Baoding, Xingtai, and Handan. The MYRUA’s cities of Xiangfan, Jingmen, Xiaogan, and Wuhan failed to satisfy the PM2.5 concentration standards. The CCUA’s cities of Chengdu, Leshan, Zigong, and Neijiang were non-compliant with PM2.5 air quality standards. The HCUA’s cities of Siping, Changchun, and Harbin failed to satisfy the PM2.5 concentration standards. The PM2.5 air quality substandard areas of the BGUA were predominantly distributed in Nanning. By 2020, the BTHUA’s PM2.5 air quality did not meet the standard (i.e., PM2.5 concentration > 50 µg/m3), including in Shijiazhuang, Baoding, Hengshui, Xingtai, Handan, and Anyang. The PM2.5 air quality of the other four UAs all met the standard (PM2.5 concentration < 50 µg/m3). The Chinese government set 35 µg/m3 as the annual average concentration limit value for PM2.5 concentration in the air (https://www.mee.gov.cn/, accessed on 7 July 2022). The PM2.5 air quality of both the HCUA and BGUA was below 35 µg/m3. Certain areas need to be given special attention to achieve this goal (i.e., PM2.5 concentration < 35 µg/m3), including Beijing, Tianjin, Shijiazhuang, Tangshan, Baoding, Xingtai, and Handan in the BTHUA; Xiangfan, Jingmen, Tianmen, Qianjiang, and Xiaogan in the MYRUA; and Chengdu, Leshan, and Zigong in the CCUA.
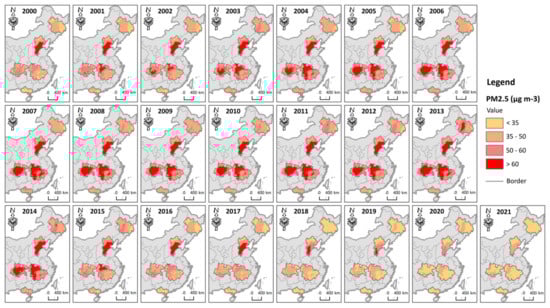
Figure 8.
Spatial pattern of PM2.5 air quality qualified rate in the five UAs over the period 2000–2021.
3.3. Assessment of Ambient Air Quality
Ambient air quality is closely related to public health [49]. In 2016, the Chinese government implemented the Ambient Air Quality Index (AQI) technical regulation to protect human health and provide health guidelines to the public (https://www.mee.gov.cn/, accessed on 7 July 2022). The spatial pattern of ambient air quality in the five UAs from 2000 to 2021 is shown in Figure 9. The ambient air quality in the study area showed a decreasing trend from 2000 (Grade I: 30.51%) to 2013 (Grade I: 2.55%) and an increasing trend from 2013 to 2021 (Grade I: 80.81%). As of 2021, 19.19% of the five UAs was classified as having Grade II ambient air quality, and people who are extremely sensitive to breathing in these areas should reduce outdoor activities. Specifically, the ambient air quality of Chengde and Zhangjiakou in the northwest of the BTHUA was classified as Grade I. In contrast, the ambient air quality of Beijing, Tianjin, Shijiazhuang, Tangshan, Baoding, Xingtai, and Handan in the southeast was classified as Grade II. The MYRUA’s ambient air quality in Zhuzhou, Ji’an, Fuzhou, and Yichang was classified as Grade I, while it was Grade II in Xiangfan, Jingmen, Jingzhou, Xiaogan, and Wuhan. In the CCUA, the ambient air quality of Ya’an, Dazhou, Chongqing, Guangyuan, and Mianyang was Grade I, and that of Chengdu, Meishan, Yibin, Zigong, and Neijiang was Grade II. The ambient air quality of the entire area of the HCUA and BGUA was classified as Grade I, and the population located in this area can exercise outdoors adequately.
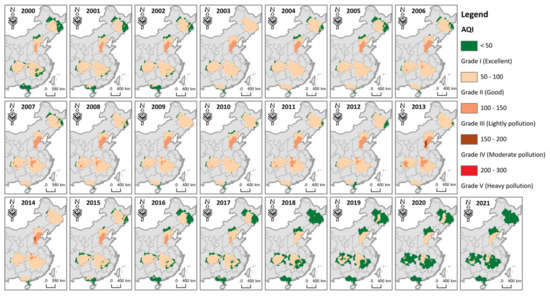
Figure 9.
Spatial pattern of ambient air quality (AQI) in the five UAs over the period 2000–2021.
4. Discussion
4.1. Temporal and Spatial Characteristics of PM2.5 Concentration
In the context of industrialization and urbanization, economic development has brought improved living standards and led to the deterioration of air quality. As the mainstay of promoting China’s new urbanization, UAs have more complex environmental pollution mechanisms and are the concentration area of PM2.5 pollution. The study of five UAs in China further confirmed that PM2.5 concentrations showed an increasing trend from 2000 to 2013 (Figure 2). Affected by the air mitigation measures implemented by the Chinese government in 2013, the PM2.5 concentration showed a significant downward trend from 2013 to 2021 (Figure 2). The reports [23,50] of several scholars support the findings of the present study. This study found that PM2.5 concentrations in the five UAs showed similar seasonal patterns from 2000 to 2021, and the variation curve was a single-valley “V” shape (Figure 3). The PM2.5 concentrations of the five UAs were highest in winter and lowest in summer. The same conclusion was reached in the study by Fontes et al. [50] and Huang et al. [42]. In this study, we further quantified that the increase in PM2.5 concentrations occurred mainly in autumn and winter. In contrast, the decrease in PM2.5 concentrations occurred mainly in spring.
4.2. Clean Air Policy and Health Guidelines Related to PM2.5 Concentration
Targets for the next five years were specified in the Air Pollution Prevention and Control Action Plan. We selected five UAs based on differences in geographical location, population density, and economic level. Although the extent of improvement in PM2.5 concentrations varies between regions, the overall evidence suggests that clean air policies have improved China’s air quality. As can be seen from the PM2.5 air quality qualified rate of the five UAs, the clean air policy implemented by the Chinese government in 2013 has achieved remarkable governance effects (Figure 7). Xu and Zhang’s research [37] and Zhang et al. [25] reached a similar conclusion that the implemented clean air strategy has successfully improved air quality in China. Consistent with our findings, reducing PM2.5 concentrations in UAs in recent years has improved regional ambient air quality. The difference is that our study used econometric methods to further quantify the impact of the clean air policies implemented by the Chinese government on air pollution.
The Beijing 2012–2020 Air Pollution Control Measures, issued by the Beijing municipal government in 2012, set the regional PM2.5 concentrations limit for 2015, 2020, and 2030 at 60 µg/m3, 50 µg/m3, and 35 µg/m3, respectively. We found that the areas in the BTHUA where the PM2.5 air quality in 2020 did not meet the standard (that is, PM2.5 concentrations >50 µg/m3) mainly included Shijiazhuang, Baoding, Hengshui, Xingtai, Handan, and Anyang (Figure 7). It indicates that these policies have not attracted sufficient attention from UAs. In order to achieve the target of PM2.5 concentrations below 35 µg/m3, the spatial attributes and landforms of UAs at different development levels should be considered when formulating new clean air policies and implementing new urbanization development plans in the future. We should pay particular attention to ambient air quality pollution in the southern part of the BTHUA, the southwestern part of the MYRUA, and the northwestern part of the CCUA.
Ambient air quality is closely related to public health. Although the ambient air quality of the five UAs has improved significantly over the past decade (Figure 9), there is still 19.19% of the regions in need of further improvement in ambient air quality. These areas include Beijing, Tianjin, Shijiazhuang, Tangshan, Baoding, Xingtai, and Handan in the BTHUA; Xiangfan, Jingmen, Jingzhou, Xiaogan, and Wuhan in the MYRUA; and Chengdu, Meishan, Yibin, Zigong, and Neijiang in the CCUA. People with abnormal respiratory sensitivity should reduce prolonged outdoor activities in the above-mentioned areas.
4.3. Research Limitations and Prospects
Using econometric and geostatistical methods, this paper evaluated the distribution and spatial evolution of PM2.5 concentrations in five UAs in China from 2000 to 2021, explored the effectiveness of the clean air policy implemented by the Chinese government on air pollution control, analyzed the ambient air quality of UAs, and put forward suggestions for public outdoor activities. However, this study also has some limitations. First, there are differences in the spatial and temporal patterns of PM2.5 concentrations in different UAs [34,36,38]. Therefore, the relationship between UAs and PM2.5 concentrations should be fully explored in future studies. Secondly, the spatial–temporal patterns of PM2.5 concentrations in different UAs respond to clean air policies differently. Some studies indicated that different socio-economic [30], urban structure [32], and geographical conditions [44] may have different effects on PM2.5 concentrations, especially in the UA region. Notably, Shi et al. [32] quantified the relationship between urban form and seasonal variation of PM2.5 concentrations in 279 cities in China. Their results showed that only urban form compactness was significantly associated with PM2.5 concentration in summer and autumn. Still, more urban form indicators were considerably related to PM2.5 concentration in spring and winter. The influence of urban form on PM2.5 concentrations becomes more and more obvious from the national scale to the UA scale with seasonal change. The relationship between urban form and PM2.5 concentrations is very sensitive to seasonal changes in different regions. Constructing an ideal urban structure through a flexible urban planning strategy is important for solving the PM2.5 pollution problem. In general, the classification of UAs needs to be carried out from multiple perspectives, taking into account factors such as land use intensity, land use type, and landscape structure to explore the response of different types of UAs in terms of PM2.5 concentrations and their relation to clean air policies.
5. Conclusions
In this study, we assessed the spatiotemporal dynamics of PM2.5 concentrations in five UAs in China from 2000 to 2021 and explored the effectiveness of government-implemented clean air policies to combat air pollution. In addition, the ambient air quality index (AQI) was used to describe the air quality of the UAs.
- (1)
- The clean air policy implemented by the Chinese government in 2013 achieved significant treatment effects. From 2000 to 2013, the PM2.5 concentrations showed an increasing trend, and, after 2013, the PM2.5 concentrations showed a decreasing trend. Seasonally, PM2.5 concentrations were highest in winter and lowest in summer. Spatially, the PM2.5 concentrations in the HCUA and BGUA were lower than those in the CCUA, MYRUA, and BTHUA. In terms of variation characteristics, the increase in PM2.5 concentrations mainly occurred in autumn and winter, and the decrease mainly occurred in spring;
- (2)
- The government should strengthen air management in these regions where air quality compliance rates are not up to standard in the future. In 2021, the PM2.5 air quality compliance rates (i.e., <35 µg/m3) of the BTHUA, MYRUA, CCUA, HCUA, and BGUA were 44.57%, 80.00%, 82.04%, 99.74%, and 100%, respectively. The areas that failed to meet the standards mainly included the southern part of the BTHUA, the southwestern part of the MYRUA, and the northwestern part of the CCUA;
- (3)
- In 2021, 19.19% of the five UAs still had an ambient air quality of Grade II (i.e., 50< AQIPM2.5 <100). These regions included Beijing, Tianjin, Shijiazhuang, Xiangfan, Jingmen, Chengdu, and Meishan. People with abnormally sensitive breathing in these areas should reduce their outdoor activities.
Author Contributions
Conceptualization, C.Z., Y.P. and W.G.; methodology, C.Z.; software, C.Z.; validation, C.Z., Y.T. and M.F.B.; formal analysis, C.Z.; investigation, C.Z. and Y.T.; resources, C.Z.; data curation, C.Z. and Y.T.; writing—original draft preparation, C.Z.; writing—review and editing, Y.P., W.G. and M.F.B.; visualization, Y.P.; supervision, Y.P.; project administration, Y.P.; funding acquisition, Y.P. All authors have read and agreed to the published version of the manuscript.
Funding
This research was funded by the National Natural Science Foundation of China Major Program (42192581) and Department 2022—State Key Laboratory of Remote Sensing Science (Joint) (12800-310430005).
Institutional Review Board Statement
Not applicable.
Informed Consent Statement
Not applicable.
Data Availability Statement
The datasets used and/or analyzed in this study are available from the corresponding author on reasonable request.
Acknowledgments
The authors would like to acknowledge Jin Wei and Zhanqing Li (https://zenodo.org/record/6398971, accessed on 17 May 2022) for providing 1 km PM2.5 data. The authors are grateful for the comments from anonymous reviewers and the editors.
Conflicts of Interest
The authors declare no conflict of interest.
References
- Sun, Z.; Du, W.; Jiang, H.; Weng, Q.; Guo, H.; Han, Y.; Xing, Q.; Ma, Y. Global 10-m impervious surface area mapping: A big earth data based extraction and updating approach. Int. J. Appl. Earth Obs. Geoinf. 2022, 109, 102800–102815. [Google Scholar] [CrossRef]
- Zhang, X.; Feng, T.; Zhao, S.; Yang, G.; Zhang, Q.; Qin, G.; Liu, L.; Long, X.; Sun, W.; Gao, C.; et al. Elucidating the impacts of rapid urban expansion on air quality in the Yangtze River Delta, China. Sci. Total Environ. 2021, 799, 149426–149437. [Google Scholar] [CrossRef] [PubMed]
- Rodrigues, V.; Gama, C.; Ascenso, A.; Oliveira, K.; Coelho, S.; Monteiro, A.; Hayes, E.; Lopes, M. Assessing air pollution in European cities to support a citizen centered approach to air quality management. Sci. Total Environ. 2021, 799, 149311–149325. [Google Scholar] [CrossRef] [PubMed]
- Han, L.; Zhou, W.; Li, W. City as a major source area of fine particulate (PM2.5) in China. Environ. Pollut. 2015, 206, 183–187. [Google Scholar] [CrossRef] [PubMed]
- Fang, K.; Wang, T.; He, J.; Wang, T.; Xie, X.; Tang, Y.; Shen, Y.; Xu, A. The distribution and drivers of PM2.5 in a rapidly urbanizing region: The Belt and Road Initiative in focus. Sci. Total Environ. 2020, 716, 137010–137018. [Google Scholar] [CrossRef]
- Lim, C.H.; Ryu, J.; Choi, Y.; Jeon, S.W.; Lee, W.K. Understanding global PM2.5 concentrations and their drivers in recent decades (1998–2016). Environ. Int. 2020, 144, 106011–106022. [Google Scholar] [CrossRef]
- Chen, X.; Li, F.; Zhang, J.; Zhou, W.; Wang, X.; Fu, H. Spatiotemporal mapping and multiple driving forces identifying of PM2.5 variation and its joint management strategies across China. J. Clean. Prod. 2020, 250, 119534–119544. [Google Scholar] [CrossRef]
- Wang, X.; Zhang, R.; Yu, W. The Effects of PM2.5 Concentrations and Relative Humidity on Atmospheric Visibility in Beijing. J. Geophys. Res. Atmos. 2019, 124, 2235–2259. [Google Scholar] [CrossRef]
- Wu, W.; Zhang, M.; Ding, Y. Exploring the effect of economic and environment factors on PM2.5 concentration: A case study of the Beijing-Tianjin-Hebei region. J. Environ. Manag. 2020, 268, 110703–110710. [Google Scholar] [CrossRef]
- Hao, Y.; Liu, Y.-M. The influential factors of urban PM2.5 concentrations in China: A spatial econometric analysis. J. Clean. Prod. 2016, 112, 1443–1453. [Google Scholar] [CrossRef]
- Goudarzi, G.; Hopke, P.K.; Yazdani, M. Forecasting PM2.5 concentration using artificial neural network and its health effects in Ahvaz, Iran. Chemosphere 2021, 283, 131285–131294. [Google Scholar] [CrossRef] [PubMed]
- Joshi, P.; Dey, S.; Ghosh, S.; Jain, S.; Sharma, S.K. Association between Acute Exposure to PM2.5 Chemical Species and Mortality in Megacity Delhi, India. Environ. Sci. Technol. 2022, 56, 7275–7287. [Google Scholar] [CrossRef] [PubMed]
- Xu, B.; Lin, B. Regional differences of pollution emissions in China: Contributing factors and mitigation strategies. J. Clean. Prod. 2016, 112, 1454–1463. [Google Scholar] [CrossRef]
- Sun, Y.; Chen, J.; Qin, W.; Yu, Q.; Xin, K.; Ai, J.; Huang, H.; Liu, X. Gas-PM2.5 partitioning, health risks, and sources of atmospheric PAHs in a northern China City: Impact of domestic heating. Environ. Pollut. 2022, 313, 120156–120164. [Google Scholar] [CrossRef]
- Bu, X.; Xie, Z.; Liu, J.; Wei, L.; Wang, X.; Chen, M.; Ren, H. Global PM2.5-attributable health burden from 1990 to 2017: Estimates from the Global Burden of disease study 2017. Environ. Res. 2021, 197, 111123–111132. [Google Scholar] [CrossRef]
- Zhang, P.; Yang, L.; Ma, W.; Wang, N.; Wen, F.; Liu, Q. Spatiotemporal estimation of the PM2.5 concentration and human health risks combining the three-dimensional landscape pattern index and machine learning methods to optimize land use regression modeling in Shaanxi, China. Environ. Res. 2022, 208, 112759–112773. [Google Scholar] [CrossRef]
- Liu, H.; Fang, C.; Zhang, X.; Wang, Z.; Bao, C.; Li, F. The effect of natural and anthropogenic factors on haze pollution in Chinese cities: A spatial econometrics approach. J. Clean. Prod. 2017, 165, 323–333. [Google Scholar] [CrossRef]
- Sharma, S.; Chandra, M.; Kota, S.H. Health Effects Associated with PM2.5: A Systematic Review. Curr. Pollut. Rep. 2020, 6, 345–367. [Google Scholar] [CrossRef]
- Houthuijs, D.; Breugelmans, O.; Hoek, G.; Vaskovi, E.; Mihalikova, E. PM10 and PM2.5 concentrations in Central and Eastern Europe: Results from the Cesar study. Atmos. Environ. 2001, 35, 2757–2771. [Google Scholar] [CrossRef]
- Roy, D.; Singh, G.; Seo, Y.-C. Carcinogenic and non-carcinogenic risks from PM10- and PM2.5-Bound metals in a critically polluted coal mining area. Atmos. Pollut. Res. 2019, 10, 1964–1975. [Google Scholar] [CrossRef]
- Zhao, X.; Zhou, W.; Wu, T.; Han, L. The impacts of urban structure on PM2.5 pollution depend on city size and location. Environ. Pollut. 2022, 292, 118302–118310. [Google Scholar] [CrossRef] [PubMed]
- Zhao, X.; Zhou, W.; Han, L. The spatial and seasonal complexity of PM2.5 pollution in cities from a social-ecological perspective. J. Clean. Prod. 2021, 309, 127476–127488. [Google Scholar] [CrossRef]
- Zhang, H.; Wang, Z.; Zhang, W. Exploring spatiotemporal patterns of PM2.5 in China based on ground-level observations for 190 cities. Environ. Pollut. 2016, 216, 559–567. [Google Scholar] [CrossRef]
- Ye, H.; Tang, J.; Luo, L.; Yang, T.; Fan, K.; Xu, L. High-normal blood pressure (prehypertension) is associated with PM2.5 exposure in young adults. Environ. Sci. Pollut. Res. Int. 2022, 29, 40701–40710. [Google Scholar] [CrossRef] [PubMed]
- Zhang, Q.; Zheng, Y.; Tong, D.; Shao, M.; Wang, S.; Zhang, Y.; Xu, X.; Wang, J.; He, H.; Liu, W.; et al. Drivers of improved PM2.5 air quality in China from 2013 to 2017. Proc. Natl. Acad. Sci. USA 2019, 116, 24463–24469. [Google Scholar] [CrossRef] [PubMed]
- Hajiloo, F.; Hamzeh, S.; Gheysari, M. Impact assessment of meteorological and environmental parameters on PM2.5 concentrations using remote sensing data and GWR analysis (case study of Tehran). Environ. Sci. Pollut. Res. Int. 2019, 26, 24331–24345. [Google Scholar] [CrossRef] [PubMed]
- Shen, Y.; Zhang, L.; Fang, X.; Ji, H.; Li, X.; Zhao, Z. Spatiotemporal patterns of recent PM2.5 concentrations over typical urban agglomerations in China. Sci. Total Environ. 2019, 655, 13–26. [Google Scholar] [CrossRef]
- Shen, Y.; Yao, L. PM2.5, Population Exposure and Economic Effects in Urban Agglomerations of China Using Ground-Based Monitoring Data. Int. J. Environ. Res. Public Health 2017, 14, 716. [Google Scholar] [CrossRef]
- Wang, S.; Sun, P.; Sun, F.; Jiang, S.; Zhang, Z.; Wei, G. The Direct and Spillover Effect of Multi-Dimensional Urbanization on PM2.5 Concentrations: A Case Study from the Chengdu-Chongqing Urban Agglomeration in China. Int. J. Environ. Res. Public Health 2021, 18, 10609. [Google Scholar] [CrossRef]
- Ouyang, X.; Wei, X.; Li, Y.; Wang, X.C.; Klemes, J.J. Impacts of urban land morphology on PM2.5 concentration in the urban agglomerations of China. J. Environ. Manag. 2021, 283, 112000–112010. [Google Scholar] [CrossRef]
- Zhang, K.; Liu, T.; Feng, R.; Zhang, Z.; Liu, K. Coupling Coordination Relationship and Driving Mechanism between Urbanization and Ecosystem Service Value in Large Regions: A Case Study of Urban Agglomeration in Yellow River Basin, China. Int. J. Environ. Res. Public Health 2021, 18, 7836. [Google Scholar] [CrossRef]
- Shi, K.; Li, Y.; Chen, Y.; Li, L.; Huang, C. How does the urban form-PM2.5 concentration relationship change seasonally in Chinese cities? A comparative analysis between national and urban agglomeration scales. J. Clean. Prod. 2019, 239, 118088–118100. [Google Scholar] [CrossRef]
- Guo, H.; Cheng, T.; Gu, X.; Wang, Y.; Chen, H.; Bao, F.; Shi, S.; Xu, B.; Wang, W.; Zuo, X.; et al. Assessment of PM2.5 concentrations and exposure throughout China using ground observations. Sci. Total Environ. 2017, 601–602, 1024–1030. [Google Scholar] [CrossRef] [PubMed]
- Deng, C.; Tian, S.; Li, Z.; Li, K. Spatiotemporal characteristics of PM2.5 and ozone concentrations in Chinese urban clusters. Chemosphere 2022, 295, 133813–133821. [Google Scholar] [CrossRef] [PubMed]
- Peng, J.; Chen, S.; Lü, H.; Liu, Y.; Wu, J. Spatiotemporal patterns of remotely sensed PM2.5 concentration in China from 1999 to 2011. Remote Sens. Environ. 2016, 174, 109–121. [Google Scholar] [CrossRef]
- Mi, K.; Zhuang, R.; Zhang, Z.; Gao, J.; Pei, Q. Spatiotemporal characteristics of PM2.5 and its associated gas pollutants, a case in China. Sustain. Cities Soc. 2019, 45, 287–295. [Google Scholar] [CrossRef]
- Sharma, S.K.; Mandal, T.K.; Banoo, R.; Rai, A.; Rani, M. Long-term variation in carbonaceous components of PM2.5 from 2012-2021 in Delhi. Bull. Environ. Contam. Toxicol. 2022, 109, 502–510. [Google Scholar] [CrossRef]
- Wang, J.; Lu, X.; Yan, Y.; Zhou, L.; Ma, W. Spatiotemporal characteristics of PM2.5 concentration in the Yangtze River Delta urban agglomeration, China on the application of big data and wavelet analysis. Sci. Total Environ. 2020, 724, 138134–138147. [Google Scholar] [CrossRef]
- Lu, D.; Xu, J.; Yang, D.; Zhao, J. Spatio-temporal variation and influence factors of PM2.5 concentrations in China from 1998 to 2014. Atmos. Pollut. Res. 2017, 8, 1151–1159. [Google Scholar] [CrossRef]
- Yan, J.W.; Tao, F.; Zhang, S.Q.; Lin, S.; Zhou, T. Spatiotemporal Distribution Characteristics and Driving Forces of PM2.5 in Three Urban Agglomerations of the Yangtze River Economic Belt. Int. J. Environ. Res. Public Health 2021, 18, 2222. [Google Scholar] [CrossRef]
- Chetna; Dhaka, S.K.; Longiany, G.; Panwar, V.; Kumar, V.; Malik, S.; Rao, A.S.; Singh, N.; Dimri, A.P.; Matsumi, Y.; et al. Trends and Variability of PM2.5 at Different Time Scales over Delhi: Long-term Analysis 2007–2021. Aerosol Air Qual. Res. 2022, 22, 330191. [Google Scholar] [CrossRef]
- Huang, C.; Liu, K.; Zhou, L. Spatio-temporal trends and influencing factors of PM2.5 concentrations in urban agglomerations in China between 2000 and 2016. Environ. Sci. Pollut. Res. Int. 2021, 28, 10988–11000. [Google Scholar] [CrossRef] [PubMed]
- Lin, Y.; Yuan, X.; Zhai, T.; Wang, J. Effects of land-use patterns on PM2.5 in China’s developed coastal region: Exploration and solutions. Sci. Total Environ. 2020, 703, 135602–135612. [Google Scholar] [CrossRef] [PubMed]
- Yang, J.; Huang, X. The 30 m annual land cover dataset and its dynamics in China from 1990 to 2019. Earth Syst. Sci. Data 2021, 13, 3907–3925. [Google Scholar] [CrossRef]
- Wei, J.; Li, Z.; Cribb, M.; Huang, W.; Xue, W.; Sun, L.; Guo, J.; Peng, Y.; Li, J.; Lyapustin, A.; et al. Improved 1 km resolution PM2.5 estimates across China using enhanced space–time extremely randomized trees. Atmos. Chem. Phys. 2020, 20, 3273–3289. [Google Scholar] [CrossRef]
- Wei, J.; Li, Z.; Lyapustin, A.; Sun, L.; Peng, Y.; Xue, W.; Su, T.; Cribb, M. Reconstructing 1-km-resolution high-quality PM2.5 data records from 2000 to 2018 in China: Spatiotemporal variations and policy implications. Remote Sens. Environ. 2021, 252, 112136–112153. [Google Scholar] [CrossRef]
- Zhao, A.; Yu, Q.; Wang, D.; Zhang, A. Spatiotemporal dynamics of ecosystem water use efficiency over the Chinese Loess Plateau base on long-time satellite data. Environ. Sci. Pollut. Res. Int. 2022, 29, 2298–2310. [Google Scholar] [CrossRef]
- Zhao, A.; Yu, Q.; Cheng, D.; Zhang, A. Spatial heterogeneity of changes in cropland ecosystem water use efficiency and responses to drought in China. Environ. Sci. Pollut. Res. Int. 2022, 29, 14806–14818. [Google Scholar] [CrossRef]
- Feng, S.; Gao, D.; Liao, F.; Zhou, F.; Wang, X. The health effects of ambient PM2.5 and potential mechanisms. Ecotoxicol. Environ. Saf. 2016, 128, 67–74. [Google Scholar] [CrossRef] [PubMed]
- Fontes, T.; Li, P.; Barros, N.; Zhao, P. Trends of PM2.5 concentrations in China: A long term approach. J. Environ. Manag. 2017, 196, 719–732. [Google Scholar] [CrossRef]


Publisher’s Note: MDPI stays neutral with regard to jurisdictional claims in published maps and institutional affiliations. |
© 2022 by the authors. Licensee MDPI, Basel, Switzerland. This article is an open access article distributed under the terms and conditions of the Creative Commons Attribution (CC BY) license (https://creativecommons.org/licenses/by/4.0/).