Abstract
This study focuses on simulating the impacts of wind farm wake due to changes in the Mellor-Yamanda-Nakanishi-Niino (MYNN) planetary boundary layer (PBL) scheme in a high-resolution mesoscale Weather Research and Forecasting (WRF) model for a non-flat region in Turkey. This is the first study with a comprehensive evaluation of simulated wind farm wake impact responses to changes in the MYNN PBL scheme in the WRF model. Our results show that the WRF-WFP solutions for the wind farm wake impact significantly change with a change in the MYNN PBL scheme. In addition, the incorrect TKE advection and the correction factor of 0.25 for the TKE coefficient in wind farm parametrization (WFP) cause incorrect wind farm wake impacts especially on TKE and air temperature. Our study also shows that modifications in the mixing length create greater changes in simulated wind farm wake impacts than activation of the mass-flux scheme. In this study, the relative contributions of WFP’s components are also evaluated.
1. Introduction
Wind farms exhibit continued growth in terms of size and installed capacity. A wind turbine disturbs the downstream wind flow by reducing wind speed and enhancing turbulence. This is called wind turbine wake. A wind farm can consist of tens or thousands of wind turbines, depending on its size. The aggregation of individual wind turbine wakes in a wind farm has potential impacts on the atmosphere and needs to be investigated. Mesoscale weather and global climate models are mostly used to reveal the potential impacts of wind farm wake. The first contributions came from Keith et al. [1] and Baidya Roy et al. [2]. These parametrized wind farm models have coarse horizontal resolutions and therefore cannot resolve the flow around wind turbines. Keith et al. (2004) and other studies [3,4,5,6,7] parameterized wind farms as increasing surface roughness to represent the wind speed reduction within wind farm wakes. This approach, however, does not correctly represent the wind farm wake impact. On the other hand, the parameterization approach by Baidya Roy et al. [2] uses the thrust and power curves of wind turbines to quantify turbulence enhancement and changes in the horizontal wind speed components by parametrizing wind turbines as an elevated sink of momentum and a source of turbulent kinetic energy (TKE). Furthermore, the most recent studies [8,9,10,11,12] depart from this parametrization approach and propose different calculation methods for the power and TKE generations of a wind farm.
The wind farm parametrization (WFP) by Fitch et al. [12] is publicly available in the widely used mesoscale model of Weather Research and Forecasting (WRF) and has been used in many studies showing the local [13,14,15,16,17,18,19] to regional [18,19,20,21,22,23] impacts of wind farms. These studies, however, used different WRF model configurations, and show conflicting results. This problem has attracted more attention to the changes in WRF-WFP solutions for the simulated wind farm wake based on the choice of model configuration. Recent studies [24,25,26,27] have shown that a fine horizontal resolution of 1 km to 5 km and a fine vertical resolution of 10 m to 12 m are recommended to provide a better representation of wind farm wake. Sun et al. [23] showed the respective contributions of the momentum sink and TKE source components of WRF-WFP on the climatic impacts of wind farms. In addition, Xia et al. [28] provided the underlying physical mechanisms of these components. Tomaszewski and Lundquist [25] and Siedersleben et al. [26] also showed the importance of the necessity of WFP’s TKE source component. In addition to all these, Witha et al. [29] and Hahmann et al. [30] revealed that the predictions in wind speed simulations become different when the mixing length in the MYNN PBL scheme is changed. This change in mixing length can also influence the wind farm wake impact by affecting wind speed prediction. Tomaszewski and Lundquist [25] discuss this indirectly by comparing versions 3.8.1 (Boulder, USA) and 4.0 (Boulder, USA) of the WRF model and find subtle differences. Siedersleben et al. [26] found too low of TKE predictions of wind farms when TKE advection is enabled. In contrast, several studies [11,13,16] found too high of added TKE from WFP without TKE advection. Abkar and Porte-Agel [9] revealed similar results when the added TKE obtained from WFP was compared with LES. These issues about WRF-WFP are related to the excessive value of the coefficient of TKE (CTKE) in WFP and a code bug related to TKE advection in the WRF model and were first revealed and corrected by Archer et al. [31].
Wind turbines operate in and interact with the atmospheric boundary layer. The WFP by Fitch et al. [12] in the WRF model only works with the MYNN PBL scheme. Except for Archer et al. [31], no study has focused directly on the interaction between Fitch’s WFP scheme [12] and the MYNN PBL scheme. This study aims to fill the gap in the literature by investigating the changes in the WRF-WFP solutions for the wind farm wake impact simulations under changes in the MYNN PBL scheme. Therefore, this study gives new insight into the interaction between the WFP and MYNN PBL scheme by conducting a series of simulations, such as changing the mixing length (local mixing), activating the mass-flux scheme (non-local mixing) in the eddy-diffusivity (regular MYNN) scheme, and enabling the correct/incorrect TKE advection. Furthermore, we performed two additional simulations to show the relative contributions of WFP’s TKE and momentum tendency components to understand the behavior of the WFP’s components in the simulations with correct/incorrect TKE advection. In addition, in one of the simulations with correct TKE advection, the CTKE in the WFP is modified by the correction factor of 0.25 proposed by Archer et al. [31], and its impacts are evaluated in relation to the changes of the added TKE from the wind farm. The behavior of WFP’s components is also evaluated for this simulation. Our study is laid out as follows: Section 2 gives the details of observed wind data and the selected time period, WRF-WFP simulations including descriptions of model configurations, hypothetical wind farm design, MYNN scheme, and WFP. Section 3 provides and discusses the results and, finally, Section 4 summarizes the results.
2. Data and Method
2.1. Observed Wind Data and Selection of Time Period
This study was carried out on a selected site in Çanakkale province in the western part of Turkey. Observed wind data of this selected site are also used in the first stage sensitivity simulations of the New European Wind Atlas (NEWA) [29]. The wind measuring station is located over the mountainside at an elevation of 370 m. Data from the wind measuring station are used for the prediction ability of the WRF model without WFP. Wind speed measurements from cup anemometers are recorded at 31 m, 61 m, and 81 m above the ground level (a.g.l) with a sampling period of 10 min. Wind direction measurements were, however, recorded only at 78 m within the same sampling time period.
In this study, the time period was selected based on the relatively high wind speeds and the stable wind directions for the pronounced wind farm wake impact. For wind speed criteria, we decided to select a wind speed range from 8 ms−1 to 12 ms−1 and less than 1.5 ms−1 of standard deviation for the height of 81 m. For stable wind direction criteria, we decided on less than 10° of standard deviation and more than 90% of blow frequency from a wind direction sector at 45°. These criteria are applied only for the July 2015 summer season because observational studies [32,33,34] show that the wind farm wake impact is generally stronger in the summer season and July 2015 has a full-length record of wind speed/direction for this study. Therefore, we selected the days of 17–18 July 2015 based on the defined criteria. These days have wind frequencies, respectively, of 95.1% and 90.2% from the northeast sector. The mean and standard deviations of the wind speed and wind direction for each day are given in Table 1.

Table 1.
Mean and standard deviation values of wind speed (V) and wind directions (DIR).
2.2. Model Simulations
All simulations were performed with the Advanced Research WRF (ARW) version 3.8.1 (Boulder, CO, USA) [35]. The WRF model is a state-of-the-art mesoscale model that is maintained by National Center for Atmospheric Research (NCAR) and has been widely used for atmospheric research and operational forecasting. The WRF model solves the fully compressible, Eulerian, non-hydrostatic conservation equations formulated using a terrain-following hydrostatic-pressure vertical coordinate and discretized on an Arakawa staggered C-grid [35]. This study investigates changes in the simulated wind farm wake impacts under the changes in MYNN PBL scheme (and also modified CTKE in WFP) by changing the mixing length, activating the mass-flux scheme in the eddy-diffusivity (MYNN) scheme, and enabling TKE advection with/without the bug-free version. The proposed correction factor of 0.25 for CTKE is evaluated due to the still high added TKE values from the Fitch scheme [12]. Other model options remain the same across all simulations. Initial and boundary conditions were provided by ERA-5 data with a resolution of 0.3°. The WRF physics options remaining the same are the Rapid Radiative Transfer Model for General circulation model (RRTMG) scheme for longwave and shortwave radiations [36], single moment 5-class scheme [37] for microphysics, Kain–Fritsch scheme for cumulus physics [38], and Noah Land Surface Model for land surface physics [39]. In this study, the MYNN scheme [40] is used as the planetary boundary layer scheme because the WFP of Fitch et al. [12] interacts only with the MYNN scheme by increasing QKE as a TKE source and changing horizontal wind speed components as a momentum sink. A model time step of 30 s was also used.
This study uses four nested domains with horizontal resolutions of 27 km, 9 km, 3 km, and 1 km (Figure 1c). In this study, the hypothetical wind farm in Çanakkale province is located almost in the center of all domains. Due to the numerical gap between the mesoscale and LES, called terra incognita [41], we decided to use a horizontal resolution of 1 km for the innermost domain. In addition, all simulations use 81 vertical levels with a 12 m resolution below 400 m a.g.l. This is also used in Siedersleben et al. [26,42]. In this vertical structure, 10 and 3 vertical levels remain within and below the rotor area, respectively (Figure 2). In all simulations, the GMTED2010 elevation dataset (Figure 1a) and USGS land use dataset with resolutions of 30 s are used. Model configurations of the main simulations are given in Table 2.
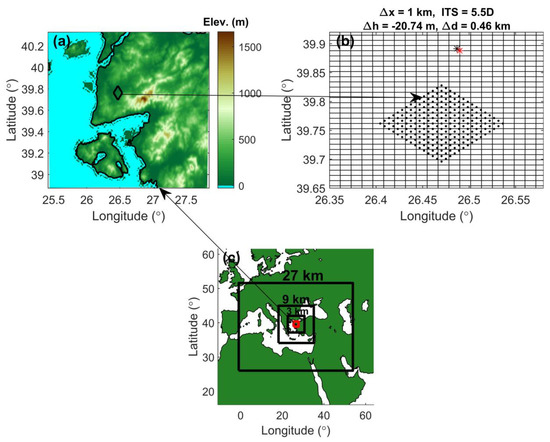
Figure 1.
Elevation map (a) and hypothetical wind farm layout with black dots (b). Of the nested domains, the innermost domain indicated in red has a horizontal resolution of 1 km and shows the location of the elevation map (c). Δx, ITS, Δh, and Δd in the wind farm layout plot (b) represent the horizontal resolution, inter-turbine spacing, elevation difference, and distance between the measurement location (black asterisk) and the location of the closest cell-centered model grid point (red asterisk), respectively.
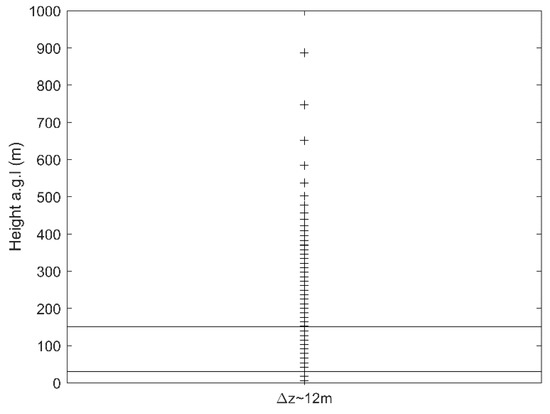
Figure 2.
Heights of the vertical levels for the different vertical resolutions. The top and bottom heights of the rotor area of the Siemens SWT-3.6-120 onshore wind turbine model are shown as horizontal lines.

Table 2.
Descriptions of the main simulations. The red font color indicates the additional simulations not involved in the evaluations but providing contributions to the WFP’s components to wind farm wake impacts. The second column is the choice of MYNN scheme, regular MYNN scheme, or EDMF scheme. In the column of TKE advection (TKE adv.), parentheses for enabled TKE advection represent bugged (B) and bug-free (BF) versions. In the next column, CF represents the correction factor for CTKE. In the next two columns, it is shown whether WFP’s TKE and momentum tendency components are disabled.
There are seven main simulations based on changes in the MYNN PBL scheme and two additional simulations (Table 2). The BASE simulation uses the default MYNN scheme properties in WRF version 3.8.1 (Boulder, CO, USA). This simulation uses a regular MYNN scheme with the first modified version of mixing length and disabled TKE advection. Then, for main simulations, we change the mixing length, enable TKE advection with/without the bug-free, and use the eddy-diffusivity/mass-flux (EDMF) scheme by activating the mass-flux scheme in the regular MYNN (eddy-diffusivity) scheme. In addition, we modify CTKE in WFP by using the proposed correction factor. Lastly, two additional simulations are performed to analyze the contributions of the WFP’s momentum and TKE tendency components in the simulations with correct/incorrect TKE advection. In each of these additional simulations, one component of WFP is enabled, but the other is disabled. However, these simulations are not included in the evaluation of the main simulations. They just contribute additional explanations for the ADV-based simulations (incorrect/correct TKE advection).
Our simulation period is 36 h, and each simulation starts at 12 UTC on the previous day of the selected days mentioned in Section 2.1. The first 12 h are considered a model spin-up time and not included in impact analysis. The difference between simulations with and without the wind farm is evaluated to show the simulated wind farm wake impact. Wind speed, TKE, air temperature, and atmospheric boundary layer height are used as selected parameters for the evaluation.
However, before the wind farm simulations, the prediction skills of WRF without WFP in ambient wind speed and wind direction are validated by comparison with observed data. The root mean square error (RMSE) is the only preferred performance metric for this study. However, because the wind direction is a circular variable, the RMSE for wind direction is redefined by adding 360° to or extracting 360° from the difference if the difference between the simulated and observed wind direction data is less than −180° or greater than 180°, respectively. Therefore, the absolute deviation of the wind direction does not exceed 180° in modulus.
2.2.1. MYNN PBL Scheme
The main part of this study is investigating the changes in simulated wind farm wake impacts on selected atmospheric boundary layer variables under changes in the MYNN PBL scheme [40] because the WFP [12] available in the WRF model still only works with this PBL scheme. These changes include mixing length (local mixing) modifications, mass-flux scheme (nonlocal mixing) activation, and TKE advection with/without a bug-free version. Two mixing length modifications for the original MYNN mixing length formulation have been made to solve problems related to the components of the resultant mixing length scale, which are surface, turbulent, and buoyancy length scales. Details about the mixing length modifications are described in Olson et al. [43]. The original mixing length formulation or its modified versions are used by setting the physics namelist option bl_mynn_mixlength. The MYNN PBL scheme considers the local mixing of scalars and momentum but neglects nonlocal mixing in the convective (unstable) layer. A mass-flux scheme is used for non-local mixing. This scheme was added to the MYNN (eddy diffusivity) PBL scheme and made it the eddy-diffusivity mass-flux (EDMF) scheme. The details of the EDMF scheme are described by Olson et al. [43]. The EDMF scheme can be enabled by setting the physic namelist parameter bl_mynn_edmf to one for each domain. In the MYNN PBL scheme, the advection of TKE is neglected in the equation of the TKE budget, but it can be enabled in the WRF model by setting the physics namelist option bl_mynn_tkeadvect to true. A recent study by Archer et al. [31] found and corrected the TKE advection issue in the WRF model when WFP is used.
2.2.2. Wind Farm Parametrization
This study uses Fitch’s scheme [12] for wind farm wake simulations. This parametrization scheme extracts some fraction of kinetic energy from the mean flow at the vertical levels intersecting with the rotor area within wind farm grid cell(s), depending on the thrust coefficient of the wind turbine. Some fraction of this extracted kinetic energy is also converted into electrical energy, based on the power coefficient of the same wind turbine. The thrust and power coefficients are functions of wind speed. In this parametrization, electromechanical losses are ignored. Therefore, the rest of the extracted kinetic energy that is not converted into electrical energy is assumed to be converted into TKE. Its fraction is quantified by the difference between the thrust and power coefficients and is called the coefficient of TKE (CTKE).
This WFP [12] is composed of momentum and TKE tendency components. The extraction of kinetic energy within wind farm grid cell(s) means a loss of KE in that cell by an equal rate, and this situation is described by the momentum tendency
where i, j, and k are zonal, meridional, and vertical grid indices, |V|ijk is the horizontal wind component, Nt is the number of wind turbines in the horizontal grid cell, Aijk is the cross-sectional area of the rotor boundary based on model levels k and k+1 in the grid cell ij, and zk is the height at model level k. The power extracted by the turbine, which is converted into electrical energy, is given by
and the TKE tendency term, which is not converted into electricity, is given by
This parametrization neglects the wind direction within the wind farm grid cell(s). Therefore, wind turbines are assumed to be oriented perpendicular to the wind flow. It also neglects the wind farm layout, and therefore, wind turbines within the same grid cell are treated as front-row turbines and experience the same wind condition [11].
A code bug in the WRF model causes a miscalculation of QKE, twice the TKE, at wind farm cell(s) when bl_mynn_tkeadvect is set to true. This code bug in WRF was first revealed and corrected by Archer et al. [31]. This corrected version in the WRF model is released with WRF version 4.2.1 (Boulder, USA). In this study, because we use WRF version 3.8.1 (Boulder, USA), we followed the correction procedures proposed by Archer et al. [31] to fix the code bug in the TKE advection for two separate simulations. In addition, Archer et al. [31] proposed to take one-quarter of the original values of the TKE coefficients because of the still-high added TKE values from wind farms, even though the code bug is fixed. Therefore, we also modified the CTKE values by the proposed correction factor for the simulation with the correct TKE advection.
2.2.3. Hypothetical Wind Farm Design
A hypothetical wind farm is designed on an area that is 8 km southeast of the wind measuring station to avoid faster recovery of wind farm wake due to the highly complex terrain feature of the mountain. (Figure 1a). This wind farm covers an area of approximately 100 km2 which is characterized by intense agricultural activities. Manwell et al. [44] state that elevation differences for the flat terrain should not be greater than 60 m anywhere in an 11.5 m diameter circle around the wind turbine site. Therefore, the terrain, where the hypothetical wind farm is located, is non-flat terrain because the flat terrain condition in Manwell et al. [44] is violated. We designed a densely packed wind farm with a 15 × 15 layout aligned with the dominant wind direction, and inter-turbine spacing is defined as 5.5 D (rotor diameter) in both streamwise and spanwise directions (Figure 1b). This densely packed wind farm layout with wind conditions mentioned in Section 2.1 provides a more pronounced wake effect [45]. The inter-turbine spacing is also compatible with that of Wu and Porte-Agel [46]. In the study, the Siemens SWT3.6-120 onshore wind turbine model is selected, and Fitch’s scheme [12] uses its thrust and power coefficients. This onshore-type turbine model has an installed capacity of 3.6 MW, a rotor diameter of 120 m, and a hub height of 90 m. Therefore, the hypothetical wind farm designed for this study has an installed capacity of 810 MW. This is far beyond the largest installed capacity of winds farm in Turkey.
3. Results and Discussion
3.1. Performance of WRF without WFP for Main Simulations
We validated the WRF model without WFP in terms of prediction accuracy for ambient wind speed and direction with respect to observed data. In this evaluation, ADVBF, ADVBF-MCTKE, MOM, and TUR simulations are excluded because, in these simulations, changes in their model configurations are implemented for wind farm cases.
A comparison of the simulation results with the observations revealed that all have prediction skills for ambient wind speed with acceptable accuracy and ambient wind direction with considerable accuracy (Figure 3). However, they overestimate wind speed through the simulation period at all measurement heights. Figure 4a–e shows these biases only for 81 m. In addition, we found that all model configurations except ORGMYNN tend to increase the RMSE with increasing height (Figure 3). For instance, BASE has an RMSE of 2.47 ms−1, 2.69 ms−1, and 2.80 ms−1 for wind speeds at 31 m, 61 m, and 81 m, respectively. On the contrary, ORGMYNN has lower RMSE values for those levels. Both EDMF simulations reduce the RMSE in wind speed. Overestimation and the RMSE increasing with height have also been found in the simulations of coarser spatial resolution.
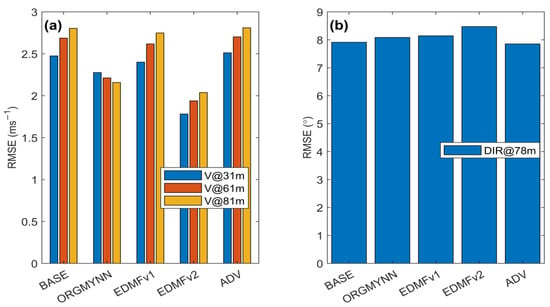
Figure 3.
RMSE results of comparisons of simulated and observed data for (a) wind speed and (b) wind direction.
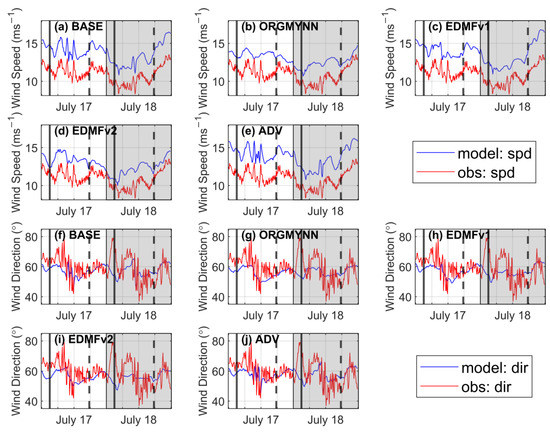
Figure 4.
Comparisons of simulated and observed wind speed (a–e) at 81 m and wind direction (f–j) at 78 m. The blue line represents a model simulation, while the red line represents an observation. The grey shaded area represents the simulation results of 18 July for wind speed. Solid vertical lines represent the sunrise of each day, while dashed vertical lines represent the sunset of each day.
As it is mentioned above, all model simulations show considerable wind direction prediction accuracies. Figure 4f–j illustrates a comparison of two day-long wind direction time series of predictions and observations for 78 m. In Figure 3b, BASE has an RMSE of 7.91°. In contrast to the RMSE results for wind speed, the RMSE values for wind direction are higher for ORGYMNN (8.09°) and EDMF (8.47° for EDMFv2 and 8.14° for EDMFv1) and lower for ADV (7.83°).
3.2. Impacts of WRF-WFP on TKE
Before the evaluations, we showed the difference between daytime and nighttime wind farm wake impact for the main simulations. We considered only hub-height wind speed and near-surface air temperature for this purpose. Results show that greater magnitudes (not shown) and larger areas of impact are observed at nighttime than in daytime (Figure 5). The results related to the relationship between the magnitude and area coverage of wake impacts are consistent with Tomaszewski and Lundquist [25]. For all the reasons above, this study decided to continue with nighttime results. However, Xia et al. [28] showed that wind farm wake impact on air temperature starts to strengthen after sunset and becomes strongest before sunrise. Therefore, because the local time (LT) is UTC+3 for the study region, the results of the last five UTC hours (19:00 to 00:00) for each daily simulation are averaged. However, only the first day’s averaged results are presented in this study.
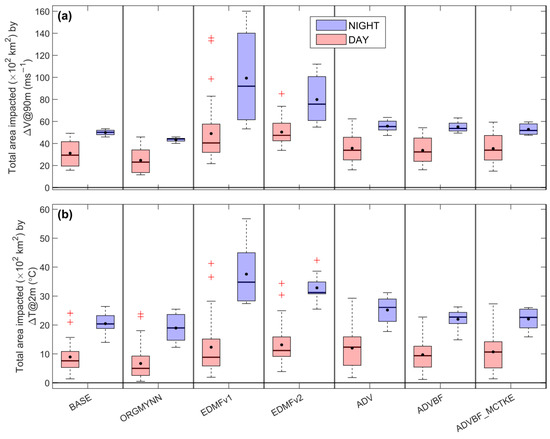
Figure 5.
The daytime and nighttime impact area (×102 km2) of (a) hub-height wind speed and (b) near-surface temperature differences under wind farm wake by considering the lower impact limits of |0.1| ms−1 and |0.05| °C. Box plots include the entire time period of the study.
The larger values of TKE enhancements (positive TKE difference) are generally seen within wind farms because the wind turbine-induced TKE generation process (positive TKE difference) occurs here (Figure 6). The maximum increase in TKE at hub height (90 m) is 3.24 m2s−2 for the BASE simulation. However, it is observed that the high positive hub-height TKE difference observed in the wind farm rapidly decreases downstream. In downstream regions, both negative and positive TKE differences are seen due to the change in the wind shear causing a change in shear production, which is one of the largest sources of TKE outside the rotor area as mentioned in Fitch et al. [12]. Therefore, too high of TKE levels are predicted at wind farm cells (Figure 6a–d) due to disabled TKE advection, causing the accumulation of added TKE from wind farms over time. The modified MYNN scheme creates changes in simulated wind farm wake impacts. Using the original MYNN scheme [40] in ORGMYNN causes larger positive TKE differences within the wind farm but weakens positive TKE differences and exhibits larger negative TKE differences outside the wind farm (Figure 6b). EDMFv1 causes slight changes in the impact area and magnitude of TKE differences (Figure 6c). On the other hand, EDMFv2 increases the magnitudes of TKE generation within a wind farm and produces an observable impact on the impact area of the TKE difference (Figure 6d). In ADV simulation (Figure 7e), due to the TKE advection issue, TKE at hub height within the wind farm is obviously wrongly predicted due to added TKE from the wind farm during the model’s last time step, causing too low of a TKE level as explained in Archer et al. [31].
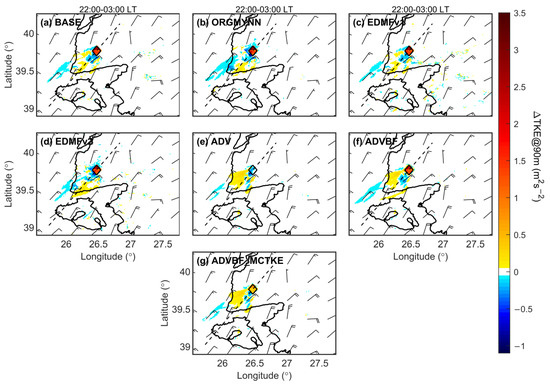
Figure 6.
The wind farm wake impact on hub-height TKE for the simulations of (a–g) BASE, ORGMYNN, EDMFv1, EDMFv2, ADV, ADVBF and ADVBF_MCTKE. Wind barbs from the WRF-WFP simulation are plotted in knots for every 27 km. The thick black line represents coastlines. A thin dashed black line crossing the wind farm represents a vertical cross-section line. The square box represents the wind farm area.
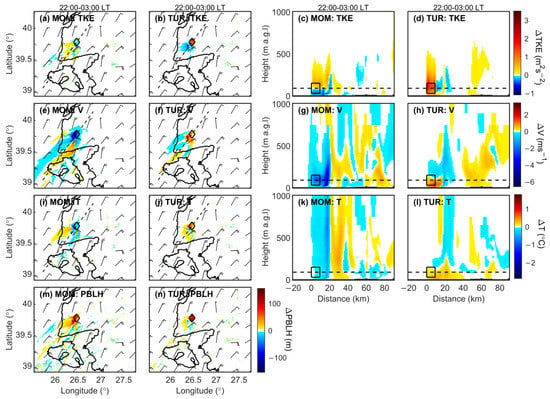
Figure 7.
Impacts of the WFP’s momentum tendency (MOM) and TKE tendency (TUR) components on boundary layer variables such as TKE, wind speed (V), air temperature (T), and PBLH from both horizontal cross-sections (a,b,e,f,i,j,m,n) in the left panel (a,b,e,f,i,j,m,n) and vertical cross-sections in right panel (c,d,g,h,k,l). These simulations use the model configuration of the BASE simulation. Wind barbs from the WRF-WFP simulation are plotted in knots for every 27 km; a thick black line represents coastlines; a thin dashed black line crossing the wind farm represents a vertical cross-section line; a square box in the left panel represents the wind farm area; the box in the right panel represents the rotor area of the wind farm; and the dashed horizontal line represents the hub height of the wind turbine.
As explained in Section 2.2, MOM and TUR simulations are performed to provide additional explanations for ADV-based simulations. Figure 7a–d shows that WFP’s momentum and TKE tendency components are responsible for negative and positive (explicitly added) TKE differences downstream of the wind farm, respectively. Therefore, in Figure 6e, the sign of the TKE difference within wind farms is wrong because the WFP’s momentum tendency component dominates WFP’s TKE tendency component. In addition, ADV causes a positive TKE difference pattern impacting a larger area downstream of the wind farm. In the ADVBF simulation with correct TKE advection (Figure 6f), TKE differences within the wind farms become positive but are still high. This simulation does not cause a significant change in the impact area and magnitude of the TKE difference. In the ADVBF_MCTKE simulation (Figure 6g), two corrections for TKE advection and CTKE reduce positive TKE differences within the wind farm. Additionally, outside the wind farm, a similar impact area and magnitude of TKE differences with ADV are observed (Figure 6e,g).
In a vertical cross-section, the BASE simulation exhibits positive TKE differences up to ~700 m over the wind farm area (Figure 8a) due to the accumulation of added TKE over time [31]. A similar vertical structure is seen in the simulation with disabled TKE advection (Figure 8b–d). In all simulations, regardless of the accurate prediction of TKE in the (non)wind farm case, the TKE difference reaches its maximum near the top of the rotor area because of the highest wind shear. Changing the MYNN scheme also causes notable changes in its vertical cross-section results. The TKE differences show noteworthy variations over the wind turbines and downwind in EDMFv2 in comparison to EDMFv1 (Figure 8c,d). EMDFv1 causes slight changes in the magnitude and vertical impact of the TKE difference. The EDMFv2 simulation strongly increases the magnitude of TKE differences up to 3.5 m2s−2 and the vertical impact reaches up to 1000 m. Similar results are seen in the ORGMYNN simulation (Figure 8b) in terms of observable changes in magnitude and shape, but in this simulation, the vertical impact of TKE differences probably exceeds 1000 m due to excessively large magnitudes of turbulent length scale in mixing length formulation [43] and magnitudes of TKE differences are therefore generally smaller. Thus, we can say that changing the mixing length has a more pronounced impact on the TKE results. TKE is improperly and properly advected in ADV and ADVBF_MCTKE simulations (Figure 8e,g), respectively, but is still wrongly predicted in wind farm cases due to CTKE issues [31]. In Figure 8e, the ADV simulation shows negative TKE differences from near the upper rotor tip to the surface over the wind farm. Similarly, the ADVBF_MCTKE simulation (Figure 8g) provides incorrect TKE differences from near the bottom half of the rotor area to the surface. However, in Figure 9f, the ADVBF simulation seems to produce a reasonable magnitude and vertical distribution of TKE differences over the wind farm grids.
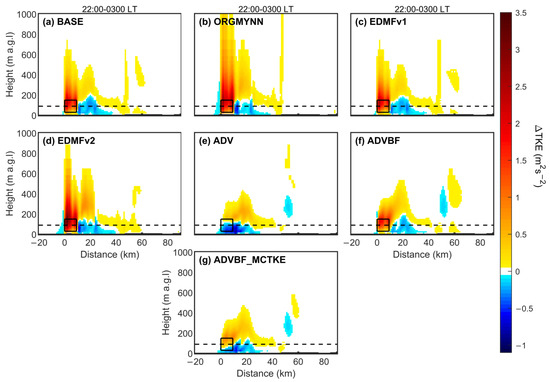
Figure 8.
Wind farm wake impact on TKE from a vertical cross-section for the simulations of (a–g) BASE, ORGMYNN, EDMFv1,EDMFv2, ADV, ADVBF and ADVBF_MCTKE. Box represents the rotor area of the wind farm. The dashed horizontal line represents the hub height of the wind turbine.
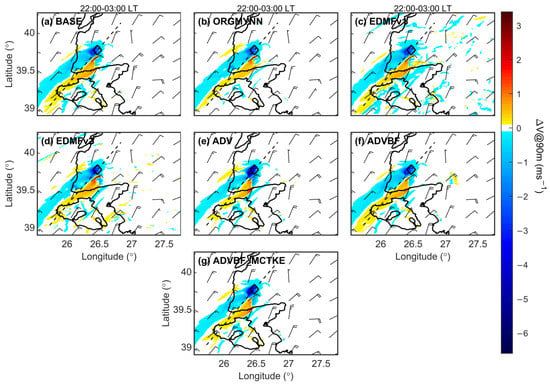
Figure 9.
Same as in Figure 6, but for hub-height wind speed.
3.3. Impacts of WRF-WFP on Wind Speed
The base simulation (BASE) exhibits a discernible wind farm wake impact on hub-height wind speed (Figure 9a). Wake-induced hub-height wind speed deficits reach 80+ km downwind of the wind farm with a maximum wind speed deficit of 3.2 ms−1. In addition, wind speed acceleration occurs on both sides of the wind farm. The maximum wind speed acceleration of 1.5 ms−1 reaches almost 80 km downwind on the southeastern side of the wind farm. The change in the MYNN PBL scheme clearly changes the WRF-WFP responses. ORGMYNN weakens both the wind speed deficit and wind acceleration and also produces a narrower wake flow (Figure 9b). The EDMF simulations in Figure 9c,d seem to cause wind speed variations in almost the entire domain. The EDMFv1 simulation causes quite different wind speed difference patterns impacting most of the domain, including regions far from the wind farm (Figure 9c). This wind speed difference pattern observed in the EDMFv1 simulation is probably due to the EDMF scheme because the first modified version of mixing length is not designed for the EDMF scheme, although the WRF model allows its use in the EDMF scheme. However, in the EDMFv2 simulation, distant region wind speed differences in EDMFv1 partly disappear because the well-tested second modified version of mixing length with the EDMF scheme probably reduces these scattered impacts at distant regions. ADV strengthens the wind speed deficit within and immediately downwind of the wind farm. A strong wind speed deficit of 6.51 ms−1 is seen in this simulation. The impacts penetrate far from the wind farm on the downwind side but their magnitudes become weaker at very short distances. In this simulation, a stronger wind speed deficit within and immediately downwind of the wind farm occurs due to the TKE advection issue. In the wind farm area and its vicinity, WFP’s momentum tendency component is responsible for the wind speed deficit, while WFP’s TKE tendency component is responsible for wind acceleration (Figure 7e–h). Furthermore, it is observed that WFP’s momentum tendency component provides a general pattern of wind speed difference (Figure 7e). Therefore, in the ADV simulation, as explained in Section 3.3, WFP’s momentum tendency component becomes dominant over WFP’s TKE tendency component. This issue causes less replenishment of the wind speed deficit over wind farms as mentioned in Archer et al. [31]. ADVBF shows that wind speed decreases within and immediately downwind of the wind farm are smaller than ADV, and the impact area becomes wider with respect to ADV. ADVBF_MCTKE (Figure 9f) has a visible impact on the magnitude and impact area of wind speed difference due to similar issues in ADV (Figure 7e,f and Figure 10e,f) This means that the CTKE correction factor of 0.25 proposed by Archer et al. [31] is not appropriate for use in this study because they found this correction factor through an idealized WRF simulation by ignoring non-neutral conditions, different wind conditions, and wind farm layouts.
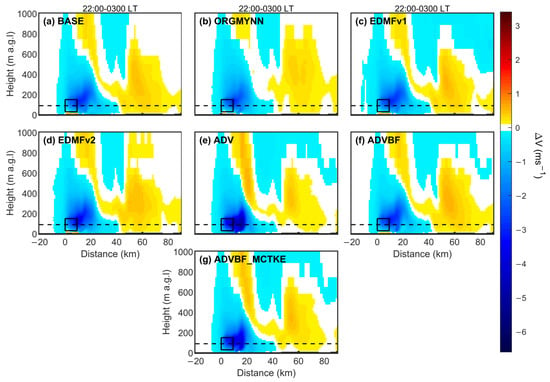
Figure 10.
Same as in Figure 8, but for wind speed.
Vertical cross-sections of the wind speed variations along the prevailing wind direction in all simulations are depicted in Figure 10. Wind speed deficits from the surface to the top height of the rotor area disappear after ~40 km downwind, and wind speed acceleration starts at this distance and extends downwind to the eastern border of the domain in all simulations. The distributions of negative and positive wind speed differences with height and downwind of the domain are generally in agreement with each other. There is a wind speed acceleration below the rotor area within the wind farm, due to the enhanced TKE-induced downward mixing of air with higher momentum at upper levels, except for the ADV and ADVBF_MCTKE simulations. The reason for the deceleration in ADV and ADVBF_MCTKE might be the incorrect estimation of the TKE difference from the bottom half of the rotor area to the surface over the wind farm (Figure 8e,g).
3.4. Impact of WRF-WFP on Air Temperature
One of the most important meteorological variables which a wind farm can impact is the air temperature. In the nighttime surface layer, the air temperature near the surface is lower than the air temperature above due to the radiative cooling of the surface in the absence of insolation. The only mechanism maintaining the nighttime TKE generation is wind shear, and therefore, the nighttime ambient TKE level remains quite low. Satellite observations [32,33,34,47] and in situ observations [48,49,50,51] show that wind farms increase the surface temperature during the nighttime or stable atmospheric conditions. Wind turbine wake induces a downward mixing of warmer air above and redistributes the heat within the atmosphere [21]. The warming effect of wind farm wake is small compared to the expected warming in the 21st century due to the greenhouse effect of fossil fuel-burning power plants. In addition, Chang et al. [32] indicate that the warming effects from wind farm wakes are less than urban heat island effects.
Collectively, our results appear consistent with the previous findings from Tomaszewski and Lundquist [25] and Xia et al. [28]. For instance, the BASE simulation shows nighttime warming signals near the surface within and outside of the wind farm, and nighttime cooling signals near the surface at the downwind side of the wind farm (Figure 11a). As mentioned by Xia et al. [28] cooling is a result of the momentum tendency in WFP which enhances near-surface thermal stratification. However, these nighttime cooling signals are not observed in satellite and in situ observations. Among all simulations, the maximum near-surface warming is found to be 1.1 °C in the wind farm area. The WRF-WFP solution for the wind farm wake impact on near-surface temperature significantly varies under changes in the MYNN scheme (and also modified CTKE). ORGYMNN has an impact on the shape and magnitude of near-surface air temperature differences (Figure 11b). While the near-surface warming within and outside the wind farm is reduced, the number of grid points with stronger cooling rates around the wind farm is increased. On the other hand, EDMFv1 in Figure 11c shows cooling or warming of the air temperatures in regions distant from the wind farm, probably due to the reason mentioned in Section 3.3. EDMFv2 still produces observable but weaker near-surface air temperature differences in distant regions (Figure 11d). In both EDMF simulations, the impact distance of the warming downwind of the wind farm becomes shorter. The ADV and ADVBF_MCTKE simulations create nighttime cooling signals over the wind farm grid cells (Figure 11e,f). These signals originate from the domination of WFP’s momentum tendency component over its TKE component (Figure 7i–l) due to incorrect TKE advection treatment and the inappropriate correction factor for CTKE. However, the magnitude of the incorrect cooling signals observed within the wind farm is lower in ADVBF_MCTKE than in ADV. In addition, the impact area of the nighttime cooling with larger magnitudes extends downwind of the wind farm. In the ADVBF simulation (Figure 11f), correct TKE advection produces warming signals with weaker magnitudes.
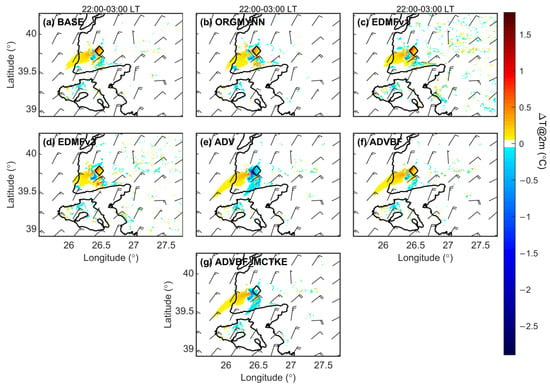
Figure 11.
Same as in Figure 6, but for near-surface air temperature.
The vertical cross-sections (not shown) reveal that the wind farms create very similar temperature anomalies overhead for all configurations. In general, most simulations exhibit warming indications from surface to hub height, except for ADV and ADVBF_MCTKE, and no air temperature difference from the hub height to the rotor’s top tip height, then temperature anomalies decrease up to 1000 m, with the peak value around 600–700 m. However, ADV and ADVBF_MCTKE simulations produced cooling indications from the surface to the rotor’s top tip height in the wind farm area.
3.5. Impact of WRF-WFP on Planetary Boundary Layer Height
Planetary Boundary Layer Height (PBLH) characterizes the vertical impact of a wind farm on atmospheric boundary layer (ABL) variables in response to turbine-enhanced vertical mixing over the wind farm. PBLH is computed through a weighted summation of PBLH diagnoses from theta-increase and TKE methods in the MYNN scheme [40,52]. Therefore, we focus on the variation of PBLH for all simulations.
All simulations exhibited increased PBLH within the wind farm (Figure 12). In addition, relatively high positive PBLH differences were generally seen on land and weak negative or positive differences over the sea. Wang et al. (2019) indicated that the nighttime increase in PBLH from wind farms can improve local air quality to some extent by contributing to the vertical diffusion of atmospheric pollutants in the boundary layer. In general, nighttime and daytime positive PBLH differences are found over the region downstream from the wind farm area to the coast. The largest contribution to positive PBLH variations comes from the TKE tendency component of WFP, although both components increase PBLH at wind farm cells (Figure 7m,n). Overall, our results indicate that wind farm impacts on PBLH are sensitive to changes in the model. For example, ORGMYNN slightly weakens the impact of a wind farm on PBLH due to the use of the original MYNN scheme (Figure 12b). EMDFv1 creates subtle differences in terms of magnitude and distribution of the differences when compared with BASE (Figure 12c). Similar to EDMFv1, EMDFv2 impacts the PBLH over regions distant from wind farms but with weaker and less scattered magnitudes (Figure 12d). ADV considerably smooths the positive and negative variations of PBLH (Figure 12e). However, correct TKE advection in ADVBF strengthens the relatively weak PBLH variations in ADV, produces lower PBLH within the wind farm, and lifts the PBLH downstream with respect to BASE (Figure 12f). ADVBF_MCTKE still produces elevated PBLH within the wind farm, as observed in all simulations, even with the inappropriate correction factor of CTKE.
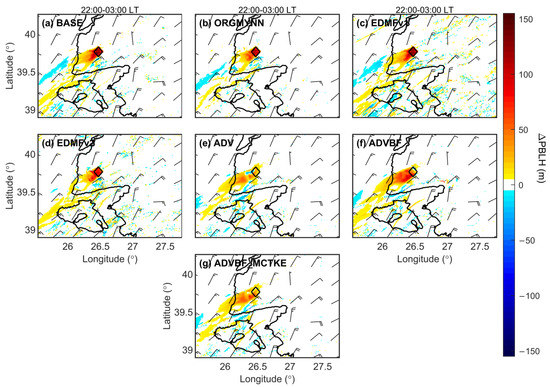
Figure 12.
Same as in Figure 6, but for PBLH.
4. Conclusions
In this study, the changes in simulated wind farm wake impacts are investigated by changing the MYNN PBL scheme (and also modifying CTKE) in WRF-WFP. Changes in the MYNN (eddy-diffusivity) scheme include mixing length modifications, correct/incorrect TKE advection, and activation of the mass-flux scheme. Additionally, two more simulations were performed in search of the possible relative contributions of WFP’s momentum and TKE tendency components for the simulations with correct/incorrect TKE advection.
The area selected to build the hypothetical wind farm in this study is located in Çanakkale province in western Turkey and has a non-flat terrain. We selected 17–18 July 2015 for the model simulations because the observed wind flow conditions, such as a low variability in wind direction, are able to increase the wind farm wake impact. We also designed a densely packed hypothetical wind farm with an aligned layout to further increase the wind farm wake impact. However, before the wind farm simulations, we evaluated the WRF’s prediction skills in ambient wind flow without using the WFP. It was found that the WRF model without the WFP exhibits prediction skills for ambient wind speed with acceptable accuracy and ambient wind direction with considerable accuracy. These results allowed us to perform the wind farm simulations. Thereafter, we evaluate the impacts of the wind farm wake by calculating the difference between simulation results with and without WFP.
For the evaluations of the simulated wind farm wake impacts under the changes in the MYNN PBL scheme, four atmospheric boundary layer variables were considered; these were wind speed, TKE, air temperature, and PBLH. However, we first evaluated the difference between the daytime and the nighttime wind farm wake impacts by only considering the hub-height wind speed and the near-surface air temperature. We found that greater magnitudes and larger areas of simulated wind farm wake impact were observed in the nighttime compared to the daytime. We, therefore, decided to present only the nighttime results of the simulations.
Our overall results showed that the wind farm wake reduces the wind speed and increases the turbulent kinetic energy, near-surface temperature, and boundary layer height. However, it was found that changes in the MYNN scheme and CTKE affect the results of simulated wind farm wake impacts.
Incorrect TKE advection produces false wind farm wake impacts by reversing the sign of the expected TKE difference and therefore, the air temperature difference, especially in the wind farm area. In this case, due to a code bug in the WRF model for the wind farm case, the TKE from the MYNN scheme is not updated by the WFP of Fitch et al. [12] until the model’s last time step. Therefore, the added TKE is underestimated but also cannot leave the wind farm cells as observed in the case of disabled TKE advection. In addition, WFP’s momentum and TKE tendency components, respectively, produce negative and positive TKE and air temperature differences in the wind farm area. Due to the reasons above, WFP’s momentum tendency becomes a dominant component in the simulation of incorrect TKE advection. In addition, the wind speed deficit is strengthened and the boundary layer height increase is weakened due to the dominance of the WFP’s momentum tendency component. Therefore, the expected near-surface wind speed acceleration is also not observed for this simulation. Enabling TKE advection with the proposed correction method by Archer et al. [31] produces the expected sign of impact with relatively lower magnitudes for TKE, and therefore air temperature, because the TKE from the wind farm is properly advected and can now leave the wind farm cells. Archer et al. [31] also proposed a correction factor of 0.25 for CTKE in WFP due to the still high added TKE difference impacts, even with the correct TKE advection. Unfortunately, the correction factor for CTKE was found to be inappropriate for this study because it reduces the relative contribution of WFP’s TKE tendency component, and therefore produces the wrong signs of TKE and air temperature difference in the wind farm area. However, for wind speed and boundary layer height, this simulation and simulations with the correct/incorrect TKE advection have similar depictions of magnitudes and shapes. We can say that a correction factor for CTKE higher than 0.25 is required based on this case study, but further research is needed in order to provide a better estimate of CTKE. In summary, this highlights the importance of using the TKE advection, interpreting its influence carefully on the simulation results, and providing a better estimate for CTKE. The bug in the WRF model in the TKE advection for the wind farm case should be corrected for all version 3.x.x after version 3.5 (Boulder, USA) of the WRF model, or its bug-free version should be used in version 4.1.2 (Boulder, USA) or later versions of the WRF model. We also recommend the use of the default CTKE until a better estimate is provided.
The EDMF scheme, the activated mass-flux scheme in the regular MYNN (eddy-diffusivity) scheme, along with the first modified mixing length causes unexpected impacts at regions far from the wind farm for all boundary layer variables because, according to Olson et al. [43], the first modification in mixing length is designed to work without the mass-flux scheme, although the WRF model allows its use with the mass-flux scheme. On the other hand, using a second modified version of mixing length with the EDMF scheme partly dampens these distant impacts. In addition, using the EDMF scheme with both modified versions of mixing length considerably changes the shape of the wind farm wake impacts on the boundary layer variables. Furthermore, it was found that the mixing length rather than the mass-flux scheme has a more pronounced influence on the results. The original MYNN scheme [40] generally changes the shapes of the impacts of the wind farm wake slightly and weakens the magnitudes of the impacts. However, its results on TKE are the opposite. It strengthens the magnitude of the TKE difference and visibly changes its shape in a horizontal cross-section. Furthermore, the highest vertical impact of the TKE difference is observed in this simulation. If the impact of the disabled TKE advection is ignored in this simulation, it is likely because the original MYNN scheme had excessively larger magnitudes of turbulent length scale and this scale integrated from the surface to model the top rather than the boundary layer height, therefore causing spurious large mixing [43]. This study does not exhibit a certain accurate result but still suggests using the default MYNN scheme (BASE: regular MYNN scheme with a first modified version of mixing length) or EDMF scheme with a second modified version of mixing length (EDMFv2) for the WRF version 3.8.1.
This study gives a new insight into the interaction between Fitch’s WFP scheme [12] and the MYNN PBL scheme by conducting a series of wind farm wake impact simulations in the WRF model because the Fitch’s WFP scheme [12] is designed to work only with the MYNN PBL scheme. However, the evaluations of WRF-WFP responses to the changes in the MYNN PBL scheme are conducted for a single non-flat location and time period. Further evaluations for a longer time period or different locations (e.g., offshore, coastal, or highly complex terrain) could be worthwhile as mentioned in Tomaszewski and Lundquist [25]. A more turbulent highly complex terrain or less turbulent offshore environment may change the WRF-WFP responses to the changes in the MYNN PBL scheme options, including enabled TKE advection, activation of the mass-flux scheme, and mixing length. In addition, a better estimate of CTKE in the WFP is needed because the proposed correction factor of 0.25 by Archer et al. [31] produces incorrect wind farm wake impacts, especially on the TKE and air temperature. In this way, the WFP and MYNN PBL schemes interact mutually with each other. Therefore, future research should focus more on this relationship.
Author Contributions
Conceptualization, T.K. and Ş.S.M.; methodology, T.K.; software, T.K.; writing—original draft preparation, T.K.; writing—review and editing, Ş.S.M.; writing—review and editing, Y.Ü.; visualization, T.K.; All authors have read and agreed to the published version of the manuscript.
Funding
This research received no external funding.
Institutional Review Board Statement
Not applicable.
Informed Consent Statement
Not applicable.
Data Availability Statement
This study uses the Advanced Research WRF-ARW model and the WRF Preprocessing System (WPS) version 3.8.1 (Boulder, USA) and wind farm parametrization (WFP) released in this model version. The WRF-ARW and WPS are publicly available at http://ww2.mmm.ucar.edu/wrf/users/ (accessed on 1 November 2021). Also, in some WRF WFP simulations, two corrections proposed by Archer et al. [31] for the Turbulent Kinetic Energy issues in WRF and WFP are implemented for version 3.8.1 of WRF-ARW. Correction codes for the WRF and WFP are publicly available at http://github.com/wrf-model/WRF/pull/1235/files (accessed on 1 November 2021). Initial and boundary condition data are provided by the ERA-5 reanalysis dataset with 0.3° from https://cds.climate.copernicus.eu/ (accessed on 1 November 2021). Land cover and elevation datasets at 30 s resolutions are used and provided from http://www2.mmm.ucar.edu/wrf/src/wps_files/ (accessed on 1 November 2021). Siemens SWT3.6-120 onshore turbine model’s thrust and power coefficients used in wind farm simulations are publicly available at http://www.wind-turbine-models.com/turbines/646-siemens-swt-3.6-120-onshore (accessed on 1 November 2021).
Acknowledgments
Simulations in this study are performed on the workstation with the four processors of Intel Xeon E5-4620 v2 2.6 GHz in the faculty of Aeronautics and Astronautics at Istanbul Technical University.
Conflicts of Interest
The authors declare no conflict of interest.
References
- Keith, D.W.; DeCarolis, J.F.; Denkenberger, D.C.; Lenschow, D.H.; Malyshev, S.L.; Pacala, S.; Rasch, P.J. The influence of large-scale wind power on global climate. Proc. Natl. Acad. Sci. USA 2004, 101, 16115–16120. [Google Scholar] [CrossRef] [PubMed]
- Baidya Roy, S.; Pacala, S.; Walko, R. Can large wind farms affect local meteorology? J. Geophys. Res. 2004, 109, D19101. [Google Scholar] [CrossRef]
- Ivanova, I.A.; Nadyozhina, E.D. Numerical simulation of wind farm influence on wind flow. Wind Eng. 2000, 24, 257–269. [Google Scholar] [CrossRef]
- Kirk-Davidoff, D.B.; Keith, D.W. On the climate impact of surface roughness anomalies. J. Atmos. Sci. 2008, 65, 2215–2234. [Google Scholar] [CrossRef]
- Barrie, D.B.; Kirk-Davidoff, D.B. Weather response to a large wind turbine array. Atmos. Chem. Phys. 2010, 10, 769–775. [Google Scholar] [CrossRef]
- Wang, C.; Prinn, R.G. Potential climatic impacts and reliability of very large-scale wind farms. Atmos. Chem. Phys. 2010, 10, 2053–2061. [Google Scholar] [CrossRef]
- Wang, C.; Prinn, R.G. Potential climatic impacts and reliability of large-scale offshore wind farms. Envrion. Res. Lett. 2011, 6, 025101. [Google Scholar] [CrossRef]
- Blahak, U.; Goretzki, B.; Meis, J. A simple parametrization of drag forces induced by large wind farms for numerical weather prediction models. In Proceedings of the European Wind Energy Conference and Exhibition 2010, PO ID 445, EWEC, Warsaw, Poland, 14–17 March 2011; pp. 186–189. [Google Scholar]
- Abkar, M.; Porte-Agel, F. A new wind-farm parametrization for large-scale atmospheric models. J. Renew. Sustain. Energy 2015, 7, 013121. [Google Scholar] [CrossRef]
- Volker, P.; Badger, J.; Hahmann, A.N. The explicit wake parametrisation v1.0: A wind farm parametrisation in the mesoscale model WRF. Geosci. Model Dev. 2015, 8, 3715–3731. [Google Scholar] [CrossRef]
- Pan, Y.; Archer, C.L. A hybrid wind-farm parametrization for mesoscale and climate models. Bound. Layer Meteor. 2018, 168, 469–495. [Google Scholar] [CrossRef]
- Fitch, A.C.; Olson, J.B.; Lundquist, J.K.; Dudhia, J.; Gupta, A.K.; Michalakes, J.; Barstad, I. Local and mesoscale impacts of wind farms as parametrized in a mesoscale NWP model. Mon. Wea. Rev. 2012, 140, 3017–3038. [Google Scholar] [CrossRef]
- Eriksson, O.; Lindvall, J.; Breton, S.P.; Ivanell, S. Wake downstream of the Lillgrund wind farm—A Comparison between LES using the actuator disc method and a Wind farm Parametrization in WRF. J. Phys. Conf. Ser. 2015, 625, 012028. [Google Scholar] [CrossRef]
- Jimenez, P.A.; Navarro, J.; Palomares, A.M.; Dudhia, J. Mesoscale modeling of offshore wind turbine wakes at the wind farm resolving scale: A composite-based analysis with the Weather Research and Forecasting model over Horns Rev: Mesoscale modeling at the wind farm resolving scale. Wind Energy 2015, 18, 559–566. [Google Scholar] [CrossRef]
- Miller, L.M.; Brunsell, N.A.; Mechem, D.B.; Gans, F.; Monagham, A.J.; Vautard, R.; Keith, D.W.; Kleidon, A. Two methods for estimating limits to large-scale wind power generation. Proc. Natl. Acad. Sci. USA 2015, 112, 11169–11174. [Google Scholar] [CrossRef]
- Wanderwende, B.J.; Kosovic, B.; Lundquist, J.K.; Mirocha, J.D. Simulating the effects of a wind-turbine arrays using LES and RAS: Simulating turbines using LES and RANS. J. Adv. Model Earth Sys. 2016, 8, 1376–1390. [Google Scholar] [CrossRef]
- Vanderwende, B.J.; Lundquist, J.K. Could crop height affect the wind resource at agriculturally productive wind farm sites? Bound. Layer Meteor. 2016, 158, 409–428. [Google Scholar] [CrossRef]
- Pryor, S.C.; Barthelmie, R.J.; Shepherd, T.J. The influence of real-world wind turbine deployments on local to mesocale climate. J. Geophys. Res. Atm. 2018, 123, 5804–5826. [Google Scholar] [CrossRef]
- Wang, Q.; Luo, K.; Wu, C.; Fan, J. Impact of substantial wind farms on local and regional atmospheric boundary layer: Case study of Zhangbei wind power base in China. Energy 2019, 18, 1136–1149. [Google Scholar] [CrossRef]
- Vautard, R.; Thais, F.; Tobin, I.; Breon, F.M.; de Lavergne, J.G.D.; Colette, A.; Yiou, P.; Ruti, P.M. Regional climate model simulations indicate limited climatic impacts by operational and planned Eurpoean wind farms. Nat. Commun. 2014, 5, 3196. [Google Scholar] [CrossRef]
- Miller, L.M.; Keith, D.W. Climatic impacts of wind power. Joule 2018, 2, 2618–2632. [Google Scholar] [CrossRef]
- Pryor, S.C.; Barthelmie, R.J.; Shepherd, T.J. 20% of US electricity from wind will have limited impacts on system efficiency and regional climate. Sci. Rep. 2020, 10, 541. [Google Scholar] [CrossRef] [PubMed]
- Sun, H.; Luo, Y.; Chang, R. The impacts of Chinese wind farms on climate. J. Geophys. Res. Atm. 2018, 123, 5177–5187. [Google Scholar] [CrossRef]
- Lee, J.C.Y.; Lundquist, J.K. Evaluation of the wind farm parametrization in Weather Research and Forecasting model (version 3.8.1) with meteorological and turbine power data. Geosci. Model Dev. 2017, 10, 4229–4244. [Google Scholar] [CrossRef]
- Tomaszewski, J.M.; Lundquist, J.K. Simulated wind farm wake sensitivity to configuration choices in the Weather Research and Forecasting model version 3.8.1. Geosci. Model Dev. 2020, 13, 2645–2662. [Google Scholar] [CrossRef]
- Siedersleben, S.K.; Platis, A.; Lundquist, J.K.; Djath, B.; Lampert, A.; Barfuss, K.; Canadillas, B.; Schulz-Stellenfleth, J.; Banges, J.; Neumann, T.; et al. Turbulent kinetic energy over large offshore wind farms observed and simulated by the mesoscale model WRF (3.8.1). Geosci. Model Dev. 2020, 13, 249–268. [Google Scholar] [CrossRef]
- Mangara, R.J.; Guo, Z.; Li, S. Performance of the wind farm parametrization scheme coupled with Weather Reseach and Forecasting model under multiple resolution regimes for simulating an onshore wind farm. Adv. Atmos Sci. 2019, 36, 119–132. [Google Scholar] [CrossRef]
- Xia, G.; Zhou, L.; Minder, J.R.; Fovell, R.G.; Jimenez, P.A. Simulating impacts of real-world wind farms on land surface temperature using the WRF model: Physical mechanism. Clim. Dynam. 2019, 53, 1723–1739. [Google Scholar] [CrossRef]
- Witha, B.; Hahmann, A.; Sile, T.; Dörenkämper, M.; Ezber, Y.; García-Bustamante, E.; González-Rouco, J.F.; Leroy, G.; Navarro, J. WRF model sensitivity studies and specifications for the NEWA mesoscale wind atlas production runs. Zenodo 2019. [Google Scholar] [CrossRef]
- Hahmann, A.N.; Sile, T.; Witha, B.; Davis, N.N.; Dörenkämper, M.; Ezber, Y.; García-Bustamate, E.; González Rouco, J.F.; Navarro, J.; Olsen, B.T.; et al. New European wind atlas, part 1: Model sensitivity. Geosci. Model Dev. 2020, 13, 5053–5078. [Google Scholar] [CrossRef]
- Archer, C.L.; Wu, S.; Ma, Y.; Jimenez, P.A. Two corrections for turbulent kinetic energy generated by wind farms in the WRF model. Mon. Weather Rev. 2020, 148, 4823–4835. [Google Scholar] [CrossRef]
- Chang, R.; Zhu, R.; Guo, P. A case study of land-surface-temperature impaact from large-scale deployment of wind farms in China from Guazhou. Remote Sens. 2016, 8, 790. [Google Scholar] [CrossRef]
- Zhou, L.; Tian, Y.; Baidya Roy, S.; Thorncroft, C.; Bosart, L.F.; Hu, Y. Impacts of wind farms on land surface temperature. Nat. Clim. Change 2012, 2, 539–543. [Google Scholar] [CrossRef]
- Zhou, L.; Tian, Y.; Baidya Roy, S. Diurnal and seasonal variations of wind farm impact on land surface temperature over western Texas. Clim. Dyn. 2013, 41, 307–326. [Google Scholar] [CrossRef]
- Skamarock, W.; Klemp, J.; Dudhia, J.; Gill, D.; Barker, D.; Duda, M.; Huang, X.; Wang, W.; Powers, J. A Description of the Advanced Research WRF Version 3; NCAR Technical Note; NCAR: Boulder, CO, USA, 2008. [Google Scholar]
- Iacono, M.J.; Delamere, J.S.; Mlawer, E.J.; Shephard, M.W.; Clough, S.A.; Collins, W.D. Radiative forcing by long-lived greenhouse gases: Calculations with the AER radiative transfer models. J. Geophys. Res. 2008, 113, D13103. [Google Scholar] [CrossRef]
- Hong, S.Y.; Dudhia, J.; Chen, S.H. A revised approach to ice microphysical processes for the bulk parametrization of clouds and precipitation. Mon. Wea. Rev. 2004, 132, 103–120. [Google Scholar] [CrossRef]
- Kain, J.S. The Kain-Fritsch convective parametrization: An update. J. Appl. Meteor. 2004, 43, 170–181. [Google Scholar] [CrossRef]
- Ek, M.B.; Mitchell, K.E.; Lin, Y.; Rogers, E.; Grunmann, P.; Koren, V.; Gayno, G.; Tarpley, J.D. Implementation of Noah land surface model advances in the National Centers for Environmental Prediction operational mesoscale Eta model. J. Geophys. Res. Atmos. 2003, 108, 2002jd003296. [Google Scholar] [CrossRef]
- Nakanishi, M.; Niino, H. Development of an improved turbulence closure model for the atmospheric boundary layer. J. Meteor. Soc. Jpn. 2009, 87, 895–912. [Google Scholar] [CrossRef]
- Wyngaard, J.C. Toward numerical modeling in the “Terra Incognita”. J. Atmos. Sci. 2004, 61, 1816–1826. [Google Scholar] [CrossRef]
- Siedersleben, S.K.; Lundquist, J.K.; Platis, A.; Bange, J.; Bärfuss, K.; Lampert, A.; Cañadillas, B.; Neumann, T.; Emeis, S. Micrometorological impacts of offshore wind farms as seen in observations and simulations. Environ. Res. Lett. 2018, 13, 124012. [Google Scholar] [CrossRef]
- Olson, J.B.; Kenyon, J.S.; Angevine, W.A.; Brown, J.M.; Mariusz, P.; Sušelj, K. A Description of the MYNN-EDMF Scheme and the Coupling to Other Components in WRF-ARW; NOAA Technical Memorandum OAR GSD-61; NOAA: Silver Spring, MD, USA, 2019. [CrossRef]
- Manwell, J.F.; McGowan, J.G.; Rogers, A.I. Wind Energy Explained: Theory, Design and Application; Wiley: Hoboken, NJ, USA, 2002. [Google Scholar]
- Gupta, T.; Baidya Roy, S. Recovery processes in a large offshore wind farm. Wind. Energ. Sci. 2021, 6, 1089–1106. [Google Scholar] [CrossRef]
- Wu, Y.T.; Porté-Agel, F. Large-Eddy Simulation of Wind-Turbine Wakes: Evaluation of Turbine Parametrisations. Bound. Layer Meteor. 2011, 138, 345–366. [Google Scholar] [CrossRef]
- Slawsky, L.M.; Zhou, L.; Baidya Roy, S.; Xia, G.; Vuille, M.; Harris, R.A. Observed thermal impacts of wind farms over northern Illionis. Sensors 2015, 15, 14981–15005. [Google Scholar] [CrossRef] [PubMed]
- Rajewski, D.A.; Takle, E.S.; Lundquist, J.K.; Oncley, S.; Prueger, J.H.; Horst, T.W.; Rhodes, M.E.; Pfeiffer, R.; Hatfield, J.L.; Spoth, K.K.; et al. Crop wind energy experiment (CWEX): Observations of surface-layer, boundary layer, and mesoscale interactions with a wind farm. Bull. Amer. Meteor. Soc. 2013, 94, 655–672. [Google Scholar] [CrossRef]
- Armstrong, A.; Burton, R.R.; Lee, S.E.; Mobbs, S.; Ostle, N.; Smith, V.; Waldron, S.; Whitaker, J. Ground-level climate at a peatland wind farm in Scotland is affected by wind turbine operation. Envrion. Res. Lett. 2016, 11, 044024. [Google Scholar] [CrossRef]
- Smith, M.C.; Barthelmie, R.J.; Pryor, S.C. In situ observations of the influence of a large onshore wind farm on near-surface temperature, turbulence intensity and wind speed profiles. Environ. Res. Lett. 2013, 8, 034006. [Google Scholar] [CrossRef]
- Xia, G.; Zhou, L.; Freedman, J.M.; Baidya Roy, S.; Harris, R.A.; Cervarich, C. A case study of effects of atmospheric boundary layer turbulence, wind speed, and stability on wind farm induced temperature changes using observations from a field campaign. Clim. Dyn. 2016, 46, 2179–2196. [Google Scholar] [CrossRef]
- Xie, B.; Hunt, J.C.; Carruthers, D.J.; Fung, J.C.H.; Barlow, J.F. Structure of the planetary boundary layer over southeast England: Modeling and measurements. J. Geophys. Res. Atmos. 2013, 118, 7799–7818. [Google Scholar] [CrossRef][Green Version]
Publisher’s Note: MDPI stays neutral with regard to jurisdictional claims in published maps and institutional affiliations. |
© 2022 by the authors. Licensee MDPI, Basel, Switzerland. This article is an open access article distributed under the terms and conditions of the Creative Commons Attribution (CC BY) license (https://creativecommons.org/licenses/by/4.0/).