Article

An Investigation of the Fengyun-4A/B GIIRS Performance on Temperature and Humidity Retrievals

1
Key Laboratory of Spectral Imaging Technology of Chinese Academy of Sciences, Xi’an Institute of Optics and Precision Mechanics, Chinese Academy of Sciences, Xi’an 710119, China
2
University of Chinese Academy of Sciences, Beijing 100049, China
3
Key Laboratory of Radiometric Calibration and Validation for Environmental Satellites, National Satellite Meteorological Center (National Center for Space Weather), Innovation Center for Feng Yun Meteorological Satellite (FYSIC), China Meteorological Administrations, Beijing 100049, China
*
Author to whom correspondence should be addressed.
Atmosphere 2022, 13(11), 1830; https://doi.org/10.3390/atmos13111830
Submission received: 30 September 2022 / Revised: 26 October 2022 / Accepted: 1 November 2022 / Published: 3 November 2022
(This article belongs to the Section Meteorology)

Abstract

:
The Fengyun-4A/B (FY-4A/B) geostationary satellite carries the Geostationary Interferometric Infrared Sounder (GIIRS). The instrument parameters of the GIIRS on FY-4A and FY-4B are not exactly the same, which is crucial for the atmospheric temperature and humidity measurements. The objective of this paper is to discuss the influence of spectral range on the retrieval for the FY-4A/B GIIRS. Firstly, we performed channel selection to choose the appropriate channels for retrieval. Then, the multiple cycling utilization of the physical retrieval method is proposed and conducted for improving the accuracy, and the retrieval results of FY-4A/B GIIRS are compared. Finally, perturbation analysis is performed to discuss the sensitivity of the retrieval to temperature perturbations due to the difference in spectral range between the two GIIRS. The results show the retrieval method can realize the improvement of the average accuracy by more than 0.9 K for temperature and 3.0% for humidity. As the spectral range widens, the retrieval accuracy of FY-4B GIIRS is superior to that of FY-4A GIIRS from 130 hPa to 400 hPa. Furthermore, perturbation analysis also shows the extension of the spectral range is beneficial to the retrieval. This study could offer the usefulness of current GIIRS instruments with observed on-orbit bias, and a reference for the parameter design of the subsequent instruments.

1. Introduction

The atmospheric temperature and humidity profiles are the important input data for numerical weather prediction (NWP) and the study of the global monitoring of climate change [1,2]. Accurate measurements of the atmospheric temperature and humidity profiles have become the fundamental prerequisite for improving the accuracy of NWP [3]. A meteorological satellite is an effective means to detect temperature and humidity profiles, which can provide plentiful atmospheric structural and spectral information. The use of satellite observation has greatly improved the performance of NWP [4,5]. Climate monitoring communities require that the accuracy should be less than 1 K for temperature and 10% for humidity in the troposphere [6,7]. It appears that the instrument parameters of the satellite-borne sounder need to be improved to meet these requirements. There are many instrument parameters affecting sounding, such as spectral resolution, spectral range, and spatial resolution [8]. Spectral resolution can influence the sounding of the atmospheric vertical structure and the retrieval [9]. In the case of a certain spectral resolution, the wider the spectral range, the more channels there will be. As a result, a large amount information about the atmosphere will be provided, which is beneficial to the retrieval [10].
Since the first meteorological satellite, TIROS-1, was launched successfully in 1960, satellite observation technology has entered a period of rapid development [11]. So far, more than 100 meteorological satellites have been launched into space [8]. To meet the requirement of weather forecasts, sounders continue to be built upon improvements. Along with the development of interference technology and grating technology, it realizes atmospheric detection with high spectral resolution for sounders [8]. High spectral resolution and wide spectral range make the number of channels increase from a dozen to thousands. Table 1 lists the main spaceborne hyperspectral infrared atmosphere vertical sounder. The Advanced Infrared Sounder (AIRS) is the first high spectral resolution infrared instrument with kilo-channel data on the NASA Aqua satellite which was launched in 2002 from America [12]. The spectral region of AIRS ranges from 650–2665 cm−1, which is divided into three bands (band 1 from 650 to 1135 cm−1, band 2 from 1215 to 1615 cm−1, and band 3 from 2180 to 2665 cm−1) with a spectral resolution of 0.5 cm−1, 1.2 cm−1 and 2 cm−1 [13,14,15]. Then, the United States installed the Cross-track Infrared Sounder (CrIS) on a polar-orbiting satellite which has 1305 channels covering three bands in the infrared region (650–1095 cm−1, 1210–1750 cm−1, 2155–2550 cm−1) with spectral resolution of 0.625 cm−1, 1.25 cm−1 and 2.5 cm−1 [16,17,18]. On the European side, the Infrared Atmospheric Sounding Interferometer (IASI) was taken to space by the first polar-orbiting satellite in 2006. IASI has a spectral range from 645 to 2760 cm−1 with a spectral sampling of 0.25 cm−1, which leads to 8461 channels [19,20]. IASI-New Generation (IASI-NG), the next generation of the IASI instrument, has the same spectral range as IASI and half of spectral resolution [21]. Furthermore, Europe proposes the Meteosat Third Generation satellites (MTG), which will carry the Infrared Sounder (IRS) which is an imaging Fourier transform spectrometer with two spectral bands (680–1210 cm−1 and 1600–2250 cm−1) and a spectral resolution of 0.6 cm−1 [22]. China, in 2016 and in 2017, also installed the GIIRS and HIRAS (Hyperspectral Infrared Atmospheric Sounder) on FY-4A and FY-3D satellite [23,24,25]. HIRAS has three spectral bands that are similar to CrIS’ [8]. GIIRS have two spectral bands (700–1130 cm−1and 1650–2250 cm−1) and a spectral resolution of 0.625 cm−1 [26]. FY-4B carried the improved GIIRS into space in 2021, which extends the spectral range in long-wave infrared. The operation of these sounders can obtain accurate information about the vertical structure of the atmosphere and the earth’s surface. The spectral ranges of these sounders mainly cover long-wave and medium-wave infrared, which can be used for temperature and humidity sounding. There are many studies about the retrievals of these sounders. Irion F. W. et al. [27] described a new retrieval scheme for AIRS, an optimal estimation retrieval system, to retrieve temperature profiles, humidity profiles and other atmospheric parameters. Andrey-Andres J. et al. [28] compared the impact of the benefit of IASI-NG to IASI on the retrieval of temperature and humidity. Coopmann O. et al. [22] proposed a general channel selection of IRS for retrievals and retrieved temperature, humidity and ozone. Nalli N. R. et al. [29] provided the validation of the temperature and humidity profiles retrieved from CrIS and ATMS (the Advanced Technology Microwave Sounder). Hu J. [30] evaluated the retrieval accuracy of temperature and humidity profiles in real time from HIRAS observation in the Arctic region with a new technique based on the Neural Network algorithm. Cai X. et al. [6] compared the temperature and humidity retrievals of FY-4A GIIRS with AIRS’s products using artificial neural networks. Di D. et al. [26] proposed an alternative channel selection method for FY-4A GIIRS and verified it by using the 1-D variational retrieval experiment. However, there is a lack of investigation into FY-4B GIIRS instrument improvement and its contribution to the temperature and humidity profile retrievals and applications. The instrument parameters of the FY-4B GIIRS have some improvements, such as spectral range and spatial resolution. It is necessary to evaluate the retrieval accuracy of FY-4B GIIRS and the impact of the improvement of spectral performance on retrievals.
In this paper, the present study aims at discussing the impact of the spectral range on temperature and humidity retrievals for the FY-4A/B GIIRS. Channel selection is performed to choose the appropriate channels that can participate in the retrieval. The multiple cycling utilization of the physical retrieval method is used to retrieve the temperature and humidity profiles for the FY-4A/B GIIRS, and the results of both are compared. In addition, perturbation analysis is conducted to discuss the sensitivity of the retrieval to temperature perturbations. This paper is organized as follows. Section 2 introduces the FY-4A/B GIIRS, radiative transfer model, dataset, observation error and the methods of channel selection and retrievals. Section 3 provides the results and discussion of channel selection and retrievals. Finally, Section 4 presents the conclusions.

2. Materials and Methods

2.1. Materials

2.1.1. The FY-4A/B GIIRS Data

FY-4 series are the new generation of geostationary meteorological satellites of China which are designed to meet the need of weather forecast and service requirement [23]. The main payload instruments onboard include GIIRS, the Advanced Geosynchronous Radiation Imager, Lighting Mapping Imager, and Space Environment Package. FY-4 series will introduce many products, such as atmospheric temperature and humidity profiles, space-time distribution of lightning, and layer precipitable water vapor [31]. FY-4A, the first satellite of the FY-4 series, is regarded as an experimental satellite, which has been launched on 14 December 2016. Starting from FY-4B which has been launched on 3 June 2021, the subsequent FY-4 series satellites will be used as operational ones.
GIIRS is a Michelson-type interferometer on board FY-4A and FY-4B detecting the three-dimensional atmospheric temperature and humidity. FY-4A GIIRS is the first space-borne interferometer that flies in geostationary orbit, which detects the radiance from the atmosphere and earth with 1650 channels. It has two spectral bands. One spectral band is between 700 cm−1 and 1130 cm−1 in long-wave infrared, while the other one is from 1650 cm−1 to 2250 cm−1 in medium-wave infrared. It has a spectral resolution of 0.625 cm−1 and a spatial resolution of 16 km. The FY-4B GIIRS has some significant performance improvements compared with FY-4A GIIRS. Its spectral range in long-wave infrared is extended from 680 cm−1 to 1130 cm−1, so the total number of channels is 1682. Furthermore, the spatial resolution is increased to 12 km and the temporal resolution is also improved. Table 2 lists some parameters of FY-4 GIIRS.

2.1.2. Radiative Transfer Model

The RTTOV v12 is used to calculate the Jacobians, transmittance and brightness temperature as the fast radiative transfer model. RTTOV can simulate hyper-spectral space-borne sensors, such as GIIRS, IASI, and AIRS. It allows users to input profiles with a defined set of pressure levels and several atmospheric components. Water vapor is the only mandatory gas, while O3, CO2, N2O, CO, CH4 and SO2 are the optional ones corresponding to different coefficient files.

2.1.3. Dataset

The IFS-137 dataset provided by the ECMWF dataset is adopted. It is made of 5000 profiles with a 137-level vertical grid range from the surface to 0.01 hPa, each of which contains atmospheric parameters, such as pressure, temperature, specific humidity and ozone mixing ratio. The dataset is divided into two groups. The first group, 80% of the dataset [32], is taken as training profiles that are used to select channels and calculate a priori profiles ( t b and q b ) and their error covariance matrixes. The second one, 20% of the profile dataset [32], is taken as test profiles that are used for retrieving temperature and humidity.

2.1.4. Observation Error

The sources of observation error include many aspects [8]. For simplicity, only the radiative transfer model noise and the instrument noise are taken into account. The observation error covariance matrix is the result of the combination of the radiative transfer model and the instrument error covariance matrix [33,34], which is assumed to be a diagonal matrix. The radiative transfer model noise is taken as an invariable value of 0.2 K [35]. The instrument noise is considered to be variable in brightness temperature space and invariable in radiance space [33]. The design values of the instrument noise of both GIIRS are the same. The observation error is shown in Figure 1.

2.2. Methods

The methods consist of two parts. One is the channel selection method which is used to select the appropriate channels for the retrieval, and the other one is the retrieval method which is used to calculate the temperature and humidity profiles.

2.2.1. Channel Selection Method

Different atmospheric components have particular spectral absorption characteristics, so not all channels are sensitive to specific atmospheric parameters. Studies have shown that the information on all the channels may not improve the quality of the product [36]. Hence, it is necessary to select a close-to-optimal set of channels to increase the final retrieval accuracy and efficiency [33]. This subsection discusses the channel selection method with three-step procedures.
In the first step, it needs to remove the channels which are sensitive to ‘foreign’ gas [37]. ‘Foreign’ gas [37] is the trace gas specie that is not the one best aiding specific atmospheric parameters retrievals. Normally the bands in absorption spectra of CO2 and H2O are used for retrieving temperature and humidity profiles, respectively. For the sake of the retrieval accuracy, those channels that are affected by ‘foreign’ gas and have a significant contribution to temperature or humidity should be removed [38].
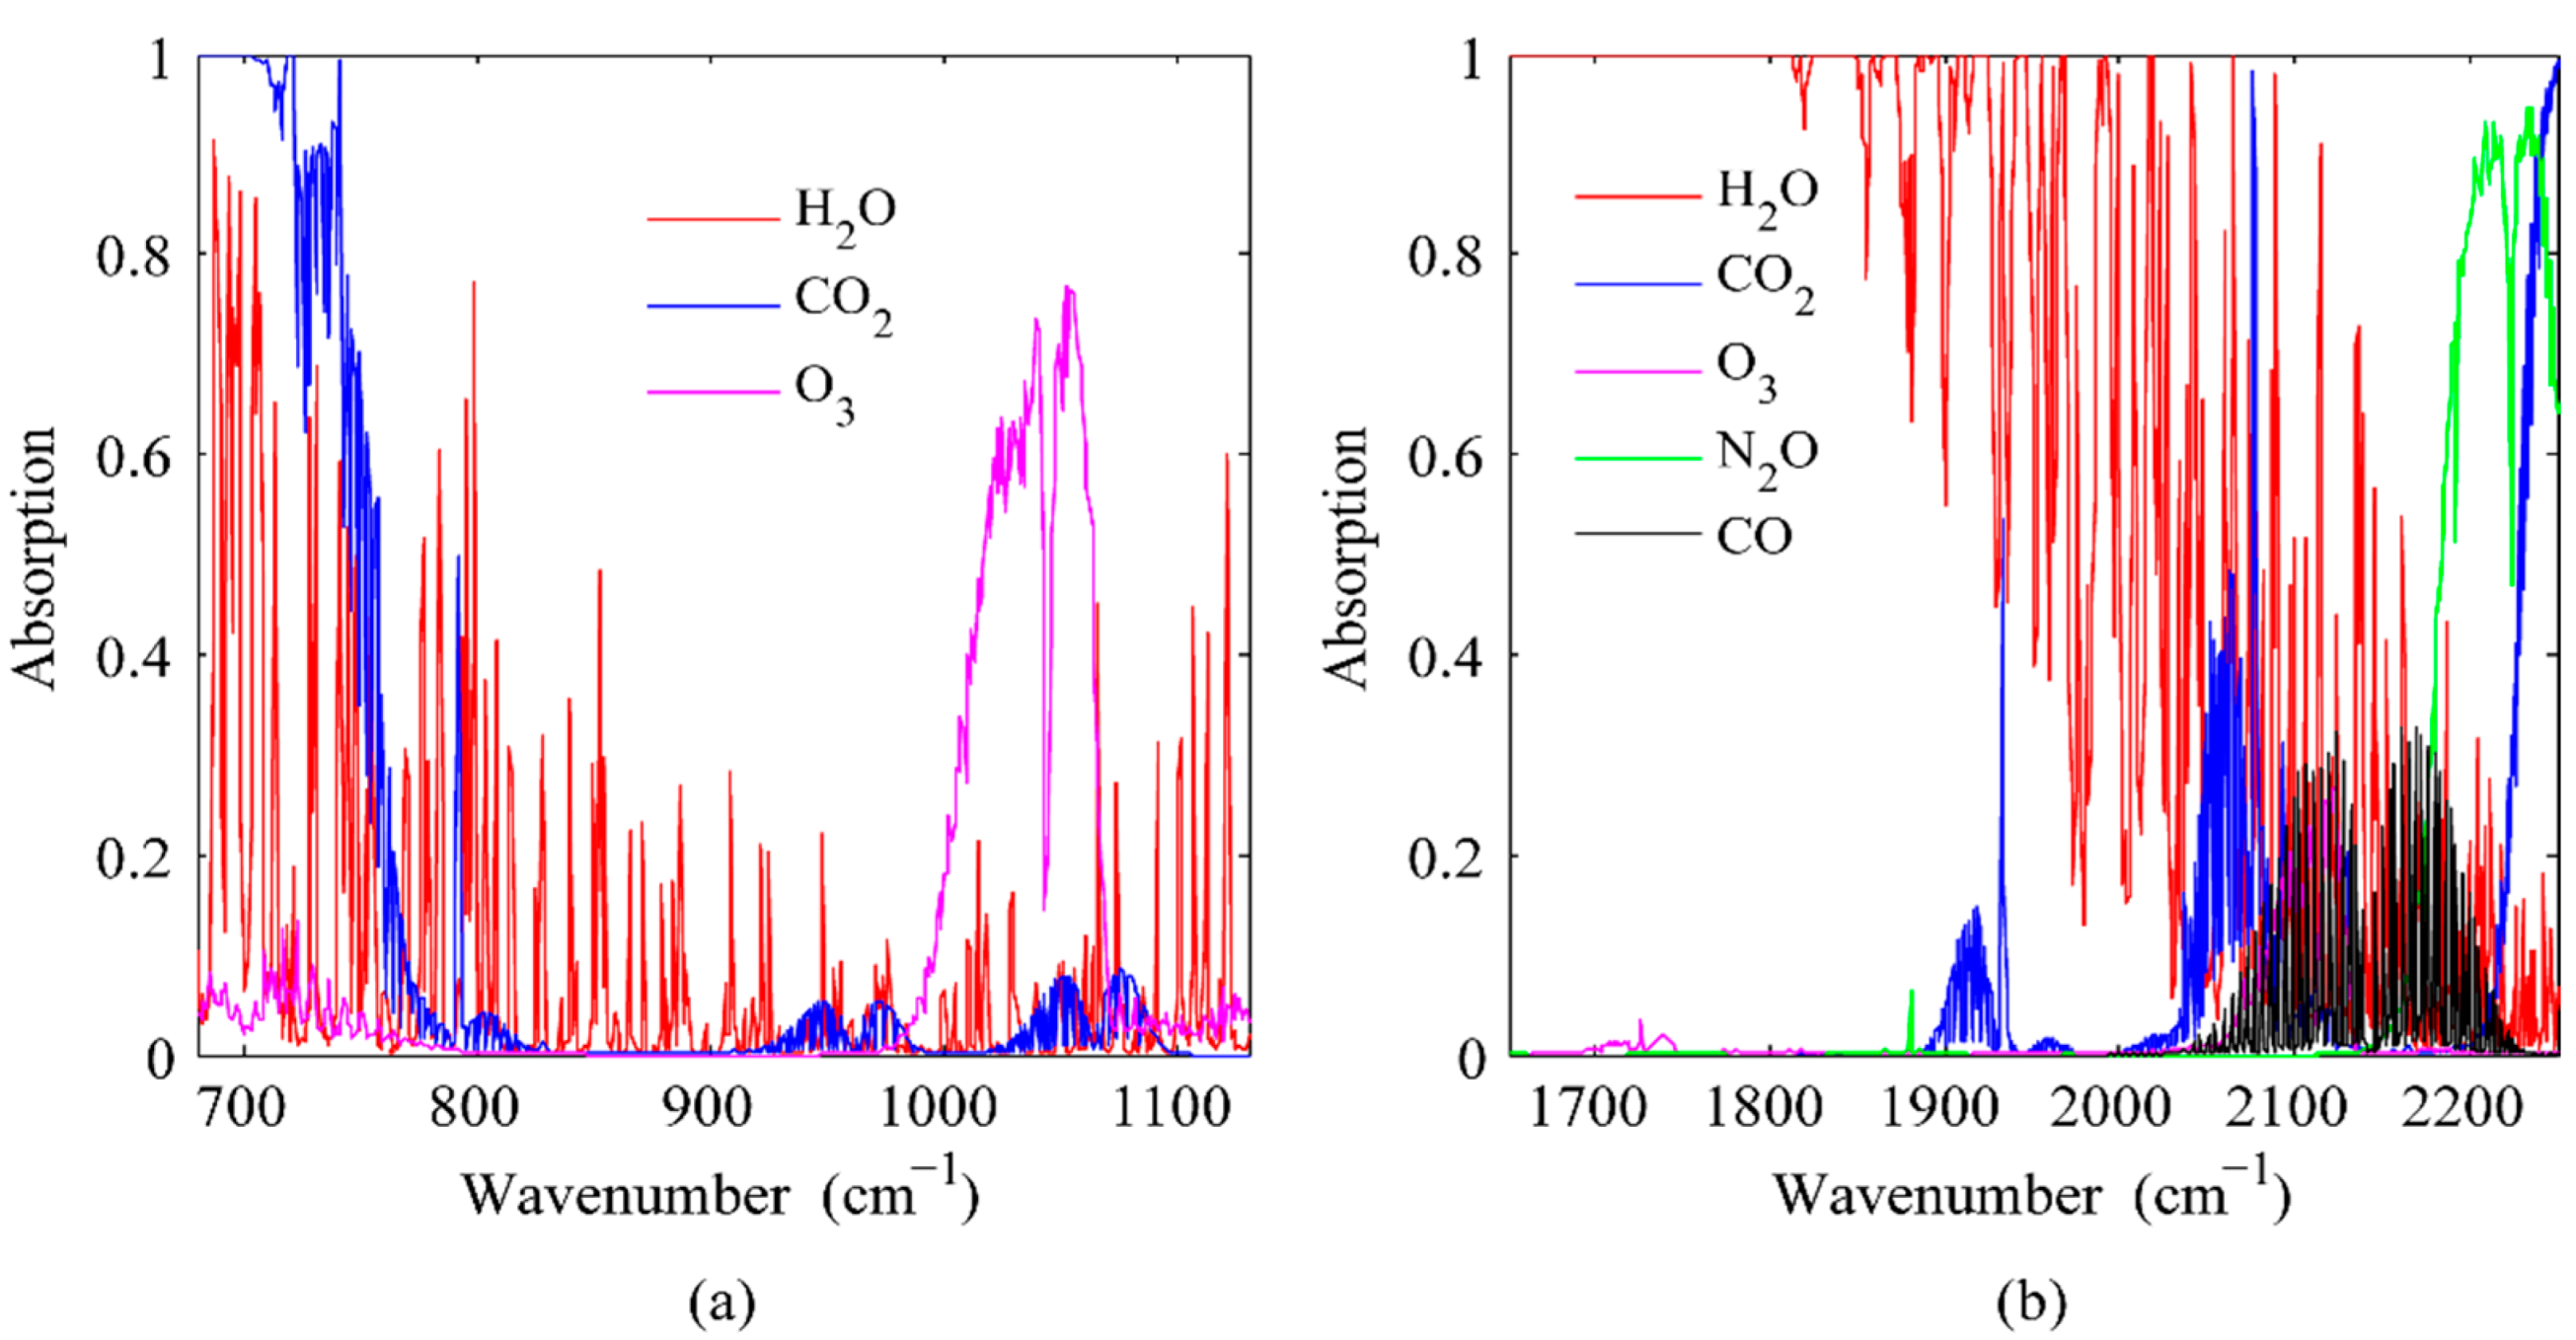
The channels for temperature sounding (temperature channels for short) are selected from the 15 μm CO2 band and the “atmospheric window” region in the longwave. Figure 2a shows that the major atmospheric absorbing molecules are CO2, H2O and O3 in the range of 680–1130 cm−1. The main disturbed region of the O3 band is in 1000–1070 cm−1 [39], but the one in the H2O band is widely distributed in the long wave infrared. Hence, the channels in the O3 band should be deleted, and the channels heavily affected by the H2O band should be excluded by using a threshold of average brightness temperature difference that can be obtained with the training profiles and the background profile.
The channels for humidity sounding (humidity channels for short) are selected from the H2O medium wave band and the long wave atmospheric window regions. In Figure 2a,b, channels dominated by CO2, O3, N2O, and CO maybe make no sense for humidity retrievals. Based on the absorption features of these ‘foreign’ gas, some channels should be eliminated in the spectral regions which include the following: 800–820 cm−1, 1000–1070 cm−1, and 2085–2250 cm−1. Not all the channels in these regions will be removed. Combined with the height and the weighting function, some channels weakly affected by ‘foreign’ gas can remain.
In the second step, channels are selected based on absorption band and transmittance weighting function. This procedure consists of two parts which are used to select the remaining channels of the first step. One part is to select channels by using the atmospheric absorption spectral band. Channels on the peaks and trough of the atmospheric absorption spectral band will be chosen. Some channels on the peaks can reflect the information about the atmospheric parameter of the stratosphere and the upper troposphere [8,40]. Channels on the trough have big peak values of transmittance weighting functions that can make a contribution to the retrieval. The other part is made by using the transmittance weighting function. The transmittance weighting function, which is defined as d τ / d ln p , where τ is the transmittance and p is the pressure [41] will be considered to deal with the rest channels that are not selected in the previous part. It is desirable to choose a channel with a sharp and big weighting function [40,42]. Channels with the same sensitive pressure level are put together and sorted according to the curve width and the peak value of the transmittance weighting function. Those channels with sharp curves and big peak values of transmittance weighting function will be selected at every pressure level. Aggregate the channels that are chosen by the two parts.
In the third step, all the alternative channels will be filtered again by the information content method as described by Rodgers [43]. We hope to extract a set of channels with the largest amount of information on temperature or humidity. Entropy reduction (ER) is adopted to evaluate the ability of the channel to provide information on the atmospheric parameter [44]. ER is based on information theory and can be viewed as the gain in information or the reduction in uncertainty by including a measurement. It can be expressed as the logarithmic form of the ratio of the background-error covariance to the retrieval-error covariance in the following formula [45]:
H = 1 2 log ( S a S 1 )
where H is the entropy reduction, S a R n × n (n parameters to be retrieved) is the background-error covariance matrix, and S R n × n is the retrieval-error covariance matrix calculated as follow:
S = [ S a 1 + K T S ε K ] 1
where S ε R m × m (m channels) is the observation-error covariance matrix, and K R m × m is the Jacobian matrix for channels.
A channel with the maximum of H will be selected for this iteration, while the retrieval-error covariance matrix will be updated to prepare for the calculation of the H for the next iteration. The chosen channel will be removed from the subsequent calculation of H, and the rest channels will be the candidate ones for the next calculation. This process will stop until the number of selected channels reaches a given value.

2.2.2. Retrieval Method

There are many methods to retrieve the temperature and humidity profiles, which can be summarized in two categories: statistical retrieval method and physical statistical retrieval method [11]. The statistical retrieval method retrieves atmospheric parameters by establishing regression equations between parameters and radiation. It is fast and easy but it cannot deal with non-linearity [30] and its retrieval accuracy is limited [8,30]. The physical retrieval method solves the problem from the physical essence of the atmospheric radiation transfer equation which has high accuracy [46]. Therefore, the physical retrieval method will be used in this paper. This method includes two steps. The first step is to establish the cost function, and the second one is to ascertain the optimal estimation method [47,48]. The maximum probability objective function [8] is taken as the cost function calculated as follows:
J ( X ) = [ Y m F ( X ) ] T S ε 1 [ Y m F ( X ) ] + [ X X b ] T S a 1 [ X X b ]
where Y m is the FY-4A/B observations, X is the atmospheric parameter, X b is the background profile, and F(X) is the brightness temperature simulated by the radiative transfer model.
As the retrieval problem is nonlinear, the optimal estimation method is formulated as Newton iteration form in the following formula [49]:
X n + 1 = X b + S a K n T ( S ε + K n S a K n T ) 1 [ Y m F ( X n ) + K n ( X X b ) ]
where K is the Jacobian matrix, and subscript n is the iteration index. In this study, we start with X 0 = X b . The Jacobian matrix and F ( X n ) are required to be recalculated for each iteration.
Convergence is determined by the cost function. When the cost function changes by no more than 1%, it is deemed that convergence has occurred.

3. Results and Discussion

3.1. Channel Selection

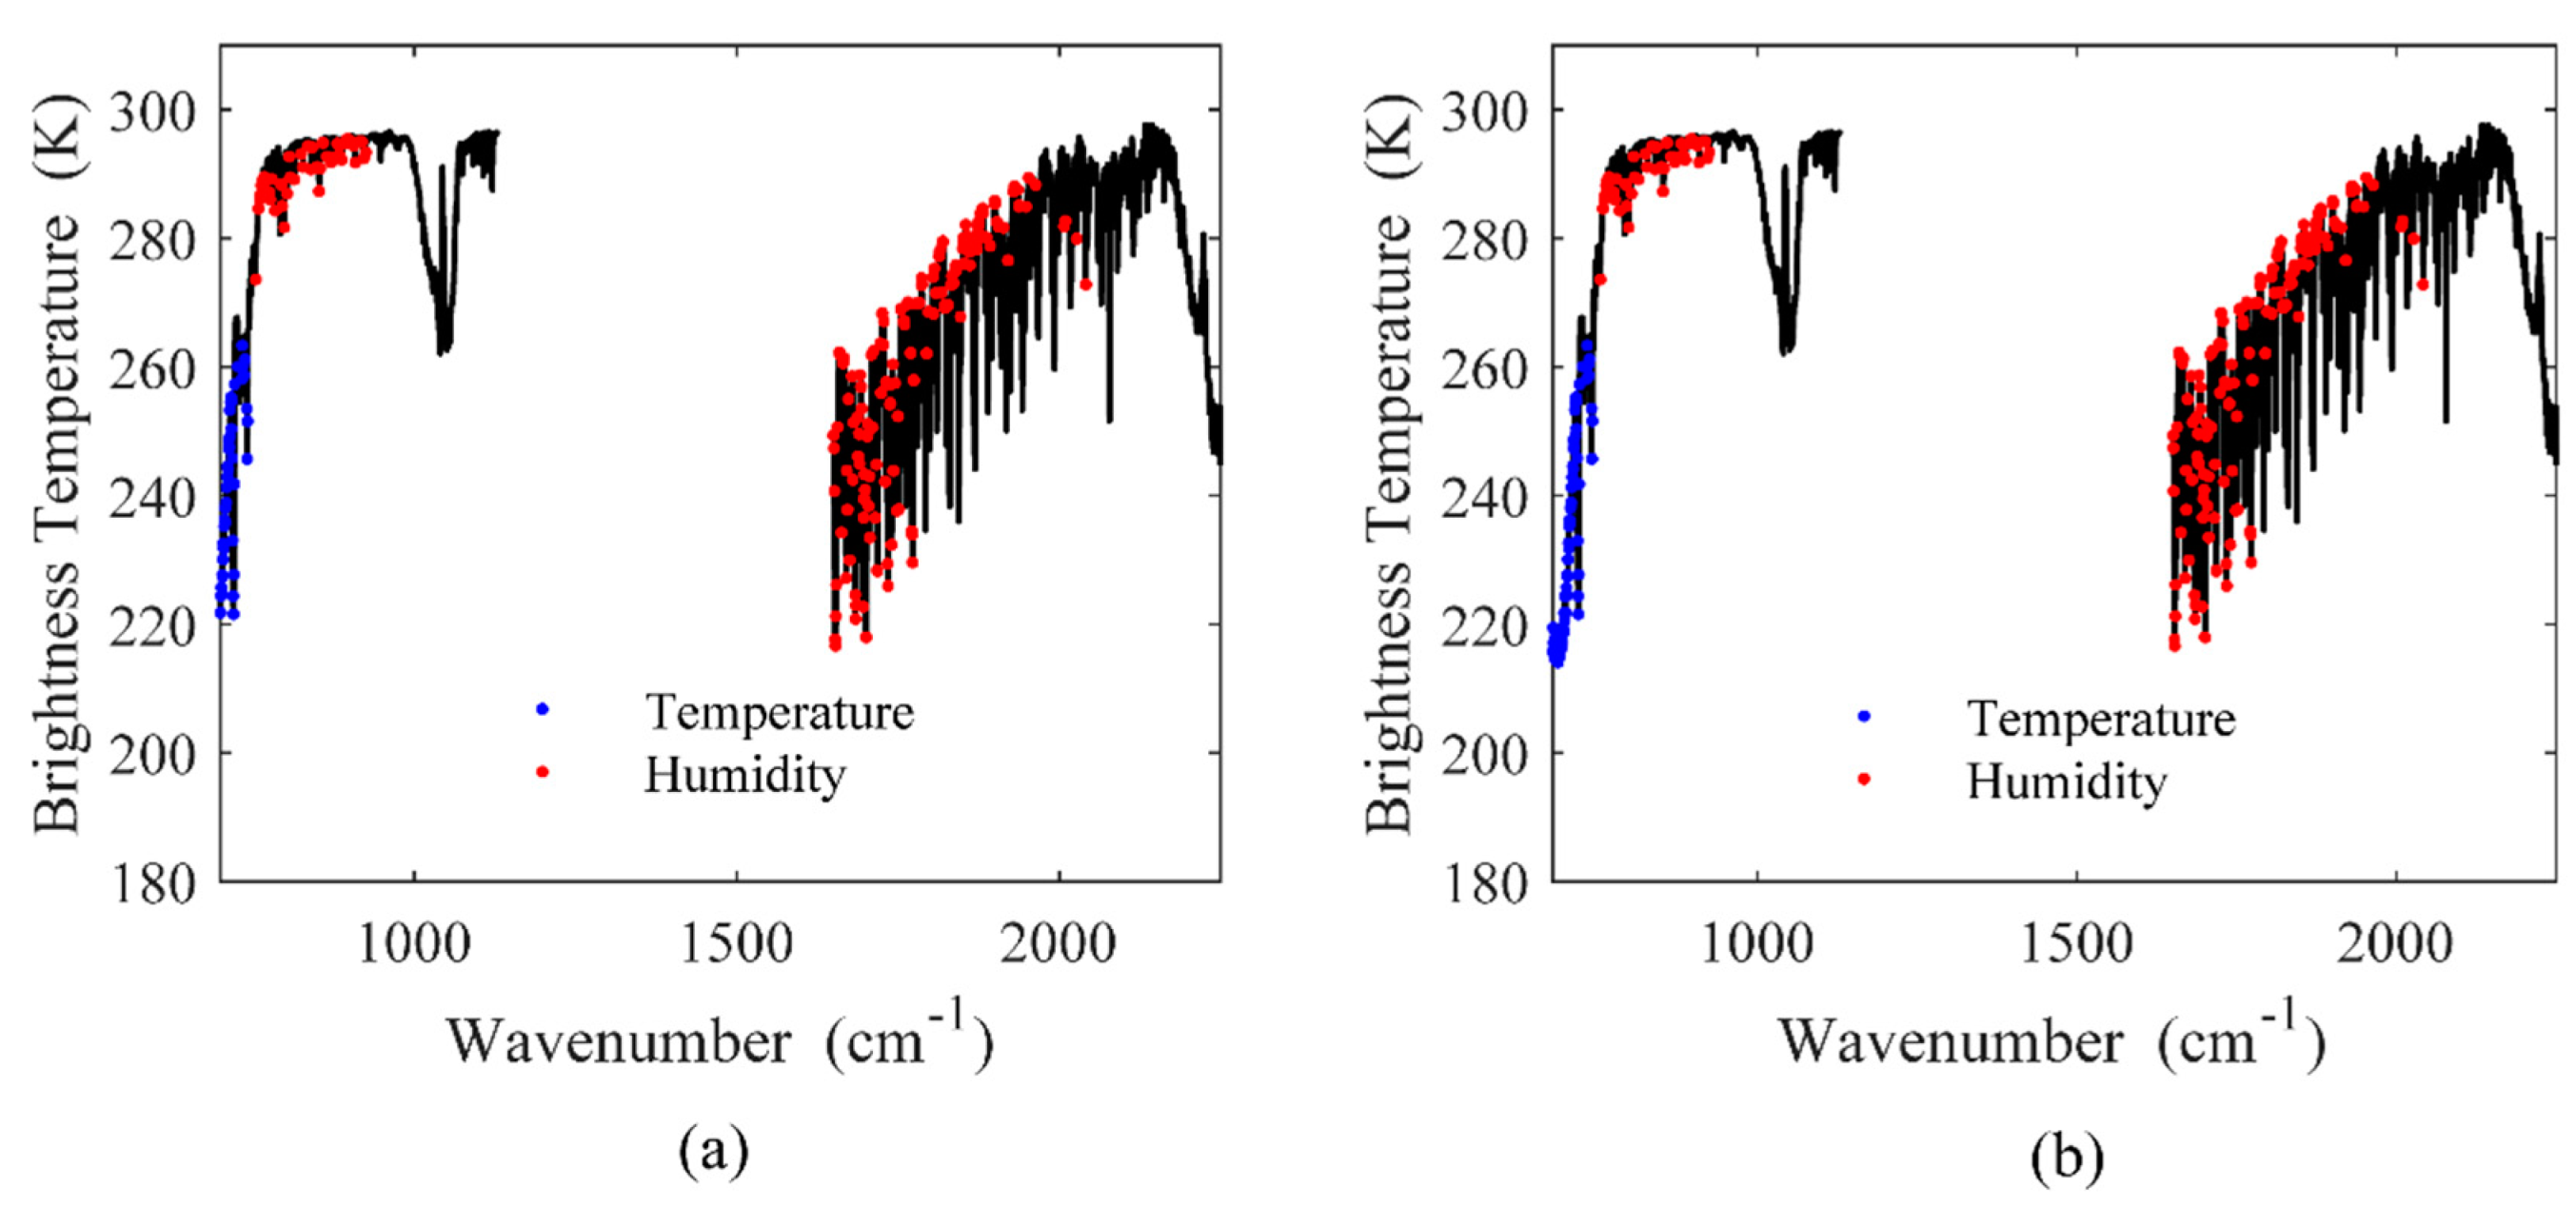
The channels of humidity and temperature are selected separately. Channel selection is made for each profile. For humidity, 200 channels are chosen. Every channel picked by the selection method is recorded. Then, the number of selected times of each channel is counted. The 200 channels with the most selected times are chosen. For temperature channel selection, the threshold of average brightness temperature difference is set to 1 K to remove channels affected by H2O. After the second step of the selection method, there are not many channels left. It may be not meaningful to do further channel selection. Then, the remained channels are used for temperature retrievals.
As shown in Figure 3, there are 45 and 77 channels selected for the temperature retrieval of FY-4A and FY-4B, respectively. The additional 32 selected temperature channels fall in the long-wave infrared region (680–700 cm−1) of FY-4B. It is the additional spectral range of FY-4B for improving the temperature retrieval performance. However, the humidity retrieval channels are the same for both FY-4A and FY-4B as they have the same spectral range in mid-wave infrared that is mainly used to sound humidity profiles. Some channels lying in weak H2O absorption bands in the atmospheric window are chosen to help the humidity retrieval of the lower troposphere.

3.2. Retrieval

The physical retrieval method is utilized multiple circularly to retrieve the temperature and humidity profiles for GIIRS, the process of which is shown in Figure 4. Temperature and humidity profiles are retrieved separately. Temperature profiles are retrieved first and then humidity profiles. In the first retrieval, the selected temperature channels and the a priori profiles of humidity and temperature are used as inputs for retrieving temperature first. To weaken the effect of the a priori profile of humidity on the temperature retrieval, only a few temperature channels will participate in the retrieval, which are mainly located in the spectral region of 680–730 cm−1. Then, the selected humidity channels, the temperature result and the a priori profile of humidity are taken as inputs to retrieve humidity. In the second retrieval, we add some selected temperature channels in the spectral region of 730–770 cm−1 to improve the retrieval of the lower troposphere. The temperature and humidity results of the first retrieval will be the inputs of the second retrieval. In the third retrieval, the results of the second retrieval will be the inputs of the third retrieval, and the selected channels participated in this retrieval will be the same as those of the second retrieval. The retrieval will be performed several times as shown in Figure 4. When the average values of temperature and humidity RMSE change by no more than 0.05 K and 0.1%, respectively, the process stops.

3.2.1. Temperature and Humidity Retrievals

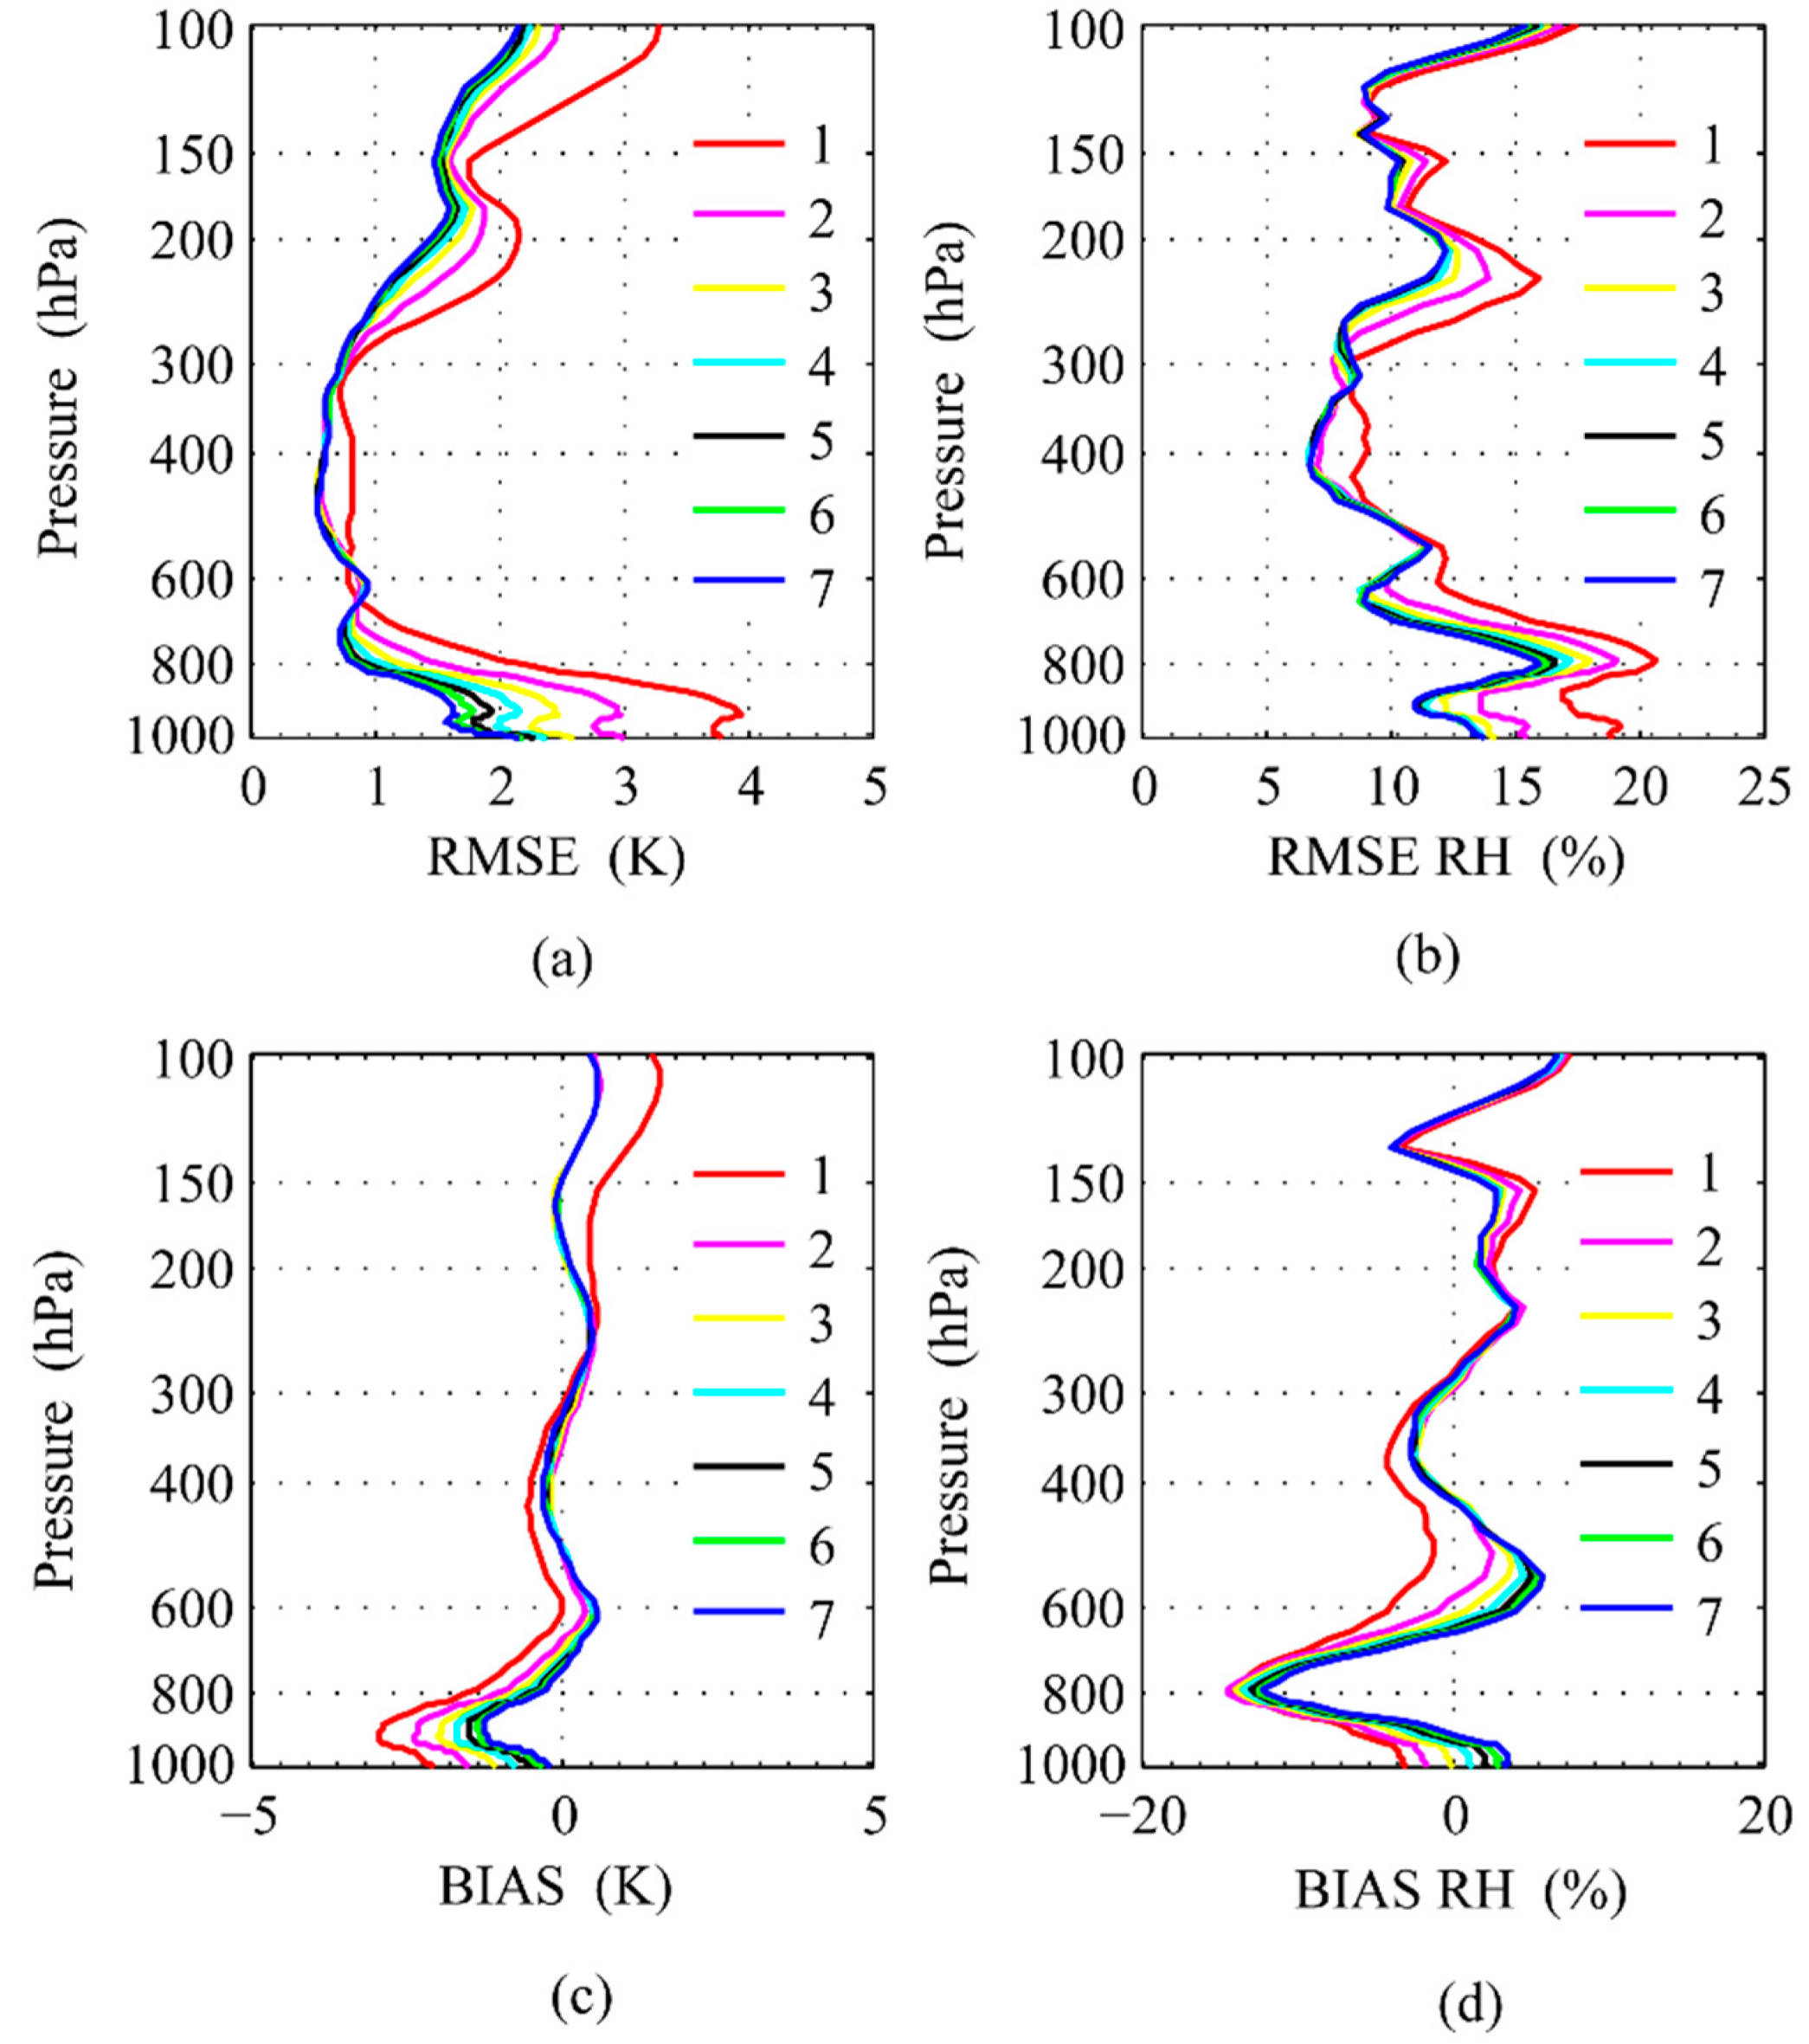
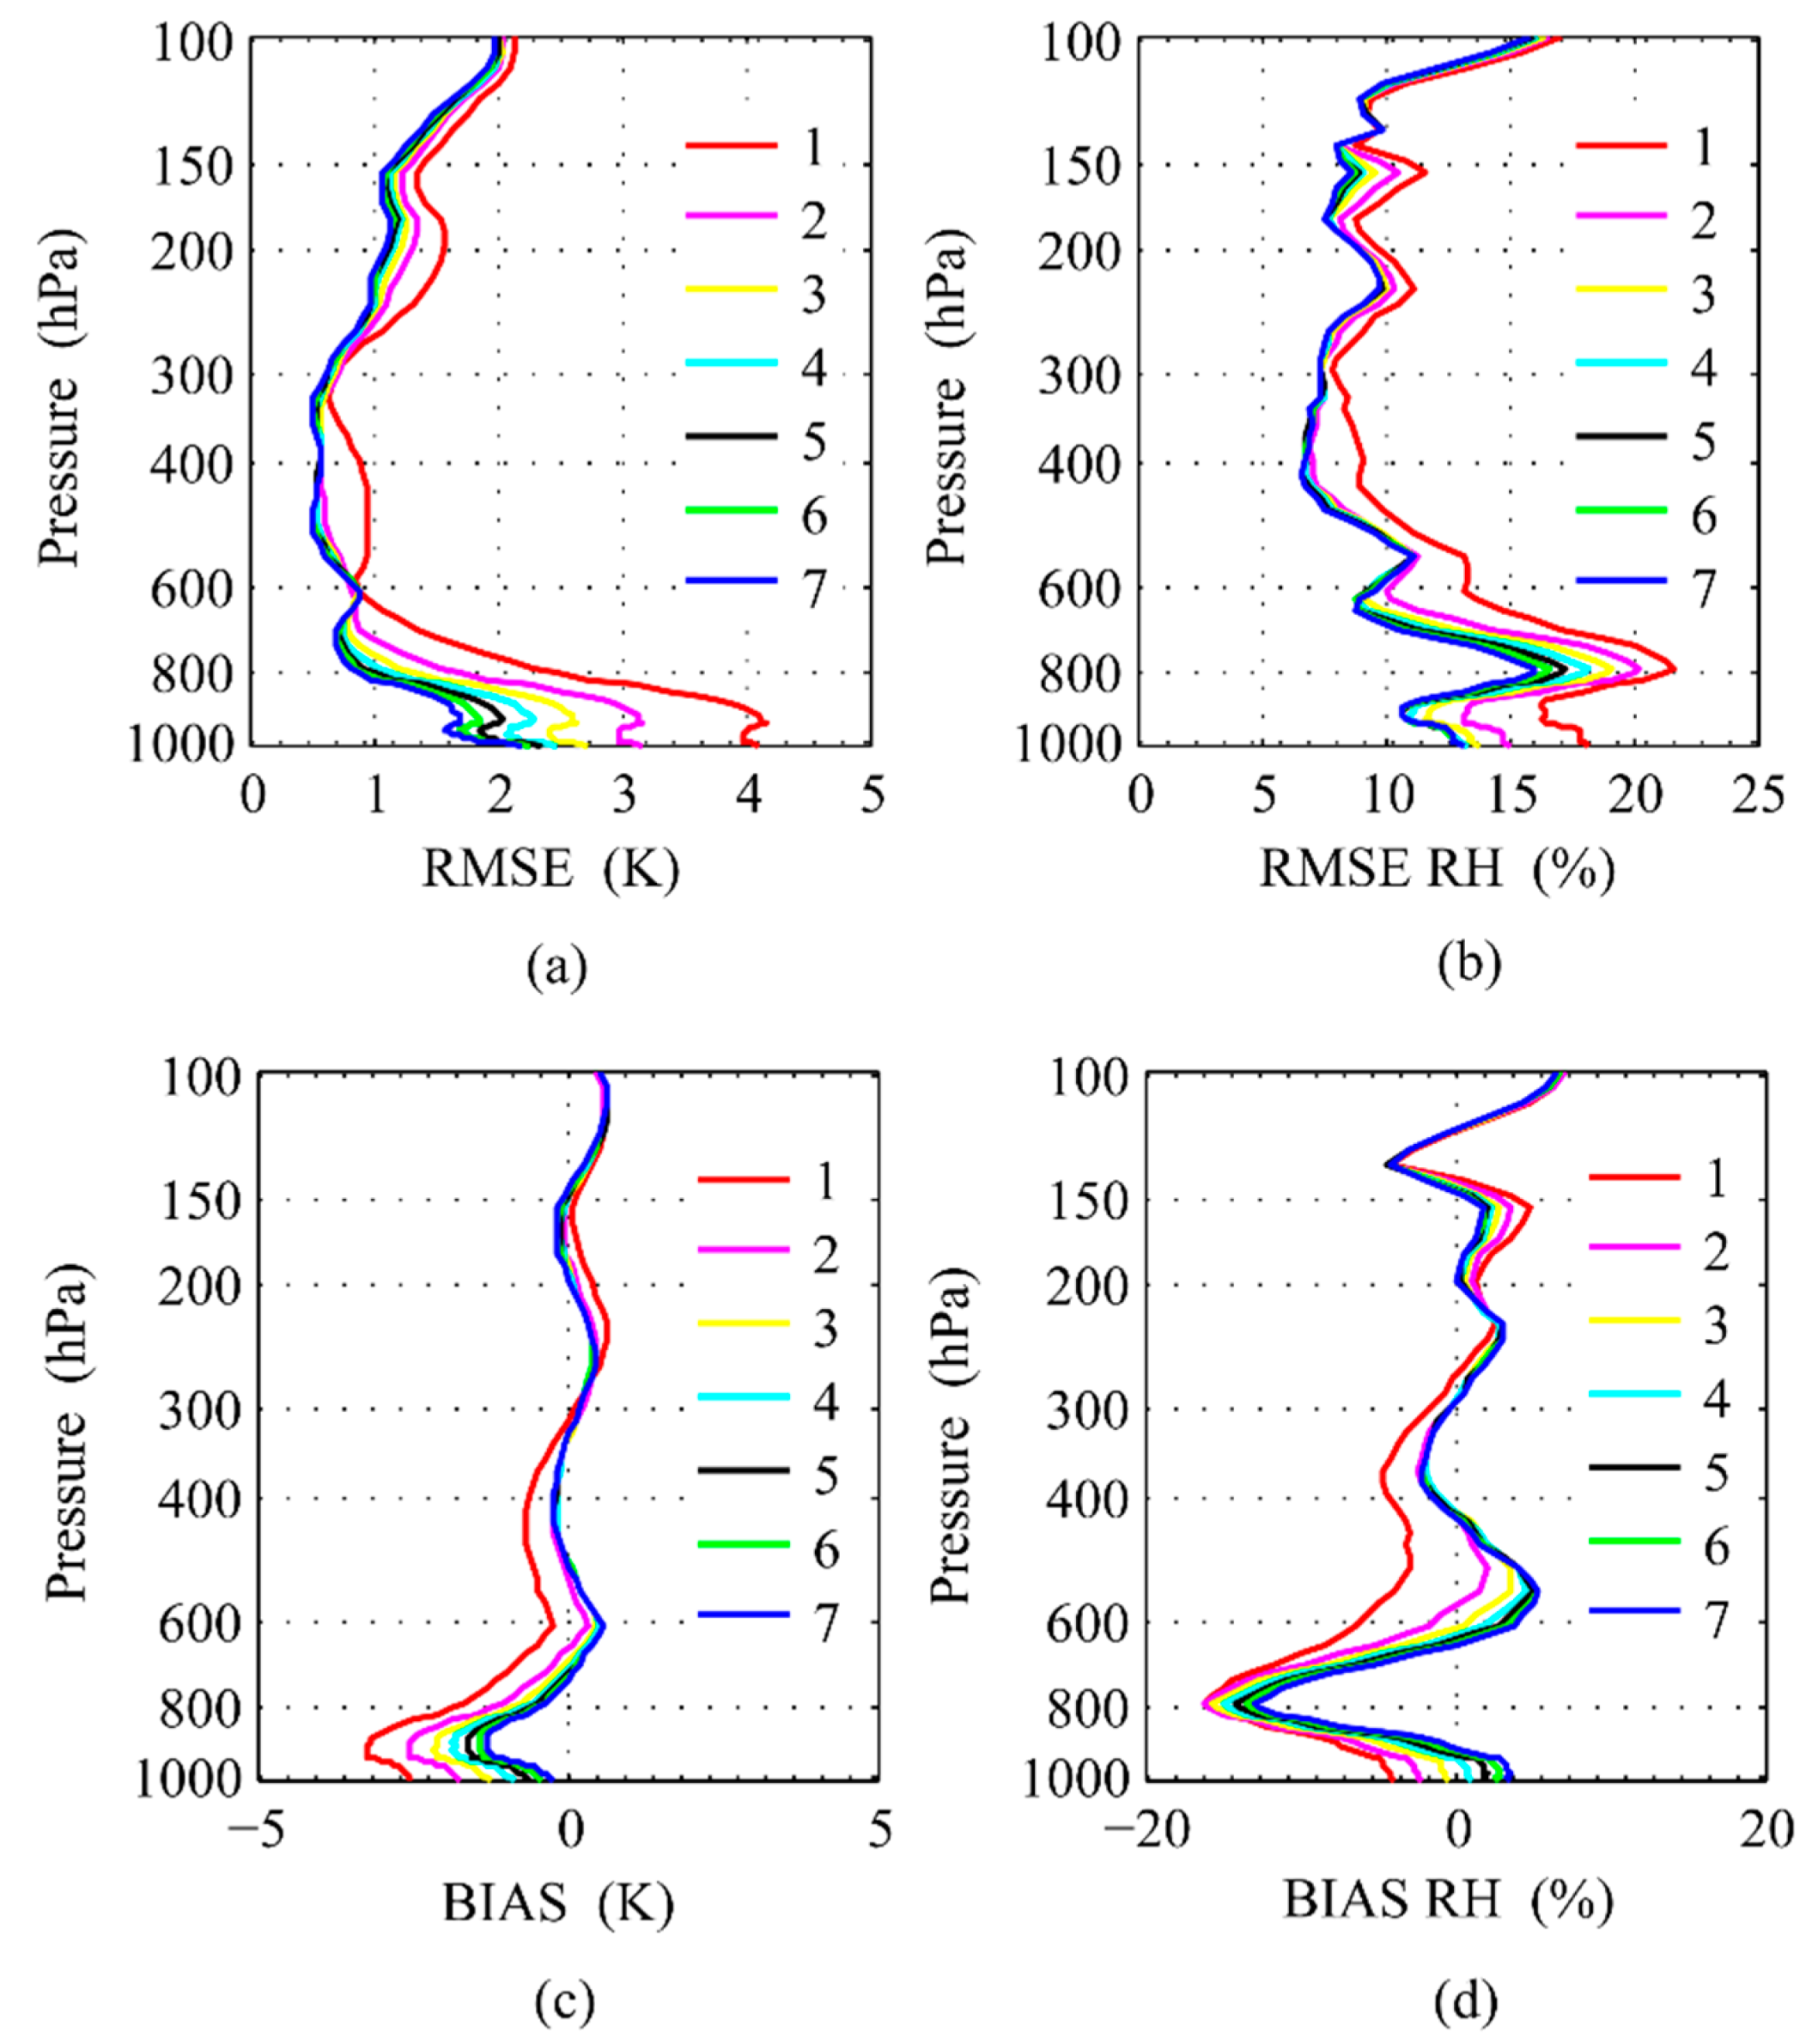
Temperature and humidity profiles are retrieved by using multiple cycling utilization of the physical retrieval method. As shown in Figure 5 and Figure 6, the iterations all converge in the seventh retrieval. As the retrieval times increases, the result profiles will get closer and closer, and the errors get smaller and smaller until optimum results are obtained (in Table 3). There is an obvious improvement in temperature and humidity accuracy of some pressure levels. For FY-4A GIIRS, the most obvious improvements of RMSE are 2.28 K at 935 hPa for temperature and 6.29% at 917 hPa for humidity in Figure 5a,b. The average improvements of RMSE are 0.99 K for temperature and 3.32% for humidity. For FY-4B GIIRS, the most obvious improvements of RMSE are 2.48K at 943 hPa for temperature and 6.70% at 710 hPa for humidity in Figure 6a,b. The average improvements of RMSE are 1.008 K and 3.36%.
For the retrievals, the a priori profiles play a prominent role which can affect the outcome. Here, temperature and humidity profiles are retrieved separately. The temperature and humidity results of each retrieval will be used as the a priori profiles for the next retrieval. So, the a priori profiles are constantly updated and getting close to the test profiles gradually. When temperature retrieval is performed, the a priori profile of humidity can affect the result, especially in the case of a large deviation between the a priori profile and the test profile of humidity. Because the absorption band of water vapor which is also sensitive to temperature is continuous and has a large span as shown in Figure 1, it is difficult to remove the impact of water vapor completely. Then, in the humidity retrieval, the a priori profile of temperature also affects the result. Because the channels used to retrieve humidity profiles are sensitive not only to humidity but also temperature. Multiple retrievals can gradually optimize the result of temperature and humidity profiles, and finally, make them reach the optimum values. This method can be used for retrieval with a large deviation between the a priori profiles and the test profiles.

3.2.2. Retrieval Comparison

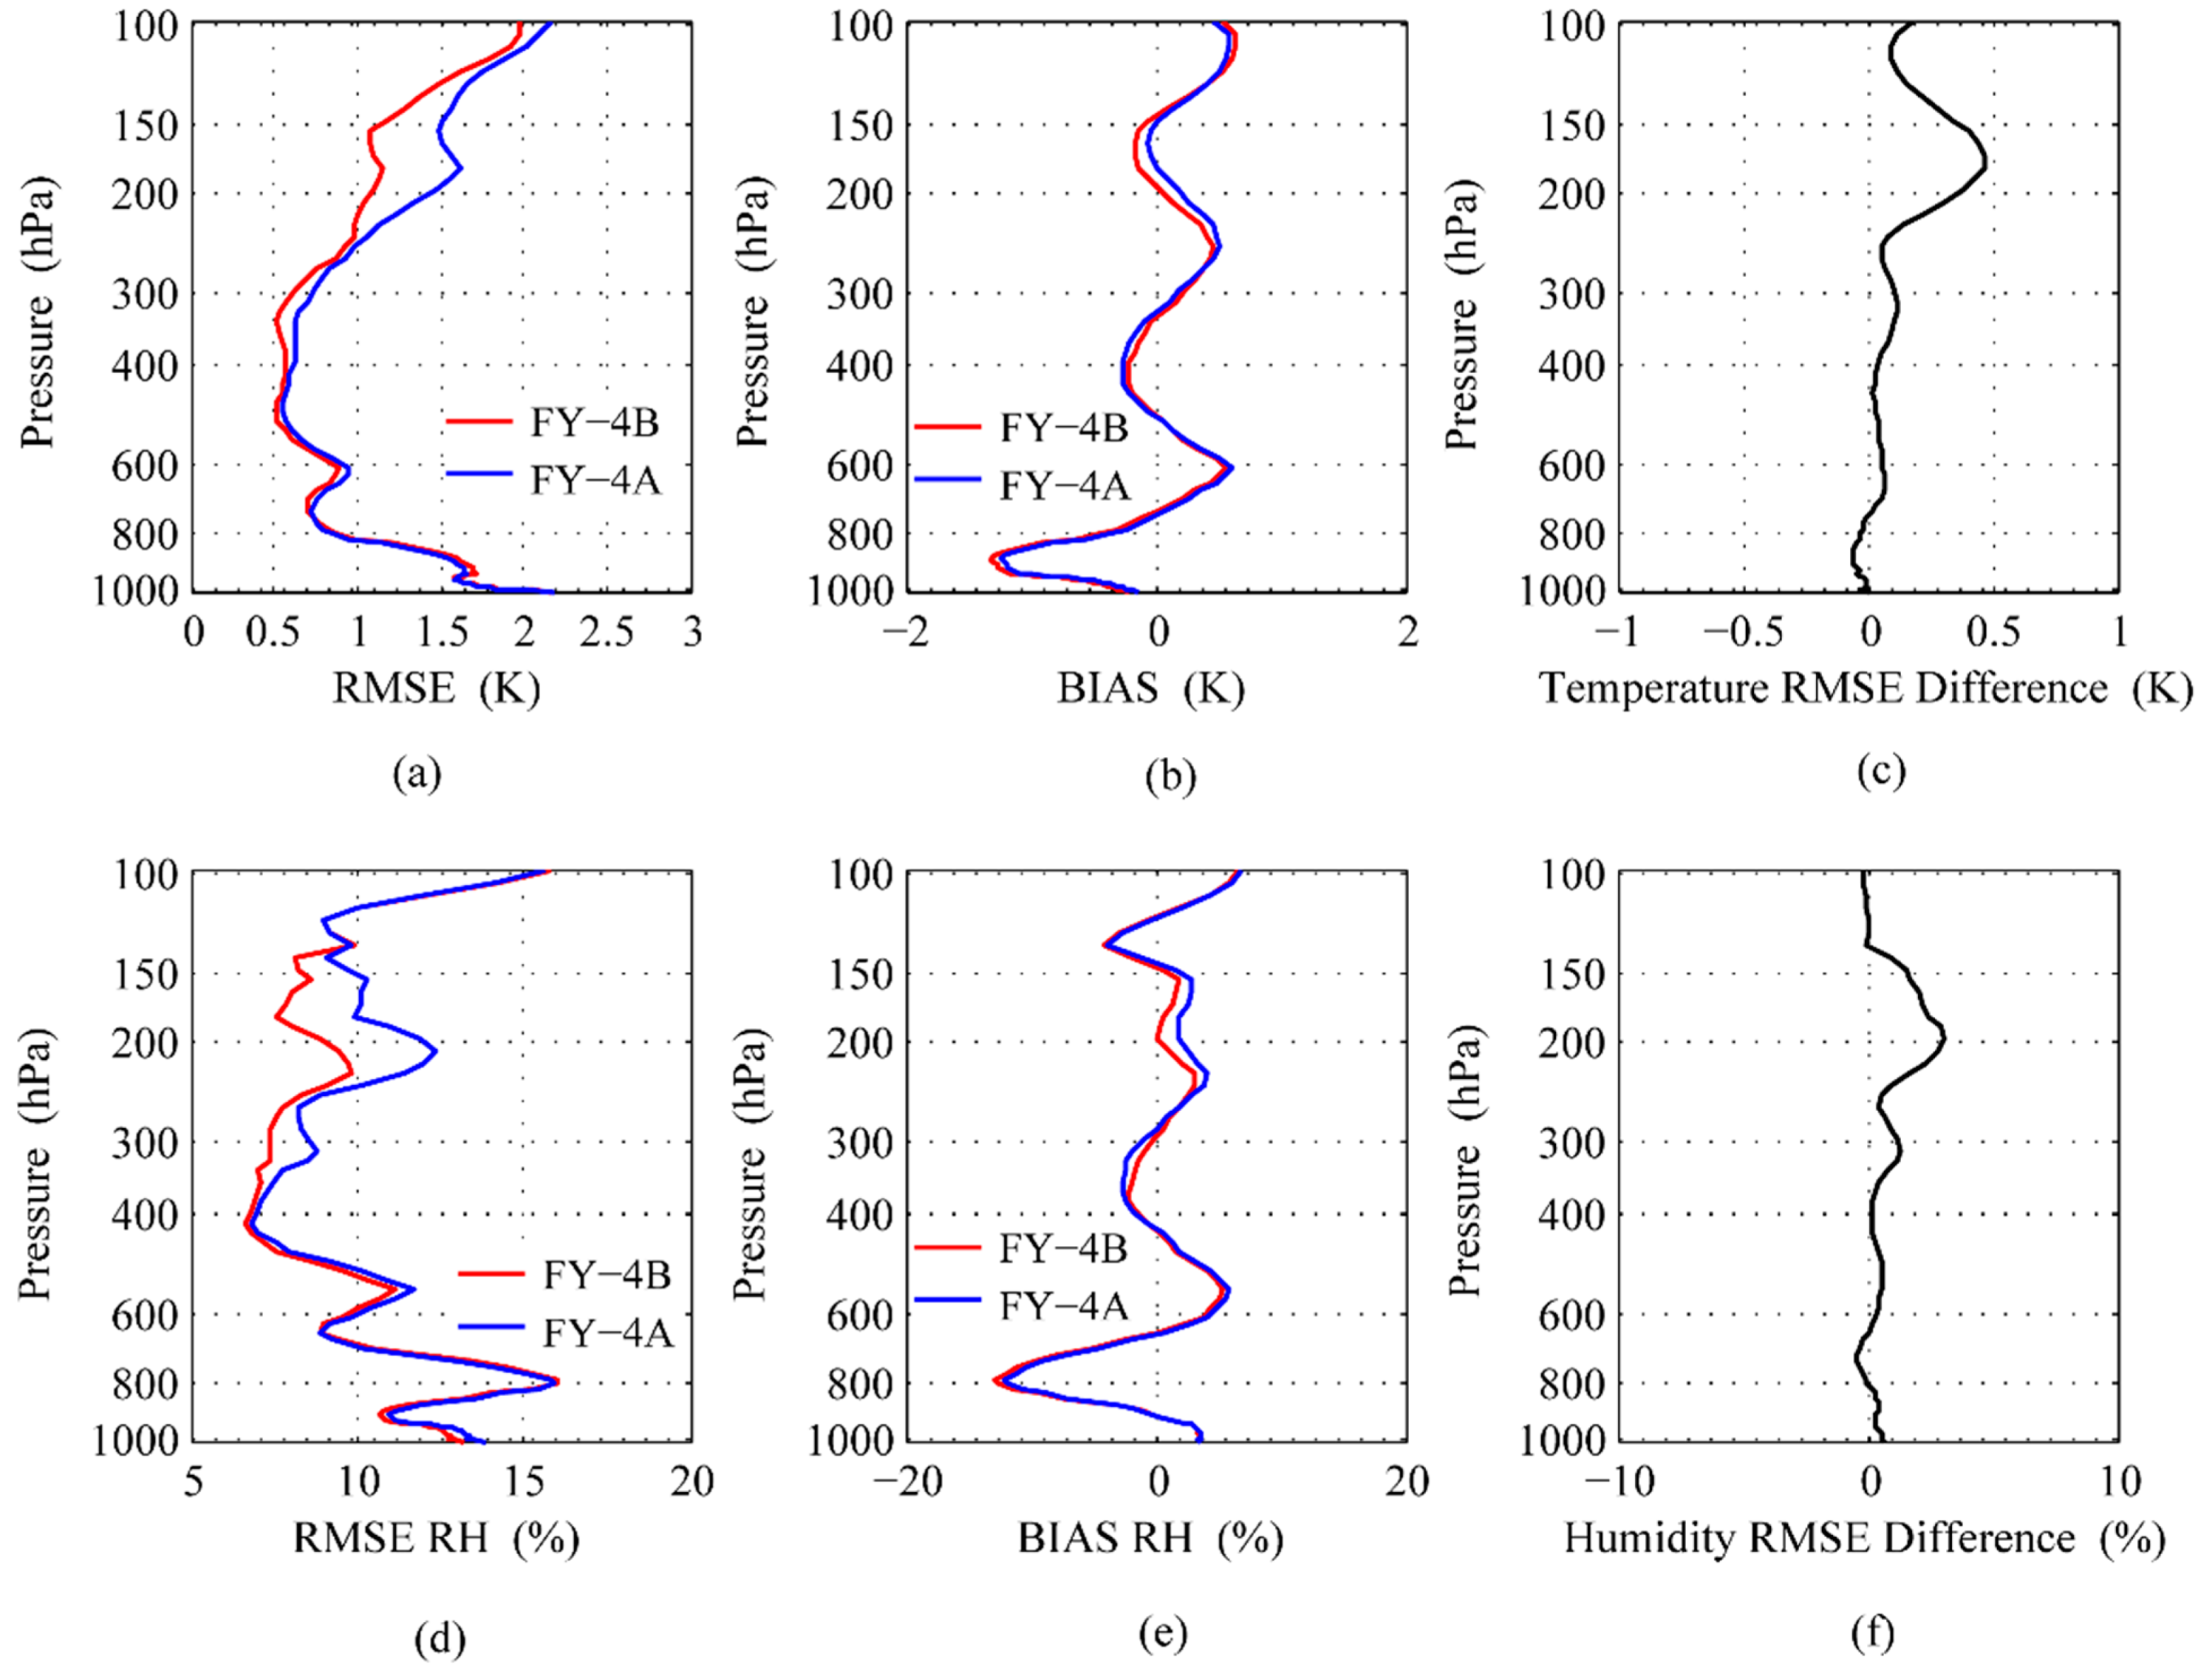
This subsection will discuss the influence of spectral range on temperature and humidity retrievals. The retrievals of FY-4A and FY-4B are compared. Figure 7 and Table 4 show that the temperature retrieval accuracy of FY-4B is very close to that of FY-4A from 400 hPa to 1000 hPa but is significantly better than that of FY-4A from 100 hPa to 400 hPa. As shown in Figure 7a,c, for temperature results, the maximum difference of RMSE is 0.47 K near 200 hPa. The lowest RMSE of FY-4B occurs at 337 hPa, which is 0.51 K, while that of FY-4A is 0.55 K at 487 hPa. The highest RMSE of FY-4B is 2.17 K at 1008 hPa, while that of FY-4A is 2.18 K at 1008 hPa. The average RMSE of FY-4B is 1.17K, while that of FY-4A is 1.24 K. The BIAS is of the order of 1.2 K, and the maximum difference is about 0.15 K near 200 hPa in Figure 7b.
The humidity retrieval accuracy of FY-4B is also very close to that of FY-4A below 400 hPa, and better than that of FY-4A above 400 hPa. In Figure 7d,f, the maximum difference of the relative humidity retrieval accuracy is 3.04% near 200 hPa. The lowest RMSE of FY-4B occurs at 415 hPa, which is 6.67%, while that of FY-4A is 6.83% at the same pressure level. The highest RMSE of FY-4B is 15.97% at 100 hPa, while that of FY-4A is 15.99% at the same level. The average RMSE of FY-4B is 10.46%, while that of FY-4A is 11.06%. The BIAS of the two is within 12%, and the maximum difference is about 1.57% at 200 hPa in Figure 7e.
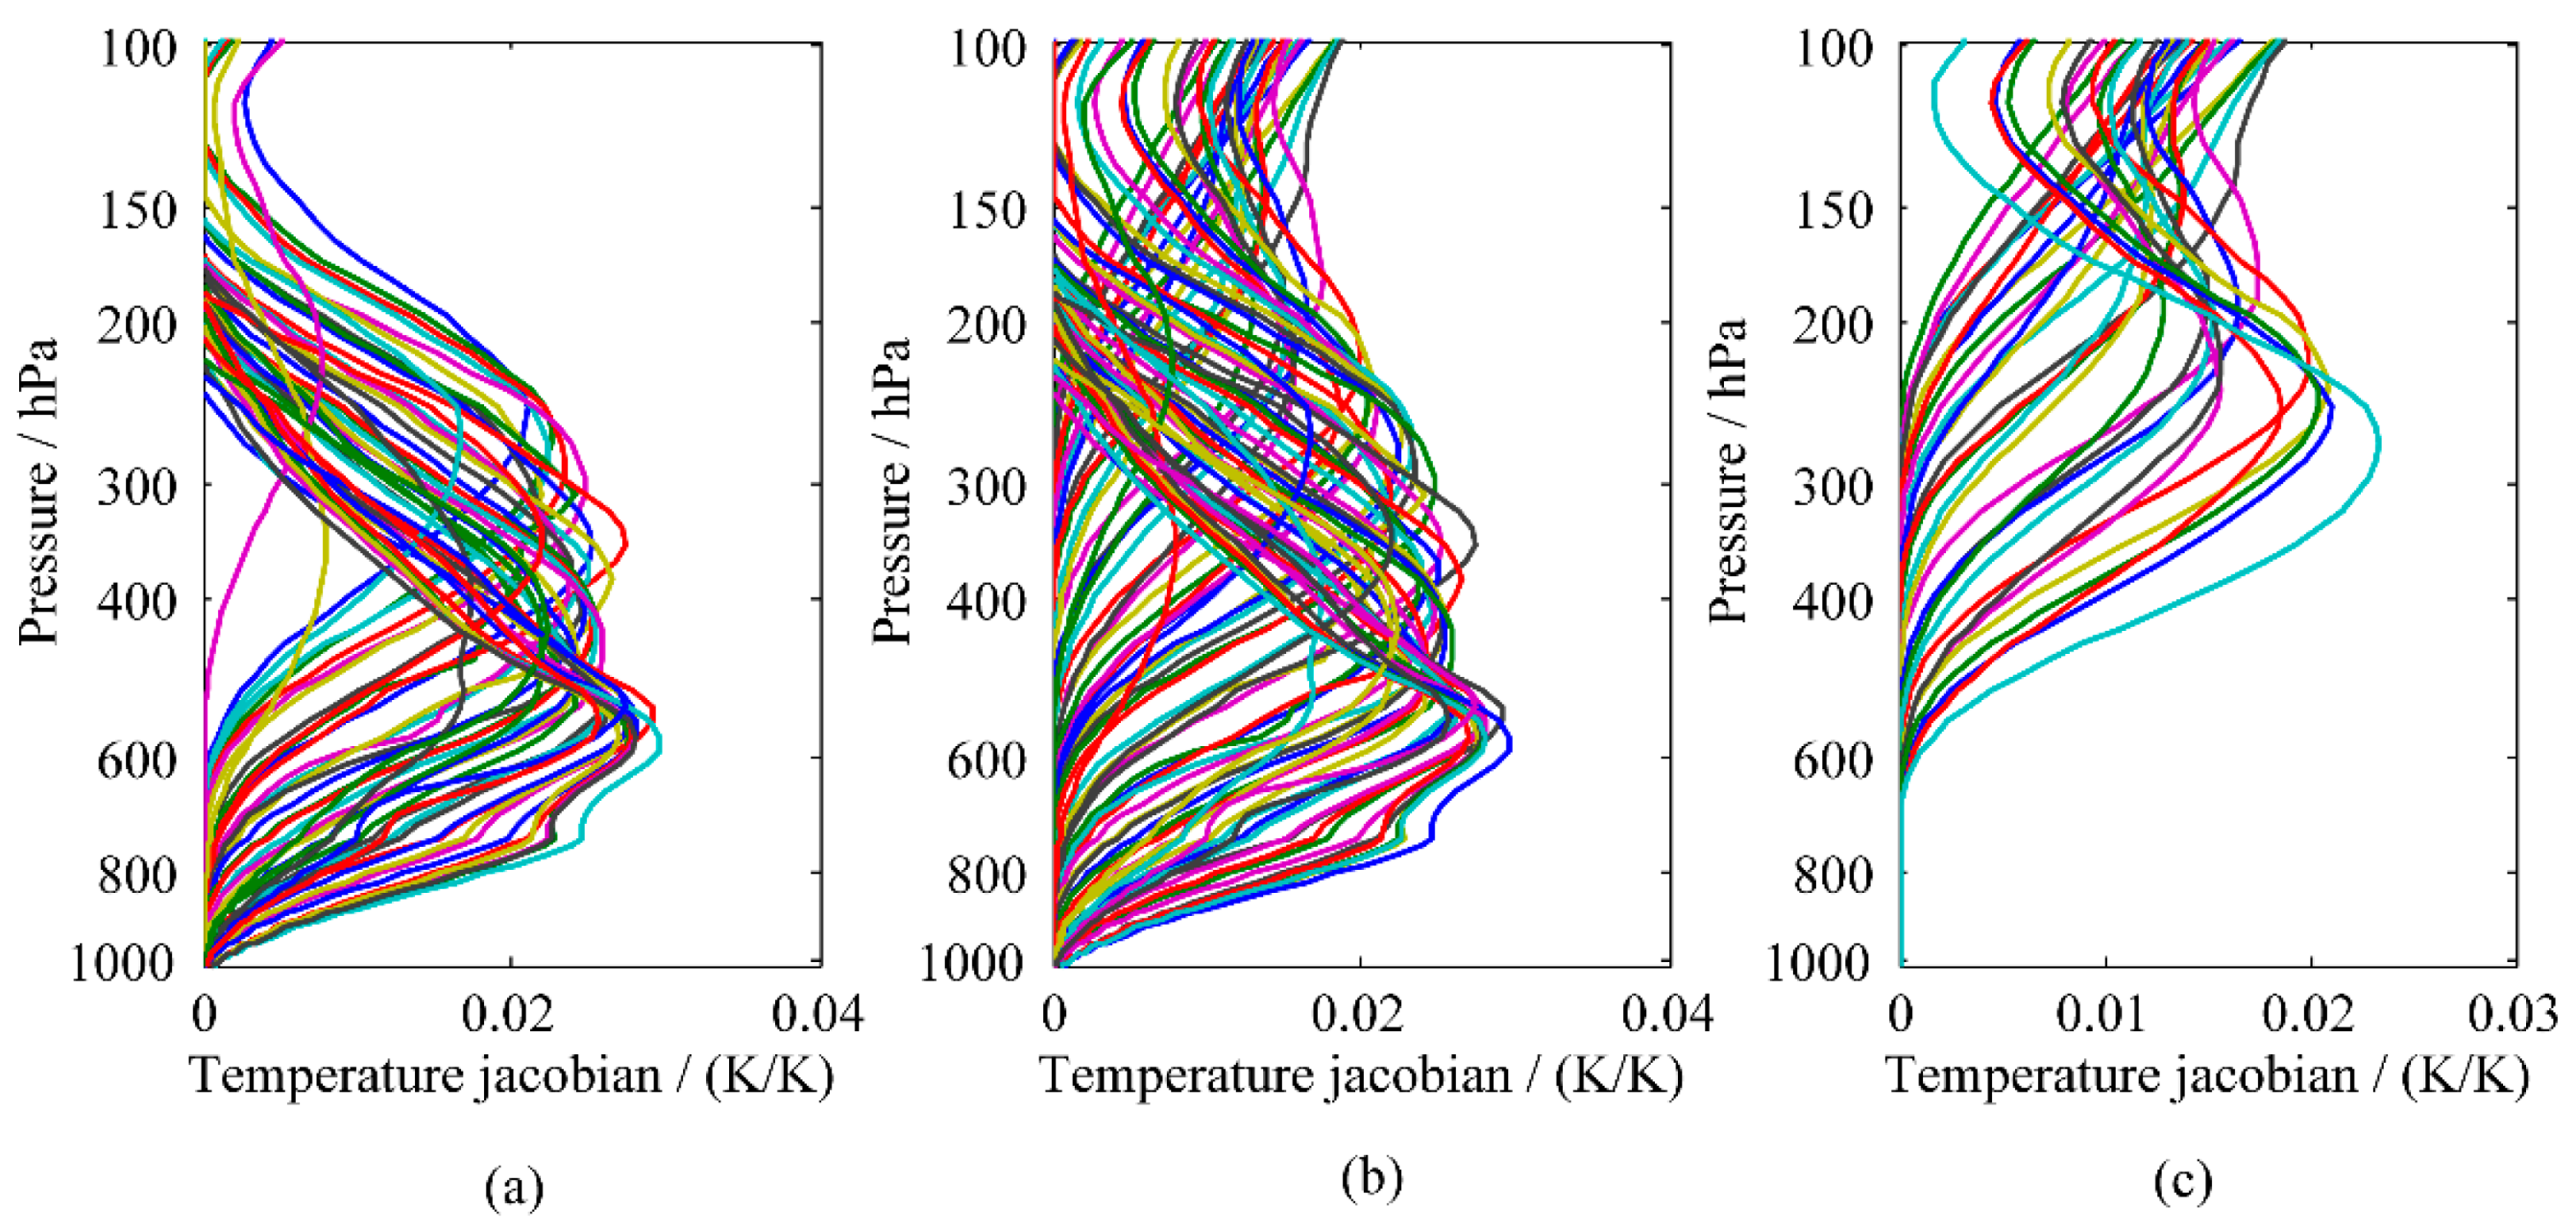
As we can see, the impact of the improvement of spectral range on retrievals mainly occurs in 130–400 hPa. The average RMSE of temperature retrieval at this pressure range is 1.08 K for FY-4A and 0.87 K for FY-4B, while that of humidity retrieval is 9.34% for FY-4A and 7.98% for FY-4B. Because the spectral ranges of FY-4A and FY4B are different in long-wave infrared. FY-4B has 32 more channels than FY-4A, and these channels are sensitive to temperature. Figure 8 shows the temperature Jacobians of the selected channels of FY-4A and FY-4B. As shown in Figure 8c, the Jacobian peaks of the 32 channels are located in about 150–300 hPa. It provides more information for temperature retrieval. So, the temperature accuracy of FY-4B is better than that of FY-4A in the middle and upper troposphere. The humidity accuracy is also improved at the same pressure levels as the temperature results become better. Hence, extending the spectral range of FY-4 GIIRS is helpful for retrieval.

3.2.3. Perturbation Analysis

As mentioned above, the difference in the spectral range between the two GIIRS is in the long-wave infrared region. The 32 channels are used to sound temperature. So, we added the perturbations of ±1 K, ±3 K, and ±5 K to the a priori temperature profile, respectively, to analyze the sensitivity of the retrieval to temperature perturbations due to the difference in spectral range.
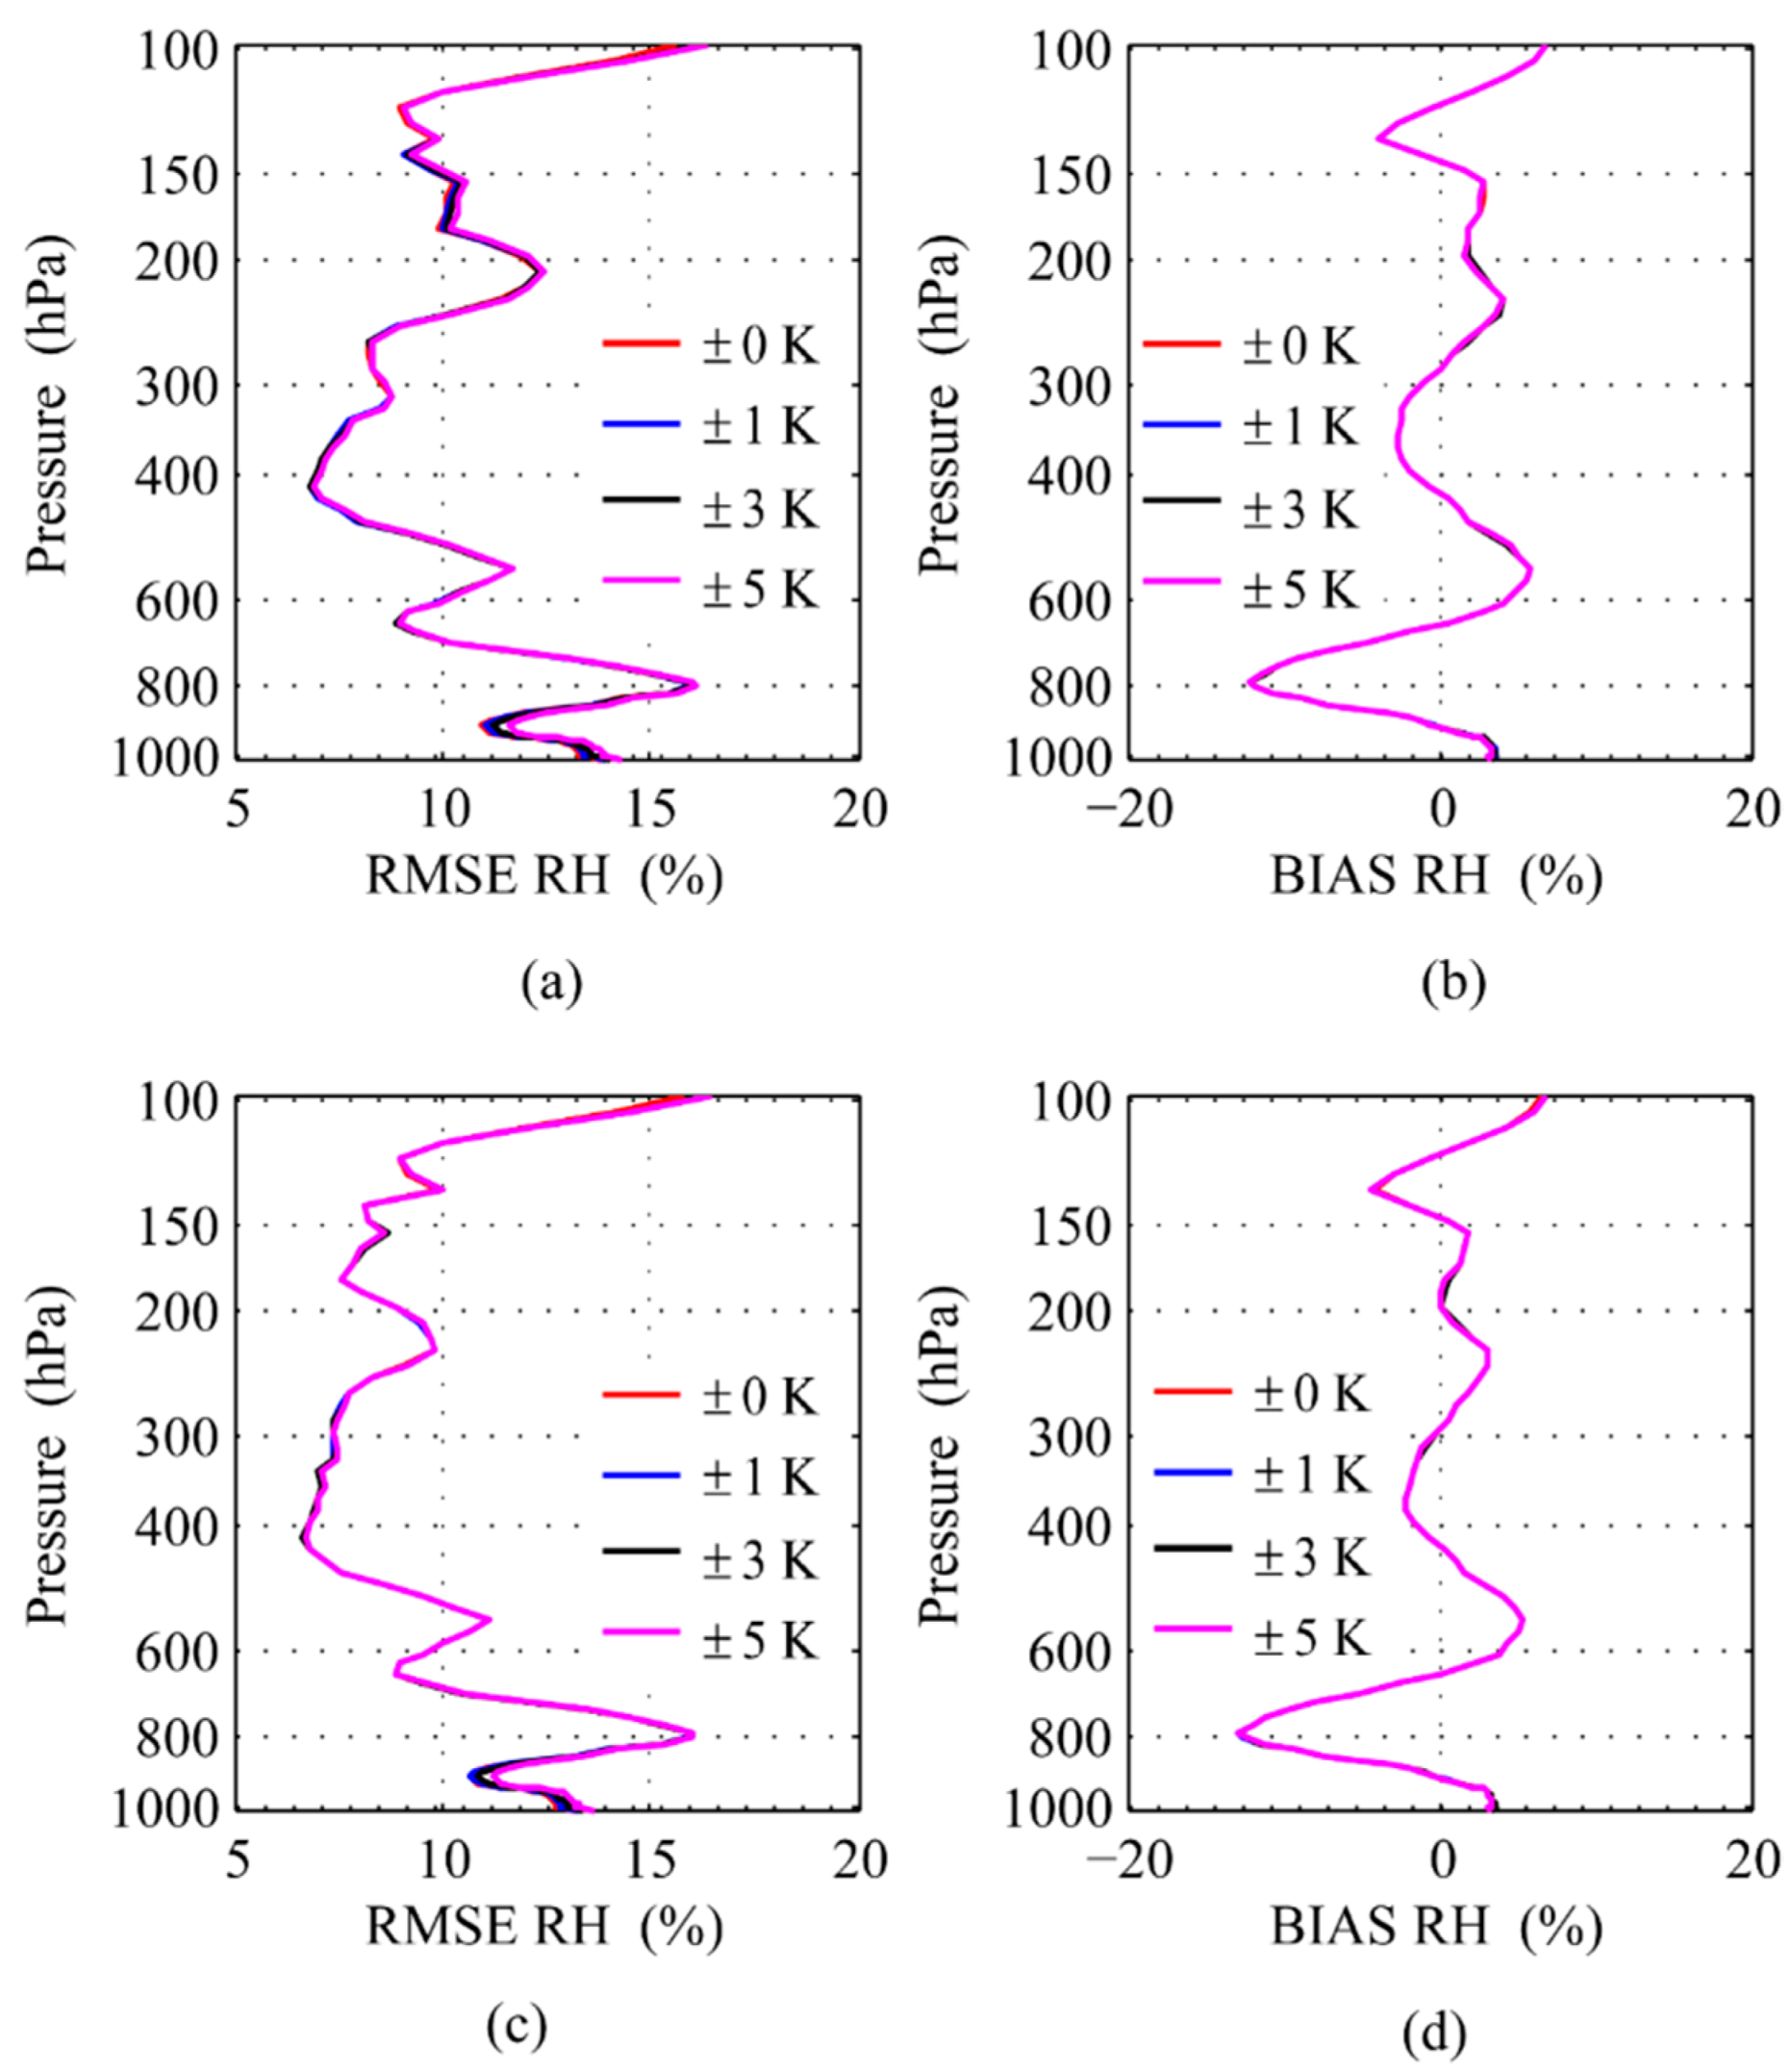
The temperature retrieval results are shown in Figure 9. As shown in Figure 9 b,d, the BIAS results are almost unaffected by the perturbations. In Figure 9a,c, the RMSE results in 180–940 hPa are also unaffected by the perturbations. That is because the information of channels is relatively sufficient, the retrieval is insensitive to the perturbations in these pressure levels. However, in 100–180 hPa and 940–1000 hPa, the retrieval accuracy decreases with the increase of the perturbations. It may be the reason that FY-4A and FY-4B have a small number of sensitive channels in these pressure levels. Especially in 100–180 hPa, the variation of the retrieval accuracy of FY-4A is more obvious than that of FY-4B, which means the temperature retrieval of FY-4A more sensitive to temperature perturbations than that of FY-4B due to lack of 32 channels. Hence, the extension of spectral range will be beneficial to the temperature retrieval.
The humidity retrieval results are shown in Figure 10. Similar to the BIAS results of temperature, those of humidity are also free from influence of the perturbations in Figure 10b,d. Then, in Figure 10a,c, although the temperature retrieval results can affect the humidity retrieval, the perturbations has little effect on humidity retrieval. As we can see, in Figure 9a,c, the accuracy of temperature varies with the perturbations obviously in 100–180 hPa and 940–1000 hPa, but that of humidity does not in the same pressure levels. Because the humidity channels are weakly sensitive to the temperature in those pressure levels. So, the extension of spectral range of GIIRS has little effect on the sensitivity of the humidity retrieval to temperature perturbations.

4. Conclusions

In this paper, the influence of spectral range on retrieval is discussed for FY-4A GIIRS and FY-4B GIIRS. The multiple cycling utilization of the physical retrieval method is applied to diagnose the temperature and humidity retrieval performance of FY-4A and FY-4B, which can improve the retrieval accuracy (more than 0.9 K for temperature and 3.0% for humidity). The temperature and humidity retrieval accuracy of FY-4B GIIRS is better than that of FY-4A GIIRS in 130–400 hPa, especially near 200 hPa, as the spectral range extends. The maximum difference of RMSE is about 0.5 K for temperature and 3.0% for humidity near 200 hPa. The average RMSE of temperature retrieval in 130–400 hPa is about 1.1 K for FY-4A and 0.9 K for FY-4B, while that of humidity retrieval is about 9.3% for FY-4A and 8.0% for FY-4B. Furthermore, the temperature retrieval of FY-4A is more sensitive to temperature perturbations than that of FY-4B due to lack of 32 channels. FY-4B GIIRS extends the spectral range from 700–1130 cm−1 to 680–1130 cm−1, which results in an increase in channels that are sensitive to the temperature profile of the middle and upper troposphere. It can not only improve the retrieval accuracy but also reduce the dependence of the temperature retrieval on the a priori profiles and make the retrieval more stable.
This study conducts a quantitative analysis of the temperature and humidity retrieval abilities of FY-4A and FY-4B GIIRS based on the instrument design. It offers the usefulness of current FY-4B GIIRS instruments with observed on-orbit bias, and a reference for the parameter design of the subsequent instruments. In the future, we will research the influence of the instrument noise on retrieval, which is also very important. Excessive noise may drown out the radiation and make the sounding impossible. In addition, the multiple retrieval method will be further improved by gradually increasing channels to obtain a significant improvement in accuracy.

Author Contributions

Conceptualization, S.W. and F.L.; methodology, S.W.; software, S.W.; validation, S.W. and Y.F.; formal analysis, S.W. and F.L.; investigation, S.W.; resources, F.L. and Y.F.; data curation, S.W.; writing—original draft preparation, S.W.; writing—review and editing, S.W., Y.F. and F.L.; visualization, S.W.; supervision, F.L.; project administration, F.L.; funding acquisition, F.L. All authors have read and agreed to the published version of the manuscript.

Funding

This research was funded by the National Natural Science Foundation of China (Grant No. 61527805) and by the National Natural Science Foundation of China (Grant No. 41965001).

Institutional Review Board Statement

Not applicable.

Informed Consent Statement

Not applicable.

Data Availability Statement

The dataset was downloaded from NWP SAF (https://nwp-saf.eumetsat.int/site/software/atmospheric-profile-data/, accessed on 20 April 2022).

Acknowledgments

The parameters of FY-4 GIIRS and the instrument noise data are provided by National Satellite Meteorological Center, China Meteorological Administration, Beijing, China.

Conflicts of Interest

The authors declare no conflict of interest.

References

  1. Huang, P.; Guo, Q.; Han, C.; Zhang, C.; Yang, T.; Huang, S. An improved method combining ANN and 1D-Var for the retrieval of atmospheric temperature profiles from FY-4A/GIIRS hyperspectral data. Remote Sens. 2021, 13, 481. [Google Scholar] [CrossRef]
  2. Sun, J.; McColl, K.A.; Wang, Y.; Rigden, A.J.; Lu, H.; Yang, K.; Li, Y.; Santanello, J.A. Global evaluation of terrestrial near-surface air temperature and specific humidity retrievals from the Atmospheric Infrared Sounder (AIRS). Remote Sens. Environ. 2021, 252, 12. [Google Scholar] [CrossRef]
  3. Chung, E.S.; Soden, B.J. Investigating the influence of carbon dioxide and the stratosphere on the long-term tropospheric temperature monitoring from HIRS. Am. Meteorol. Soc. 2016, 33, 1967–1984. [Google Scholar] [CrossRef]
  4. Liu, H.L.; Tang, S.H.; Hu, J.Y.; Zhang, S.; Deng, X. An improved physical split-window algorithm for precipitable water vapor retrieval exploiting the water vapor channel observations. Remote Sens. Environ. 2017, 197, 366–378. [Google Scholar] [CrossRef]
  5. Von Clarmann, T.; Degenstein, D.A.; Livesey, N.J.; Bender, S.; Braverman, A.; Butz, A.; Compernolle, S.; Damadeo, R.; Dueck, S.; Eriksson, P.; et al. Overview: Estimating and reporting uncertainties in remotely sensed atmospheric composition and temperature. Atmos. Meas. Tech. 2020, 13, 4393–4436. [Google Scholar] [CrossRef]
  6. Cai, X.; Bao, Y.; Petropoulos, G.P.; Lu, F.; Lu, Q.; Zhu, L.; Wu, Y. Temperature and humidity profile retrieval from FY4-GIIRS hyperspectral data using artificial neural networks. Remote Sens. 2020, 12, 1872. [Google Scholar] [CrossRef]
  7. Aires, F.; Chédin, A.; Scott, N.A.; Rossow, W.B. A regularized neural net approach for retrieval of atmospheric and surface temperatures with the IASI instrument. J. Appl. Meteorol. 2002, 41, 144–159. [Google Scholar] [CrossRef]
  8. Dong, C.; LI, J.; Zhang, P. The Principle and Application of Satellite Hyperspectral Infrared Atmospheric Remote Sensing; Science Press: Beijing, China, 2013; pp. 2–9. [Google Scholar]
  9. Zeng, Q. The Principle of Atmospheric Infrared Remote Sensing; Science Press: Beijing, China, 1974; pp. 15–23. [Google Scholar]
  10. Wang, F.; Li, J.; Schmit, T.J.; Ackerman, S.A. Trade-off studies of a hyperspectral infrared sounder on a geostationary satellite. Appl. Opt. 2007, 46, 200–209. [Google Scholar] [CrossRef]
  11. Chang, S.; Sheng, Z.; Du, H.; Ge, W.; Zhang, W. A channel selection method for hyperspectral atmospheric infrared sounders based on layering. Atmos. Meas. Tech. 2020, 13, 629–644. [Google Scholar] [CrossRef] [Green Version]
  12. Osei, M.A.; Amekudzi, L.K.; Ferguson, C.R.; Danuor, S.K. Inter-comparison of AIRS temperature and relative humidity profiles with AMMA and DACCIWA radiosonde observations over West Africa. Remote Sens. 2020, 12, 2631. [Google Scholar] [CrossRef]
  13. Zhang, L.; Wei, C.; Liu, H.; Jiang, H.; Lu, X.; Zhang, X.; Jiang, C. Comparison analysis of global methane concentration derived from SCIAMACHY, AIRS, and GOSAT with surface station measurements. Int. J. Remote Sens. 2020, 42, 1823–1840. [Google Scholar] [CrossRef]
  14. Aumann, H.H.; Chahine, M.T.; Gautier, C.; Goldberg, M.D.; Kalnay, E.; McMillin, L.M.; Revercomb, H.; Rosenkranz, P.W.; Smith, W.L.; Staelin, D.H.; et al. AIRS/AMSU/HSB on the Aqua mission: Design, science objective, data products, and processing systems. IEEE Trans. Geosci. Remote Sens. 2003, 41, 253–264. [Google Scholar] [CrossRef] [Green Version]
  15. Heng, Z.; Jiang, X. An assessment of the temperature and humidity of atmospheric infrared sounder (AIRS) v6 profiles using radiosonde data in the Lee of the Tibetan Plateau. Atmosphere 2019, 10, 394. [Google Scholar] [CrossRef] [Green Version]
  16. Xiong, X.; Liu, X.; Wu, W.; Knowland, K.E.; Yang, F.; Yang, Q.; Zhou, D.K. Impact of stratosphere on cold air outbreak: Observed evidence by CrIS on SNPP and its comparison with models. Atmosphere 2022, 13, 876. [Google Scholar] [CrossRef]
  17. Wang, T.; Zhou, L.; Tan, C.; Divakarla, M.; Pryor, K.; Warner, J.; Wei, Z.; Goldberg, M.; Nalli, N.R. Validation of near-real-time NOAA-20 CrIS outgoing longwave radiation with multi-satellite datasets on broad timescales. Remote Sens. 2021, 13, 3912. [Google Scholar] [CrossRef]
  18. Yin, M. Assessing the sun glint effect on the data bias of CrIS shortwave surface channels near 3.7 μm. Int. J. Remote Sens. 2016, 37, 356–369. [Google Scholar] [CrossRef]
  19. Dolgii, S.I.; Nevzorov, A.A.; Nevzorov, A.V.; Romanovskii, O.A.; Kharchenko, O.V. Comparison of ozone vertical profiles in the upper troposphere–stratosphere measured over Tomsk, Russia (56.5° N, 85.0° E) with DIAL, MLS, and IASI. Int. J. Remote Sens. 2020, 41, 8590–8609. [Google Scholar] [CrossRef]
  20. Masiello, G.; Matricardi, M.; Serio, C. The use of IASI data to identify systematic errors in the ECMWF forecasts of temperature in the upper stratosphere. Atmos. Chem. Phys. 2011, 11, 1009–1021. [Google Scholar] [CrossRef] [Green Version]
  21. Crevoisier, C.; Clerbaux, C.; Guidard, V.T.; Phulpin, T.; Armante, R.; Barret, B.; Camy-Peyret, C.; Chaboureau, J.-P.; Coheur, P.-F.; Crépeau, L.; et al. Towards IASI-New Generation (IASI-NG): Impact of improved spectral resolution and radiometric noise on the retrieval of thermodynamic, chemistry and climate variables. Atmos. Meas. Tech. 2014, 7, 4367–4385. [Google Scholar] [CrossRef] [Green Version]
  22. Coopmann, O.; Fourrie, N.; Guidard, V. Analysis of MTG-IRS observations and general channel selection for numerical weather prediction models. Q. J. R. Meteorol. Soc. 2022, 148, 1864–1885. [Google Scholar] [CrossRef]
  23. Lu, F.; Zhang, X.; Chen, B.; Liu, H.; Wu, R.; Hai, Q.; Feng, X.; Li, Y.; Zhang, Z. FY-4 geostationary meteorological satellite imaging characteristics and its application prospects. J. Mar. Meteorol. 2017, 37, 1–12. [Google Scholar]
  24. Zhang, Y.; Li, J.; Li, Z.; Zheng, J.; Wu, D.; Zhao, H. FENGYUN-4A advanced geosynchronous radiation imager layered precipitable water vapor products’ comprehensive evaluation based on quality control system. Atmosphere 2022, 13, 290. [Google Scholar] [CrossRef]
  25. Li, S.; Hu, H.; Fang, C.; Wang, S.; Xun, S.; He, B.; Wu, W.; Huo, Y. Hyperspectral Infrared Atmospheric Sounder (HIRAS) atmospheric sounding system. Remote Sens. 2022, 14, 3882. [Google Scholar] [CrossRef]
  26. Di, D.; Li, J.; Han, W.; Yin, R. Geostationary hyperspecral infrared sounder channel selection for capturing fast-changing atmospheric information. IEEE Trans. Geosci. Remote Sens. 2021, 60, 4102210. [Google Scholar]
  27. Irion, F.W.; Kahn, B.H.; Schreier, M.M.; Fetzer, E.J.; Fishbein, E.; Fu, D.; Kalmus, P.; Wilson, R.C.; Wong, S.; Yue, Q. Single-footprint retrievals of temperature, water vapor and cloud properties from AIRS. Atmos. Meas. Tech. 2018, 11, 971–995. [Google Scholar] [CrossRef] [Green Version]
  28. Andrey-Andres, J.; Fourrie, N.; Guidard, V.; Armante, R.; Brunel, P.; Crevoisier, C.; Tournier, B. A simulated observation database to assess the impact of the IASI-NG hyperspectral infrared sounder. Atmos. Meas. Tech. 2018, 11, 803–818. [Google Scholar] [CrossRef] [Green Version]
  29. Nalli, N.R.; Tan, C.; Wilson, M.; Borg, L.; Morris, V.R. Validation of atmoshperic profile retrievals from the SNPP NOAA-unique combined atmospheric processing system. Part 1: Temperature and moisture. IEEE Trans. Geosci. Remote Sens. 2018, 56, 180–190. [Google Scholar] [CrossRef]
  30. Hu, J.; Bao, Y.; Liu, J.; Liu, H.; Petropoulos, G.; Katsafados, P.; Zhu, L.; Cai, X. Temperature and Relative Humidity Profile Retrieval from Fengyun-3D/HIRAS in the Arctic Region. Remote Sens. 2021, 13, 1884. [Google Scholar] [CrossRef]
  31. Yang, J.; Zhang, Z.; Wei, C.; Lu, F.; Guo, Q. Introducing the new generation of Chinese geostationary weather satellites, Fengyun-4. Bull. Am. Meteorol. Soc. 2017, 98, 1637–1659. [Google Scholar] [CrossRef]
  32. Gholary, A.; Kreinovich, V.; Kosheleva, O. Why 70/30 or 80/20 Relation Between Training and Testing Sets: A Pedagogical Explanation; Departmental Technical Reports (CS), University of Texas at El Paso: El Paso, TX, USA, 2018. [Google Scholar]
  33. Collard, A.D. Selection of IASI channels for use in numerical weather prediction. Q. J. R. Meteorol. Soc. 2007, 133, 1977–1991. [Google Scholar] [CrossRef]
  34. Fourrié, N.; Thépaut, J.N. Evaluation of the AIRS near-real-time channel selection for application to numerical weather prediction. Q. J. R. Meteorol. Soc. 2003, 129, 2425–2439. [Google Scholar] [CrossRef]
  35. Ventress, L.; Dudhia, A. Improving the selection of IASI channels for use in numerical weather prediction. Q. J. R. Meteorol. Soc. 2014, 140, 2111–2118. [Google Scholar] [CrossRef]
  36. Yang, Y.H.; Yin, Q.; Shu, J. Channel selection of atmosphere vertical sounder (GIIRS) onboard the FY-4A geostationary satellite. J. Infrared Millim. Waves 2018, 37, 545–552. [Google Scholar]
  37. Lerner, J.A.; Weisz, E.; Kirchengast, G. Temperature and humidity retrieval from simulated Infrared Atmospheric Sounding Interferometer (IASI) measurements. J. Geophys. Res. 2002, 107, 4189. [Google Scholar] [CrossRef] [Green Version]
  38. Strow, L.L.; Desouza-Machado, S. Establishment of AIRS climate-level radiometric stability using radiance anomaly retrievals of minor gases and sea surface temperature. Atmos. Meas. Tech. 2020, 13, 4619–46440. [Google Scholar] [CrossRef]
  39. Coopmann, O.; Guidard, V.; Fourrié, N.; Josse, B.; Marecal, V. Update of infrared atmospheric sounding interferometer (IASI) channel selection with correlated observation errors for numerical weather prediction (NWP). Atmos. Meas. Tech. 2020, 13, 2659–2680. [Google Scholar] [CrossRef]
  40. Susskind, J.; Barnet, C.D.; Blaisdell, J.M. Retrieval of Atmospheric and Surface Parameters From AIRS/AMSU/HSB Data in the Presence of Clouds. IEEE Trans. Geosci. Remote Sens. 2003, 41, 390–409. [Google Scholar] [CrossRef]
  41. Kaplan, L.D.; Chahine, M.T.; Susskind, J.; Searl, J.E. Spectral band passes for a high precision satellite sounder. Appl. Opt. 1977, 16, 322–325. [Google Scholar] [CrossRef]
  42. Liu, H.; Dong, C.; Zhang, W.; Zhang, P. Retrieval of clear-air atmospheric temperature profiles using AIRS observations. Acta Meteorol. Sin. 2008, 66, 513–519. [Google Scholar]
  43. Rodgers, C.D. Information content and optimization of high-spectral-resolution measurements. Adv. Space Res. 1998, 21, 361–367. [Google Scholar] [CrossRef]
  44. Rabier, F.; Fourrie, N.; Chafai, D.; Prunet, P. Channel selection methods for Infrared Atmospheric Sounding Interferometer radiances. Q. J. R. Meteorol. Soc. 2002, 128, 1011–1027. [Google Scholar] [CrossRef] [Green Version]
  45. Rodgers, C.D. Inverse Methods for Atmospheric Sounding: The Theory and Practice; World Scientific: Singapore, 2000; pp. 33–38. [Google Scholar]
  46. Guan, L. A Study on Infrared Hyperspectral Measurements and Its Application on Cloud Detection, Cloud-Clearing and Atmospheric Sounding Profile. Ph.D. Thesis, Nanjing University of Information Science and Technology, Nanjing, China, 2005. [Google Scholar]
  47. Feng, J.; Huang, Y.; Qu, Z. An observing system simulation experiment (OSSE)-based assessment of the retrieval of above-cloud temperature and water vapor using hyperspectral infrared sounder. Atmos. Meas. Tech. 2020, preprint. [Google Scholar] [CrossRef]
  48. Li, J.; Wolf, W.W.; Menzel, W.P.; Zhang, W.; Huang, H.-L.; Achtor, T.H. Global soundings of the atmosphere from ATOVS measurements: The algorithm and validation. J. Appl. Meteorol. 2000, 39, 1248–1268. [Google Scholar] [CrossRef]
  49. Liu, Q.; Weng, F. One-Dimensional variational retrieval algorithm of temperature, water vapor, and cloud water profiles from advanced microwave sounding unit (AMSU). IEEE Trans. Geosci. Remote Sens. 2005, 43, 1087–1095. [Google Scholar]
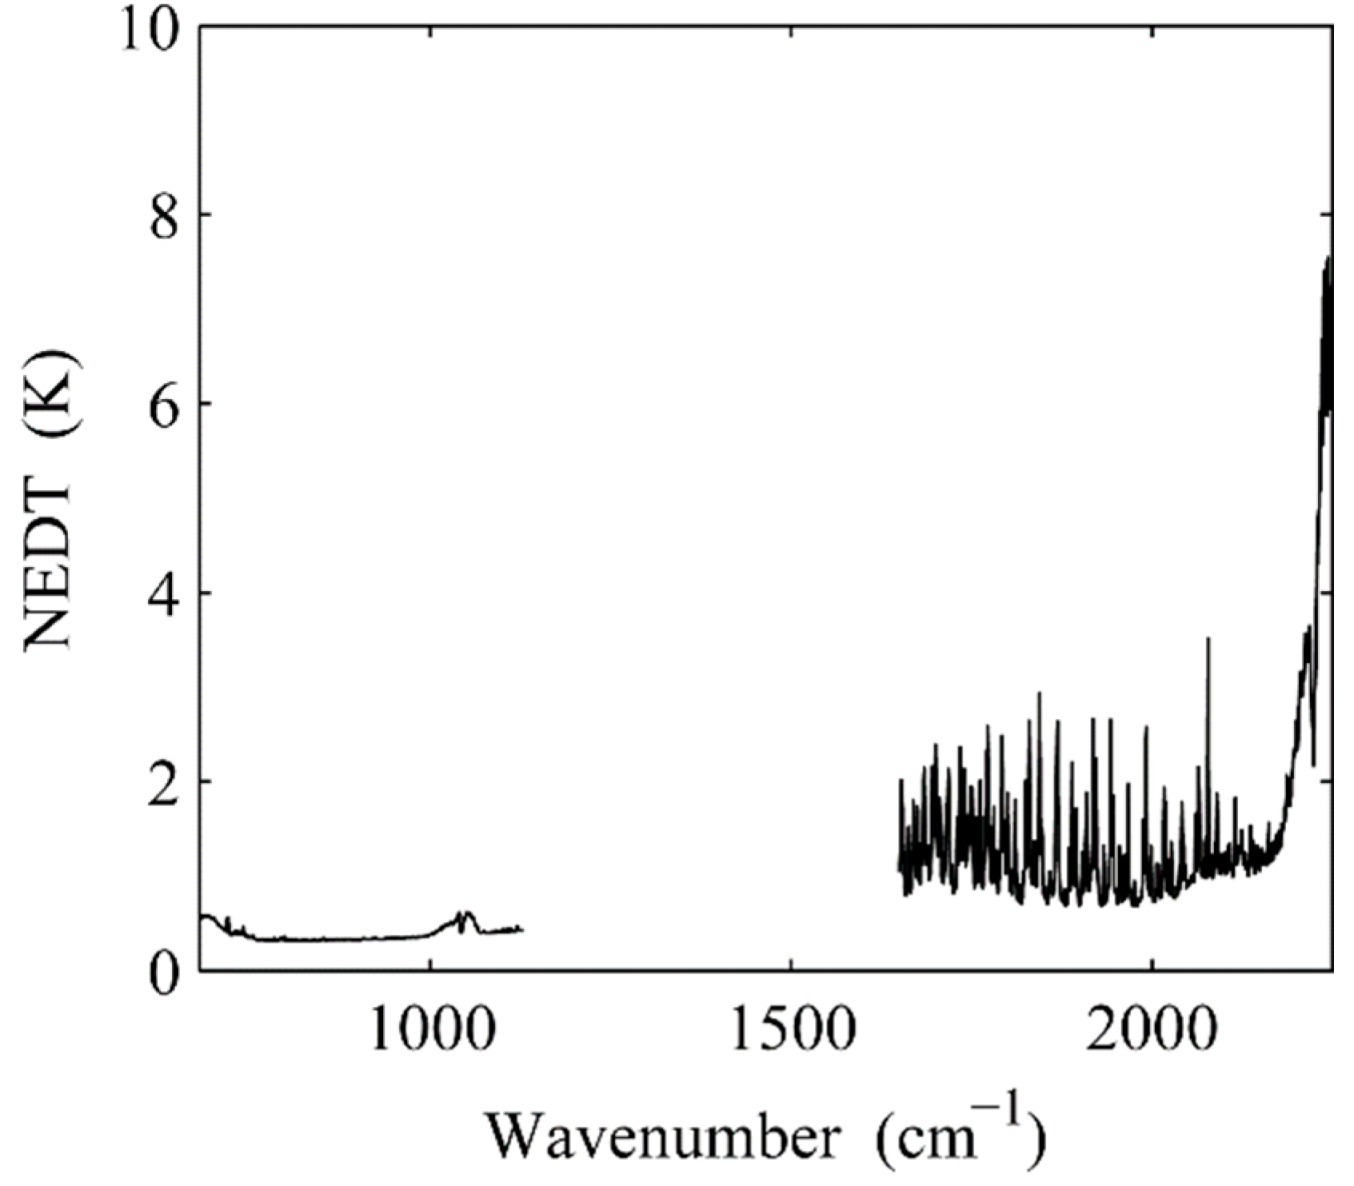
Figure 1. The observation error of GIIRS.
Atmosphere 13 01830 g001
Figure 2. The absorption spectra of the main atmospheric components at sea level: (a) Long wave infrared; (b) Medium wave infrared.
Atmosphere 13 01830 g002
Figure 3. The distribution of the selected channels of the four groups: (a) FY−4A; (b) FY−4B.
Atmosphere 13 01830 g003
Figure 4. The process of the multiple cycling utilization of the physical retrieval method.
Atmosphere 13 01830 g004
Figure 5. The retrieval results of FY-4A: (a) Temperature RMSE; (b) Humidity RMSE; (c) Temperature BIAS; (d) Humidity BIAS. Numbers 1–7 represent multiple retrieval results.
Atmosphere 13 01830 g005
Figure 6. The retrieval result of FY-4B: (a) Temperature RMSE; (b) Humidity RMSE; (c) Temperature BIAS; (d) Humidity BIAS.
Atmosphere 13 01830 g006
Figure 7. The retrieval results of FY-4A and FY-4B. Red lines plot FY-4B. Blue lines plot FY-4A: (a) Temperature RMSE; (b) Temperature BIAS; (c) Temperature RMSE difference between FY-4A and FY-4B; (d) Humidity RMSE; (e) Humidity BIAS; (f) Humidity RMSE difference between FY-4A and FY-4B.
Atmosphere 13 01830 g007
Figure 8. The temperature Jacobians of the selected temperature channels: (a) The selected channels of FY-4A; (b) The selected channels of FY-4B; (c) 32 selected channels that FY-4B has more than FY-4A.
Atmosphere 13 01830 g008
Figure 9. The temperature retrieval results of FY-4A and FY-4B with different temperature perturbations: (a) RMSE of FY-4A; (b) BIAS of FY-4A; (c) RMSE of FY-4B; (d) BIAS of FY-4B.
Atmosphere 13 01830 g009
Figure 10. The humidity retrieval results of FY-4A and FY-4B with different temperature perturbations: (a) RMSE of FY-4A; (b) BIAS of FY-4A; (c) RMSE of FY-4B; (d) BIAS of FY-4B.
Atmosphere 13 01830 g010
Table 1. The basic parameters of satellite-borne hyperspectral infrared atmosphere vertical sounder.
SatelliteInstrumentTechniqueSpectral Range/cm−1Spectral Resolution/cm−1ChannelsSpatial Resolution
/km
EOS-AquaAIRSGS650–1135
1215–1615
2180–2665
0.5
1.2
2
237813
MetOpIASIMI645–27600.5846112
MetOpIASI-NGMI645–27600.251692212
MTGIRSMI680–1210
1600–2250
~0.619604
SNPPCrISMI650–1095
1210–1750
2155–2550
0.625
1.25
2.5
130514
FY-3DHIRASMI667–1136
1210–1750
2155–2550
0.625
1.25
2.5
134316
FY-4AGIIRSMI700–1130
1650–2250
0.625165016
FY-4BGIIRSMI680–1130
1650–2250
0.625168212
GS = Grating Spectrometer, MI = Michelson Interferometer.
Table 2. The parameters of FY-4 GIIRS.
ParametersFY-4A (R&D)FY-4B (Operational)
Spectral Parameters(Normal mode)Spectral range
(cm−1)
ResolutionChannelsSpectral range
(cm−1)
ResolutionChannels
LWIR700–1130 0.625689LWIR680–11300.625721
MWIR1650–22500.625961MWIR1650–22500.625961
VIS0.55–0.75 μm--1VIS0.55–0.75 μm--1
Spatial ResolutionLWIR/MWIR16 km SSPLWIR/MWIR12 km SSP
VIS2 km SSPVIS1 km SSP
Operational ModeChina area5000 × 5000 km2China area5000 × 5000 km2
Mesoscale area1000 × 1000 km2Mesoscale area1000 × 1000 km2
Temporal ResolutionChina area60 minChina area45 min
Mesoscale area<0.5 hMesoscale area15 min
Sensitivity (mW/m2sr cm−1)LWIR0.5–1.1LWIR<0.5
MWIR0.1–0.14MWIR<0.1
VISS/N > 200 (ρ = 100%)VISS/N > 200 (ρ = 100%)
Calibration accuracy (radiation)1.5 k (3σ)0.7k (3σ)
Calibration accuracy (spectrum)10 ppm (3σ)<10 ppm (3σ)
Quantization Bits1313
LWIR = Long Wave Infrared, MWIR = Mid Wave Infrared, VIS = Visible light, SSP = Sub Satellite Position.
Table 3. The errors of the seven retrievals.
The Retrieval NumberFY-4AFY-4B
TemperatureHumidityTemperatureHumidity
RMSE/KBIAS/KRMSE/%BIAS/%RMSE/KBIAS/KRMSE/%BIAS/%
12.23 −0.73 14.37 −2.91 2.17 −1.04 13.82 −4.08
21.73 −0.56 12.45 −1.85 1.69 −0.67 11.96 −2.61
31.52 −0.41 11.65 −1.22 1.48 −0.48 11.21 −1.77
41.40 −0.30 11.31 −0.73 1.35 −0.36 10.84 −1.16
51.33 −0.22 11.20 −0.34 1.27 −0.28 10.64 −0.69
61.28 −0.17 11.09 −0.03 1.21 −0.21 10.53 −0.33
71.24 −0.12 11.06 0.23 1.17 −0.17 10.46 −0.04
Table 4. The retrieval accuracy of FY-4A and FY-4B corresponding to the pressure.
Pressure/hPaTemperature RMSE/KRelative Humidity RMSE/%
FY-4AFY-4BFY-4AFY-4B
1042.10 1.98 14.26 14.25
1411.56 1.29 9.05 8.10
1801.61 1.15 9.93 7.55
2161.22 1.00 11.96 9.71
2590.92 0.87 8.21 7.73
2960.75 0.64 8.54 7.35
3510.62 0.53 7.51 7.08
3980.62 0.58 6.98 6.83
5060.56 0.53 10.10 9.58
6090.95 0.89 9.87 9.53
7110.73 0.70 11.57 11.49
8461.38 1.38 13.54 13.18
9751.64 1.64 13.16 12.63
10082.18 2.17 13.88 13.19
Publisher’s Note: MDPI stays neutral with regard to jurisdictional claims in published maps and institutional affiliations.