Abstract
India being the world’s second largest cultivator of paddy, it is very important that the extent of the resulting methane emissions is estimated, and steps are taken to minimize these emissions. Peninsular India is a prime rice-producing region; however, no significant information is available on the contribution of this region to methane emissions, nor are there available studies that show the effect of cultivars, growth seasons, soil characteristics, etc., on methane emissions. As one of the attempts to cover this knowledge gap, emissions of methane from paddy fields, situated in four villages of Puducherry, India, involving three rice cultivars, three soil types and two growth seasons have been studied. All the fields had a continuously flooded pattern of irrigation with water supplied at a rate of 11,500–20,000 m3/ha. Whereas the cultivars ADT 39 and ADT 45 generated the highest methane flux during their reproductive phase, with lesser emission during the vegetative phase and much less during maturity, CO 45 exhibited copious methane emissions during the vegetative phase, with several orders of magnitude lesser emission during the reproductive and the maturity phases. These trends were independent of the location of the field and soil type, though the absolute and the relative values of the emissions varied from location to location. Irrespective of the cultivar, the quantities of methane emission increased linearly with soil temperature across the day but decreased exponentially as soil pH increased beyond 7.
1. Introduction
As per the most recent estimates of the Intergovernmental Panel on Climate Change [1], the concentration of methane (CH4) in the atmosphere has risen to 1866 ppb, which is more than double the levels that existed before the beginning of the industrial revolution. Given [2] that molecule-to-molecule CH4 has 34 times greater global warming potential (GWP) than carbon dioxide (CO2), this rise is capable of causing catastrophic impact.
Rice paddies and natural wetlands are estimated to contribute as much as 41% of global CH4 emissions [3,4,5], even as some estimates give lower figures, starting from 12% [6].
Rice is a highly water-intensive crop, and paddy fields are intermittently waterlogged [7,8,9]. In this condition, the organic matter, which is normally present on and near the soil surface in agricultural fields, starts decomposing aerobically [10,11]. This leads to rapid depletion of dissolved oxygen in the overlying water till anoxic conditions develop and the nature of biodegradation shifts from aerobic to anaerobic. Whereas the main product of the former is CO2, the latter generates ‘biogas’, which is an approximately 3:1 (v/v) mixture of CH4 and CO2 [12]. In view of much greater GWP of CH4, this shift in the nature of biodegradation results in much greater contribution to global warming per unit mass of organic carbon that is mineralized. For this reason, it becomes exceedingly important to find ways and means by which factors that contribute to methane emission during paddy cultivation are identified, and their influence is eliminated or minimized.
The studies carried across the world out so far indicate that the magnitude of CH4 emissions from rice plants is regulated by complex and dynamic interactions occurring among the plants, the environment, and microorganisms [5,13,14]. Methane produced in flooded rice soils is emitted to the atmosphere by molecular diffusion, ebullition or plant-mediated transport [15,16]. Approximately 80–90% of the total CH4 flux is emitted to the atmosphere from the rhizosphere via the rice plant [17,18,19]. An increase in plant biomass [20] and tiller number [21] enhances CH4 oxidization activity by enlarging the volume of aerenchyma and enhancing O2 transport from the atmosphere to the rhizosphere [19]. Ma et al. [22] have revealed that a hybrid rice variety with 50–60% higher shoot biomass emitted less CH4 than an indica rice variety, possibly due to higher CH4 oxidization activity. However, in situations when other factors such as the type of cultivar, fertilization, and soil are similar, it is the manner in which irrigation is carried out in a paddy field that appears to exert the strongest influence on CH4 emissions [23].
Given this background, it is exceedingly important and urgent to assess CH4 emissions occurring from the presently used practices of paddy cultivation to find ways of reducing the emissions. However, as we have pointed out recently [24,25], despite India being the second largest cultivators of rice in the world, very few studies on the emission of CH4 from Indian rice fields have been carried out. Moreover, the 112 studies that do exist in prior studies have very uneven region-wise distribution. The southern, peninsular region of India where these authors are situated is an example of this disparity. Whereas 18% of all Indian rice production is contributed by the six states of this region, only 12 reports are available on rice field CH4 emissions in this region, with two of the states not studied at all.
The situation vis a vis another global warming gas, nitrous oxide (N2O), is even more disturbing, with only 33 studies reported across India, of which a mere three are from the six southern states.
From the state of Puducherry, where the authors work, the first-ever report on methane emissions from rice cultivation has been published by these authors [25]. The study assessed the effect of fertilization with vermicompost in comparison to the use of synthetic chemical fertilizers (SCF) on CH4 emissions and grain yield from the rice cultivar Chinna Ponni. The study revolved round controlled, replicated experiments carried out under intermittent flooding. It showed that organic fertilizer led to marginally better yield in terms of grain quantity and size than SCF, without any significant influence on CH4 emission.
However, no study exists on CH4 emissions occurring from typical paddy fields in Puducherry, or the ones situated on the east coast of peninsular India in general, and which are predominantly under continuous flooding. The present work seeks to begin efforts towards bridging this critical knowledge gap.
The focus is to see the effect of different cultivars on CH4 emissions as influenced by (a) growth stages (vegetative, reproductive, maturity), (b) growth seasons (‘wet’, ‘dry’), (c) soil temperature, and (d) soil pH—all under identical manner of farming, fertilization, and irrigation. It is also aimed at identifying the factors which significantly influence CH4 emissions.
2. Materials and Methods
The present study covers three rice varieties—ADT 39, ADT 45, and CO 45—that are commonly grown in Puducherry and Tamil Nadu (with which Puducherry is land-locked at three sides). Methane emissions from farmers’ fields growing these varieties in four villages of Puducherry—Chettikuppam, Kailaankuppam, Konnimedu, and Manjakuppam—were assessed. The studies covered both the seasons during which paddy is cultivated in the study area—the ‘wet’ season spanning October–January, during which ambient temperatures are lower than the annual average and there are frequent and intense rains, and the ‘dry’ season, encompassing late February–May, when ambient temperatures are higher than the annual average and the rains are very rare.
2.1. The Study Area
The location of the four villages is depicted in Figure 1. These lie at 12°5′12.13″ N latitude and 79°53′15.43″ E longitude, with humid tropical climate characterized by average annual minimum and maximum temperatures in the ranges 25.7 ± 2.7–35.6 ± 3.3 °C and 23.2 ± 2.2–29.3 ± 2.3 °C for days and nights, respectively. The relative humidity averages 64 ± 7% during days and 75.5 ± 3.5% during nights.
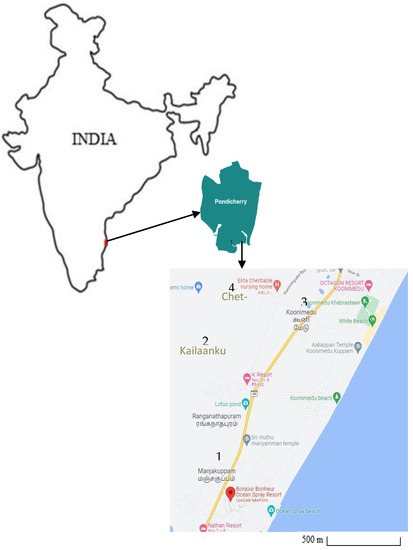
Figure 1.
Location of the study area.
2.2. Manner of Farming
From the start of nursery to harvesting of rice, the ADT 39 and ADT 45 varieties needed 120 days while the CO 45 required 135 days. Fertilization was conducted with nitrogen (N) in the form of urea (carbamide), phosphorous (P) in the form of calcium dihydrogen phosphate, and potassium (K) in the form of potassium chloride, at a rate of 260, 375, and 100 kg/ha, respectively. Of these, N and K were applied in four equal doses at the basal, tillering, panicle initiation, and heading stages of cultivation while the entire P was applied at the basal stage. Thirty-day old seedlings were transplanted in the hills spaced 10 cm apart, and the rows of hills were separated from each other by 20 cm. Three seedlings were transplanted per hill formation in the field, which had been thoroughly ploughed, puddled, and levelled. For the first 7 days after transplantation, the water level was maintained at about 2 ± 1 cm above soil surface in the field. It was then raised to about 5 ± 2 cm and maintained at that level until fourteen days before harvesting. The monitoring of water levels was performed with the help of marked wooden sticks placed at several points in each field. The water was then drained off and the field allowed to dry in preparation for the harvest. Pest and disease control were performed with metaminostrobin, carbendazim, thiamethoxam, and neem oil, applied at different stages of the cultivation, at a rate of 500 mL/ha, 500 g/ha, 100 g/ha, and 15 l/ha respectively. Deweeding was performed manually.
2.3. Sampling and Analysis of Methane
As the paddy grew, CH4 emissions were measured at its vegetative, reproductive, and maturity stages. For this, a closed chamber technique for the collection of CH4 samples, as standardized by UNESCO/IHA (United Nations Educational, Scientific and Cultural Organization/International Hydropower Association), was employed [26]. It consisted of using bottomless polyvinyl chloride (PVC) chambers of 45 cm height and 38 cm inner diameter, which were equipped with thermometers for measuring temperatures inside and outside the chambers. Each chamber also contained a battery operated mini fan, which homogenized the air inside the chamber. The rice plants were covered with the chambers for 6 h (10:30 AM to 3:30 PM) as the chambers collected the gases being emitted at that location. Two chambers were employed per field which yielded 12 readings of hourly CH4 concentrations at each sampling location. For this, about 15 mL of gas sample was drawn from each chamber at hourly intervals with a syringe and transferred to pre-evacuated “exetainers” (Labco Ltd., Lampeter, UK) of 9 mL capacity, which have been found adequate at maintaining the integrity of the gas samples [27]. Silicone grease was applied to the septa after each sampling to ensure complete sealing of the septa.
The concentration of CH4 in each exetainer tube was analysed with a Varian 3600 gas chromatograph (GC) equipped with a Porapak Q packed glass column (80/100 mesh), and a flame ionization detector (FID). High-purity hydrogen was used as the carrier gas at a flow rate of 1.0 kg/cm2. The temperature of the column, injector, and detector were maintained at 60 °C, 100 °C, and 150 °C, respectively. Linearity check of the gas chromatograph was made intermittently by injecting the methane standards at regular intervals.
The CH4 flux was calculated as per the standardized protocol of the IHA [26]. As the GC provided CH4 concentration in terms of part per million (ppm) on volume (V/V) basis, it was converted to µg/m3 using the expression:
where C is the concentration read by GC (ppm); P is the atmosphere pressure (Pa); M is the molecular weight of CH4; R is the universal gas constant (8.314 Pa·m3/K·mol); and T is the ambient temperature (K).
The CH4 concentrations thus obtained were plotted against sampling time. The methane flux, F (µg/m2·h), was calculated with the expression:
where m is the slope (µg/m3·h) of the linear regression of CH4 concentration with time; V is volume of the air trapped in the chamber (m3); and A is the cross-sectional area of the chamber in contact with the surface (m2).
Weighted average (WE) of CH4 emission from each field was calculated using the formula:
where Ev, ER, and Em are the measured daily emissions at the vegetative, reproductive and maturity phases, and n1, n2 and n3 are number of days in the respective phase.
2.4. Other Measurements
Physico–chemical properties of the soils (Table 1) were determined as per standard methods [28] employing a Superfit Auto 11 digital pH meter, IR Infra Digi 503 digital conductivity meter, and Vario EL Cube V 3.1.8 CHNS elemental analyser. All the soils were of the order Anthrosol, as per the Food and Agricultural Organization of the United Nations [29].

Table 1.
Soil physico–chemical properties of the experimental fields.
2.5. Statistical Analysis
Regression–correlation as per Equation 2 was carried out by standard method [30], deploying the software Microsoft Excel. Assessment of the extent of statistical significance in the differences in CH4 emissions—occurring at different stages of the paddy cultivation of the individual cultivars as also across different cultivars—was assessed by appropriate ‘t’ tests [30]. For this too, the software Microsoft Excel was deployed. It was tested whether the ‘t’ test supports or rejects the null hypothesis of there being no difference between the sets of results being tested. The difference was accepted as significant if it occurred at confidence levels ≥ 95% (p ≤ 0.05).
3. Results and Discussion
3.1. General
A typical set of duplicate measurements of CH4 emissions, and their correlation with time, is shown in Figure 2. These yielded CH4 flux values of 1.3 and 1.6 mg/m2·h, agreeing with each other within a relative error of ±14.5%. Most other duplicate measurements agreed within this range, the maximum ‘disagreement’ was in the range of ±20%. Considering that complex biological systems were involved, the extent of agreement between replicates can be considered as very good.
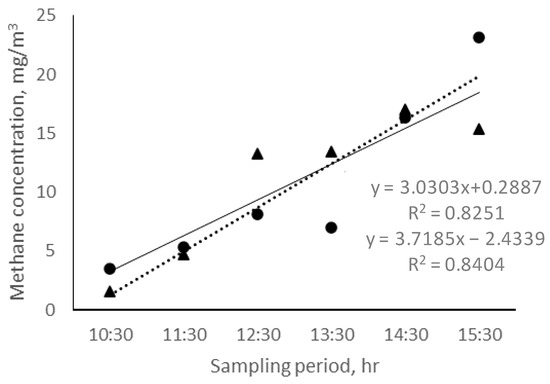
Figure 2.
Hourly CH4 concentration emitted from rice fields.  Chamber 1 and
  chamber 2.
Chamber 1 and chamber 2.
Two of the paddy fields surveyed had sandy loam soil and one had clay loam. All the three fields were about twice as rich in organic carbon as the fourth field, at Chettikuppam, which was made up of loam. This indicates that the present study encompasses a wide range of conditions. However, due to identical quantities of fertilizer application, all the farms had similar concentrations of available nitrogen, and all had very low C/N ratio, ≤2.1.
3.2. Methane Emission from ADT 39 in ‘Wet’ Season
The CH4 flux from the fields cultivated with ADT 39 in the ‘wet’ season, as assayed at three locations, is presented in Table 2. In all locations the cultivar emitted maximum CH4 during the middle growth (‘reproductive’) phase of about 25 days. The emissions of CH4 in this stage were significantly higher (p ≤ 0.05) than the emissions occurring in the vegetative or the maturity phases in all cases. The sole exception was at Chettikuppam, where the difference in the emissions of vegetative stage was not significantly different from the emissions of the reproductive stage, even as the difference between the reproductive and the maturity phases was highly significant. At Kailaankuppam and Manjakuppam, the emissions during the early (‘vegetative’) growth phase were about half that at the reproductive phase but at Chettikuppam the difference was a mere 10%. In all fields the emissions were negligible during the maturity phase. The weighted average emissions were 3.2 ± 0.6, 1.4 ± 0.5, and 2.0 ± 0.5 mg/m2·h, translating to overall CH4 emissions of 68.6, 29.5, and 43.4 kg/ha from the ADT 39 cultivation at Chettikuppam, Kaliaankuppam, and Manjakuppam, respectively. Of these, the difference in the weighted average emissions between the Chettikuppam and Kaliankuppam sites were statistically significant. The CO2-equivalent figures followed the same trend. This indicates that some factors other than cultivar, manner of farming, and manner of irrigation—which were similar in the three locations—may be exerting an influence on the net emissions caused by ADT 39.
Table 2.
Methane emissions from ADT 39 cultivation in three villages of Puducherry during ‘wet’ season.
3.3. Methane Emission from ADT 45 in ‘Dry’ Season
The CH4 emissions from the cultivation of ADT 45 occurring in ‘dry’ season at a field in the village of Koonimedu, Puducherry, is recorded in Table 3. Similar to the trend seen with ADT 39 cultivated in the wet season, the maximum CH4 emission from ADT 45 also occurred during the reproductive growth stage. It was followed by much lesser emission at the vegetative stage and negligible emission at the maturity stage. The differences in the emissions occurring at different stages were all statistically significant (p ≤ 0.05).
Table 3.
Methane emission from ADT 45 rice field cultivated in ‘dry’ season at Koonimedu, Puducherry.
Interestingly, the difference in the emissions occurring between reproductive and vegetative phases in case of ADT 45 was much larger (2.1 mg/m2·h) in comparison to the range 0.5–2.0 mg/m2·h, seen with ADT 39. However, despite this, the weighted average emission in case of ADT 45—2.63 ± 0.4 (Table 3)—is within the range 2.0 ± 0.5–3.2 ± 0.6 mg/m2·h emitted by ADT 39 (Table 2). The overall CH4 emission occurring during the ADT 45 cultivation—56.9 ± 7.8 kg/ha—was also within the range emitted by ADT 39: 29.5–68.6 kg/ha. This indicates that differences in the CH4 emissions occurring in different growth stages of the cultivar are evened out when net CH4 emissions during the overall cultivation are considered.
3.4. Methane Emission from CO 45 in ‘Dry’ and ‘Wet’ Seasons
Methane emission from the cultivar CO 45 was measured in a rice field situated in the village of Manjakuppam, Puducherry, in which successive crops of CO 45 were grown in ‘wet’ and ‘dry’ seasons. The findings are summarized in Table 4.
Table 4.
Methane emission from CO 45 rice variety cultivated during successive wet and dry seasons at a field in Manjakuppam, Puducherry.
In sharp contrast to the pattern shown by the two ADT cultivars, over 96% of all methane emissions from CO 45 occurred during its vegetative (early growth) stage. The reproductive stage contributed to less than 4%. Only with respect to the maturity stage did the CO variety displayed a behaviour similar to the ADT cultivars, providing negligible emissions of methane. In all cases, differences in the levels of CH4 emission during the three stages of cultivation were statistically significant at 95–99.5% confidence levels.
The weighted average ‘wet’ season emissions from CO 45—10.0 ± 0.9 mg/m2·h—were more than three times the highest weighted average emission recorded with the two ADT cultivars—3.2 ± 0.6 mg/m2·h (Table 2). The ‘dry’ season emissions from CO 45 were still higher, almost double the ‘wet’ season emissions (Table 4). The differences were highly significant (p ≤ 0.5), making it clear that CO 45 is not a desirable cultivar when its contribution to CH4 emission is considered. It also seemed to suggest that if CH4 emissions from CO 45 are to be reduced, efforts should be focused on controlling them at the vegetative (early growth) stage of CO 45 cultivation.
3.5. Effect of Soil Temperature
The pattern of CH4 emissions as influenced by soil temperature, during all the three growth stages of ADT 39, are shown in Figure 3. The emissions are seen to increase in direct proportion to the increase in soil temperature, the correlation coefficients (R2) exceeding 0.77. Similar trends were seen with ADT 39 at Manjakuppam and Chettikuppam, and with ADT 45. The CO 45 cultivator also displayed a similar trend in both seasons of the study.
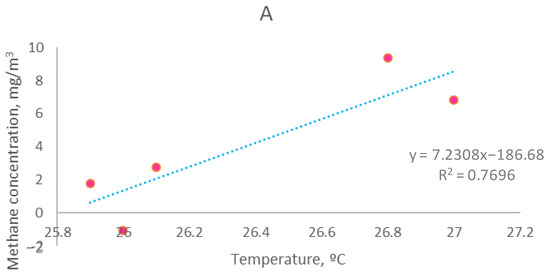
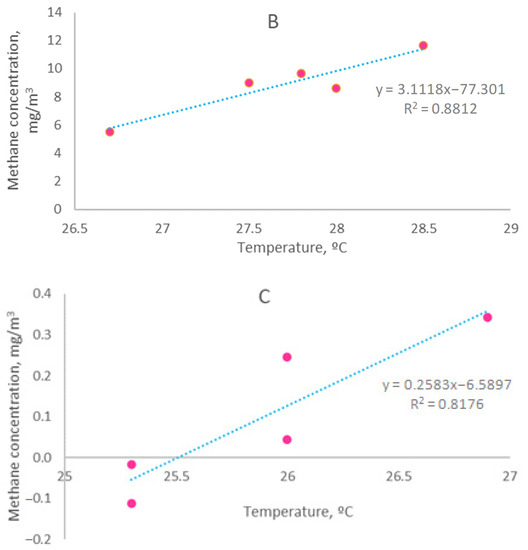
Figure 3.
Relationship between hourly methane emission and temperature for ADT 39 rice cultivar at Kailaankuppam during all three major stages of cultivation: (A) vegetative, (B) reproductive, and (C) maturity.
The maximum soil temperature observed in these studies was 28.5 °C. At higher soil temperatures, CH4 emissions are likely to be higher because the rate of fermentation caused by mesophilic anaerobic bacteria—which leads also to the generation of the methane-carbon dioxide mixture, or ‘biogas’, as mentioned earlier—increases with temperature till 35 °C [12,31].
3.6. Effect of Soil pH
CH4 emissions fell exponentially when soil pH increased beyond seven. This was seen for crops grown in wet as well as dry seasons, as illustrated in Figure 4. Anaerobic microorganisms function well until the pH is about 8.2; however, pH greater than 7 inhibits the stages of cellulolysis and acidogensis that precede the methanogenesis phase [32]. For generation of methane to occur, there should be availability of volatile fatty acids (VFAs) produced in the previous stages for methanogens to utilize. Rise in the soil pH evidently hampers VFA formation, and the effect is strong enough to cause an exponential fall in CH4 emissions.
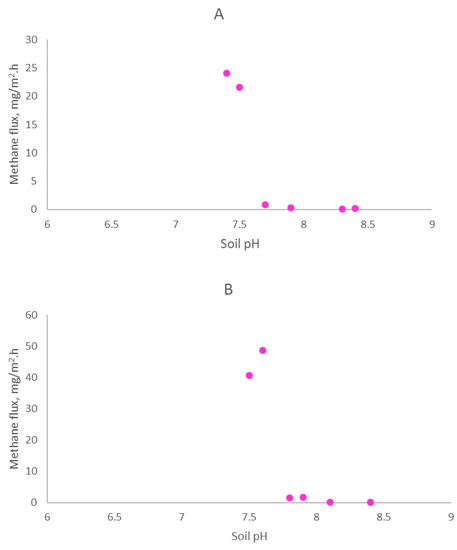
Figure 4.
Relationship between the methane emissions and pH for the cultivation CO 45 grown in Manjakuppam during (A) wet and (B) dry seasons.
3.7. Present Findings in the Context of the Prior Art
A large number of factors have been reported that may be influencing CH4 emissions from paddy fields. These include (a) physiological features of the rice cultivar [19,33,34], including panicle, leaves, stem, and root; (b) overall cultivar biomass; (c) rate of photosynthesis achieved by the cultivar; (d) soil characteristics [8,35,36], especially pH, temperature, and organic carbon content; (e) local meteorology; etc.
However, the factor that seems to exert the most profound influence on methane emission during rice cultivation, becoming its main driving force, is the manner of irrigation and the consequent water regime in the paddy field. As stated in Section 1, water in flooded rice fields tends to lose its dissolved oxygen due to aerobic biodegradation, turning it anoxic [8]. This shifts the nature of biodegradation towards anaerobic and causes methane to be emitted as the principle metabolic product instead of CO2. Due to the much greater GWP of CH4 in comparison to CO2, the resulting GWG emissions, per unit mass of organic carbon decomposed, have much greater CO2 equivalence than the GWGs resulting from aerobic decomposition [11,37]. This factor is independent of the cultivar, the quality of the flooded water, and agricultural practices other than the manner of irrigation. It calls for an overriding emphasis on irrigation practices that minimise flooding [34,38]. Moreover, as shown in the present work, the type of cultivar can exert a very strong influence on CH4 emission when other conditions associated with the cultivation are identical. This underscores the need for comparative studies on CH4 emissions by different cultivars and a short listing of varieties which cause lesser GHG emissions. Use of shorter-duration cultivars can also cut CH4 emissions [39]. Furthermore, as has been shown recently [40,41], intermittently irrigated paddy cultivation reduces CH4 emissions without causing concomitant increases in N2O emissions.
4. Summary and Conclusions
In the context of great paucity of information on methane emissions occurring in peninsular India—despite 17.5% of all-India’s land area being under rice cultivation in that region, the present study was undertaken. Methane emissions occurring in five different rice fields, situated in four villages of Puducherry, cultivating three different rice varieties but all under a continuously flooded pattern were assessed covering the vegetative, reproductive, and maturity stages of each cultivation. The rice fields belonged to three different soil types and emissions occurring in both the rice growing seasons—the ‘wet’ season spanning October–January and the ‘dry’ season covering late February–May—were assessed. It was seen that cultivars ADT 39 and ADT 45 generated the highest methane flux during their reproductive phase, with lesser emission during vegetative phase and much lesser during maturity. In contrast, the CO 45 exhibited copious methane emissions during the vegetative phase, with several orders of magnitude lesser emission during the reproductive and the maturity phases. These trends were independent of the location of the field and soil type, though the absolute and relative values of the emissions varied from location to location. Irrespective of the cultivar, the quantities of methane emission increased linearly with soil temperature across the day but decreased exponentially as soil pH increased beyond seven.
The present study indicates that with the manner of irrigation remaining the same, the type of cultivar can play a major role in the extent of methane emissions from rice cultivation. Future work should assess the role of commonly used cultivars in conjunction with the impact of continuous versus intermittent flooding, to shortlist the varieties that emit the least global warming gases.
Author Contributions
Conceptualization, T.A., D.C., and S.A.A.; methodology, D.C., and T.A.; investigation, D.C.; resources, T.-A., T.A., and S.A.A.; writing, D.C., T.-A. and S.A.A.; supervision, T.A. and S.A.A. All authors have read and agreed to the published version of the manuscript.
Funding
The Council of Scientific and Industrial Research (CSIR), New Delhi, for the Emeritus Scientist grant (21(1034)/16/EMR-II).
Institutional Review Board Statement
Ethical review and approval were waived for this study because it involves no toxification, injuring, or harming any humans/animals in any manner.
Informed Consent Statement
Yes. They have concented.
Data Availability Statement
Any data not reported in the paper will be provided on request.
Acknowledgments
S.A.A. thanks the Council of Scientific and Industrial Research (CSIR), New Delhi, for the Emeritus Scientist grant (21(1034)/16/EMR-II), which enabled him to oversee and document this study.
Conflicts of Interest
The authors declare that there are no conflict of interest associated with this work.
References
- IPCC. 2021: Climate Change 2021: The Physical Science Basis. Contribution of Working Group I to the Sixth Assessment Report of the Intergovernmental Panel on Climate Change; Masson-Delmotte, V., Zhai, P., Pirani, A., Connors, S.L., Péan, C., Berger, S., Caud, N., Chen, Y., Goldfarb, L., Gomis, M.I., et al., Eds.; Cambridge University Press: Cambridge, UK, 2021; in press. [Google Scholar]
- Shindell, D.T.; Faluvegi, G.; Koch, D.M.; Schmidt, G.A.; Unger, N.; Bauer, S.E. Improved attribution of climate forcing to emissions. Science 2009, 326, 716–718. [Google Scholar] [CrossRef] [PubMed]
- Duchemin, É.; Lucotte, M.; Canuel, R.; Soumis, N. First assessment of methane and carbon dioxide emissions from shallow and deep zones of boreal reservoirs upon ice break-up. Lakes Reserv. Res. Manag. 2006, 11, 9–19. [Google Scholar] [CrossRef]
- Nan, Q.; Wang, C.; Wang, H.; Yi, Q.; Wu, W. Mitigating methane emission via annual biochar amendment pyrolyzed with rice straw from the same paddy field. Sci. Total Environ. 2020, 746, 141351. [Google Scholar] [CrossRef] [PubMed]
- Shinoda, R.; Bao, Z.; Minamisawa, K. CH4 oxidation-dependent 15N2 fixation in rice roots in a low-nitrogen paddy field and in Methylosinus sp. strain 3S-1 isolated from the roots. Soil Biol. Biochem. 2019, 132, 40–46. [Google Scholar] [CrossRef]
- Kurnik, J.; Devine, K. Innovation in Reducing Methane Emissions from the Food Sector: Side of Rice, Hold the Methane. World Wildlife Fund. 2022. Available online: https://www.worldwildlife.org/blogs/sustainability-works/posts/innovation-in-reducing-methane-emissions-from-the-food-sector-side-of-rice-hold-the-methane#:~:text=Rice%2C%20one%20of%20the%20most,of%20total%20greenhouse%20gas%20emissions (accessed on 13 September 2022).
- Turetsky, M.R.; Kotowska, A.; Bubier, J.; Dise, N.B.; Crill, P.; Hornibrook, E.R.; Minkkinen, K.; Moore, T.R.; Myers-Smith, I.H.; Nykänen, H.; et al. A synthesis of methane emissions from 71 northern, temperate, and subtropical wetlands. Glob. Chang. Biol. 2014, 20, 2183–2197. [Google Scholar] [CrossRef]
- Xu, Y.; Li, Z.; Liu, H.; Zhai, X.; Li, R.; Song, P.; Jia, M. A model for assessing the compound risk represented by spontaneous coal combustion and methane emission in a gob. J. Clean. Prod. 2020, 273, 122925. [Google Scholar] [CrossRef]
- Zehnder, A.J.B. Ecology of methane formation. In Water Pollution Microbiology; Mitchell, R., Ed.; Wiley: New York, NY, USA, 1978; Volume 2, pp. 349–376. [Google Scholar]
- Abril, G.; Borges, A.V. Carbon dioxide and methane emissions from estuaries. In Greenhouse Gas Emissions—Fluxes and Processes; Springer: Berlin/Heidelberg, Germany, 2005; pp. 187–207. [Google Scholar]
- Song, K.; Zhang, G.; Yu, H.; Huang, Q.; Zhu, X.; Wang, T.; Xu, H.; Lv, S.; Ma, J. Evaluation of methane and nitrous oxide emissions in a three-year case study on single rice and ratoon rice paddy fields. J. Clean. Prod. 2021, 297, 126650. [Google Scholar] [CrossRef]
- Abbasi, T.; Tauseef, S.M.; Abbasi, S.A. Biogas Energy; Springer: New York, NY, USA; London, UK, 2012. [Google Scholar]
- Das, K.; Baruah, K.K. Methane emission associated with anatomical and morphophysiological characteristics of rice (Oryza sativa) plant. Physiologiaplantarum 2008, 1342, 303–312. [Google Scholar] [CrossRef]
- Dong, D.; Li, J.; Ying, S.; Wu, J.; Han, X.; Teng, Y.; Zhou, M.; Ren, Y.; Jiang, P. Mitigation of methane emission in a rice paddy field amended with biochar-based slow-release fertilizer. Sci. Total Environ. 2021, 792, 148460. [Google Scholar] [CrossRef]
- Abbasi, T.; Tauseef, S.M.; Abbasi, S.A. Global Warming and The Role of Wetlands; Lap Lambart Academic: Saarbrücken, Germany, 2011; xiv + 264 pages; ISBN 978-3846556009. [Google Scholar]
- Luithui, C.; Dhanuja, C.; Abbasi, T.; Abbasi, S.A. Greenhouse Gas Emissions and Wetlands: A Brief Review of the State-of-the-art. Int. J. Environ. Sci. Eng. Res. 2017, 8, 1–50. [Google Scholar]
- Setyanto, P.; Rosenani, A.B.; Boer, R.; Fauziah, C.I.; Khanif, M.J. The Effect of Rice Cultivars on Methane Emission from Irrigated Rice Field. 2004. Available online: http://repository.pertanian.go.id/handle/123456789/67 (accessed on 13 September 2022).
- Bhattacharyya, P.; Roy, K.S.; Das, M.; Ray, S.; Balachandar, D.; Karthikeyan, S.; Nayak, A.K.; Mohapatra, T. Elucidation of rice rhizosphere metagenome in relation to methane and nitrogen metabolism under elevated carbon dioxide and temperature using whole genome metagenomic approach. Sci. Total Environ. 2016, 542, 886–898. [Google Scholar] [CrossRef] [PubMed]
- Bhattacharyya, P.; Dash, P.K.; Swain, C.K.; Padhy, S.R.; Roy, K.S.; Neogi, S.; Berliner, J.; Adak, T.; Pokhare, S.S.; Baig, M.J.; et al. Mechanism of plant mediated methane emission in tropical lowland rice. Sci. Total Environ. 2019, 651, 84–92. [Google Scholar] [CrossRef] [PubMed]
- Eller, G.; Frenzel, P. Changes in activity and community structure of methane-oxidizing bacteria over the growth period of rice. Appl. Environ. Microbiol. 2001, 67, 2395–2403. [Google Scholar] [CrossRef] [PubMed]
- Dubey, S.K.; Singh, J.S. Spatio-temporal variation and effect of urea fertilization on methanotrophs in a tropical dryland rice field. Soil Biol. Biochem. 2000, 32, 521–526. [Google Scholar] [CrossRef]
- Ma, K.E.; Qiu, Q.; Lu, Y. Microbial mechanism for rice variety control on methane emission from rice field soil. Glob. Chang. Biol. 2010, 16, 3085–3095. [Google Scholar] [CrossRef]
- Kritee, K.; Nair, D.; Zavala-Araiza, D.; Proville, J.; Rudek, J.; Adhya, T.K.; Loecke, T.; Esteves, T.; Balireddygari, S.; Dava, O.; et al. High nitrous oxide fluxes from rice indicate the need to manage water for both long-and short-term climate impacts. Proc. Natl. Acad. Sci. USA 2018, 115, 9720–9725. [Google Scholar] [CrossRef]
- Dhanuja, C.; Abbasi, T.; Abbasi, S.A. Greenhouse gas emissions from paddy fields in peninsular South India. Int. J. Eng. Sci. Res. 2018, 6, 56–63. [Google Scholar]
- Dhaunja, C.; Saxena, D.K.; Abbasi, T.; Abbasi, S.A. Effect of application of vermicompost on methane emission and grain yield of ChinnaPonni paddy crop. Paddy Water Environ. 2019, 17, 797–802. [Google Scholar] [CrossRef]
- Goldenfum, J.A. UNESCO/IHA Greenhouse Gas (GHG) Research Project. 2009. Available online: https://unesdoc.unesco.org/ark:/48223/pf0000183167 (accessed on 13 September 2022).
- Laughlin, R.J.; Stevens, R.J. Changes in composition of nitrogen-15-labeled gases during storage in septum-capped vials. Soil Sci. Soc. Am. J. 2003, 67, 540–543. [Google Scholar] [CrossRef]
- Carter, M.R.; Gregorich, E.G. Soil Sampling and Methods of Analysis, 2nd ed.; CRC Press: Boca Raton, FL, USA, 2007. [Google Scholar]
- FAO (Food and Agriculture Organization of the United Nations). World Reference Base for Soil Resources 2014: International Soil Classification; FAO: Rome, Italy, 2015. [Google Scholar]
- Alan, C.G.; David, S.H. Practical Statistics and Experimental Design for Plant and Crop Sciences; Wiley: New York, NY, USA, 2001; p. 455. [Google Scholar]
- Tauseef, S.M.; Abbasi, T.; Abbasi, S.A. Energy recovery from wastewaters with high-rate anaerobic digesters, Renew. Sustain. Energy Rev. 2013, 19, 704–741. [Google Scholar] [CrossRef]
- Abbasi, T.; Tauseef, S.M.; Abbasi, S.A. Anaerobic digestion for global warming control and energy generation—An overview. Renew. Sustain. Energy Rev. 2012, 16, 3228–3242. [Google Scholar] [CrossRef]
- Luithui, C.; Abbasi, T.; Abbasi, S.A. Advances in Water Pollution Monitoring and Control; Springer: Singapore, 2020; pp. 59–65. [Google Scholar]
- Tabassum Abbasi Patnaik, P.; Abbasi, S.A. Ability of Indian pennywort Bacopa monnieri (L.) Pennell in the phytoremediation of sewage (greywater). Environ. Sci. Pollut. Res. 2019, 21, 6078–6087. [Google Scholar] [CrossRef] [PubMed]
- Tabassum-Abbasi Abbasi, T.; Luithui, C.; Abbasi, S.A. Modelling methane and nitrous oxide emissions from rice paddy wetlands in India using Artificial Neural Networks (ANNs). Water 2020, 12, 2169. [Google Scholar] [CrossRef]
- Tabassum-Abbasi Abbasi, T.; Luithui, C.; Abbasi, S.A. A Model to Forecast Methane Emissions from Tropical and Subtropical Reservoirs on the Basis of Artificial Neural Networks. Water 2020, 12, 145. [Google Scholar] [CrossRef]
- Jiang, Y.; Zhang, H.; He, J.; Huan, P. February. Study on Methane Emission Factor of Paddy Fields in Hubei Province. In IOP Conference Series: Earth and Environmental Science; IOP Publishing: Bristol, UK, 2021; Volume 651, No. 4; p. 042031. [Google Scholar]
- Islam, S.F.U.; van Groenigen, J.W.; Jensen, L.S.; Sander, B.O.; de Neergaard, A. The effective mitigation of greenhouse gas emissions from rice paddies without compromising yield by early-season drainage. Sci. Total Environ. 2018, 612, 1329–1339. [Google Scholar] [CrossRef] [PubMed]
- Gogoi, N.; Baruah, K.K.; Gupta, P.K. Selection of rice genotypes for lower methane emission. Agron. Sustain. Dev. 2008, 28, 181–186. [Google Scholar] [CrossRef]
- Dhanuja, C.; Abbasi, T.; Abbasi, S.A. Fertilization of paddy cultivation with vermicompost: A critical mini review. Org. Agric. 2020, 10, 309–325. [Google Scholar] [CrossRef]
- Abbasi, S.A.; Dhanuja, C.; Abbasi, T. Emission of greenhouse gases from Indian wetlands: An overview. Trop. Ecol. 2021, 62, 319–328. [Google Scholar] [CrossRef]
Publisher’s Note: MDPI stays neutral with regard to jurisdictional claims in published maps and institutional affiliations. |
© 2022 by the authors. Licensee MDPI, Basel, Switzerland. This article is an open access article distributed under the terms and conditions of the Creative Commons Attribution (CC BY) license (https://creativecommons.org/licenses/by/4.0/).