Article

Projected Changes of Day-to-Day Precipitation and Choco Low-Level Jet Relationships over the Far Eastern Tropical Pacific and Western Colombia from Two CMIP6 GCM Models

1
Facultad de Arquitectura e Ingeniería, Institución Universitaria Colegio Mayor de Antioquia, Medellín 050034, Colombia
2
Department of Atmospheric Sciences, Desert Research Institute, Reno, NV 89512, USA
*
Author to whom correspondence should be addressed.
Atmosphere 2022, 13(11), 1776; https://doi.org/10.3390/atmos13111776
Submission received: 23 August 2022 / Revised: 24 October 2022 / Accepted: 26 October 2022 / Published: 28 October 2022
(This article belongs to the Special Issue Feature Papers in Atmosphere Science)

Abstract

:
The far Eastern Tropical Pacific (EPAC) and Western Colombia are one of the rainiest places on Earth, and the Choco low-level jet (ChocoJet) is one of the processes that influence the formation of copious precipitation and convection organization in this region. This study investigates the projected changes in precipitation in this region using historical and future simulations based on model output from two models contributing to the Coupled Model Intercomparison Project phase 6 (CMIP6). In close agreement with observations, models simulate that ChocoJet intensity is directly proportional to precipitation in the region. This relationship is also found far inland in Central America, the northwestern part of South America Pacific Coast, and the intermountain valleys of the Colombian Andes. Late 21st century simulations show a southward migration in mean and regional daily precipitation consistent with a decreased ChocoJet intensity. The weaker ChocoJet is related to a projected increase in EPAC tropical sea surface temperatures (SSTs) and an increased frequency and intensity of the warm phase of the Niño 1+2 SST interannual variability.

1. Introduction

With annual precipitation ranging between 8000 mm to 13,000 mm per year, the far Eastern tropical pacific (hereafter ‘far EPAC’) and western Colombia are the rainiest places on Earth [1,2]. Moisture transport and deep convection from this region influence extreme precipitation events [3,4] and contribute to the mean hydroclimate inland in Central America and Northwestern South America (hereafter ‘NWSA’). These copious amount of precipitation and atmospheric moisture are important to the local communities, the Choco-Darien rainforest stripe, and its biodiversity. Assessing how climate change stresses biodiversity and marginalized populations can help guide actions to protect them [5].
Understanding the factors leading to such copious amount of precipitation in the NWSA region, its variability, and future trends requires a multiscale examination of the environmental processes driving them. Interannually, the El Niño-Southern Oscillation (ENSO) [6] causes strong variability in precipitation in the Tropical Pacific, Caribbean Sea, and Colombia [7]. The warm phase of ENSO tends to suppress precipitation over NWSA, while the opposite has been related during its cold phase [7,8]. ENSO impacts in the far EPAC region have been related to tropical SST anomalies that modulate both the Walker circulation and the cross-equatorial low-level circulation [8]. The northward extension of this cross-equatorial low-level flow shifting from southerly to southwesterly is known as Choco low-level jet (hereafter ‘ChocoJet’) [1,9]. Thus, interannual variability of precipitation in the far EPAC region and NWSA has been partly related to ChocoJet and ENSO-related to SST anomalies relationship [10,11]. The annual migration of the intertropical convergence zone (ITCZ) modulates the annual cycle of precipitation over the NWSA region [12,13,14] and partly modulates the seasonality and intensity of the Caribbean Low-Level Jet (hereafter ‘CLLJ’) [15] and ChocoJet [14,16,17,18,19]; the strongest ChocoJet is in September to November and the CLLJ follows a bimodal distribution with mean maxima in December–February and June–August [18].
Global circulation models (GCM) are important tools to understanding climate variability and developing climate change projection [13,20], which is important to the management of the territory and biodiversity. GCMs have been improving throughout time as a response to an increase in computational capacity allowing simulations using finer grid, together with improvements in the simulation of physical processes involved, and more complete simulations of the climate system (Couple Model Intercomparison Project-CMIP phases 3, 5, and 6) [13,21]. Recently, diagnostic studies based on CMIP5 and CMIP6 showed that GCMs are reasonably skillful in representing present interannual and annual precipitation-circulation relationships [13,20,21,22,23,24,25]; with future projected changes suggesting a decrease of precipitation over the Colombian Orinoco and Colombian Amazon regions, and increase over the eastern equatorial Pacific [22,23] and Central America [26], with a distinct southward migration of the ITCZ over the EPAC. Over the far EPAC region, future projected changes in precipitation have been partly related to mean state changes in ChocoJet [20,22]. Most climate change studies in the region have focused on annual and monthly time scales analyses [19,24,25,26,27]. Despite the numerous studies based on projected future changes in precipitation, further investigation is needed to understand GCM uncertainties in simulating convective and moist processes at finer time scales.
Recent studies using in situ data, reanalysis products and remote sensing information have shown that days with enhanced ChocoJet promote convection organization into mesoscale convective systems (MCS) [2,5,28], and that such MCSs are responsible for most of the precipitation in the far EPAC region [29]. However, current GCMs are too coarse to explicitly simulate organization of convection into MCSs [22,30,31]. Previous studies over this region have shown that GCMs can simulate a ChocoJet-like feature in terms of its intensity and some spatio-temporal characteristics [20,32], but a detail evaluation of how GCMs simulate ChocoJet day-to-day variability and its relationship to precipitation is missing. We argue that the precipitation responses to day-to-day variability of the ChocoJet can shed light on the diagnostic and climate change attribution process. How are the observed ChocoJet-precipitation day-to-day relationships and can they be resolved by present GCMs? The central focus of this study is to address these questions as an effort to examine the underlying causes of future projections of precipitation in the region.
This paper is distributed as follows: Section 2 describes the datasets and presents the analyses methods. Section 3 presents the results. Discussion and conclusions are given in Section 4 and Section 5, respectively.

2. Materials and Methods

2.1. CMIP6 Models

Daily historical and late 13st century simulations based on GCMs contributing to the CMIP6 [33] were implemented in this study. The analyses focus on the rainy season from June to November over the far Eastern Pacific, where the core of the ChocoJet influences NW South America [20,27,28].
Two GCMs were examined, the NCAR Community Earth System Model (hereafter ‘CESM2’) [34], and the Max Planck Institute for Meteorology comprehensive Earth System Model in the Low Resolution (hereafter ‘MPI-LR’) [35]. For the periods 1988–2014 in the historical simulations, and 2073–1300 using Shared Socioeconomic Pathways (SSP) representing a middle of the road (SSP245) and the rapid growth (SSP585) forcing trajectory [36,37], respectively. Due to the limited access and availability of the daily simulations available at the time of this study, we focused the analyses only these two GCM models. Earlier versions of these models have been examined based on their performance in simulating precipitation, surface temperature [20,38], and ChocoJet [20,32]. Sierra et al. [20] showed a classification of CMIP5 models based on their capacity to simulate seasonal precipitation in the NWSA region. They highlighted that CESM2 and MPI-LR performed relatively better in representing precipitation total during June–November season and produced a more realistic simulation of the monthly ChocoJet-precipitation correlation patterns. We recognize, however, that similar performance or ranking in the evaluation process [20] is not necessarily expected in the present versions of the models.
The GCM models were evaluated based on their ability to simulate daily precipitation, winds, specific humidity, and monthly sea surface temperature (SST). CESM2 and MPI-LR have 0.9° × 1.25° and 0.93° × 0.92° grid sizes, respectively. Daily low-level wind data was only available at 1000 hPa. Without affecting the general goal of this study, daily specific humidity data from CESM2 for SSP245 were not available for a more systematic analysis. CMIP6 simulated output is an open-access dataset available at https://esgf-node.llnl.gov/search/cmip6/ (accessed on 15 May 2021).

2.2. Daily Gridded Observations

To evaluate simulated precipitation performance, we used the Integrated Multi-satellite Retrievals for Global Precipitation Measurement (hereafter ‘GPM’) [39] for the period 2000–2014, at a daily temporal scale and a 0.1° × 0.1° spatial grid size. GPM is an international network of satellites by NASA, the Japan Aerospace Exploration Agency, the Center National d’Études Spatiales, and other international space agencies. GPM is an open-access dataset available at https://pmm.nasa.gov/GPM (accessed on 1 October 2020). We upscaled the GPM data towards the GCM native grid using a simple resampling averaging approach.
To address uncertainties in observed precipitation estimates and extend the relatively short observation period from GPM, we also used precipitation products from the Hamburg Ocean Atmosphere Parameters and Fluxes from Satellite data and Global Precipitation Climatology Centre (hereafter ‘HOASP’) for the period 1988–2014, at a daily temporal scale and a 1° × 1° spatial grid size [40]. This dataset assimilates data from global precipitation observations, satellite data, and rain gauges. HOASP is an open-access dataset available at https://opendata.dwd.de/climate_environment/GPCC/html/HOGP_V002.html (accessed on 1 October 2020).
To complement the analysis we used specific humidity, sea surface temperature, zonal and meridional winds from ERA5 reanalysis data [41] for the period 1988–2014, at a 0.25° × 0.25° grid size and daily time increments. ERA5 reanalysis data is available at https://www.copernicus.eu/ (accessed on 3 March 2021).

2.3. ChocoJet Index

ChocoJet Index was defined following Poveda and Mesa [1], Sierra et al. [32], and Cerón et al. [27] with some modifications. Previous studies estimated the ChocoJet index using 925 hPa, the level of typical maximum ChocoJet speed [1,2,27,28], and by spatially averaging the zonal wind within 3.5–7° N and 80–82° W (see averaging domain in Figure 1). At the time of the development of this study, however, daily upper-air winds and moisture parameters at 925 hPa were not consistently available in the CMIP6 database. Observed and reanalysis relationships of winds at 1000 and 925 hPa showed that using 1000 hPa wind and moisture parameters, readily available for a handful of CMIP6 GCM models, instead of 925 hPa was a reasonable assumption and should not affect our assessments (not shown). Hence, we used ERA5 1000 hPa zonal wind for 1988–2014 to estimate our observed ChocoJet Index and followed a similar approach to estimate the CMIP6 simulated ChocoJet Index.
Further, we examined the effect of high ChocoJet index days by subsampling the datasets based on days exceeding the 50th percentile (hereafter ‘H-ChocoJet’ days). This approach follows Cerón et al. [27], who examined the precipitation anomalies over Colombia associated with extreme ChocoJet events under the distinct influence of the Atlantic Multidecadal Oscillation phases.

2.4. Correlation Patterns and Future Climate Projections

Pearson linear correlations [42] quantify the linear relationship between two-time series. We used this approach to evaluate the daily and monthly relationships between ChocoJet index and precipitation, together with their level of significance for a p-value less than 0.05. No attempt to bias-correct the model output was performed before estimating the correlation patterns, or future scenario change. Even though the model daily data of the examined parameters exhibit biases that are notorious, we opted for not to remove the biases to avoid incurring to uncertainties related to the common stationarity assumption of the bias-correction approaches [43]. By construction, the practical benefit of bias correcting the simulated data is not achieved when estimating linear correlations as it removes the mean states (including the bias) of the respective period. Correcting other model error structures of higher order may be beneficial to our correlation estimates but correctly implementing such approaches are problematic and remains an open question.

2.5. Characterizing ENSO

To develop ENSO-related composites, we estimated SST anomalies (SSTA) using the Niño 1+2 region (0° N–10° S and 90–80° W) following Montealegre [44], who examined the impacts of ENSO in the region. ENSO-related indices and different flavors have been studied, showing diverse hydroclimate impacts in the region [7]. However, we used Niño 1+2, which is highly correlated to Eastern Pacific ENSO, also known as cold tongue ENSO, for its proximity to our region of study and because ChocoJet appears to respond more closely to the associated region SST gradients [1]. It is possible that other ENSO definitions (i.e., Central Pacific or Modoki ENSO) and teleconnection patterns could have a substantial impact in our results; when possible, we will discuss and relate our results with other ENSO flavors and characteristic reported in the literature. We estimated SSTA to categorize ENSO frequency and intensity using historical CESM2 and MPI-LR SST as the baseline period (1988–2014). The frequency of ENSO was estimated based on the number of months meeting either La Niña (SSTA < 0.5 °C) or El Niño (SSTA > 0.5 °C) phases.

3. Results

3.1. Rainfall Maximum and Low-Level Flow

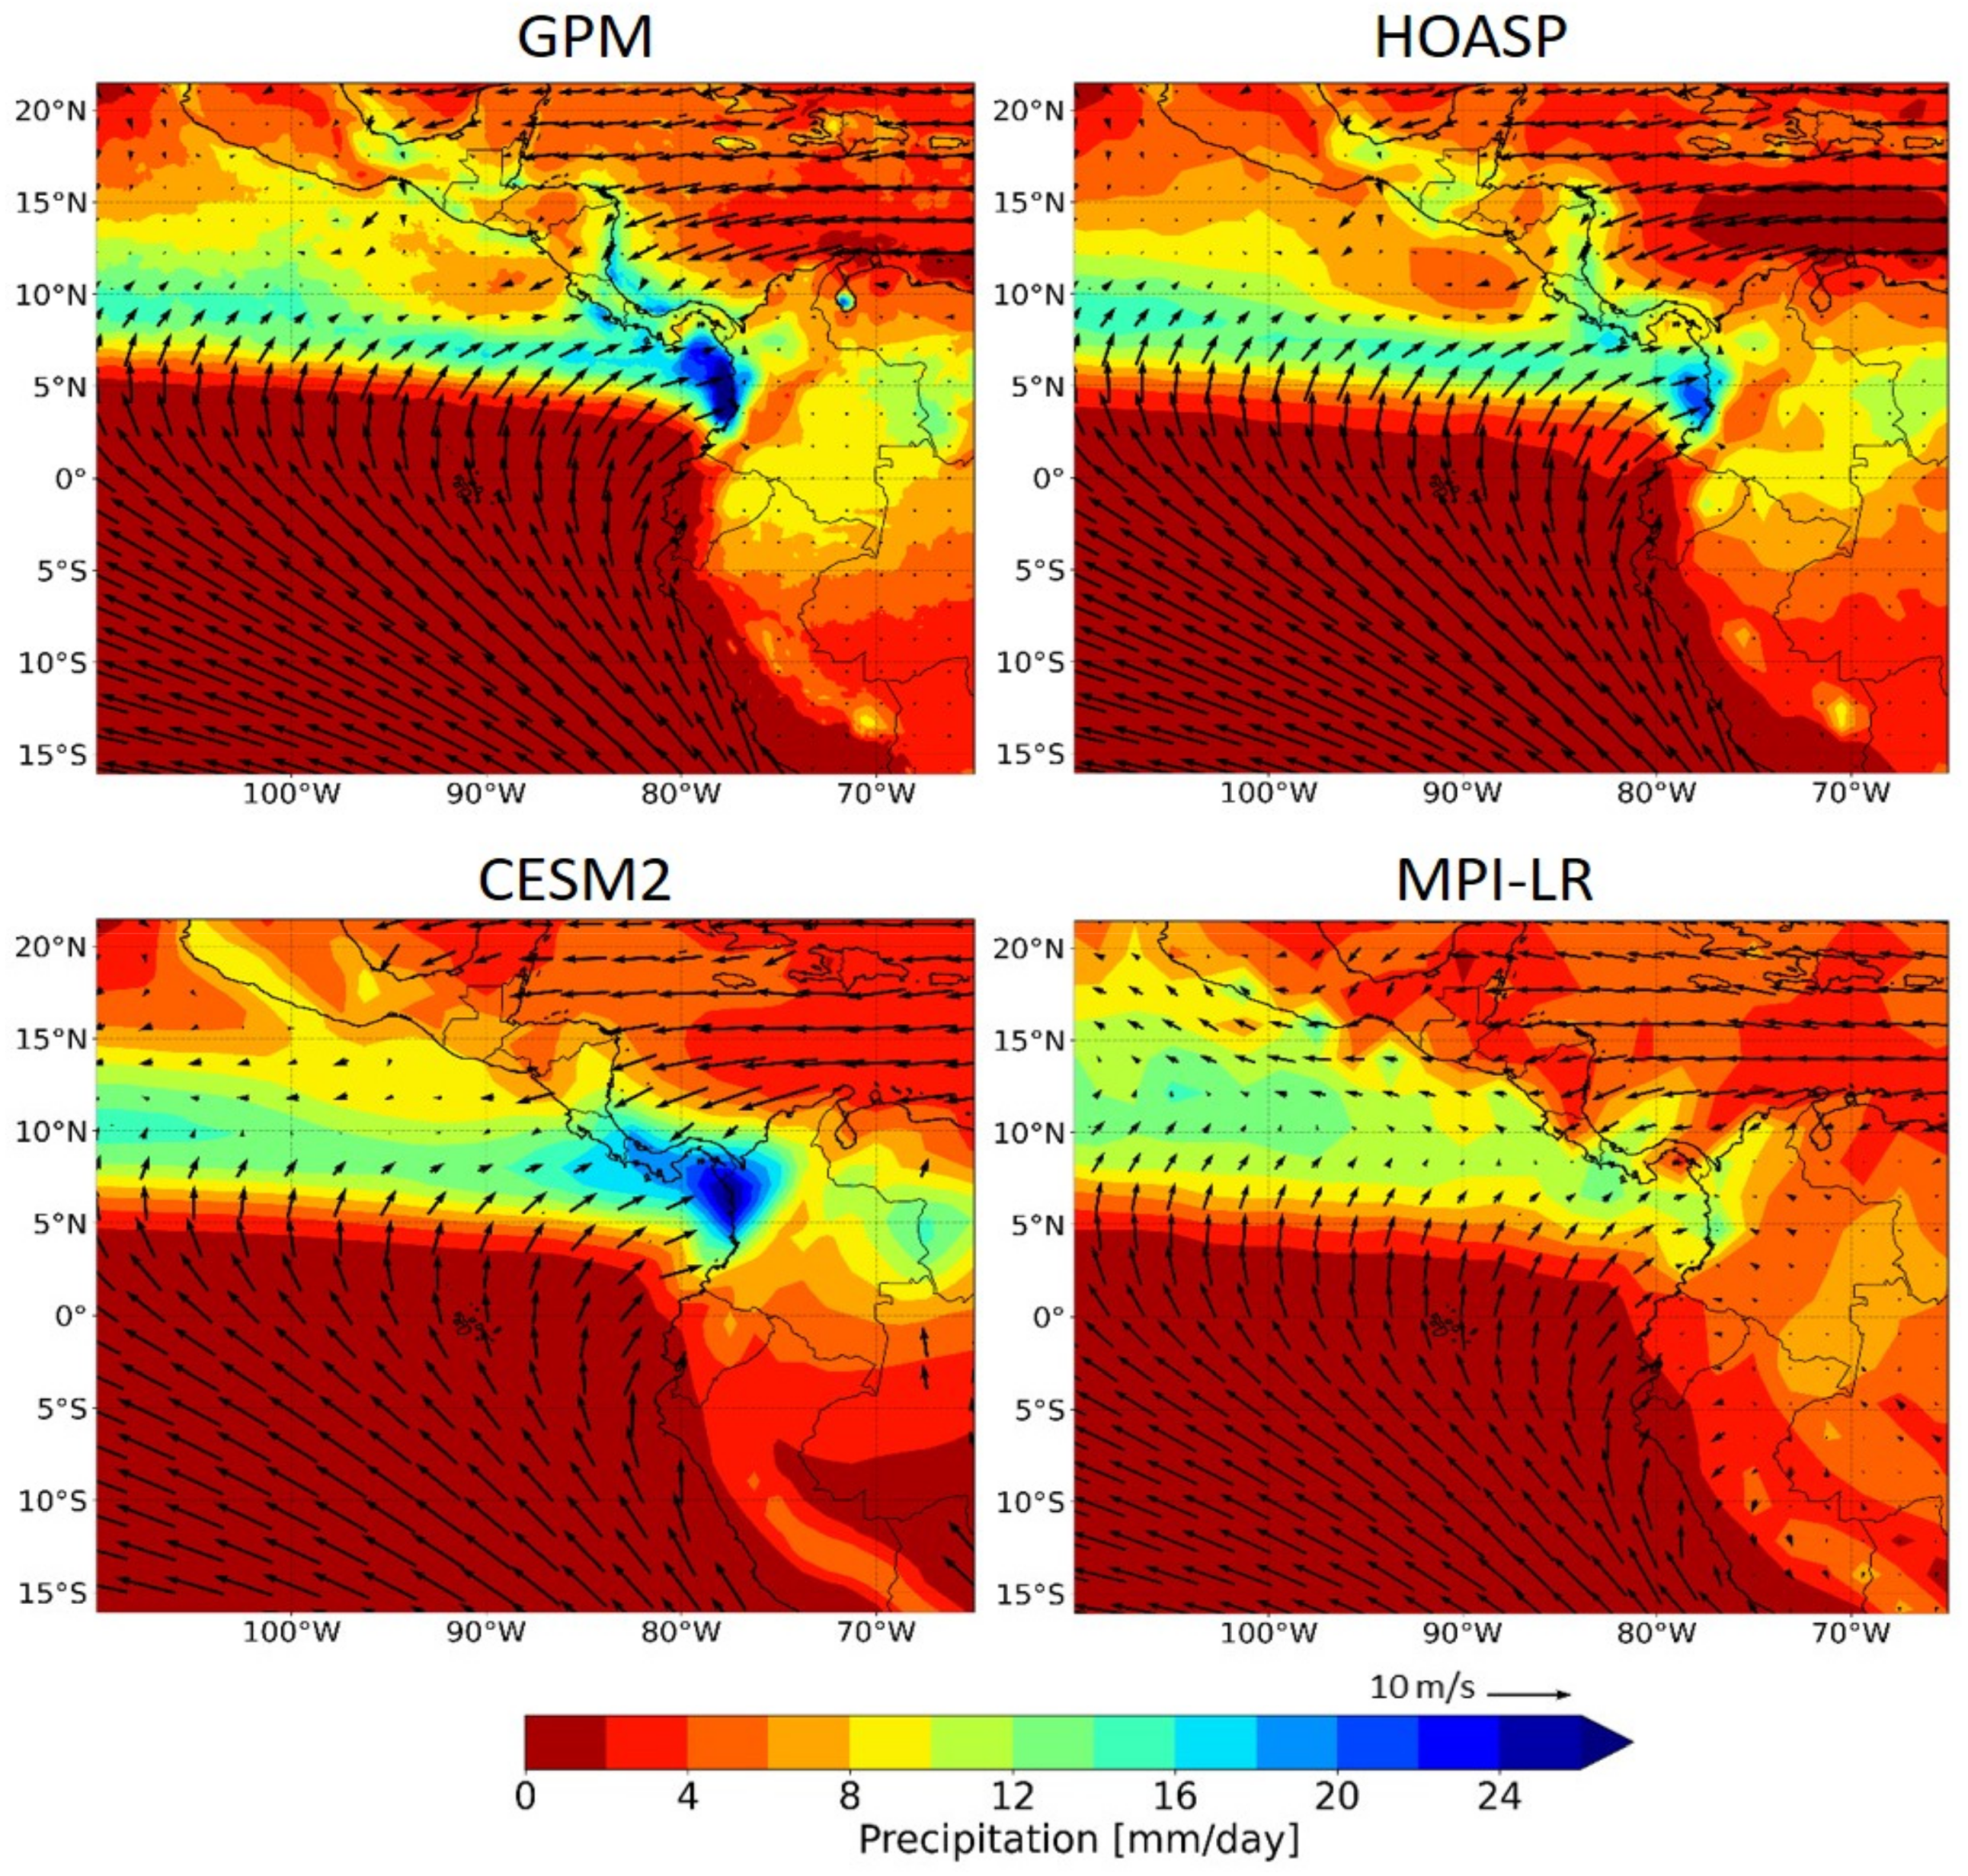
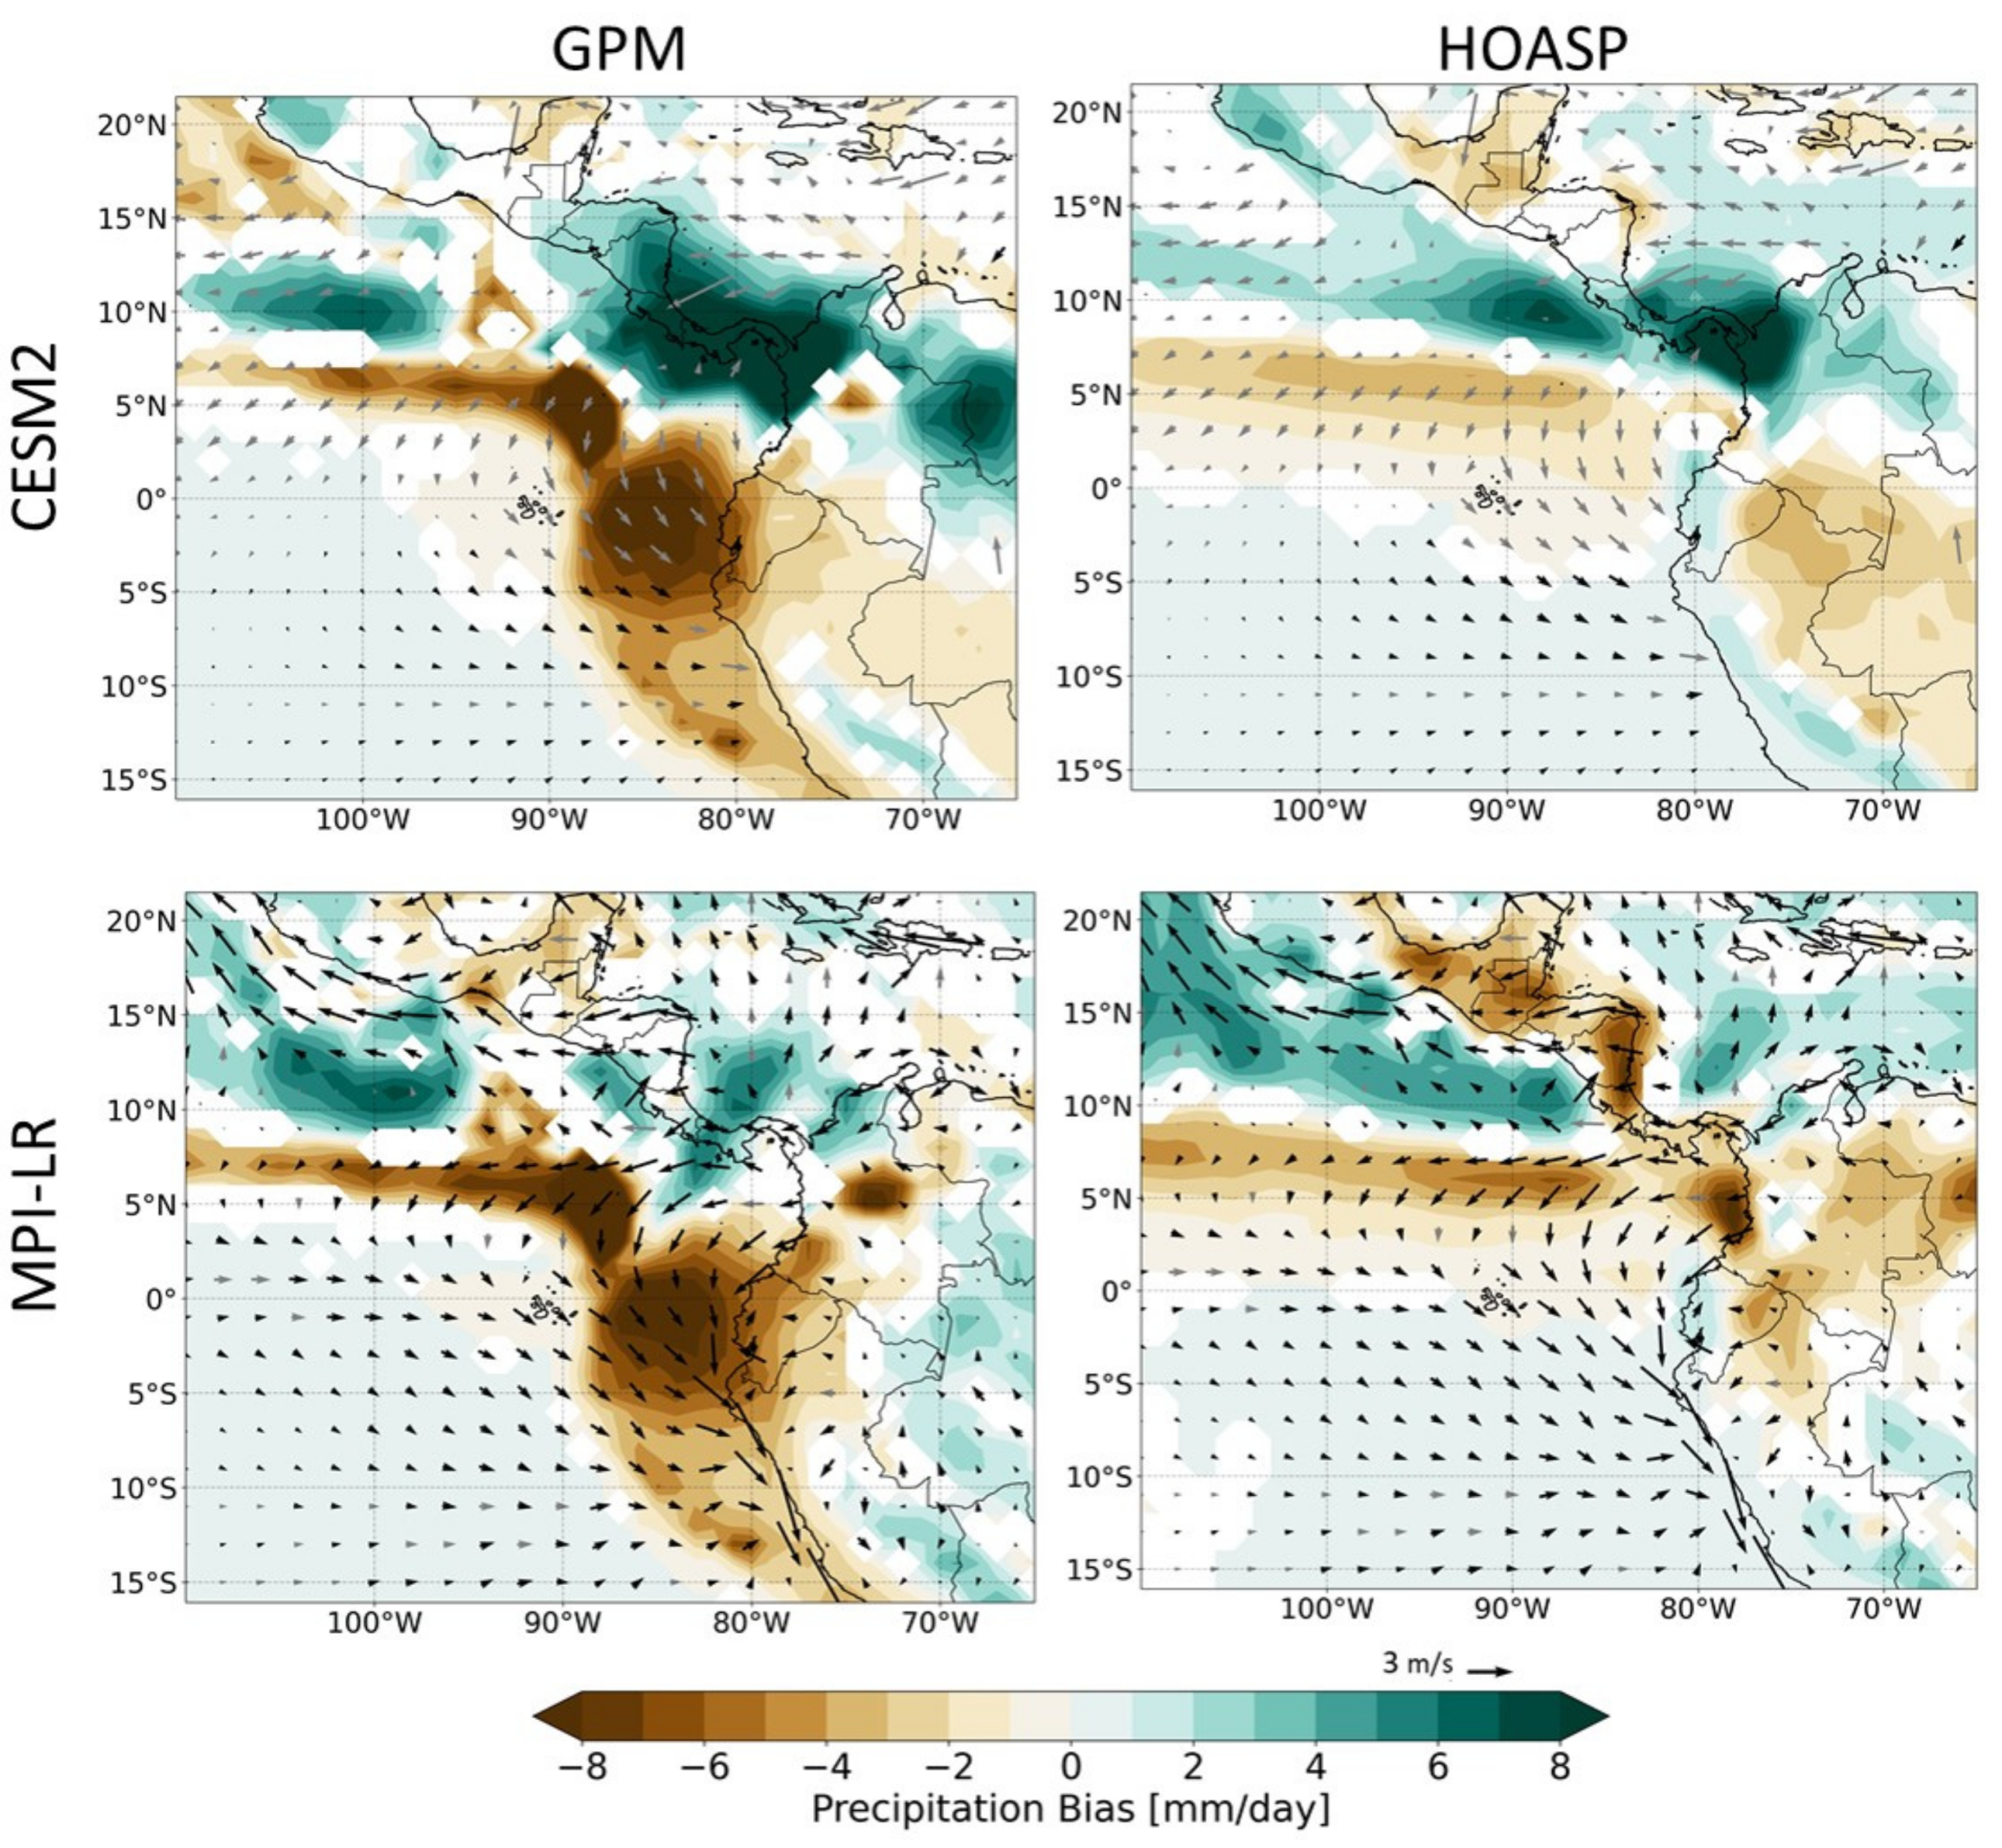
Figure 2 shows the June–November mean precipitation and low-level wind from observations and GCM simulations. Corresponding simulated biases are presented in Figure 3. Observations show that the ITCZ is the most prominent precipitation feature over the tropical Pacific, with a region of distinct maritime precipitation maximum emphasized over the far EPAC right offshore Colombia. Compared to observations, both models show that the ITCZ is shifted northward. This result disagrees with systematic approaches showing that over the EPAC the CMIP3/5/6 mean precipitation ensembles show the ITCZ is shifted southward [13]; seasonal CMIP5 precipitation biases show the southward shift is persistent throughout the year [23]. Overall, the CESM2 performs better than MPI-LR in many aspects, including the meridional locations of the ITCZ, maritime precipitation maximum in the EPAC—MPI-LR completely missed this feature—and the enhanced orographic precipitation over the Andean mountains. It is worth highlighting that the spatial patterns and magnitude differences between GPM and HOASP products are rather small when compared against the simulated output, with some substantial difference over the area of the maritime precipitation maximum.
The ChocoJet has been traditionally related to the prominent southerly and southwesterly cross-equatorial flow, followed by the eastward shift over the EPAC (Figure 2). When comparing to ERA5, the CESM2 is noticeable better in simulating the magnitude and eastward shift of ChocoJet compared to MPI-LR (Figure 3). Both models exhibit a coherently weaker cross-equatorial southwesterly low-level flow, but only the circulation biases from MPI-LR show significant differences. Additionally, the CESM2 shows a stronger low-level easterly flow over the Caribbean Sea likely due to a stronger CLLJ, whereas the MPI-LR is significantly weaker. The lack of the emphasized precipitation maximum over the far EPAC in the MPI-LR simulation can be related to the weaker confluence and related weaker convergence due to these the two distinct weak circulation biases. Below, we investigate the statistics of the day-to-day circulation-precipitation relationships for a deeper insight into these processes and model scale issues.
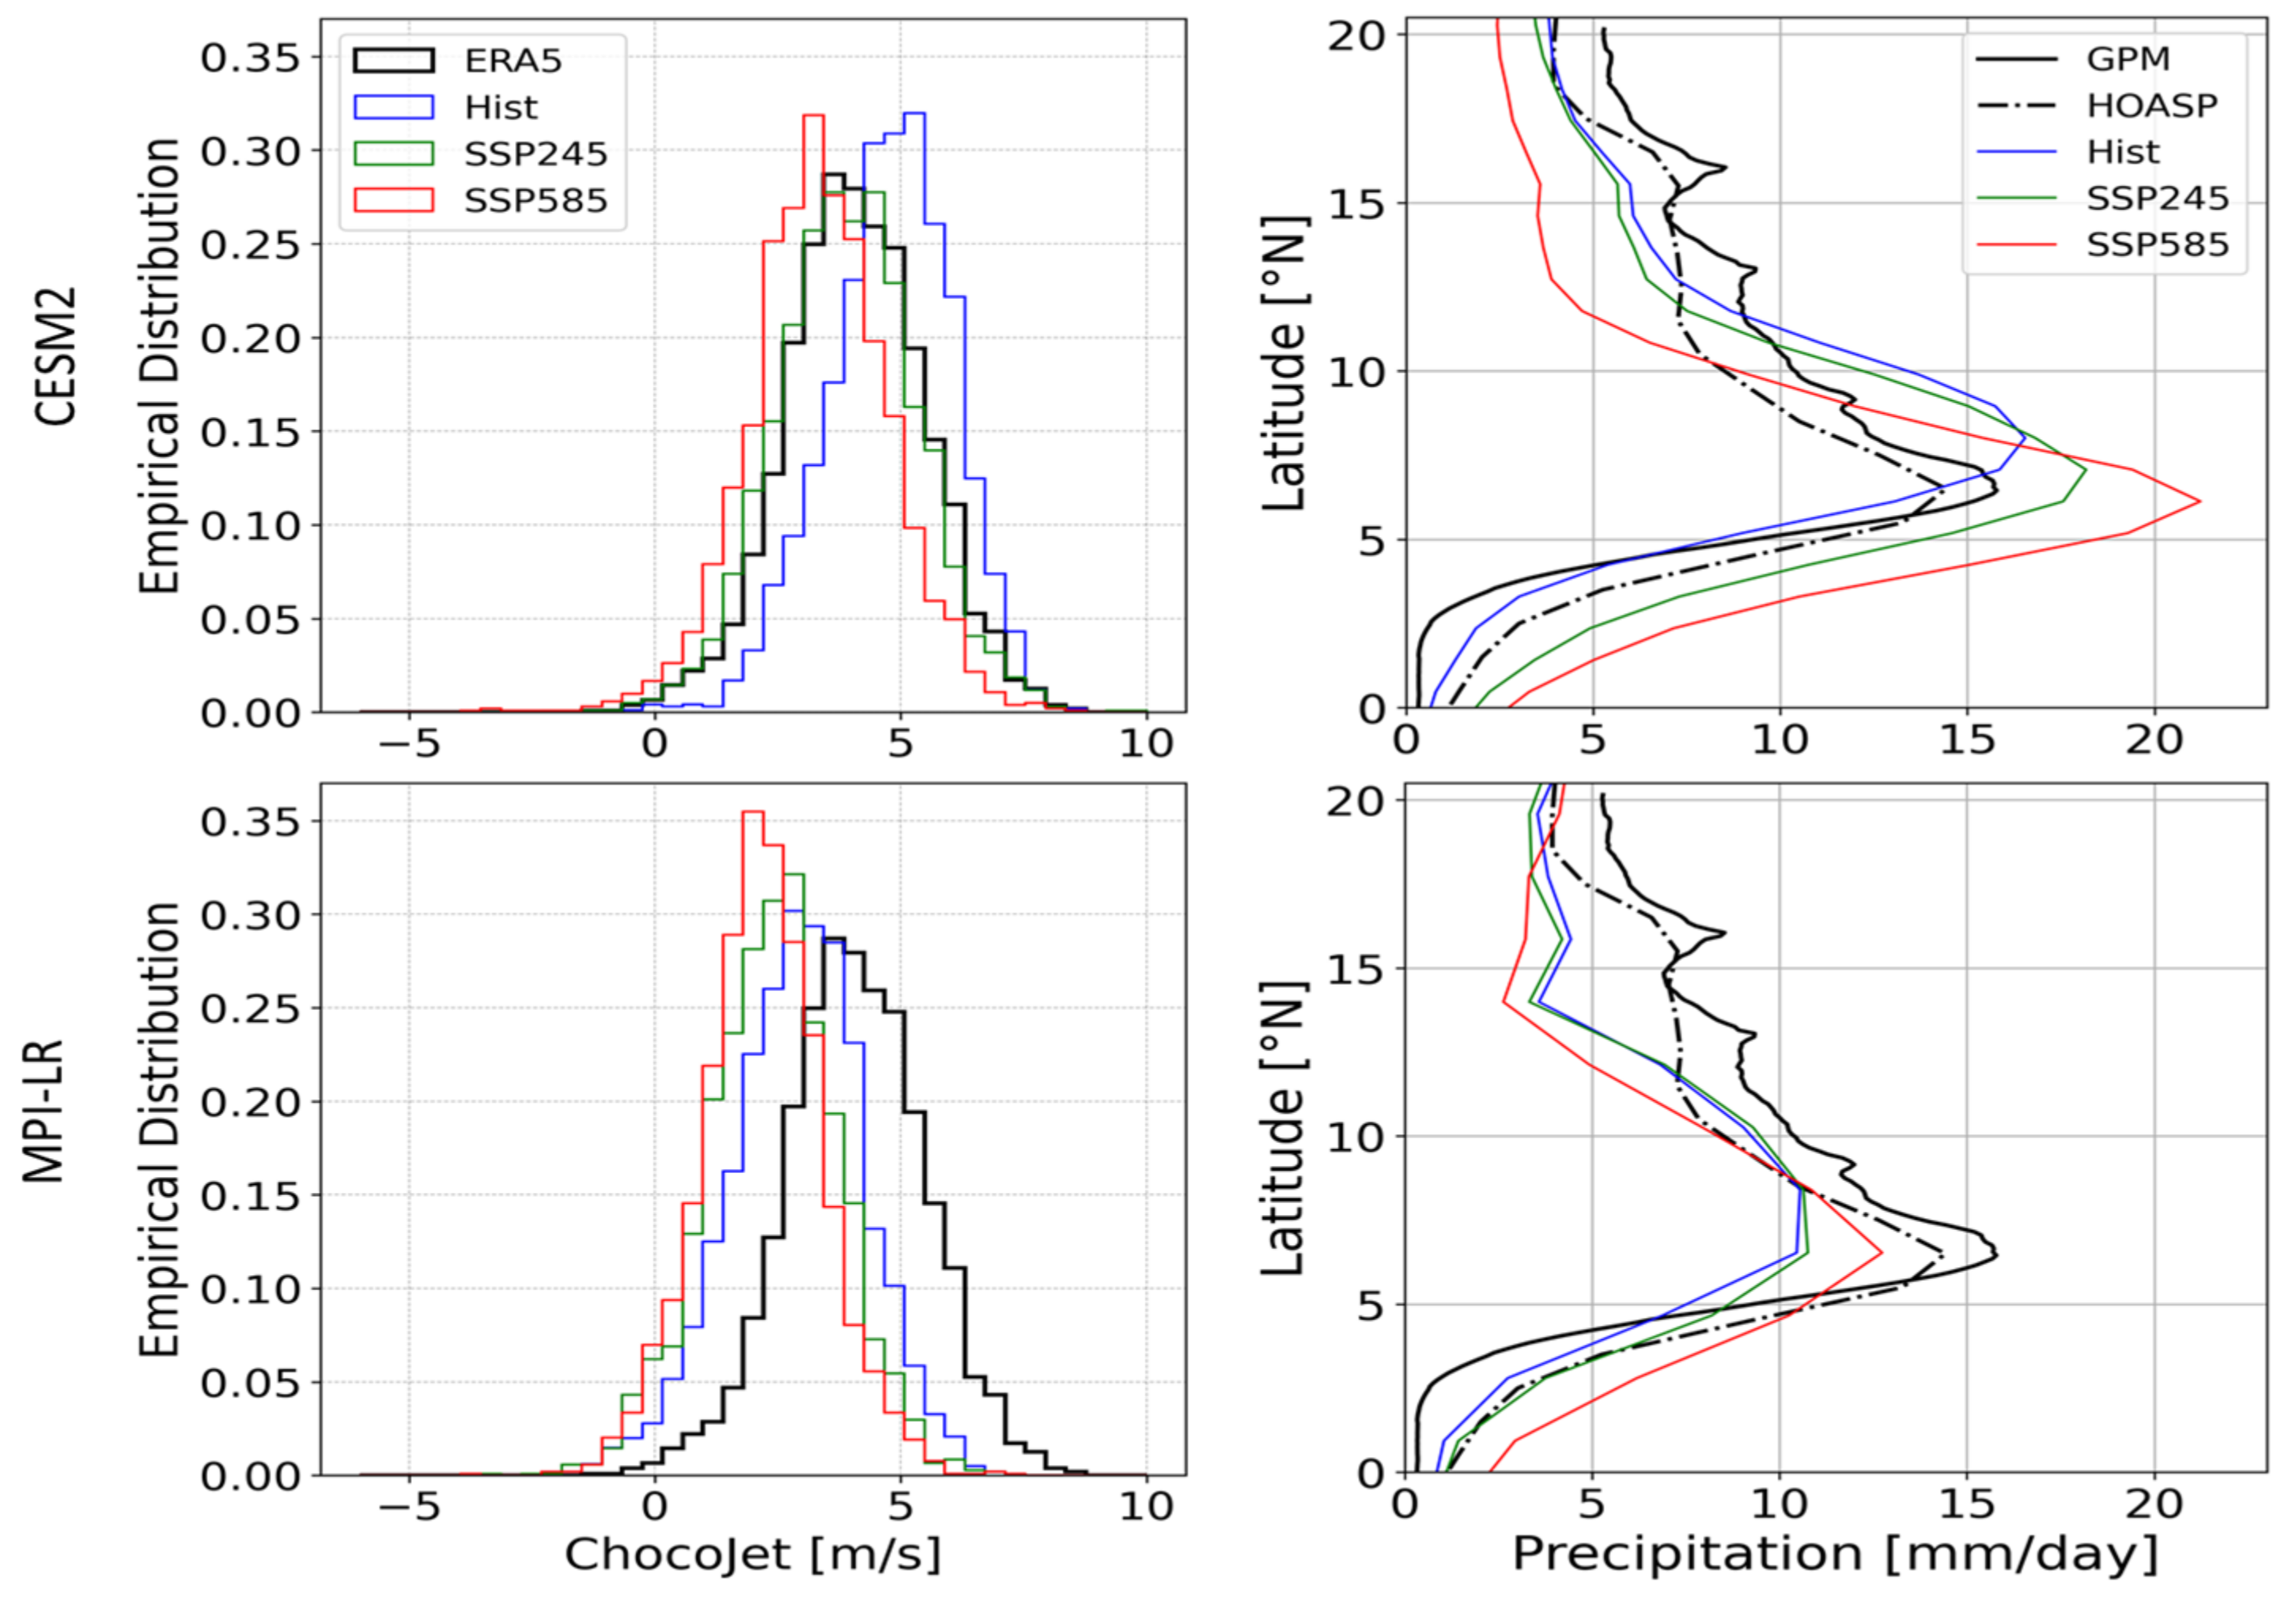
Figure 4 shows observed and simulated, historical and projected, ChocoJet daily empirical distribution and latitudinal precipitation averages over the far EPAC. A striking feature is that ChocoJet is consistently weaker (stronger) for MPI-LR (CESM2) simulations. Consistent with earlier results, the MPI-LR weaker southerly and southwesterly simulated flow leads to a weaker ChocoJet, likely leading to less orographic forcing and the dry precipitation bias over the far EPAC region (Figure 2 and Figure 3). In contrast, the stronger ChocoJet in CESM2 simulation appears to be related to a slightly wet precipitation bias. Other striking features in Figure 4 are that both models show a future weakening of ChocoJet and the southward migration of the maximum precipitation as the SSP forcing increases.

3.2. Precipitation-ChocoJet Correlation Patterns

Figure 5 shows monthly precipitation-ChocoJet correlation patterns for the observations and GCMs model output. In general, observations show a significant and broad negative pattern over the EPAC consistent with the anomaly northward migration of the ITCZ, relative to its mean position (Figure 2), during the enhanced ChocoJet anomalies. The western Caribbean Sea, NW Colombia exhibit a coherent positive correlation pattern consistent with the outlined northward ITCZ migration. Of note is that these results agree well with previous studies in the region aiming to relate simulated precipitation to ChocoJet at monthly timescales [19,27,45,46]. Particularly, the CESM2 model shows spatial patterns that resemble better when contrasted against the observations, with the MPI-LR model showing less coherent patterns. These results also agree with Sierra et al. [20,24] who indicated that CESM2 is one of the models that better represents this precipitation-ChocoJet relationship.
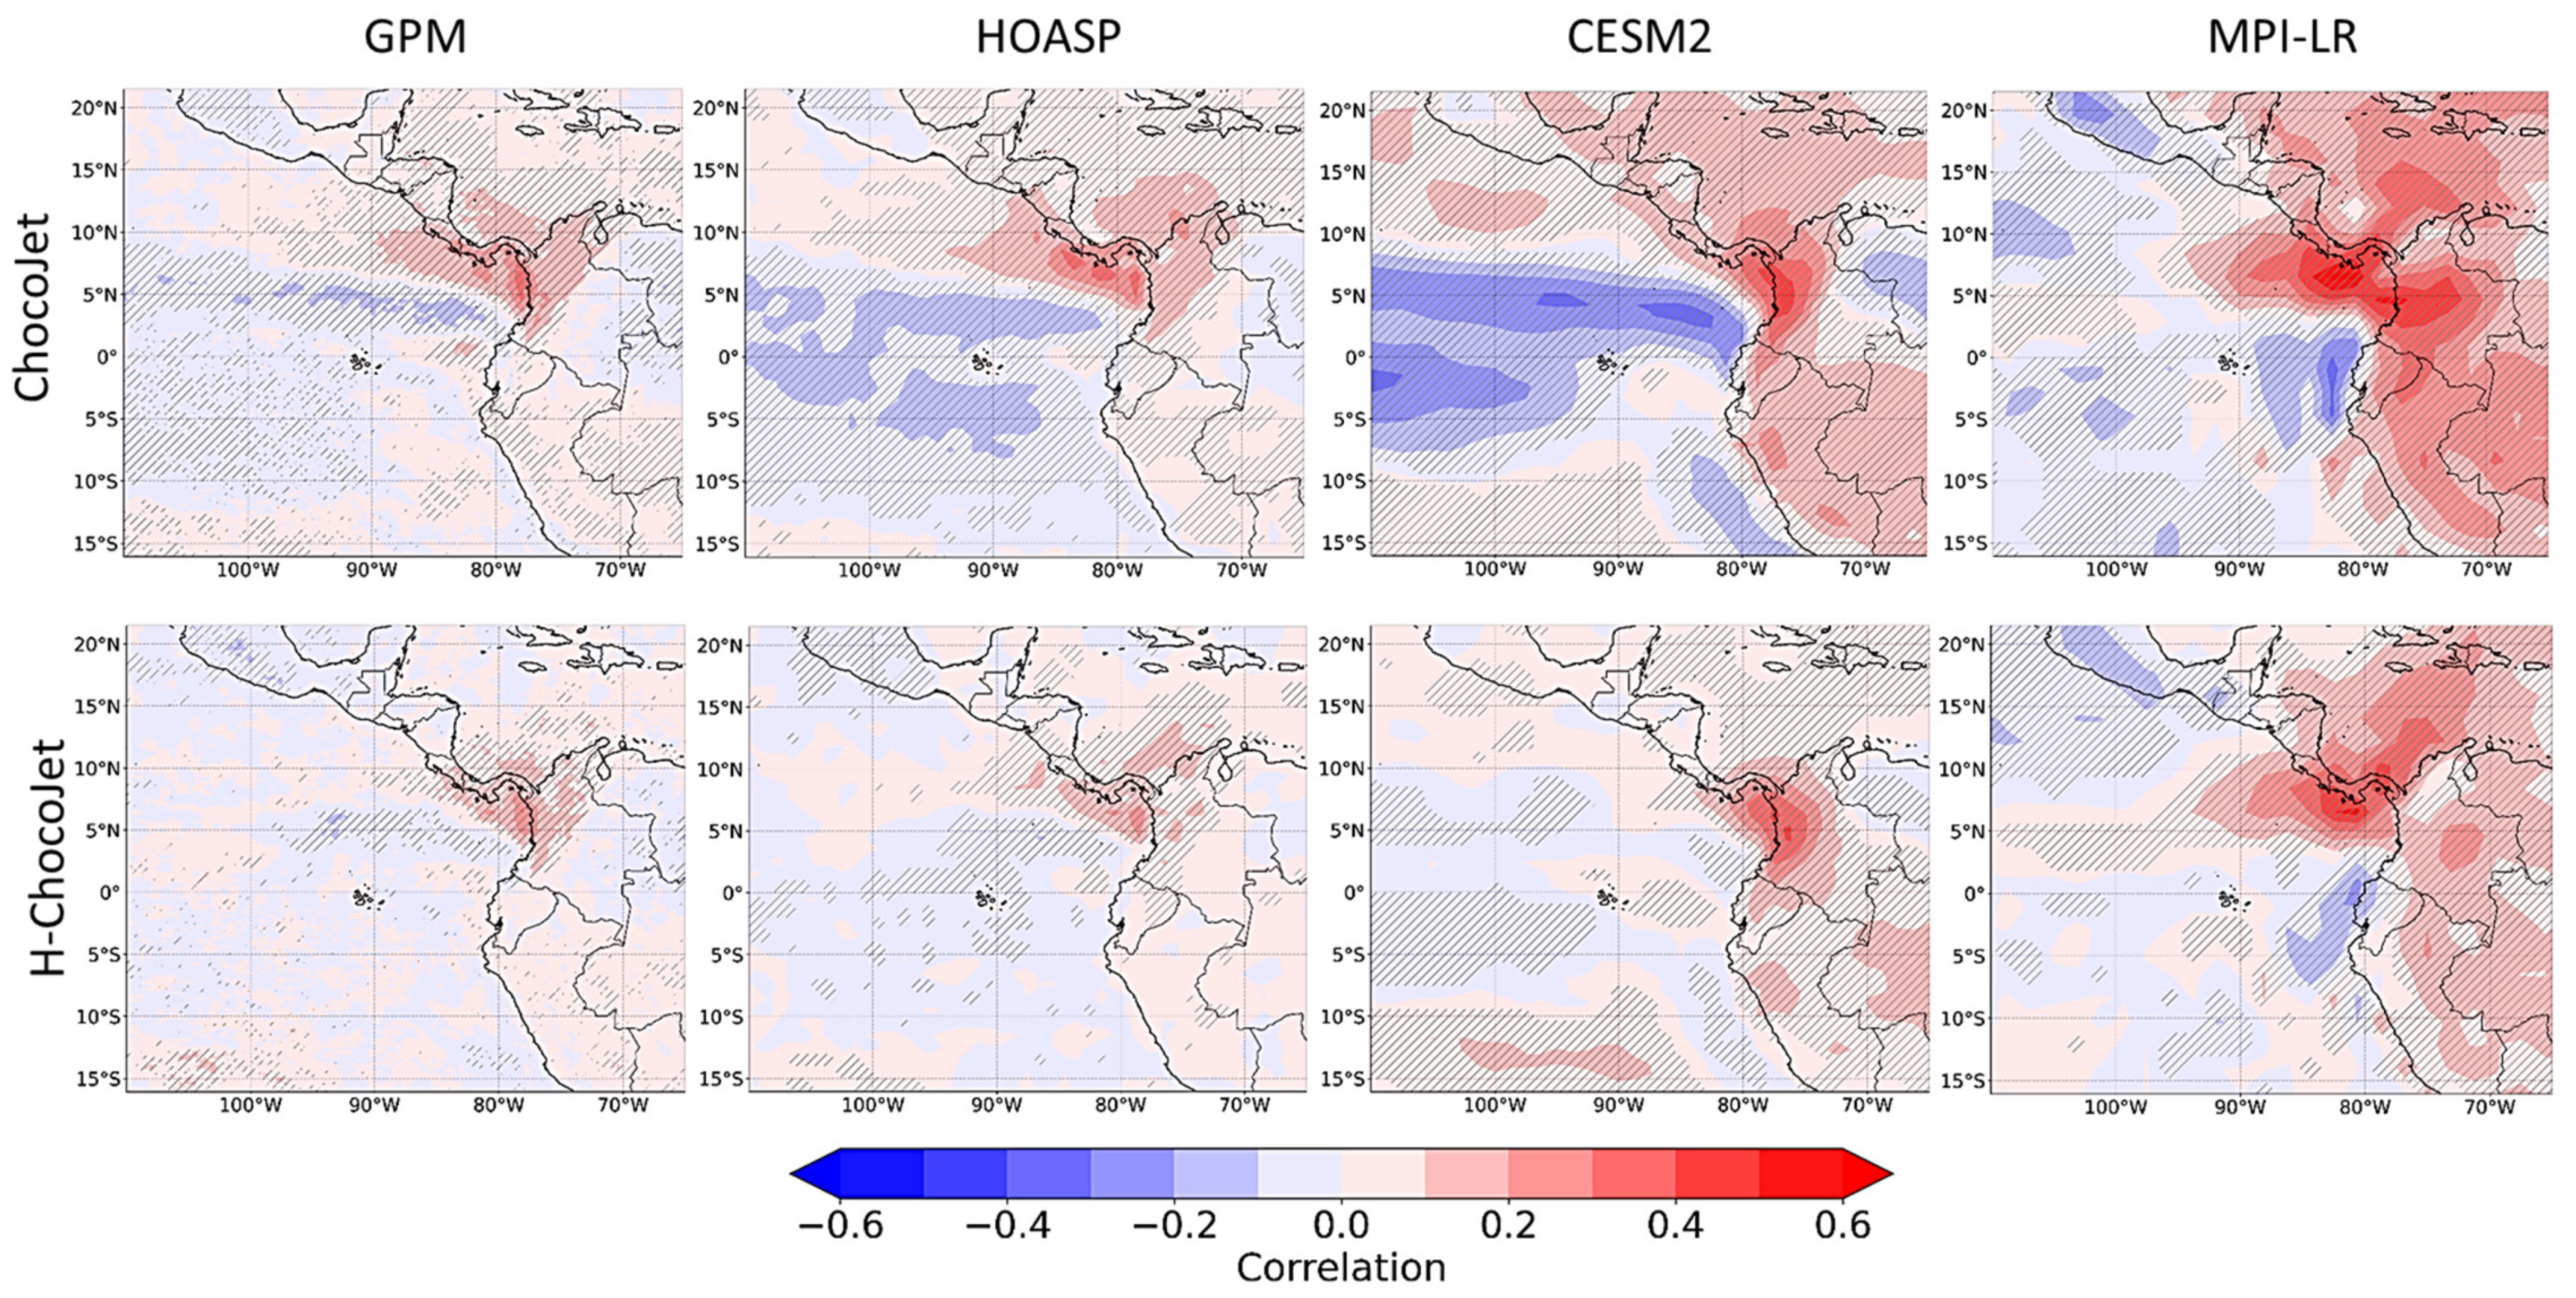
Figure 6 shows precipitation-ChocoJet and precipitation-H-ChocoJet correlation patterns at daily timescales. Observations show that day-to-day precipitation-ChocoJet are significantly and positively related over the far EPAC region, south of Central America, the Panama Bight area, and Western Colombia. The patterns based on observed fields confirm and extend Mejia et al. [2] findings, suggesting that precipitation is enhanced during enhanced ChocoJet; MCS development propagate westward to support the maritime precipitation maximum.
Differences between monthly (Figure 5) and daily (Figure 6) observed correlation patterns are outstanding both in their spatial distribution and in their intensity. Monthly patterns resemble the broad, seasonal impacts of the ITCZ meridional migration. In addition, the monthly correlation patterns smooth out the rich synoptic and concentrated ChocoJet influence exhibited in daily correlation patterns.
Similar to the monthly precipitation-ChocoJet correlations patterns shown earlier, there is a weak but significant daily correlation pattern showing a northward migration of the ITCZ. Of note in Figure 6 is that precipitation-H-ChocoJet correlation patterns are more locally defined than either the daily or monthly ChocoJet. The CESM2 model stands out for its better performance as its output resembles more closely the observed correlation patterns for both ChocoJet and H-ChocoJet than the MPI-LR model. Moreover, the CESM2 emphasizes a region of maximum correlation over land on the Colombian Pacific coast, whereas the MPI-LR emphasizes a more positive correlation offshore the Pacific Coast of Central America. The location of the maximum correlation in relation to the sea–land interface over the EPAC in daily correlations reinforces our early results highlighting the relationship between precipitation biases and orography. Even though the examined GCMs are not explicitly resolving MCSs, the agreement in representing precipitation-ChocoJet spatial relationships suggest that moisture fluxes and other ChocoJet related forcings are strong enough for deep convection parameterization activation. The MPI-LR precipitation-ChocoJet patterns adequately respond to the convection activation process, but its dry bias suggests the existence of potential issues limiting precipitation production. For example, the weaker MPI-LR confluence fields shown in Section 3.1 can lead to less moisture fluxes convergence.
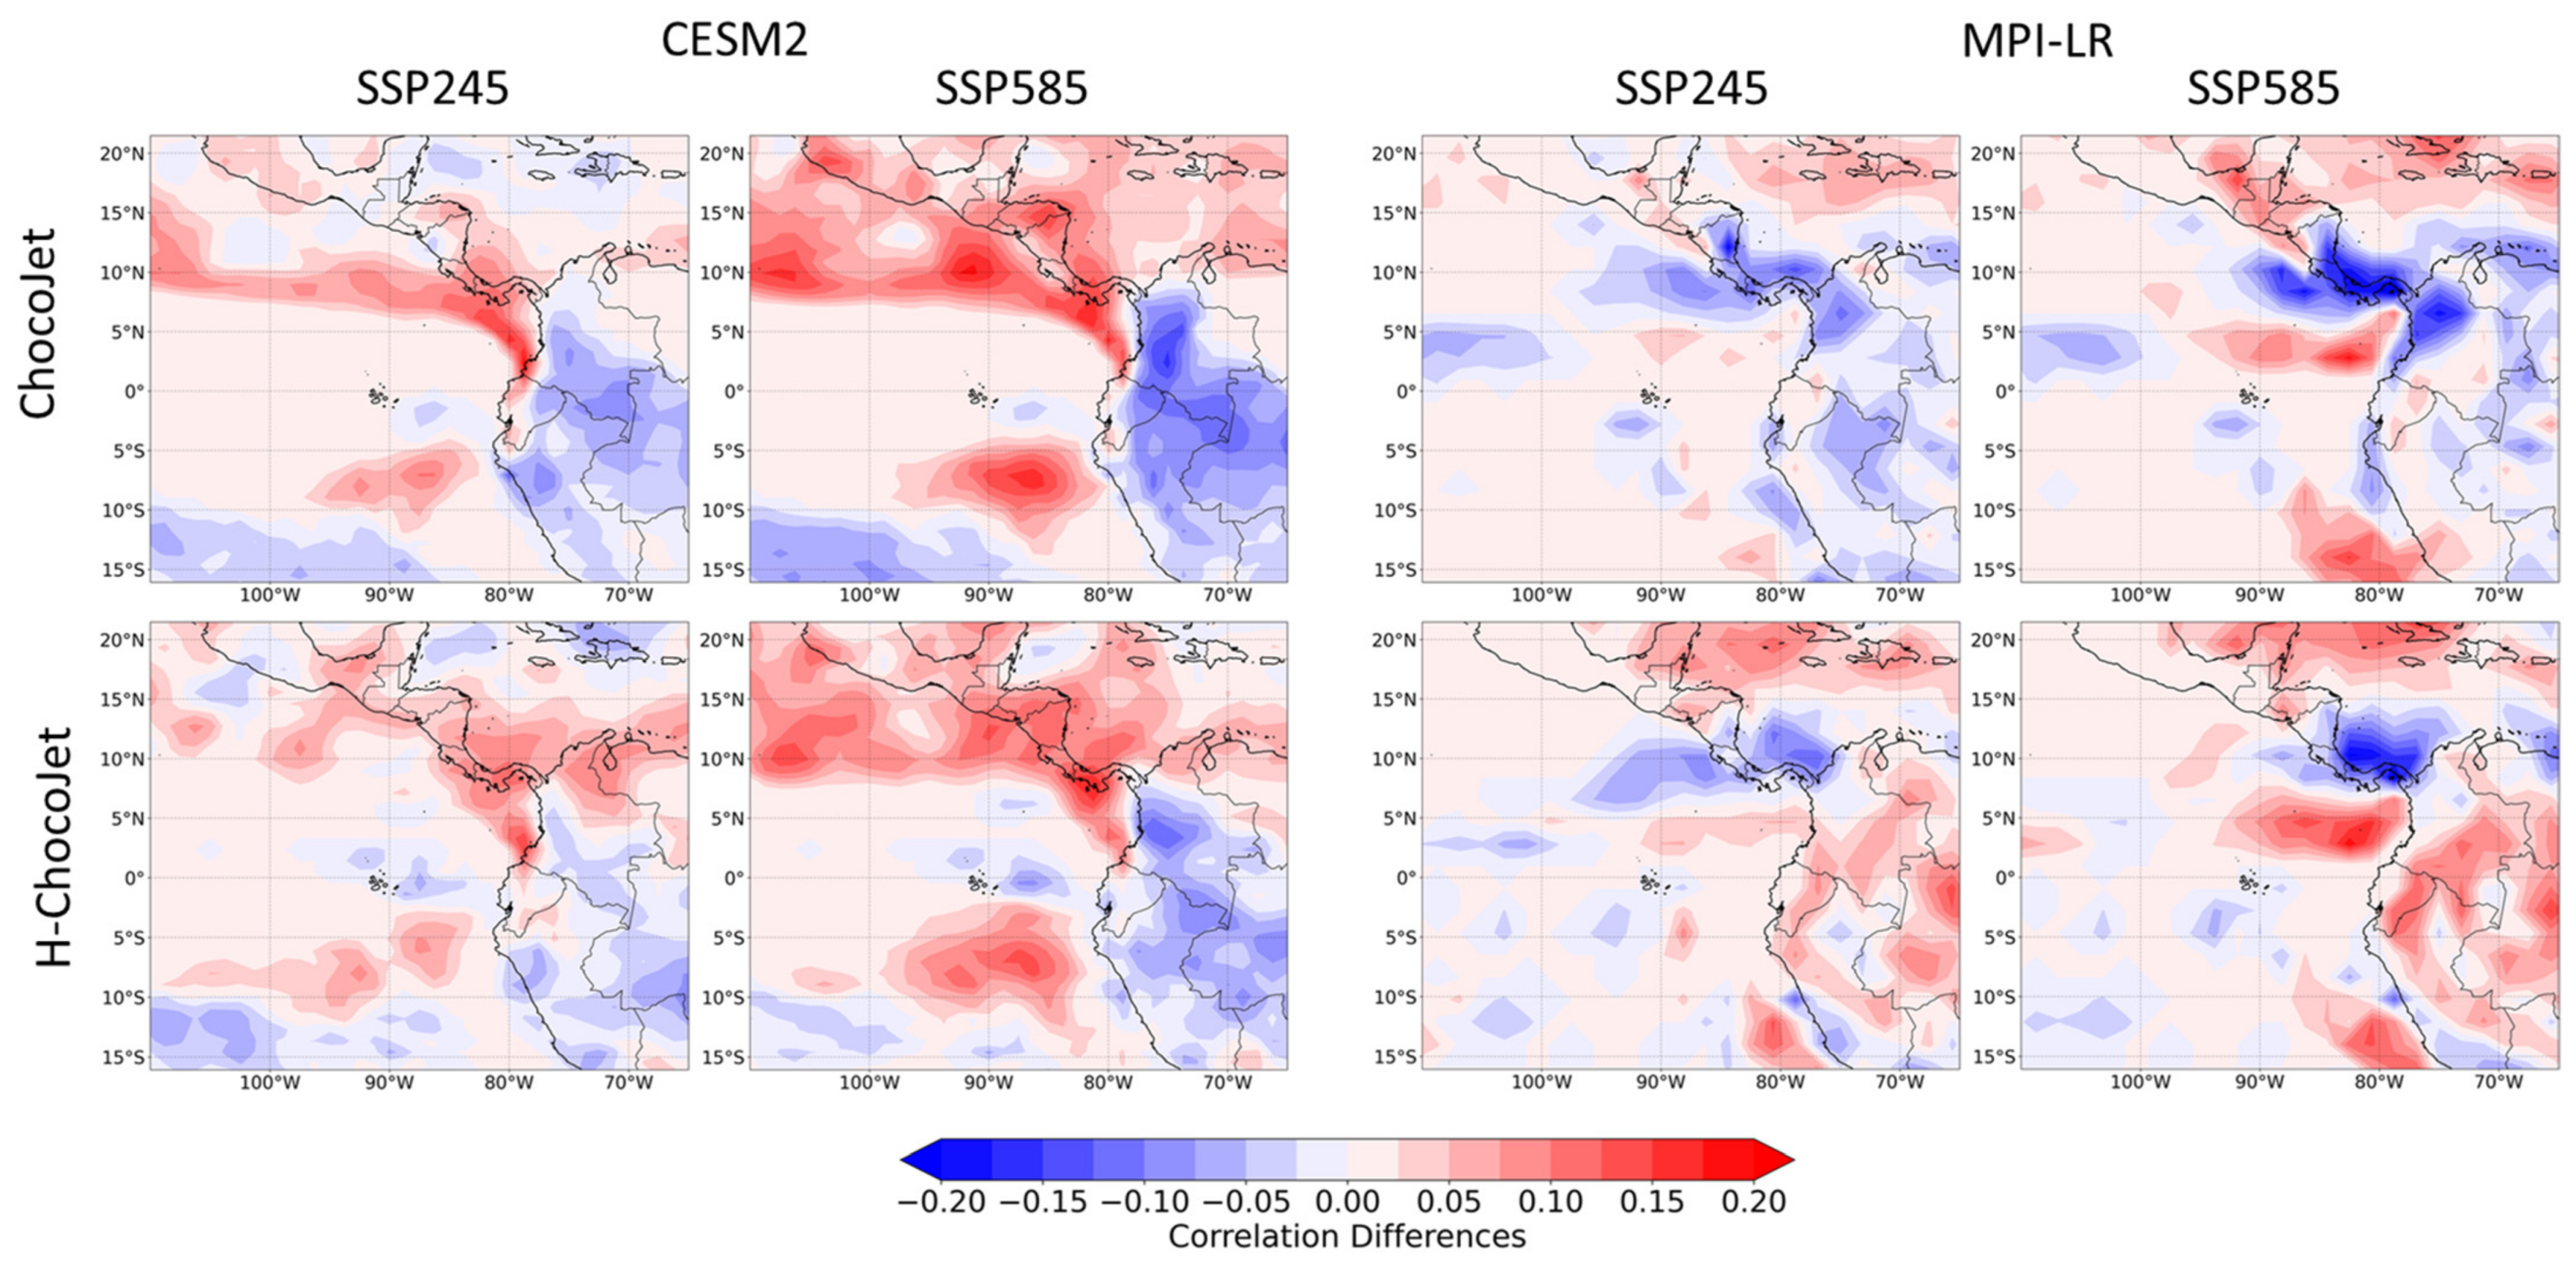
Figure 7 shows the differences between the 21st century (2073–2100) minus historical daily correlation patterns. The result shows that areas with positive daily correlation patterns hold for the CESM2 model and that the relationship is enhanced as we increase from the middle to the rapid growth-forcing trajectory. MPI-LR shows a southward shift of the positive precipitation-ChocoJet correlations likely in relation to the southward shift of the ITCZ and weakening of ChocoJet shown earlier (Figure 4). These features are consistent for both ChocoJet and H-ChocoJet based relationships. It is worth noticing a coherent decrease in inland precipitation-ChocoJet and precipitation-H-ChocoJet relationships and the development of positive correlation patterns over EPAC cold tongue area.

3.3. Sea Surface Temperature and ENSO

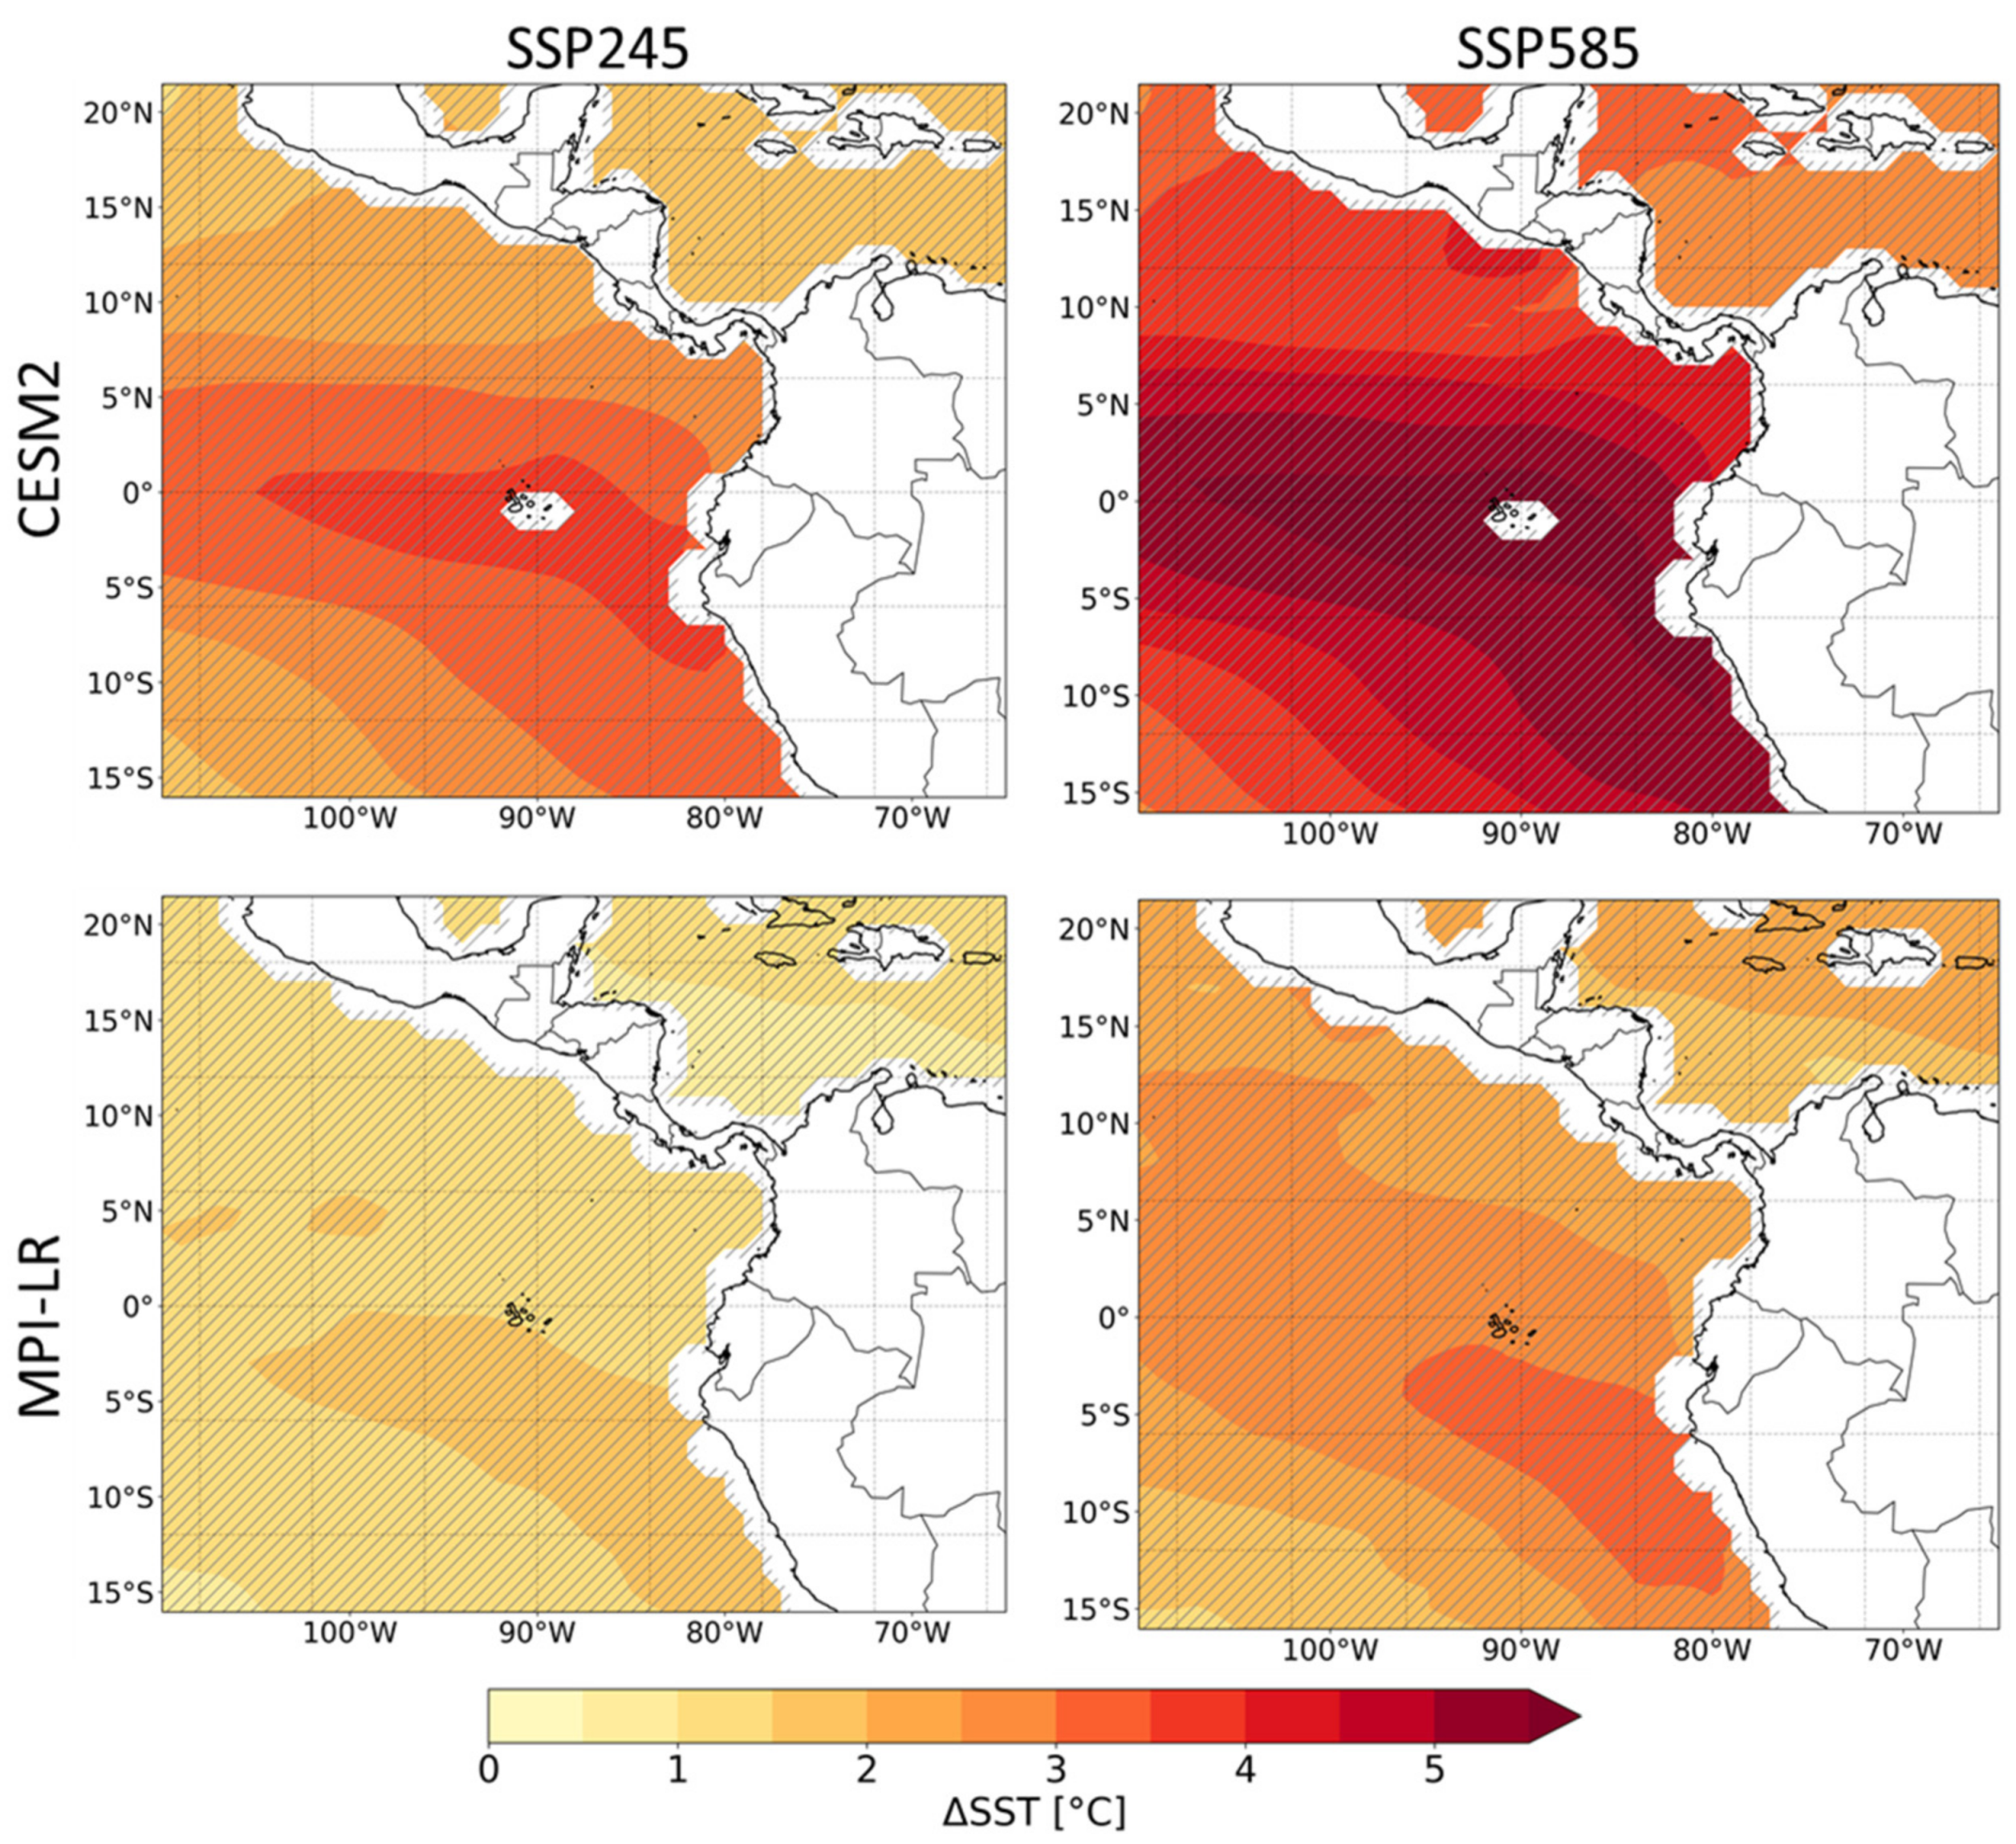
Next, modeling evidence shows that the future changes in the ITCZ, ChocoJet, and the above precipitation-ChocoJet relationships are interrelated. Figure 8 shows the projected SST changes for CEMS2 and MPI-LR models for the middle and rapid growth forcing trajectories. By the late 21st century, the SSP585 shows an equatorial cold tongue warming more rapidly than the surrounding regions with mean SST increases reaching 5.7 °C (3.7 °C) in CESM2 (MPI-LR). Hence, reducing the thermal gradients between the cold tongue region and the far EPAC, and in turn weakening the thermal-driven cross-equatorial circulation and ChocoJet.
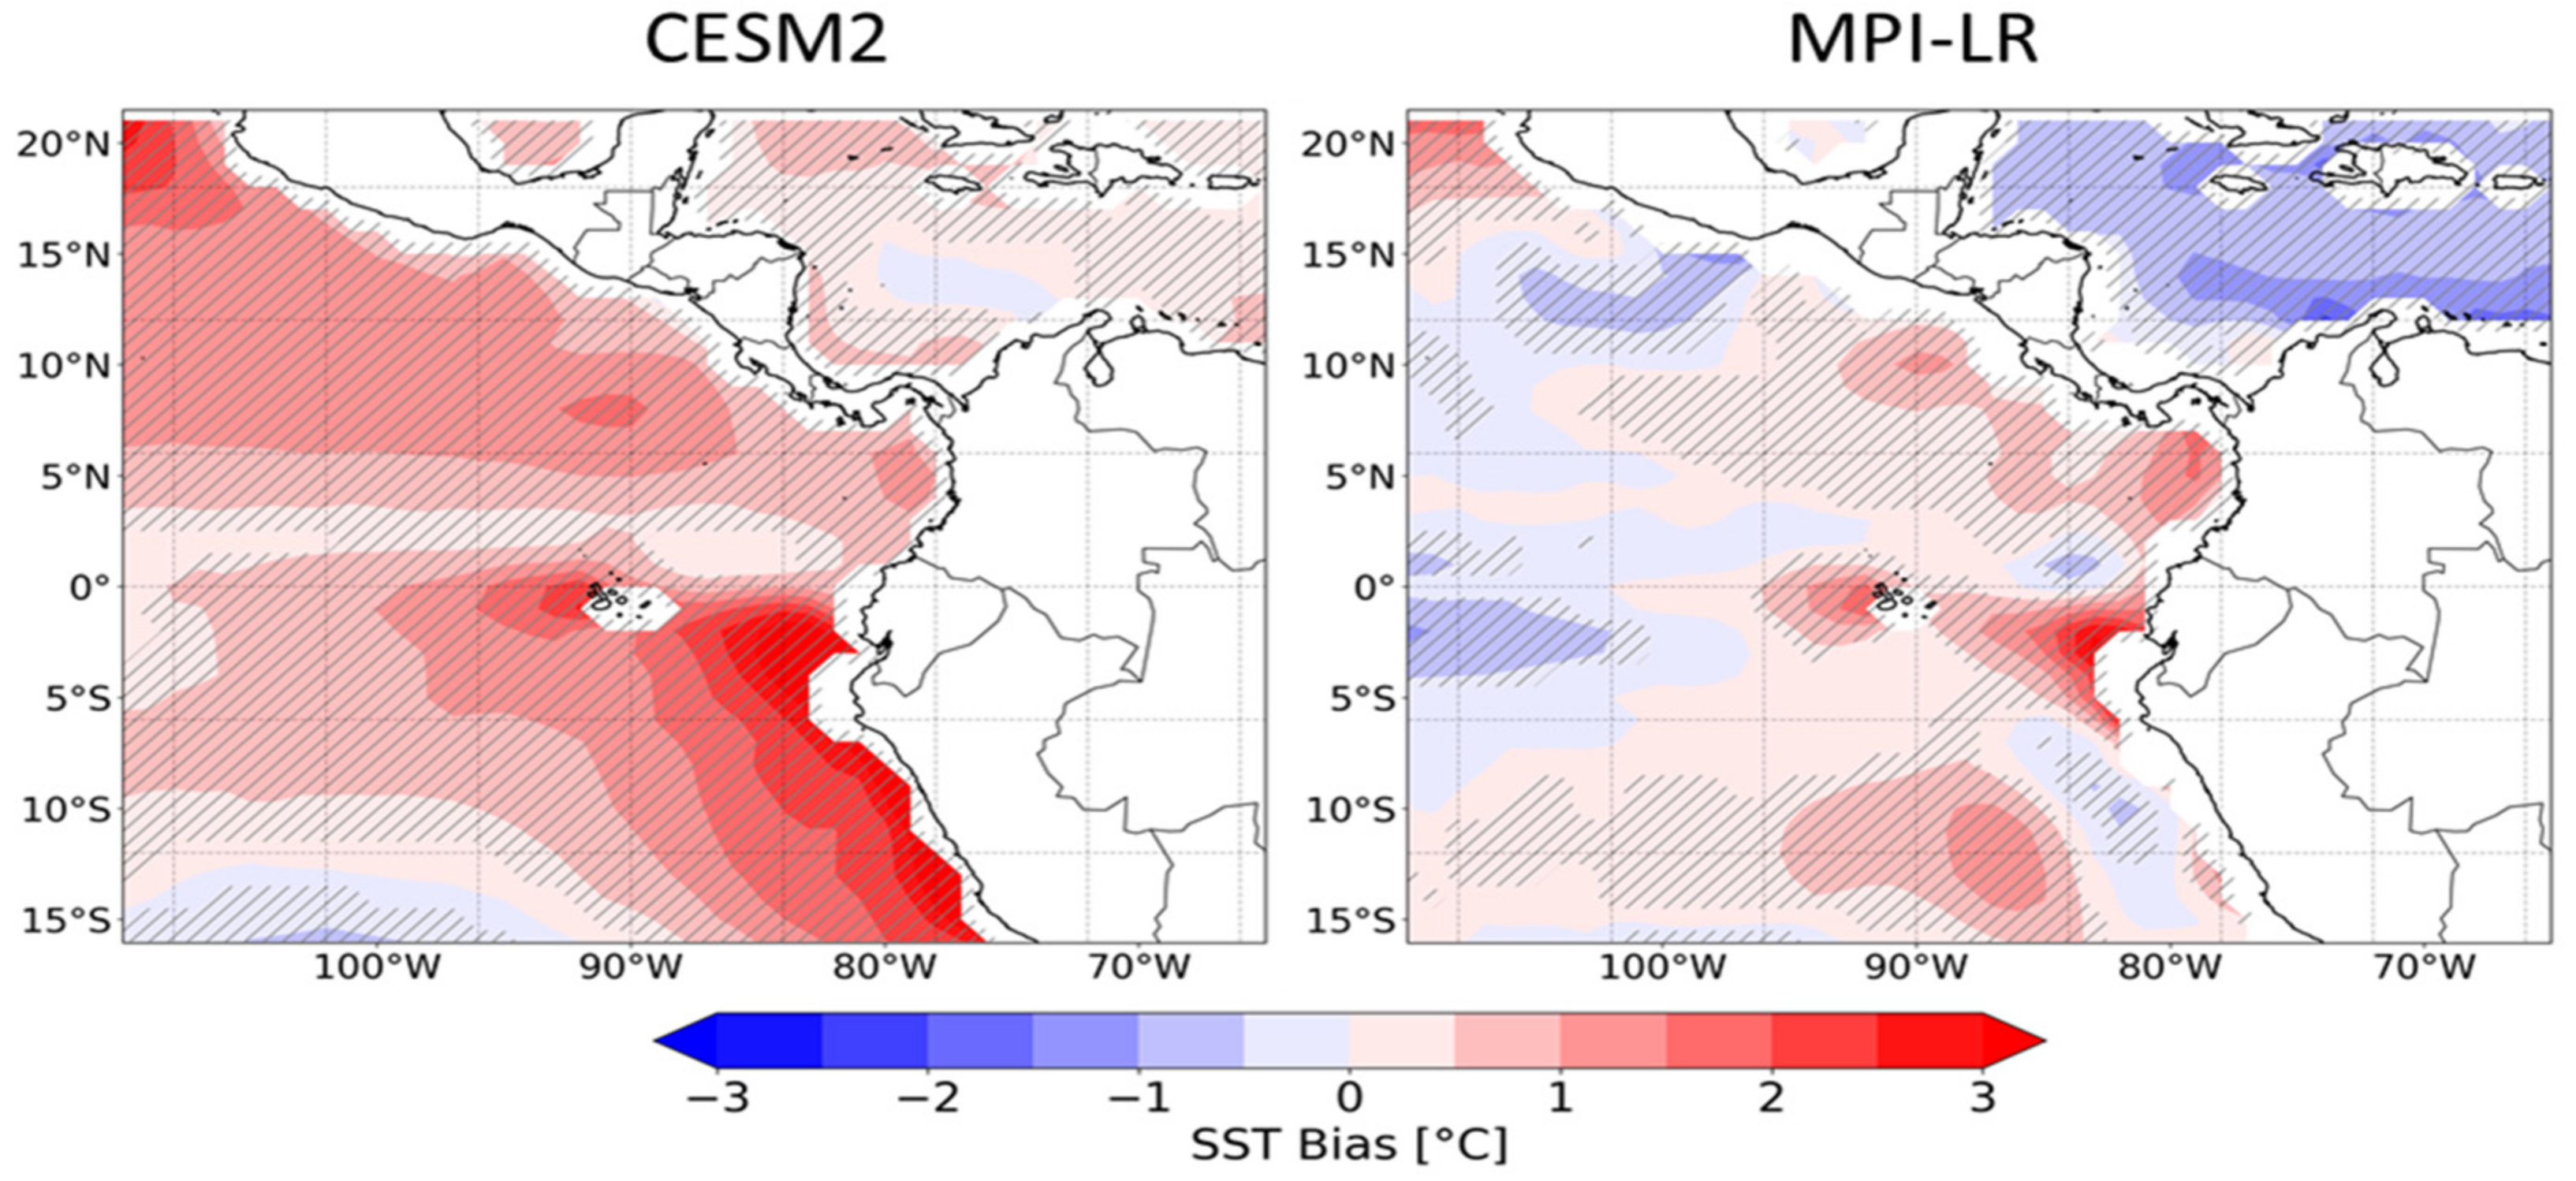
It is worth highlighting that the outlined SST climate change signal occurs over a region of a well-known and rather large systematic SST biases. Such warm SST biases have been related to ocean-atmosphere coupling issues in upwelling zones in the eastern boundary subtropical regions [47,48,49]. Figure 9 shows that CESM2 and MPI-LR SST warm bias ~2–3 °C offshore Ecuador and Northern Peru, with the MPI-LR performing relatively better along EPAC. Following the same reasoning above, it is possible that these SST warm biases could be related to the weaker cross-equatorial low-level flow biases shown in Figure 3 per their thermal-driven process-based connection. These biases are relatively large when compared to typical ENSO signals and could have substantial impacts in ENSO characteristics in the region. Isolating the uncertainties caused by the model bias to those related to ENSO internal variability is difficult in traditional Coupled Model Intercomparison Project phase participating models; contrasting against their atmospheric-only GCMs versions could help link the role of biases to those of the trends and internal ENSO variability [47,50].
Table 1 shows the simulated frequency and intensity anomaly of El Niño and La Niña for different scenarios and time slices. In general, both models show that under future climate scenarios there is an increase in frequency in El Niño phase and a rather ambiguous trend in La Niña phase. In terms of intensity, mean SSTA results do not show a consistent trend pattern. It is possible that the simulated warming trend in the cold tongue SST (Figure 8) is related to the increase El Niño. In addition, the rather weak but increase in precipitation-ChocoJet correlation over the cold tongue region (Figure 7) appears to be related to the outlined SST warming trend, which can enhance maritime fluxes into the atmosphere and likely triggering localized atmospheric convection.

4. Discussion

This study examines the ability of two CMIP6 GCM (CESM2 and MPI-LR) in simulating multiscale precipitation-ChocoJet relationships and offers plausible observable and predictable connections driving related future climate precipitation changes over the far EPAC.
These results are consistent with previous studies reporting a future weakening of southeasterly trade winds over the Southeastern Pacific [51], and a southward shift of ITCZ precipitation over the EPAC [23,52,53,54]. It is possible that such weakening of ChocoJet is also related to the southward migration of the ITCZ, as showed by previous studies using ensemble approaches [20,22,53].
In agreement with observations, the examined GCM simulated output shows that days with enhanced ChocoJet and H-ChocoJet are related to enhanced precipitation over the far EPAC, Southern Central America, and NWSA. This result agrees well with recent studies that related days with enhanced ChocoJet to an environment favoring the development of MCSs [2,55], and further supports that ChocoJet enhances deep convection and modulates overall hydroclimate in the region [12,14,20,32,56,57,58]. In general, we found that the CESM2 model appears to be superior in simulating low-level circulation and precipitation than the MPI-LR model. However, both models simulate an ITCZ that is shifted northward compared to observations. Biases in the meridional locations and intensity of the ITCZ has been related to parameterization limitations in the transition from cumulus to deep convection in regions with relatively strong SST gradients [59,60]. Despite the relatively good agreement in daily precipitation-ChocoJet correlation patterns, the MPI simulation exhibit a dry bias in representing the maritime precipitation maximum over the EPAC. It is possible that these biases are partly related to GCMs limitations in resolving MCSs [4,30,61], in combinations with northward bias shift of the ITCZ, and the smooth topography in the relatively coarse GCM model [62].
Figure 6 and Figure 7 show pattern correlations highlighting that a northward bias in precipitation over the far EPAC is also related to a weaker ChocoJet. We speculate that the northward bias of the ITCZ in both examined models (Figure 3) can be related to model limitations in cumulus parameterization the formation of organized precipitation over the western slopes of the Andes mountains and subsequent generation of westward and offshore propagation of organized precipitation systems [2]. For example, the rather smooth Andes topography in GCMs reduces the depth and intensity of the directional shear between the low-level southwesterly flow over the far EPAC, the mid-level easterly trade winds [2] and can limit the mid-tropospheric westward propagating gravity waves forcing sustained precipitation as expressed in Mapes et al. [63] and Yepes et al. [64]. Higher-resolution GCM or downscaling GCM projections with Regional Climate Models can help investigate such limitations and improve our understanding of the role of the Andes mountains and land-ocean distribution on organized convection in the region.
Precipitation-ChocoJet correlation patterns emphasize the far EPAC and western Caribbean region as a significant center of convection activity during enhanced ChocoJet days. The West Caribbean extension of precipitation-ChocoJet relationship is encouraging as Valencia et al. [65] shows that during the OTREC field campaign [66], convectively coupled TEWs propagating over western Caribbean interact with the EPAC circulation, with TEW low-pressure systems favoring enhanced ChocoJet but with a southerly wind perturbation component. Hence, positive correlations scores found over the western Caribbean Sea area can be partly related to convectively coupled Tropical Easterly Waves, which seasonal activity mostly coincide with that of the active season of the ChocoJet. Other forms of synoptic disturbances or internal variability can influence the daily precipitation-ChocoJet relationships [4,67]. Isolating the specific forms of synoptic forcings modulating the outlined relationships is beyond the scope of this study.
Our results are consistent with previous studies reporting a future weakening of southeasterly trade winds over the Southeastern Pacific [51], and a southward shift of ITCZ precipitation [23,52,53]. It is possible that such weakening of ChocoJet is also related to the southward migration of the ITCZ, as showed by previous studies using ensemble approaches [20,22,53]. Tropical EPAC SSTA and their future trends can change the intensity of ChocoJet, and these changes have consequences on the precipitation in the region [1,68,69,70]. The GCMs we examined showed a northward bias of the ITCZ meridional location over the EPAC. Previous research suggested that biases in the meridional location of the ITCZ were related to atmospheric energy fluxes across the equator [7,71]. Uncertainties in GCM simulated precipitation have also been attributed to GCM resolution and their representation of circulation and orographic processes [23], misrepresentation of the double ITCZ [14,20,25], and SST biases in the eastern ocean upwelling zones [47,72] albeit other structural GCM errors remaining in atmospheric-only simulations [47].
ENSO variability modulates EPAC cross-equatorial SST gradients, which in turn influence the spatial distribution of precipitation [7] and ChocoJet statistics [14,20,68]. We speculate, however, that as future SSTs in the cold tongue region warm up faster than the surrounding areas, the thermal contrast providing a direct local forcing of the low-level cross-equatorial flow decreases, driving the weakening of ChocoJet, and favor southward migration of the ITCZ [22]. Although this climate change pathway and attribution are plausible, ENSO trends and future impacts could be also related to changes in the Walker cell intensity which connect the regional impacts through anomalies in the zonal vertical circulation cells with enhanced rising motion over the tropical EPAC and enhanced sinking motion over NWSA [7].
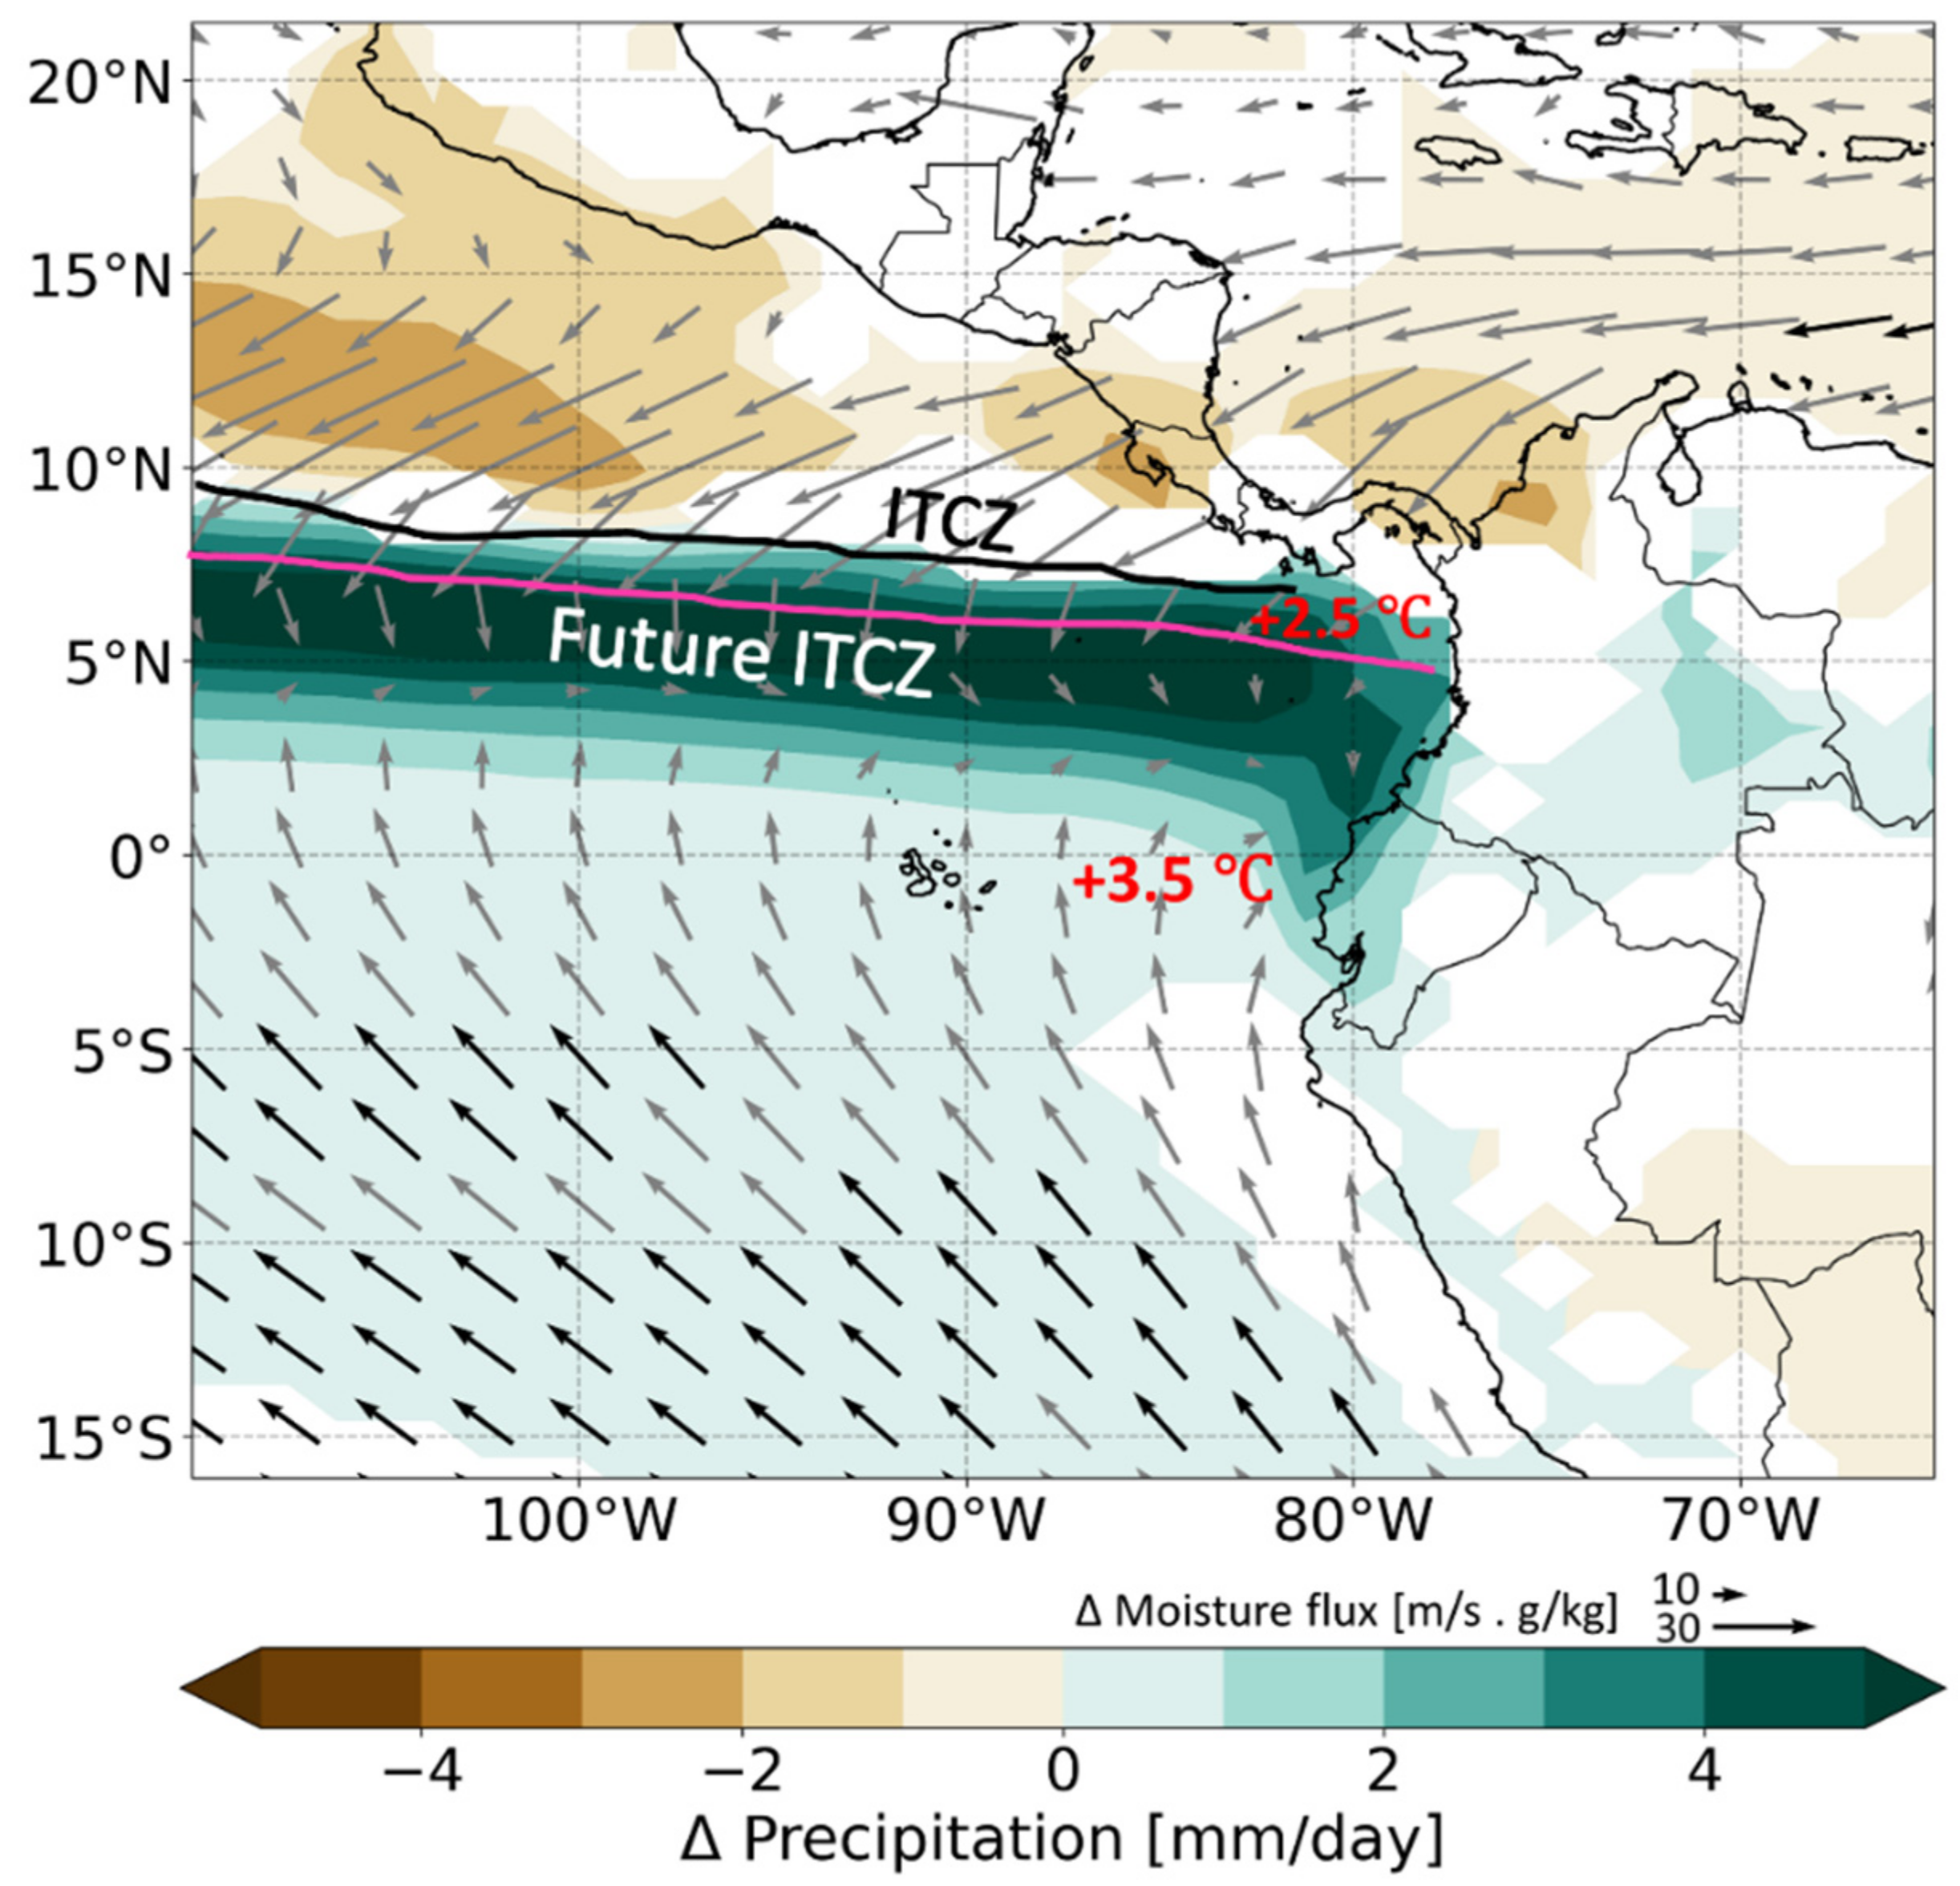
Figure 10 shows CESM2 late 21st century climate change projections based on the SSP245 forcing scenario for low-level moisture flux convergence, precipitation, and SSTs. Consistent with the future weakening of the cross-equatorial flow and ChocoJet, and the outlined southward migration of the ITCZ, our results show a southward migration of the low-level moisture flux convergence in the late 21st century. GCMs show faster warming in the tropical SST cold tongue region (Figure 8), likely due to a future increase in the frequency of El Niño 1+2 events (Table 1). The faster warming of the cold tongue SSTs reduces the thermal gradient between equatorial and far EPAC areas, which maintains ChocoJet and the broad cross equatorial moisture transport. The coherent southward migration of the ITCZ is also related to an enhanced easterly and southwesterly trade winds, with regional impacts consisting in drier a Central America and Northern Colombia and a wetter SW Colombia and NW Ecuador. Despite the weaker southwesterly flow related to ChocoJet over the far EPAC, it is possible that the warmer SSTs enhance the sensible and latent heat surface fluxes increasing the downward Moist Static Energy and convection invigoration. A detailed examination of this air–sea interaction is somehow limited by the sensitivity of the moisture fluxes through the Clausius–Clapeyron relationship due to the persistent warm SST biases in the cold tongue area in CMIP models (Figure 9) [49].

5. Conclusions

Examining the confidence in the IPCC GCM climate change scenarios and assessing their uncertainties are of utmost importance for climate change risk projections. Multiscale model diagnostic efforts targeting simulated precipitation are crucial for improvement in the next generation of GCM models.
Our results help gain confidence in climate change projections by relating the more uncertain precipitation processes to relatively more observable and predictable circulation features. This study focuses on the ability of these models to simulate day-to-day precipitation-ChocoJet correlation patterns. The advantage of daily correlation patterns over monthly is that monthly correlation patterns smooth out the rich synoptic and more localized ChocoJet influence in the region. In close agreement with observations, simulated day-to-day ChocoJet-precipitation correlation patterns show that a stronger ChocoJet is related to more precipitation. Models keep similar correlation patterns during late 21st century, but the score of positive correlation in the projections shift southward and more offshore than historical correlations, a trend that we related to the climate change weakening of ChocoJet and a southward shift of the ITCZ during late 21st century. It is worth highlighting that our precipitation-ChocoJet correlation patterns are based on a bulk approach that mixes all sources of synoptic-scale variability affecting both parameters. Day-to-day precipitation variability in the region has been partly related to the Tropical Easterly Waves incursions in the Caribbean [73,74], internal variability [4], among other variability sources.
This process-based diagnostic analysis help add confidence in climate change precipitation projections. We concluded that an asymmetrical warming between the cold tongue EPAC region and the far EPAC, together to an increased in frequency of the warm phase of ENSO-like interannual variability weakens the thermal gradient that support the weakening of ChocoJet and the southward migration of the ITCZ over the far EPAC region. However, a systematic analysis using all available CMIP6 ensemble members is warranted for more robust results and possibly generalizing our conclusions. Additionally, discriminating among sources of day-to-day variability can help realize other model uncertainties and better understand GCM-based precipitation simulations and their associated remote or regional climate change projections pathways.
Future investigation examining how Madden-Julian Oscillations modulate the background environment in the region and the outline precipitation and ChocoJet projections is necessary for a deeper understanding of the multiscale precipitation variability in the region. Latest studies assessing CMIP5,6-GCM performances in simulating Madden-Julian Oscillations are encouraging [75], but systematic underestimation of their variability in CMIP6 models remains [76].

Author Contributions

Conceptualization, resources, funding acquisition, supervision and project administration, J.F.M.; data curation, software and visualization, J.V.; methodology, validation, formal analysis, investigation, writing—original draft preparation; writing—review and editing, J.V. and J.F.M. All authors have read and agreed to the published version of the manuscript.

Funding

Support for this work started under NSF grant 1922918 and resources by the Division of Atmospheric Sciences, Desert Research Institute, Reno, NV. The study continued without external funding and finished thanks to personal resources and in-kind support by J.M.

Institutional Review Board Statement

Not applicable.

Informed Consent Statement

Not applicable.

Data Availability Statement

The data that support the findings of this study are available from open-access datasets: CMIP6: https://esgf-node.llnl.gov/search/cmip6/ (accessed on 15 May 2021); GPM: https://pmm.nasa.gov/GPM (accessed on 1 October 2020); HOASP: https://opendata.dwd.de/climate_environment/GPCC/html/HOGP_V002.html (accessed on 1 October 2020); ERA5: Reanalysis data is https://www.copernicus.eu/ (accessed on 3 March 2021).

Acknowledgments

We thank the World Climate Research Programmer’s working group on Coupled Modelling, which is responsible for CMIP. In addition, we would like to thank NASA for providing the GPM dataset, NCAR for providing the HOASP dataset, and the European Centre for Medium-Range Weather Forecasts (ECMWF) for providing the ERA5 data. The authors also thank three anonymous reviewers for their insightful comments which helped improve the quality of this study.

Conflicts of Interest

The authors declare no conflict of interest.

References

  1. Poveda, G.; Mesa, O.J. On the Existence of Lloró (the Rainiest Locality on Earth): Enhanced Ocean-Land-Atmosphere Interaction by a Low-Level Jet. Geophys. Res. Lett. 2000, 27, 1675–1678. [Google Scholar] [CrossRef] [Green Version]
  2. Mejía, J.F.; Yepes, J.; Henao, J.J. Towards a Mechanistic Understanding of Precipitation Over the Far Eastern Tropical Pacific and Western Colombia, One of the Rainiest Spots on Earth. J. Geophys. Res. Atmos. 2021, 126, e2020JD033415. [Google Scholar] [CrossRef]
  3. Liu, N.; Liu, C.; Chen, B.; Zipser, E. What Are the Favorable Large-Scale Environments for the Highest-Flash-Rate Thunderstorms on Earth? J. Atmos. Sci. 2020, 77, 1583–1612. [Google Scholar] [CrossRef] [Green Version]
  4. Whitaker, J.W.; Maloney, E.D. Genesis of an east pacific easterly wave from a Panama bight MCS: A case study analysis from June 2012. J. Atmos. Sci. 2020, 77, 3567–3584. [Google Scholar] [CrossRef]
  5. Jaramillo, D.; Vélez, M.I.; Escobar, J. Mid to late holocene dry events in Colombia’s super humid Western Cordillera reveal changes in regional atmospheric circulation. Quat. Sci. Rev. 2021, 261, 106937. [Google Scholar] [CrossRef]
  6. Sarachik, E.S.; Cane, M.A. The El Niño-Southern Oscillation Phenomenon; Cambridge University Press: New York, NY, USA, 2010; ISBN 9780521847865. [Google Scholar]
  7. Cai, W.; McPhaden, M.J.; Grimm, A.M. Climate impacts of the El Niño–Southern Oscillation on South America. Nat. Rev. Earth Environ. 2020, 1, 215–231. [Google Scholar] [CrossRef]
  8. Salas, H.D.; Poveda, G.; Mesa, Ó.J.; Marwan, N. Generalized Synchronization Between ENSO and Hydrological Variables in Colombia: A Recurrence Quantification Approach. Front. Appl. Math. Stat. 2020, 6, 3. [Google Scholar] [CrossRef]
  9. Grimm, A.M.; Tedeschi, R.G. ENSO and extreme rainfall events in South America. J. Clim. 2009, 22, 1589–1609. [Google Scholar] [CrossRef]
  10. Poveda, G.; Vélez, J.I.; Mesa, O.; Hoyos, C.; Mejía, J.; Barco, O.J.; Correa, P.L. Influencia de fenómenos macroclimáticos sobre el ciclo anual de la hidrología Colombiana: Cuantificación lineal, no lineal y percentiles probabilísticos. Meteorol. Colomb. 2002, 6, 121–130. [Google Scholar]
  11. Cerón, W.L.; Kayano, M.T.; Andreoli, R.V.; Canchala, T.; Carvajal-Escobar, Y.; Alfonso-Morales, W. Rainfall Variability in Southwestern Colombia: Changes in ENSO-Related Features. Pure Appl. Geophys. 2021, 178, 1087–1103. [Google Scholar] [CrossRef]
  12. Poveda, G. La hidroclimatología de Colombia: Una síntesis desde la escala inter-decadal hasta la escala diurna. Acad. Colomb. Cienc 2004, 28, 201–222. [Google Scholar]
  13. Tian, B.; Dong, X. The Double-ITCZ Bias in CMIP3, CMIP5, and CMIP6 Models Based on Annual Mean Precipitation. Geophys. Res. Lett. 2020, 47, e2020GL087232. [Google Scholar] [CrossRef]
  14. Arias, P.A.; Martínez, J.A.; Vieira, S.C. Moisture sources to the 2010–2012 anomalous wet season in northern South America. Clim. Dyn. 2015, 45, 2861–2884. [Google Scholar] [CrossRef]
  15. Wang, C. Variability of the Caribbean Low-Level Jet and its relations to climate. Clim. Dyn. 2007, 29, 411–422. [Google Scholar] [CrossRef] [Green Version]
  16. Sakamoto, M.; Ambrizzi, T.; Poveda, G. Moisture Sources and Life Cycle of Convective Systems over Western Colombia. Adv. Meteorol. 2011, 2011, 890759. [Google Scholar] [CrossRef]
  17. Serna, L.M.; Arias, P.A.; Vieira, S.C. Las corrientes superficiales de chorro del Chocó y el Caribe durante los eventos de El Niño y El Niño Modoki. Rev. Acad. Colomb. Cienc. Exactas Físicas Nat. 2018, 42, 410–421. [Google Scholar] [CrossRef]
  18. Hoyos, I.; Dominguez, F.; Cañón-Barriga, J.; Martínez, J.A.; Nieto, R.; Gimeno, L.; Dirmeyer, P.A. Moisture origin and transport processes in Colombia, northern South America. Clim. Dyn. 2017, 50, 971–990. [Google Scholar] [CrossRef]
  19. Morales, J.S.; Arias, P.A.; Martínez, J.A.; Durán-Quesada, A.M. The role of low-level circulation on water vapour transport to central and northern South America: Insights from a 2D Lagrangian approach. Int. J. Clim. 2021, 41, E2662–E2682. [Google Scholar] [CrossRef]
  20. Sierra, J.P.; Arias, P.A.; Vieira, S.C.; Agudelo, J. How well do CMIP5 models simulate the low-level jet in western Colombia? Clim. Dyn. 2017, 51, 2247–2265. [Google Scholar] [CrossRef]
  21. Marengo, J.A.; Ambrizzi, T.; da Rocha, R.P.; Alves, L.M.; Cuadra, S.V.; Valverde, M.C.; Torres, R.R.; Santos, D.C.; Ferraz, S.E.T. Future change of climate in South America in the late twenty-first century: Intercomparison of scenarios from three regional climate models. Clim. Dyn. 2010, 35, 1073–1097. [Google Scholar] [CrossRef]
  22. Steinhoff, D.F.; Monaghan, A.J.; Clark, M.P. Projected impact of twenty-first century ENSO changes on rainfall over Central America and northwest South America from CMIP5 AOGCMs. Clim. Dyn. 2015, 44, 1329–1349. [Google Scholar] [CrossRef]
  23. Arias, P.A.; Ortega, G.; Villegas, L.D.; Martínez, J.A. Colombian climatology in CMIP5/CMIP6 models: Persistent biases and improvements. Rev. Fac. Ing. 2021, 100, 75–96. [Google Scholar] [CrossRef]
  24. Sierra, J.P.; Arias, P.A.; Vieira, S.C. Precipitation over Northern South America and its seasonal variability as simulated by the CMIP5 models. Adv. Meteorol. 2014, 2015, 634720. [Google Scholar] [CrossRef] [Green Version]
  25. Yin, L.; Fu, R.; Shevliakova, E.; Dickinson, R.E. How well can CMIP5 simulate precipitation and its controlling processes over tropical South America? Clim. Dyn. 2012, 41, 3127–3143. [Google Scholar] [CrossRef] [Green Version]
  26. Almazroui, M.; Islam, M.N.; Saeed, F.; Saeed, S.; Ismail, M.; Ehsan, M.A.; Diallo, I.; O’Brien, E.; Ashfaq, M.; Martínez-Castro, D.; et al. Projected Changes in Temperature and Precipitation Over the United States, Central America, and the Caribbean in CMIP6 GCMs. Earth Syst. Environ. 2021, 5, 1–24. [Google Scholar] [CrossRef]
  27. Cerón, W.L.; Andreoli, R.V.; Kayano, M.T.; de Souza, R.A.F.; Jones, C.; Carvalho, L.M.V. The influence of the Atlantic multidecadal oscillation on the Choco low-level jet and precipitation in Colombia. Atmosphere 2020, 11, 174. [Google Scholar] [CrossRef] [Green Version]
  28. Yepes, J.; Poveda, G.; Mejía, J.F. Choco-JEX: A research experiment focused on the Chocó low-level jet over the far eastern Pacific and western Colombia. Bull. Am. Meteorol. Soc. 2019, 100, 779–796. [Google Scholar] [CrossRef]
  29. Jaramillo, L.; Poveda, G.; Mejía, J.F. Mesoscale convective systems and other precipitation features over the tropical Americas and surrounding seas as seen by TRMM. Int. J. Clim. 2017, 37, 380–397. [Google Scholar] [CrossRef]
  30. Moncrieff, M.W. Toward a Dynamical Foundation for Organized Convection Parameterization in GCMs. Geophys. Res. Lett. 2019, 46, 14103–14108. [Google Scholar] [CrossRef] [Green Version]
  31. Pabón-Caicedo, J.D.; Arias, P.A.; Carril, A.F.; Espinoza, J.C.; Borrell, L.F.; Goubanova, K.; Lavado-Casimiro, W.; Masiokas, M.; Solman, S.; Villalba, R. Observed and Projected Hydroclimate Changes in the Andes. Front. Earth Sci. 2020, 8, 1–29. [Google Scholar] [CrossRef]
  32. Sierra, J.P.; Arias, P.A.; Durán-Quesada, A.M.; Tapias, K.A.; Vieira, S.C.; Martínez, J.A. The Choco low-level jet: Past, present and future. Clim. Dyn. 2021, 56, 2667–2692. [Google Scholar] [CrossRef]
  33. Eyring, V.; Bony, S.; Meehl, G.A.; Senior, C.A.; Stevens, B.; Stouffer, R.J.; Taylor, K.E. Overview of the Coupled Model Intercomparison Project Phase 6 (CMIP6) experimental design and organization. Geosci. Model Dev. 2016, 9, 1937–1958. [Google Scholar] [CrossRef]
  34. Gettelman, A.; Hannay, C.; Bacmeister, J.T.; Neale, R.B.; Pendergrass, A.G.; Danabasoglu, G.; Lamarque, J.; Fasullo, J.T.; Bailey, D.A.; Lawrence, D.M.; et al. High climate sensitivity in the Community Earth System Model Version 2 (CESM2). Geophys. Res. Lett. 2019, 46, 8329–8337. [Google Scholar] [CrossRef]
  35. Müller, W.A.; Jungclaus, J.H.; Mauritsen, T.; Baehr, J.; Bittner, M.; Budich, R.; Bunzel, F.; Esch, M.; Ghosh, R.; Haak, H.; et al. A higher-resolution version of the Max Planck Institute Earth System Model (MPI-ESM1.2-HR). J. Adv. Model. Earth Syst. 2018, 10, 1383–1413. [Google Scholar] [CrossRef]
  36. Riahi, K.; Van Vuuren, D.P.; Kriegler, E.; Edmonds, J.; O’Neill, B.C.; Fujimori, S.; Bauer, N.; Calvin, K.; Dellink, R.; Fricko, O.; et al. The Shared Socioeconomic Pathways and their energy, land use, and greenhouse gas emissions implications: An overview. Glob. Environ. Chang. 2016, 42, 153–168. [Google Scholar] [CrossRef] [Green Version]
  37. Mcbride, L.A.; Hope, A.P.; Canty, T.P.; Bennett, B.F.; Tribett, W.R.; Salawitch, R.J. Comparison of CMIP6 historical climate simulations and future projected warming to an empirical model of global climate. Earth Syst. Dyn. 2021, 12, 545–579. [Google Scholar] [CrossRef]
  38. Dominguez, F.; Cañon, J.; Valdes, J. IPCC-AR4 climate simulations for the Southwestern US: The importance of future ENSO projections. Clim. Chang. 2010, 99, 499–514. [Google Scholar] [CrossRef]
  39. Huffman, G.J.; Stocker, E.F.; Bolvin, D.T.; Nelkin, E.J.; Tan, J. GPM IMERG Final Precipitation L3 1 Day 0.1 Degree × 0.1 Degree V06; Savtchenko, A., Ed.; Goddard Earth Sciences Data and Information Services Center (GES DISC): Greenbelt, MD, USA, 2020. Available online: https://disc.gsfc.nasa.gov/datasets/GPM_3IMERGDF_06/summary (accessed on 1 October 2020).
  40. Schröder, M.; Becker, A.; Dietzsch, F.; Fennig, K.; Graw, K.; Gutenstein, M.; Hollmann, R.; Niedorf, A.; Ziese, M. HOAPS/GPCC Global Daily Precipitation Data Record with Uncertainty Estimates Using Satellite and Gauge Based Observations at 1.0°. 2019. Available online: https://gpcc.dwd.de (accessed on 1 October 2020).
  41. Hersbach, H.; Bell, B.; Berrisford, P.; Biavati, G.; Horányi, A.; Muñoz Sabater, J.; Rozum, I. ERA5 Hourly Data on Pressure Levels from 1979 to Present. Copernicus Climate Change Service (C3S) Climate Data Store (CDS). 2020. Available online: https://cds.climate.copernicus.eu/cdsapp#!/dataset/10.24381/cds.bd0915c6?tab=overview (accessed on 3 March 2021).
  42. Pearson, K. Note on regression and inheritance in the case of two parents. Proc. R. Soc. Lond. 1895, 58, 240–242. [Google Scholar]
  43. Krinner, G.; Kharin, V.; Roehrig, R.; Scinocca, J.; Codron, F. Historically-based run-time bias corrections substantially improve model projections of 100 years of future climate change. Commun. Earth Environ. 2020, 1, 29. [Google Scholar] [CrossRef]
  44. Montealegre, J.E. Modelo Institucional del IDEAM Sobre el Efecto Climático de los Fenómenos El Niño y La Niña en Colombia; IDEAM: Bogotá, Colombia, 2007; p. 81. Available online: http://www.ideam.gov.co (accessed on 1 October 2020).
  45. Gallego, D.; García-Herrera, R.; Gómez-Delgado, F.d.P.; Ordoñez-Perez, P.; Ribera, P. Tracking the Choco jet since the 19th Century by using historical wind direction measurements. Earth Syst. Dyn. Discuss. 2018, 1–23. [Google Scholar] [CrossRef]
  46. Bedoya-Soto, J.M.; Aristizábal, E.; Carmona, A.M.; Poveda, G. Seasonal shift of the diurnal cycle of rainfall over Medellin’s valley, Central Andes of Colombia (1998–2005). Front. Earth Sci. 2019, 7, 92. [Google Scholar] [CrossRef]
  47. Large, W.G.; Danabasoglu, G. Attribution and impacts of upper-ocean biases in CCSM3. J. Clim. 2006, 19, 2325–2346. [Google Scholar] [CrossRef] [Green Version]
  48. Li, G.; Xie, S.P. Origins of tropical-wide SST biases in CMIP multi-model ensembles. Geophys. Res. Lett. 2012, 39, 1–5. [Google Scholar] [CrossRef]
  49. Mejia, J.F.; Koračin, D.; Wilcox, E.M. Effect of coupled global climate models sea surface temperature biases on simulated climate of the western United States. Int. J. Clim. 2018, 38, 5386–5404. [Google Scholar] [CrossRef] [Green Version]
  50. Dong, L.; Leung, L.R.; Song, F.; Lu, J. Uncertainty in El Niño-like warming and California precipitation changes linked by the Interdecadal Pacific Oscillation. Nat. Commun. 2021, 12, 6484. [Google Scholar] [CrossRef]
  51. Flores-Aqueveque, V.; Rojas, M.; Aguirre, C.; Arias, P.A.; González, C. South Pacific Subtropical High from the late Holocene to the end of the 21st century: Insights from climate proxies and general circulation models. Clim. Past 2020, 16, 79–99. [Google Scholar] [CrossRef] [Green Version]
  52. Rauscher, S.A.; Giorgi, F.; Diffenbaugh, N.S.; Seth, A. Extension and Intensification of the Meso-American mid-summer drought in the twenty-first century. Clim. Dyn. 2008, 31, 551–571. [Google Scholar] [CrossRef]
  53. Hwang, Y.-T.; Frierson, D.M.W.; Kang, S.M. Anthropogenic sulfate aerosol and the southward shift of tropical precipitation in the late 20th century. Geophys. Res. Lett. 2013, 40, 2845–2850. [Google Scholar] [CrossRef] [Green Version]
  54. Mamalakis, A.; Randerson, J.T.; Yu, J.-Y.; Pritchard, M.S.; Magnusdottir, G.; Smyth, P.; Levine, P.A.; Yu, S.; Foufoula-Georgiou, E. Zonally contrasting shifts of the tropical rain belt in response to climate change. Nat. Clim. Chang. 2021, 11, 143–151. [Google Scholar] [CrossRef]
  55. Murphy, M.J.; Georgakakos, K.P.; Shamir, E. Climatological analysis of December rainfall in the Panama Canal Watershed. Int. J. Clim. 2014, 34, 403–415. [Google Scholar] [CrossRef]
  56. Poveda, G.; Mesa, O.J. Feedbacks between hydrological processes in tropical South America and large-scale ocean–atmospheric phenomena. J. Clim. 1997, 10, 2690–2702. [Google Scholar] [CrossRef]
  57. Ministerio de Ambiente, Vivienda y Desarrollo Territorial. Atlas Climatológico de Colombia; Instituto de Hidrología, Meteorología y Estudios Ambientales (IDEAM 2005): Bogotá, Colombia, 2007; Volume 18. Available online: http://www.ideam.gov.co (accessed on 1 October 2020).
  58. Eslava, R.J.A. Climatología y diversidad climática de Colombia. Rev. Acad. Colomb. Cienc. 1993, 18, 507–539. [Google Scholar]
  59. Samanta, D.; Karnauskas, K.B.; Goodkin, N.F. Tropical Pacific SST and ITCZ biases in climate models: Double trouble for future rainfall projections? Geophys. Res. Lett. 2019, 46, 2242–2252. [Google Scholar] [CrossRef] [Green Version]
  60. Maloney, E.D.; Gettelman, A.; Ming, Y.; Neelin, J.D.; Barrie, D.; Mariotti, A.; Chen, C.-C.; Coleman, D.R.B.; Kuo, Y.; Singh, B.; et al. Process-Oriented Evaluation of Climate and Weather Forecasting Models. Bull. Am. Meteorol. Soc. 2019, 100, 1665–1686. [Google Scholar] [CrossRef]
  61. Warner, T.T.; Mapes, B.E.; Xu, M. Diurnal patterns of rainfall in northwestern South America. Part II: Model simulations. Mon. Weather Rev. 2003, 131, 813–829. [Google Scholar] [CrossRef]
  62. Posada-Marín, J.A.; Rendón, A.M.; Salazar, J.F.; Mejía, J.F.; Villegas, J.C. WRF downscaling improves ERA-Interim representation of precipitation around a tropical Andean valley during El Niño: Implications for GCM-scale simulation of precipitation over complex terrain. Clim. Dyn. 2019, 52, 3609–3629. [Google Scholar] [CrossRef]
  63. Mapes, B.E.; Warner, T.T.; Negri, A.J. Diurnal patterns of rainfall in northwestern South America. Part I: Observations and Context. Mon. Weather Rev. 2003, 131, 799–812. [Google Scholar] [CrossRef]
  64. Yepes, J.; Mejía, J.F.; Mapes, B.; Poveda, G. Gravity waves and other mechanisms modulating the diurnal precipitation over one of the rainiest spots on Earth: Observations and Simulations in 2016. Mon. Weather Rev. 2020, 148, 3933–3950. [Google Scholar] [CrossRef]
  65. Valencia, J.; Yepes; Mejía, J.F.; Builes-Jaramillo, A.; Salas, H.D. Influence of Tropical Easterly Waves on ChocoJet during the 2019 OTREC campaign. J. Hydromet. 2022; in preparation. [Google Scholar]
  66. Raymond, D.J.; Fuchs-Stone, Ž. Emergent properties of convection in OTREC and PREDICT. J. Geophys. Res. Atmos. 2021, 126, e2020JD033585. [Google Scholar] [CrossRef]
  67. Rydbeck, A.V.; Maloney, E.D.; Alaka, G.J., Jr. In situ initiation of east pacific easterly waves in a regional model. J. Atmos. Sci. 2017, 74, 333–351. [Google Scholar] [CrossRef]
  68. Poveda, G.; Álvarez, D.M.; Rueda, Ó.A. Hydro-climatic variability over the Andes of Colombia associated with ENSO: A review of climatic processes and their impact on one of the Earth’s most important biodiversity hotspots. Clim. Dyn. 2011, 36, 2233–2249. [Google Scholar] [CrossRef]
  69. Gallego, D.; García-Herrera, R.; Gómez-Delgado, F.D.P.; Ordoñez-Perez, P.; Ribera, P. Tracking the moisture transport from the Pacific towards Central and northern South America since the late 19th century. Earth Syst. Dyn. 2019, 10, 319–331. [Google Scholar] [CrossRef] [Green Version]
  70. Hoyos, I.; Cañón-Barriga, J.; Arenas-Suárez, T.; Dominguez, F.; Rodríguez, B.A. Variability of regional atmospheric moisture over Northern South America: Patterns and underlying phenomena. Clim. Dyn. 2019, 52, 893–911. [Google Scholar] [CrossRef]
  71. Bischoff, T.; Schneider, T. The Equatorial Energy Balance, ITCZ Position, and Double-ITCZ Bifurcations. J. Clim. 2016, 29, 2997–3013. [Google Scholar] [CrossRef]
  72. Ma, J.; Xu, S.; Wang, B. Warm bias of sea surface temperature in Eastern boundary current regions—A study of effects of horizontal resolution in CESM. Ocean Dyn. 2019, 69, 939–954. [Google Scholar] [CrossRef]
  73. Zuluaga, M.D.; Houze, R.A. Extreme convection of the near-equatorial Americas, Africa, and adjoining oceans as seen by TRMM. Mon. Weather Rev. 2015, 143, 298–316. [Google Scholar] [CrossRef] [Green Version]
  74. Giraldo-Cardenas, S.; Arias, P.A.; Vieira, S.C.; Zuluaga, M.D. Easterly waves and precipitation over northern South America and the Caribbean. Int. J. Clim. 2021, 42, 1483–1499. [Google Scholar] [CrossRef]
  75. Chen, G.; Ling, J.; Zhang, R.; Xiao, Z.; Li, C. The MJO from CMIP5 to CMIP6: Perspectives from tracking MJO precipitation. Geophys. Res. Lett. 2022, 49, e2021GL095241. [Google Scholar] [CrossRef]
  76. Le, P.V.V.; Guilloteau, C.; Mamalakis, A.; Foufoula-Georgiou, E. Underestimated MJO variability in CMIP6 models. Geophys. Res. Lett. 2021, 48, e2020GL092244. [Google Scholar] [CrossRef]
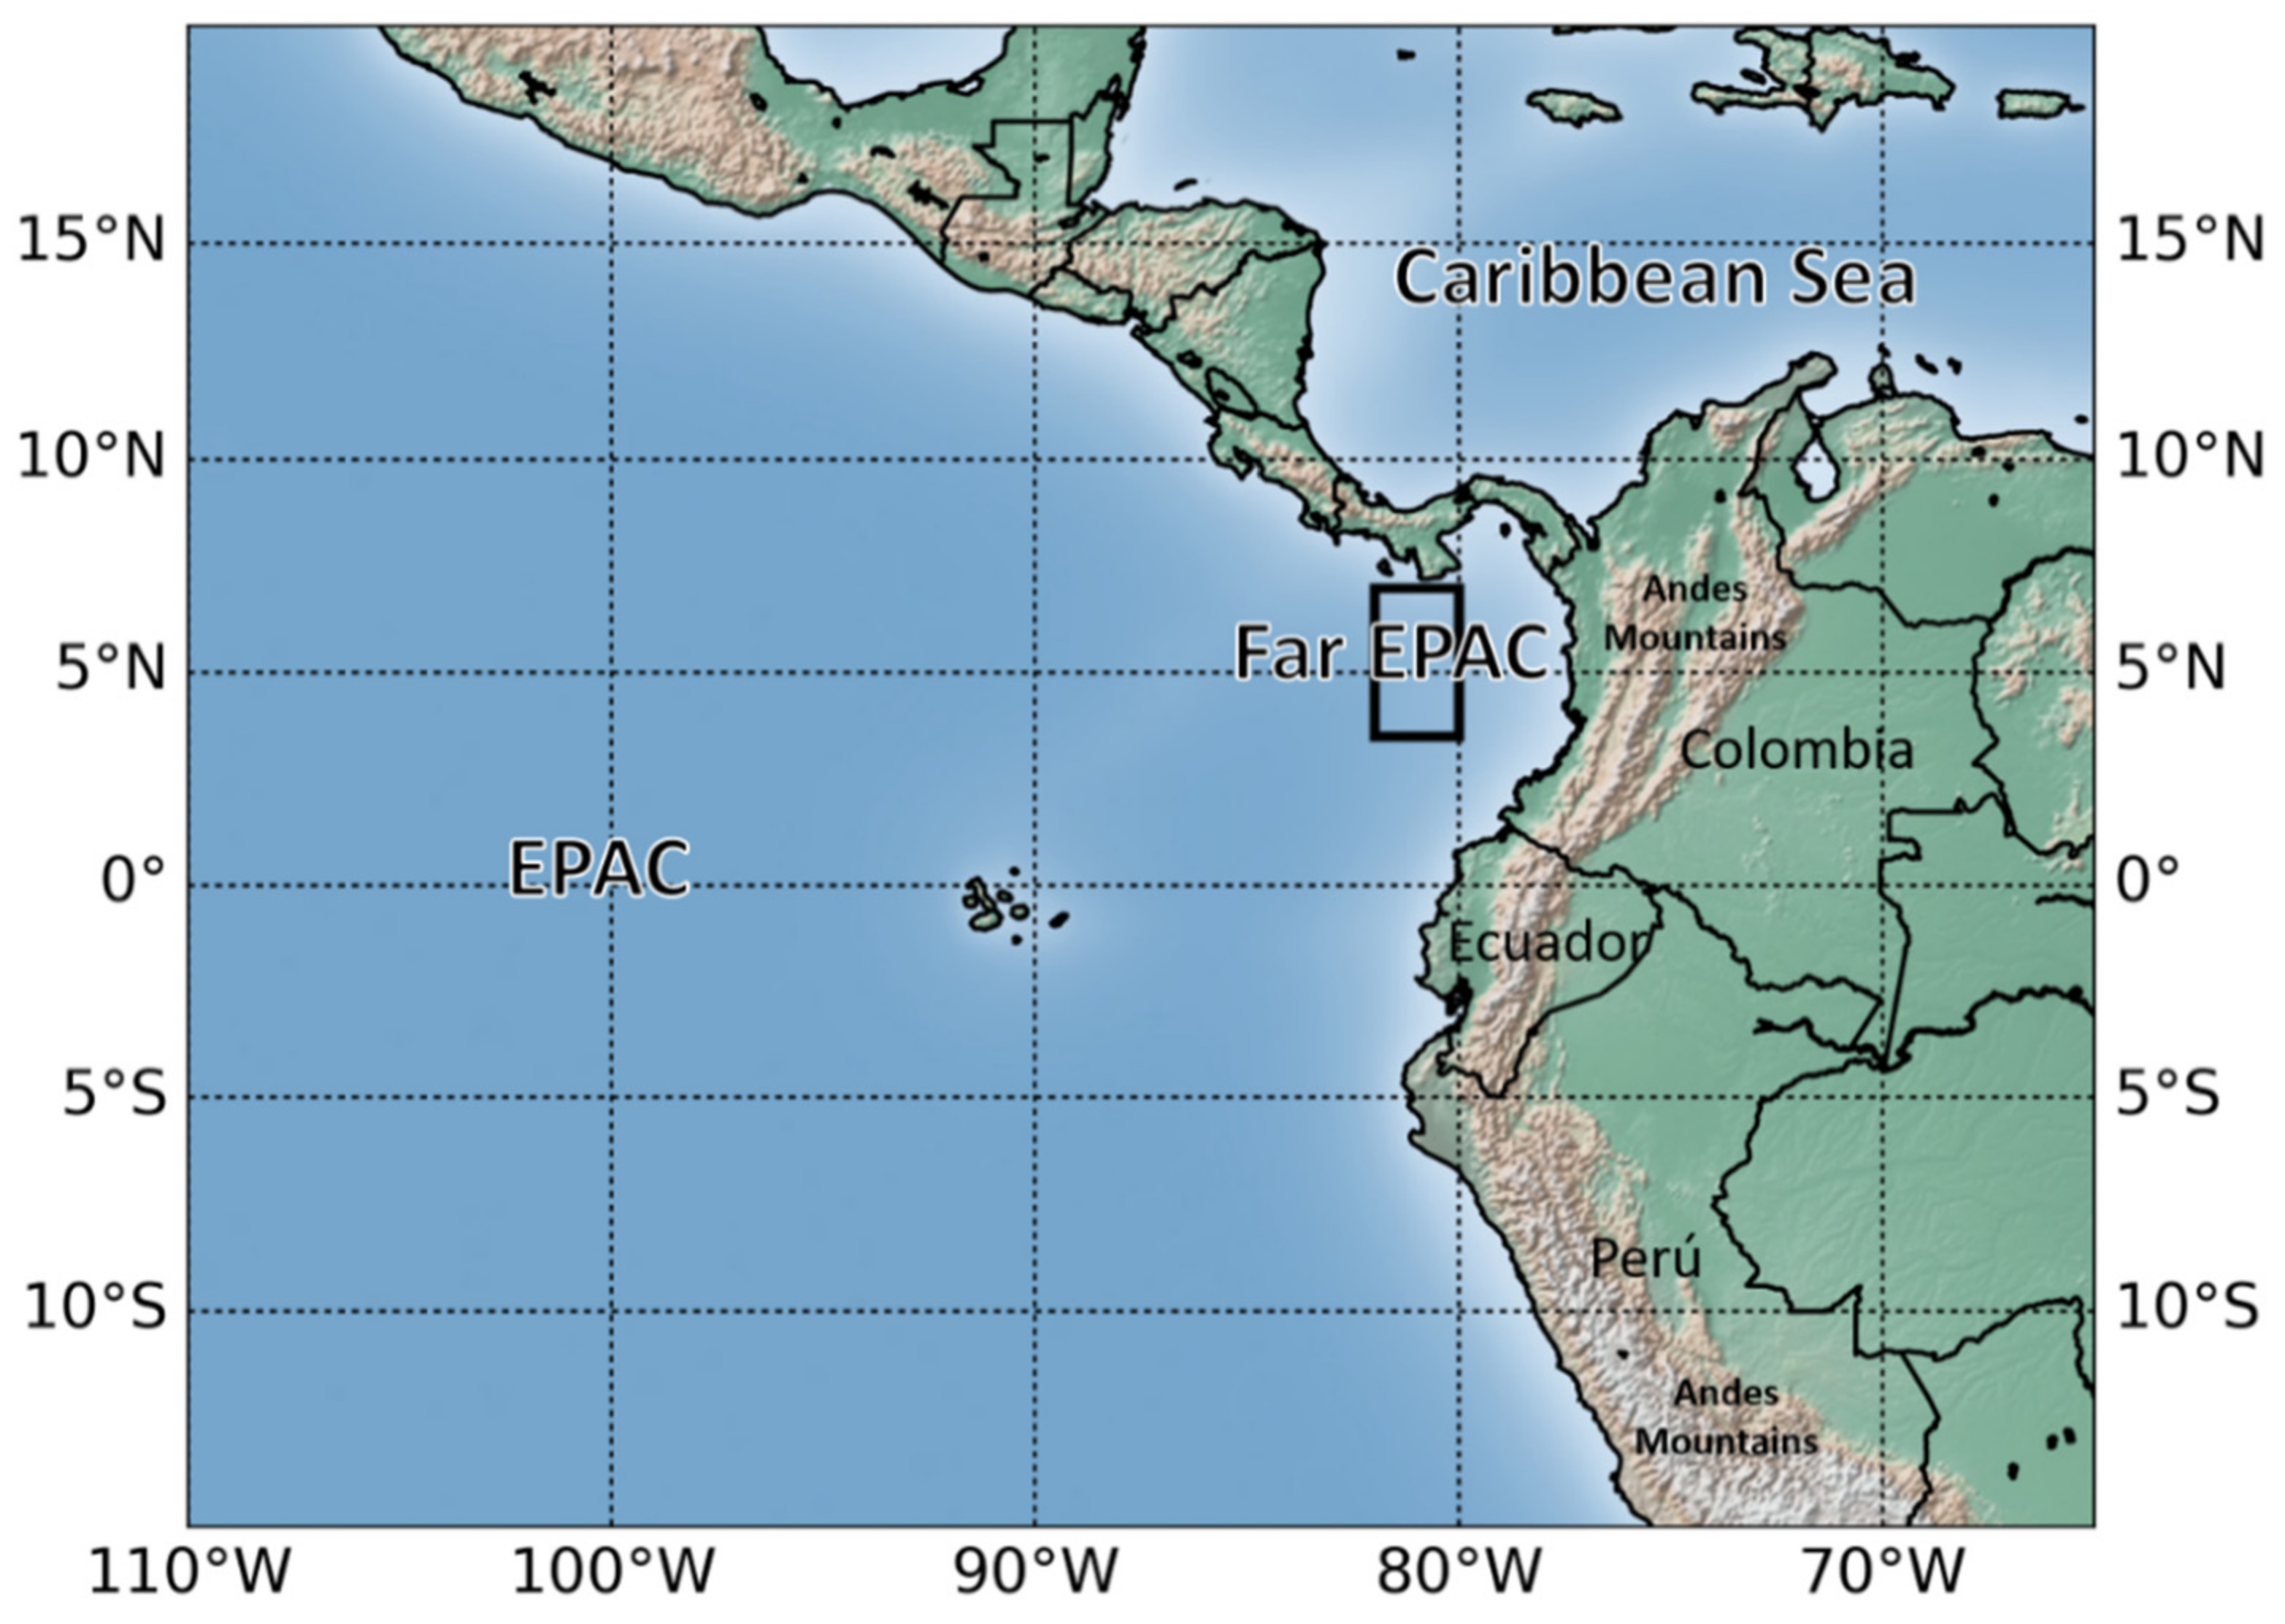
Figure 1. Study region over NWSA including the ChocoJet index spatial average domain (Black box) and basic geographic features mentioned in the text.
Atmosphere 13 01776 g001
Figure 2. June–November long-term daily mean precipitation and 1000 hPa winds for the period 1988–2014, except for GPM (2000–2014). Wind vectors in GPM and HOASP analysis are based on ERA5 averaged during the corresponding analysis period; wind vectors are presented only every 2° arc to avoid cluttering the panels.
Atmosphere 13 01776 g002
Figure 3. June–November long-term mean bias for CESM2 and MPI-LR, for the period 2000–2014 to GPM, and 1988–2014 to HOASP. Wind vector biases were averaged during the same period as precipitation bias estimates. Contours and bold vectors show biases are significant with a 95% confidence level.
Atmosphere 13 01776 g003
Figure 4. Observed and modeled June–November distribution of ChocoJet intensity (left panels) and a latitudinal cross-section of precipitation averaged between 90°–80° W (right panels). Model historical distributions based on the period 1988–2014, except for GPM analysis, which is based on the period 2000–2014. SSP245 and SSP585 climate change forcing scenarios are based on the period 2073–2100.
Atmosphere 13 01776 g004
Figure 5. Observed and simulated monthly precipitation-ChocoJet Pearson correlation patterns. Analyses are based on June–November for the period of 1988–2014, except for the GPM-based precipitation products (2000–2014). Hatched areas represent the correlation coefficients with a significance level exceeding the p-value of 0.05.
Atmosphere 13 01776 g005
Figure 6. Observed and simulated historical daily precipitation-ChocoJet (top panels) and precipitation-H-ChocoJet (bottom panels) Pearson correlation patterns. Analyses are based on June–November for the period of 1988–2014, except for the GPM-based precipitation products (2000–2014). Hatched areas represent the correlation coefficients with a significance level exceeding the p-value of 0.05.
Atmosphere 13 01776 g006
Figure 7. June–November Pearson correlation differences between late 21st-century (2073–2100) minus historical (1988–2014); for SSP245 and SSP585 climate change forcing scenarios) and (top panels) precipitation-ChocoJet and (bottom panels) precipitation-H-ChocoJet daily correlation patterns.
Atmosphere 13 01776 g007
Figure 8. June–November SST changes for late 21st century (2073–2100; SSP245 and SSP585 climate change forcing scenarios) minus historical (1988–2014). Hatched areas show that trends are significant with 95% confidence level.
Atmosphere 13 01776 g008
Figure 9. June–November mean SST biases during 1988–2014, between CESM2/MPI-LR and ERA5. Hatched areas show that biases are significant with a 95% confidence level.
Atmosphere 13 01776 g009
Figure 10. June–November CESM2 precipitation (filled contours) and moisture flux (1000 hPa vectors) changes for late 21st century (2095–2100; SSP245 climate change forcing scenarios) minus historical (1988–2014). Lines of maximum meridional low-level moisture flux convergence (black for 1988–2014 and pink for 2073–2100 time slices) highlighting the migration trend of the ITCZ; red labels show the SST mean warming differences for the same period in the region (Figure 5). Contours and bold vectors show biases are significant with a 95% confidence level.
Atmosphere 13 01776 g010
Table 1. CESM2 and MPI-LR simulated frequency (number of months) and intensity anomaly (°C) of El Niño and La Niña 1+2 region based on historical (1988–2014) and late 21st century (2073–2100; SSP245 and SSP585) climate change forcing scenarios.
NiñoNiña
DatasetFrequency (Months)Intensity (°C)Frequency (Months)Intensity (°C)
CESM2 Historical961.49123−1.19
CESM2 SSP245981.33112−1.10
CESM2 SSP5851001.1491−1.300
MPI-LR Historical800.8664−1.05
MPI-LR SSP245810.9385−0.91
MPI-LR SSP585841.0589−1.14
Publisher’s Note: MDPI stays neutral with regard to jurisdictional claims in published maps and institutional affiliations.