Abstract
As one of three major beverages in the world, coffee ranks first in terms of production, consumption, and economic output. However, little is known about the habitat of Arabica coffee and the key environmental factors that influence its ecological distribution. Based on climatic, topographic, and soil data, the Arabica coffee planting regions with different levels of ecological suitability in different periods, and environmental factors that have the largest impact on ecological suitability were simulated using the MaxEnt model. The results showed that the ecologically suitable regions were mainly determined by climatic (max temperature of warmest month and annual precipitation) factors, followed by terrain (slope, altitude, and aspect) and soil (silt) factors. Under the current scenario, the most suitable and suitable regions accounted for 4.68% and 14.29% of the entire area, respectively, mainly in the western, southeastern, southern, and southwestern parts of Yunnan. The highly suitable regions shrank by 0.59 × 10⁴–2.16 × 10⁴ km2 under SSPs245 in 2061–2080 and SSPs585 in 2021–2040 and 2041–2060. By contrast, the highly suitable regions increased by 0.33 × 10⁴–9.65 × 10⁴ km2 under other scenarios. The suitable regions migrated towards higher-altitude and higher-latitude regions. Predicting the potential distribution of Arabica coffee based on a species distribution model (MaxEnt) can inform the implementation of long-term plantation development plans to mitigate the effects of climate change on the distribution of Arabica coffee.
1. Introduction
Originally from the tropical regions of northern and central Africa, coffee is now cultivated worldwide in 76 countries and regions, with Arabica coffee accounting for around 80% of the planting area [1]. Yunnan Province is the largest coffee-growing and export base in China, accounting for more than 98% of the country’s planting area and production [2]. Yunnan Arabica coffee has a unique “mellow, rich, and fruity” flavor and is highly competitive in domestic and international markets [3]. Up to now, the area planted with Arabica coffee in Yunnan Province has reached 1.22 × 10⁵ hectares and the total output has reached 1.44 × 10⁵ tons, ranking twelfth in the world and fourth in Asia [4].
Climate is an important environmental factor that determines crop distribution and quality formation [5]. With the intensification of climate change, the frequency of extreme weather events causing heating and freezing injuries increases, which changes the layout of suitable areas for coffee planting [6]. The results from a recent study showed that the suitable area for coffee cultivation in southeast Brazil may be reduced by 20–60% in the future [7]. Climate change would significantly impact Arabica and Robusta coffee in low-latitude and low-altitude areas. The coffee planting area in Brazil and Vietnam might be significantly reduced [8]. Meanwhile, other studies have pointed out that regions unsuitable for coffee cultivation will become more productive in an ever-changing climate. Some researchers predict that the regions suitable for coffee production in Asia, South America, and East and Central Africa will increase, and the ecologically suitable zones will shift to higher altitudes [9,10]. However, most of the previous studies about future climate change have used the CMIP5 model to analyze their results [11], as, under the latest CMIP6 scenario, changes in the distribution of environmentally suitable areas for the production of Arabica coffee remain unclear [12].
Species distribution models (SDMs) can predict the potential distribution of different species under different scenarios, based on the known distribution record of a species and the relationship between that distribution site and environmental features [13]. The use of species distribution models (SDMs) to estimate the potential distribution of crops is a promising approach [14,15]. Various species distribution models (SDMs), such as maximum entropy (MaxEnt), genetic algorithms for rule set prediction (GARP), ecological niche modelling (ENM), climate change experiment (CLIMEX), ecological niche factor analysis (ENFA), bioclimatic prediction system (BIOCLIM), generalised linear models (GLM), and generalised additive models (GAM), have been used to assess ecological demand, ecological responses, and ecological range [16,17,18]. Among these, the MaxEnt model is highly suitable for studying the species’ geographical range and successfully models the distribution of plants and animals, so it is widely used in ecology [19,20]. MaxEnt is used to model the relationship between crop and climatic factors. It avoids subjective errors in selecting factors and determining weights in the integrated zoning approach. In addition, the model construction describes the interactions between climate factors, which is more scientific than the existing stepwise zoning methods [21]. Wang et al. [22] assessed the potential impacts of climate change on the distribution of P. kansuensis in China and identified the critical environmental factors that affect P. kansuensis. The results showed that the habitat of P. kansuensis generally shifted northwards under four climate scenarios. Elevation, precipitation in the warmest quarter, ultraviolet-B radiation seasonality (UVB-2), annual precipitation, and annual temperature range were the most critical environmental variables that influenced the distribution of P. kansuensis. Komlavi et al. [23] used four types of environmental ecological niche modeling (ENM)-based mapping of rice production suitability in the inland valley landscapes of Benin and Togo. The results showed that Togo needed 53.8% of suitable acreage in rice, while Benin needed 60.1% of suitable areas to be self-sufficient. The enhanced regression tree (BRT) and the maximum entropy model (MaxEnt) have better accuracy and higher objectivity in the prediction results. Hu et al. [24] used maximum entropy (MaxEnt) models and a genetic algorithm for rule-set prediction (GARP) to conduct a mangrove suitability assessment and to map the restoration potential of mangroves in China for the first time. The results showed that the MaxEnt model outperformed GARP in predicting the potential distribution of mangroves. The areas with the most significant restoration potential were located in the Guangdong and Guangxi coastal regions. Li et al. [25] used the MaxEnt model and chemical analyses to predict the current and future distribution of three species of Coptis herbs in China under climate change conditions. MaxEnt has many advantages over other models, including allowing repeated runs to test the robustness of the model, short model run times, simplicity of operation, small sample size requirements, and high simulation accuracy. Shi et al. [26] used MaxEnt to simulate the potential fitness zones of Magnolia wufengensis under current and future climate change scenarios. The results showed that the suitable areas of different classes would be significantly reduced, the suitable regions in southern Europe and western America would vanish, and the center of mass of the suitable regions would tend to move northeast. However, most of the previous studies of the ecological regionalization of Arabica coffee are based on multiple meteorological factors, while few consider the influence of topography, soil, and other factors.
This study takes Arabica coffee as the research object. It uses the available information on the distribution of cultivation, climate, topography, and soil information to screen the key factors and threshold ranges affecting the distribution of Arabica coffee cultivation through the maximum entropy model (MaxEnt) and ArcGIS technology. The ecological suitability of Arabica coffee cultivation is classified, and the potential geographical distribution and spatial changes of Arabica coffee under climate change are predicted. The migration direction and distance of the suitable areas are indicated based on mass transfer, providing a reference basis for local farmers to organize the Arabica coffee-growing areas’ layout and scientific cultivation.
2. Materials and Methods
2.1. Species Distribution Data
Yunnan Province is located at 21°08′32″–29°15′08″ N, 97°31′39″–106°11′47″ E. It is adjacent to the Qinghai Tibet Plateau in the north and the Indian Ocean and the Pacific Ocean in the south. Influenced by the topography of the Yunnan Guizhou Plateau and the southeast and southwest monsoon, the climate resources have the characteristics of a low latitude climate, a plateau climate, and a monsoon climate, and are rich in heat resources. There is no severe cold in winter or heat in summer. Distribution points of Arabica coffee in Yunnan Province were downloaded from the Herbarium of the Institute of Botany, Chinese Academy of Sciences, Beijing (http://pe.ibcas.ac.cn/ accessed on 12 December 2020), the Global Biodiversity Information Network GBIF (https://www.gbif.org/ accessed on 12 December 2020), and the China Digital Herbarium (http://www.cvh.org.cn/ accessed on 12 December 2020). In order to enhance the prediction accuracy, the related distribution datasets were corrected and supplemented by means of a literature review and field survey, and the duplicate, fuzzy, and adjacent records were deleted so as to achieve uniform distribution of the sampling points, and to ensure the independence of species observation and thus avoid over-fitting the model. Next, both the longitude and latitude of the distribution point were corrected using Google Maps to ensure geographical accuracy. Finally, the 44 processed records were saved in the format of .CSV, as shown in Figure 1.
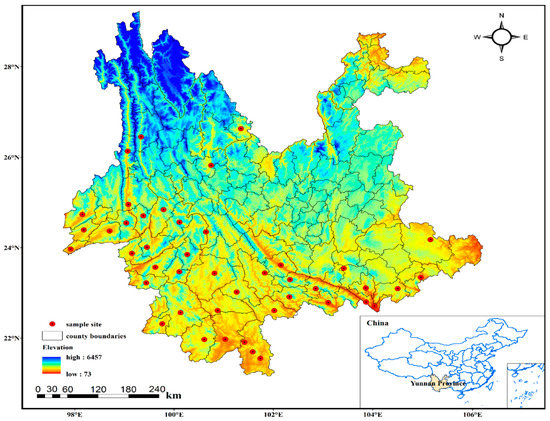
Figure 1.
Geographic locations of Arabica coffee in Yunnan, China.
2.2. Soil, Climate, and Topography Data
After reviewing the literature on coffee growth habits and consulting local experts in coffee cultivation, 31 environmental factors (Table 1) that may affect the distribution of Arabica coffee were initially selected and modeled for the current and future distribution of suitable areas for Arabica coffee. Soil data were selected from the Chinese soil organic matter dataset published by the Space-Time Tri-Polar Environmental Data Platform (http://poles.tpdc.ac.cn accessed on 1 March 2021) in a 30 s arc-second (1 km) grid raster, projected as WGS84. The spatial resolution for the current climate and terrain factors is 30″ (1 km2). The scenario data for future climate change were selected from the BCC-CSM2-MR model for four CO2 concentration emissions: SSPs126, SSPs245, SSPs370, and SSPs585, with a future climate. The spatial resolution of the data is 2.5′ (4.5 km2). This includes 19 climate data with topographic factors (altitude, slope, and aspect) for current, 2030 (2021–2040), 2050 (2041–2060), 2070 (2061–2080) and 2090 (2081–2100), downloaded from the global climate database WorldClim (http://www.worldclim.org/ accessed on 1 March 2021). All environmental factor data were resampled using ArcGIS 10.6 to a uniform 30″ (approximately 1 km2) spatial resolution and converted to ASCII format for use. The geographical data were downloaded from the China National Basic Geographic Information System (http://nfgis.nsdi.gov.cn/ accessed on 1 March 2021) as a 1:250,000 vector map of China’s administrative divisions; this was used as the base map for the analysis.

Table 1.
Environmental indicators used in this paper to model the potential distribution of Arabica coffee.
2.3. Initial Screening of Key Factors
Many environmental factors are spatially correlated. To avoid over-fitting the model due to the multicollinearity of variables, Pearson correlation coefficient analysis was used to determine the correlation between the primary environmental factors. If the coefficient was <0.8, the ecological factors were retained; when the Pearson coefficient of two variables was >0.8, the environmental factors with lower ecological significance for Arabica coffee were excluded (Figure 2). Finally, 20 ecological factors were selected as the critical factors for predicting the distribution of Arabica coffee [27,28].
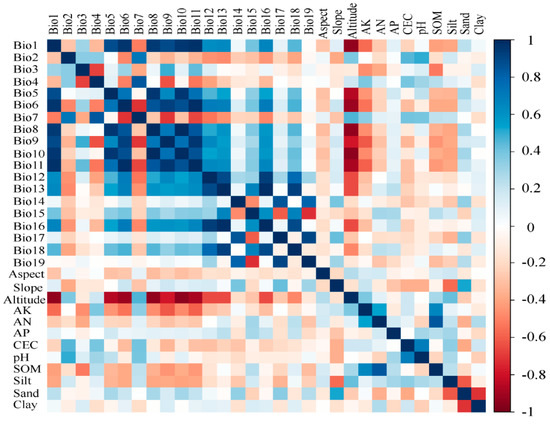
Figure 2.
Pearson correlation analysis.
2.4. Prediction of Current and Future Potential Suitability
The maximum entropy model (MaxEnt version 3.4.1 Columbia University, USA, Steven J. Phillips; http://biodiversityinformatics.amnh.org/open_source/maxent/ accessed on 1 June 2021) was used to predict the geographical distribution of Arabica coffee in Yunnan Province [29]. In total, 75% percent of the distribution points were randomly selected for the training model, and the remaining 25% were used to validate the MaxEnt model (Figure 3). When establishing the model, the evaluation index of the area under curve (AUC) in the Jackknife method was selected to evaluate the model performance and acquire the contribution and importance of various environmental characteristic variables, so as to further evaluate the model’s accuracy. The AUC (area under curve) is the area under the model’s receiver operator curve (ROC). The theoretical value of the AUC is 0.5–1. The closer the AUC value is to 1, the higher the model’s prediction accuracy. The specific evaluation criteria are: 0.5 ≤ AUC < 0.6, the simulation effect fails; 0.6 ≤ AUC < 0.7, there is a poor simulation effect; 0.7 ≤ AUC < 0.8, the simulation effect is average; 0.8 ≤ AUC < 0.9 there is a good simulation effect; 0.9 ≤ AUC < 1, the model has an excellent simulation effect [30]. The run was repeated ten times, and the model with the highest AUC value was selected as the best model. The output file was converted to the raster format using ArcGIS 10.6 for further analysis. The final potential species distribution map takes values ranging from 0 to 1. The regions with different degrees of ecological suitability can be readjusted based on the natural discontinuous point method. The regions with a value of <0.1, 0.1–0.3, 0.3–0.5, and >0.5 can be defined as unsuitable, sub-suitable, suitable, and most-suitable areas, respectively [31].
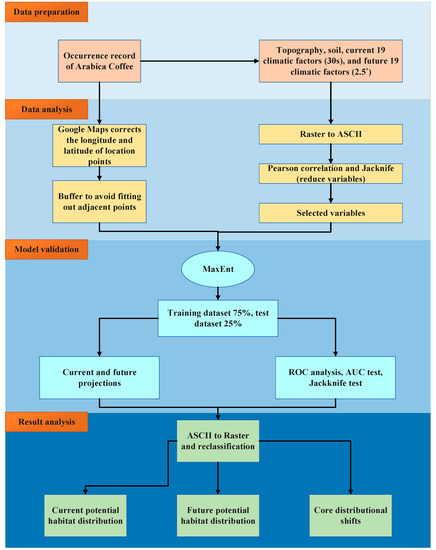
Figure 3.
Processing methodology inflow diagram (AUC (area under the curve) and ROC (receiver operator curve)).
2.5. Prediction of Future Potential Highly Suitable Range
The environmental factors after screening were used for simulating the spatial distribution range of Yunnan Arabica Coffee. On this basis, future climate scenarios (SSPs126_2021–2100, SSPs245_2021–2100, SSPs370_2021–2100, SSPs585_2021–2100) were modelled to predict the range of future high-fitness zone changes for Arabica coffee. Future high-fitness zone changes were classified as: (1) no occupancy, (2) no change, (3) range contraction, and (4) range expansion. The area of distribution of these zones was calculated and illustrated [32,33].
2.6. Shifting the Center of Gravity
The trends of the current suitable zone and the future suitable zone were calculated using the SDM toolbox, a Python-based GIS software (Columbia University, New York, NY, USA, Steven J. Phillips), and the high-fitness zone mass centers of the current suitable zone and the future suitable zone were compared. Additionally, the coordinate changes and migration distances of the mass centers were described using ArcGIS [34].
3. Results
3.1. MaxEnt Model Precision and the Current Distribution
The current prediction model had an AUC value of 0.911 for the training data and a test AUC value of 0.943 (Figure 4). This shows that the maximum entropy model had high accuracy and excellent performance in simulating the geographical distribution of Arabica coffee. Figure 5 shows the prediction results, from which we can observe that the areas of most suitable regions and suitable regions for the plantation of Arabica coffee occupied 4.68% and 14.29% of total areas, respectively. The most suitable and suitable regions were mainly distributed in the western, southeastern, southern, and southwestern parts of Yunnan, China. Meanwhile, the sub-suitable and unsuitable regions occupied 24.82% and 56.21% of the total plantation area, respectively, and were mainly distributed in the middle, northeastern, eastern, and northwestern parts of Yunnan.
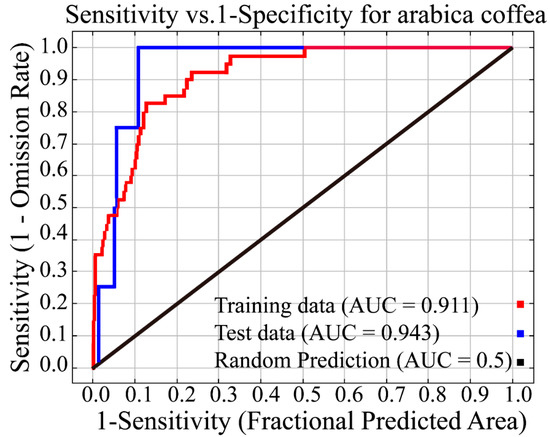
Figure 4.
AUC accuracy model.
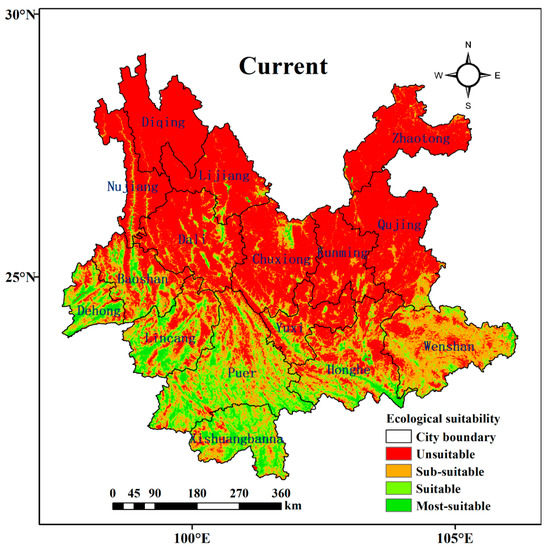
Figure 5.
Map of ecologically suitable areas for Arabica coffee at present.
3.2. Effects of Key Environmental Factors on Geographical Distribution
Using the MaxEnt model, it was found that the contribution rates of the maximum temperature in the warmest month (Bio5), annual precipitation (Bio12), altitude, slope, aspect, and the content of silt were 35.6%, 21.6%, 11.1%, 8.6%, 5.8%, and 5.2%, respectively, and the substitution importance degrees of these factors were 0%, 0.4%, 59%, 0.6%, 5.6%, and 8.6%, respectively (Table 2 and Figure 6). The cumulative contribution rate of these factors reached up to 87.9%. The correlation coefficients between any two factors were all below 0.8. Therefore, these six environmental factors could be regarded as the critical factors for predicting the geographical distribution of Arabica coffee. It should be noted that the calculation of the contribution rate considered the mutual effects between two environmental variables, while the calculation of importance neglected the mutual effects. According to the calculation results, the climatic factors most significantly affected the geographical distribution of Arabica coffee, followed by terrain and soil factors.

Table 2.
Percentage contribution and ranked importance of environmental variables in the Maxent model.
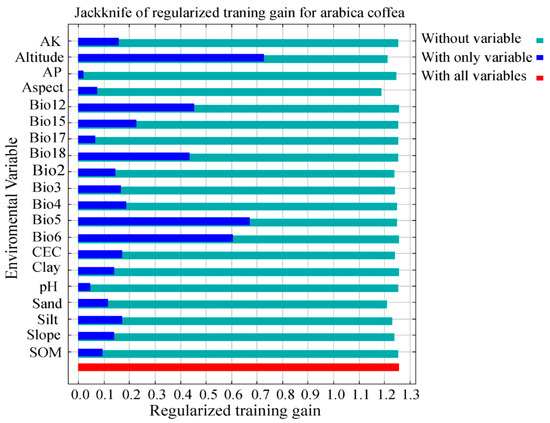
Figure 6.
Jackknife results of habitat distribution predictions under current conditions.
The suitable ranges of these six environmental variables that influence the distribution of areas that are ecologically suitable for Arabica coffee were analyzed by the response curves, and the relation curves between the key factors and the species existence probability were plotted, as shown in Figure 7. The suitable ranges of Bio5, Bio12, altitude, aspect, slope, and silt are 27–33 °C, 1100–1900 mm, 750–1550 m, 175°–325°, <14°, and 24–43%, respectively.
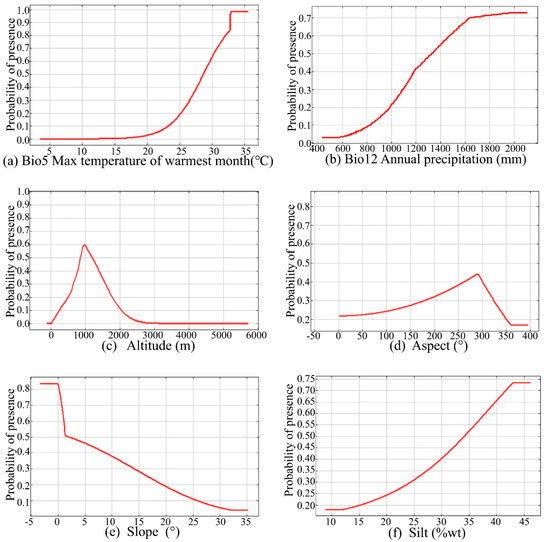
Figure 7.
Response curves of six important factors that influence Arabica Coffee distribution. (Bio5-max temperature of warmest month, Bio12-annual precipitation, altitude, aspect, slope and silt).
3.3. Potential Distribution of Arabica coffee in Future Scenarios
To explore the impact of climate change on the potential distribution of Arabica coffee under a global warming scenario, this study performed a simulation on the suitability of the planting areas under 16 scenarios, as shown in Figure 8 and Table 3. The results showed that the suitable and most suitable regions for Arabica coffee occupied 16.73% and 8.58% of the total area, respectively, in 2041–2060 under SSPs126 with the lowest greenhouse gas emissions; these areas were mainly distributed in the middle of Pu’er, the northern part of Lincang, and the southwestern part of Xishuangbanna. The suitable and most suitable regions in other periods showed slight changes. The SSPs245 and SSPs370 scenarios had moderate greenhouse gas emissions. Under SSPs245, the areas of suitable and most suitable regions of Arabica coffee in 2061–2080 decreased by 4.62% and 1.53%, respectively, with a concentrated distribution in the southern part of Baoshan, the northern parts of Pu’er and Lincang, the middle of Honghe, and the eastern part of Wenshan. The distribution of suitable and most suitable regions in other future periods differed slightly with the current condition. Under SSPs370, the suitable and most suitable regions of Arabica coffee in four different time periods expanded to certain degrees; in particular, the areas of suitable and most suitable regions in 2041–2060 increased by 5.8% and 9.33%, respectively, with a concentrated distribution in the southern parts of Dehong, Lincang, and Honghe, the eastern part of Dali, the southern part of Chuxiong, and most of Pu’er, Xishuangbanna, and Wenshan. Under the SSPs585 scenario with the highest greenhouse gas emissions, the area of regions suitable for the plantation of Arabica coffee dropped by 3.03% in 2041–2060 and the area of most suitable regions increased by 2.01% in 2081–2100, with concentrated distributions in the northern parts of Pu’er and Xishuangbanna. Except for a slight decrease in 2041–2060 under SSPs126 and SSPs370 and a slight increase under SSPs245, the distributions of sub- and un-suitable regions showed little change under other scenarios.
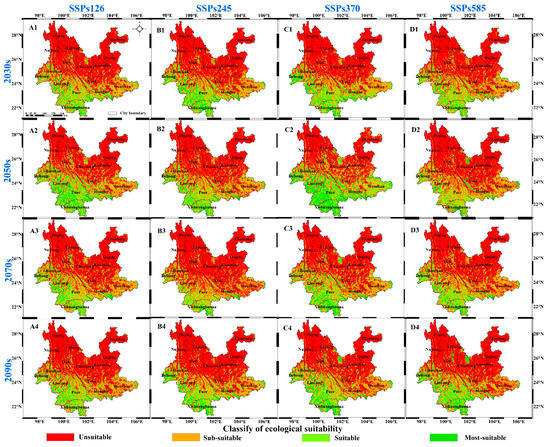
Figure 8.
Map of the distribution of potentially ecologically suitable areas for Arabica coffee in Yunnan under future scenarios. ((A1–A4) stands for SSPs126, (B1–B4) for SSPs245, (C1–C4) for SSPs370, and (D1–D4) for SSPs585.).

Table 3.
Potentially suitable areas for Arabica Coffea under the current and future scenarios (%).
Figure 9 and Table 4 show the current and future distributions of Arabica coffee, determined using the SDM tool. Under the SSPs126 scenario, the suitable region expanded significantly, by 4.10 × 10⁴ km2 in 2041–2060 over four periods, with concentrated distribution in the middle of Baoshan, the northern parts of Lincang, Pu’er, and Honghe, and the southwestern part of Xishuangbanna. Meanwhile, the suitable region shrank significantly by 0.86 × 10⁴ km2 in 2081–2100, with concentrated distribution in the Yuanmou region of Chuxiong and the southern region of Honghe and Wenshan. Under the SSPs245 scenario, the area of the suitable region increased most significantly by 2.01 × 10⁴ km2 in 2021–2040 among four periods, mainly with concentration in the southwestern part of Xishuangbanna, the middle of Pu’er and the eastern part of Wenshan. Meanwhile, it dropped most significantly, by 2.5 × 10⁴ km2, in 2061–2080, with concentration mainly in the middle of Dehong, Lincang, and Pu’er, and the southern parts of Honghe and Wenshan. Under the SSPs370 scenario, the suitable region expanded most significantly in 2041–2060, by 9.72 × 10⁴ km2, with concentrated distribution in the southwestern part in Xishuangbanna, the northern parts of Lincang, Pu’er and Honghe, the eastern parts of Baoshan, Dali, and Lijiang, the southern and the northern parts of Chuxiong, and most of Wenshan. Meanwhile, the most significant shrinkage, of 0.55 × 10⁴ km2, occurred in 2081–2100, with distribution mainly in the southern parts of Honghe and Wenshan. Under the SSPs585 scenario, the area of the suitable region increased most significantly, by 2.56 × 10⁴ km2, in 2081–2100, with concentration mainly in the northern parts of Honghe, Pu’er, and Chuxiong. The most significant drop, of 1.17 × 10⁴ km2, was seen in 2021–2040, mainly concentrated in the southern parts of Honghe and Wenshan, and in Yuanmou county (in the southern part of Chuxiong).
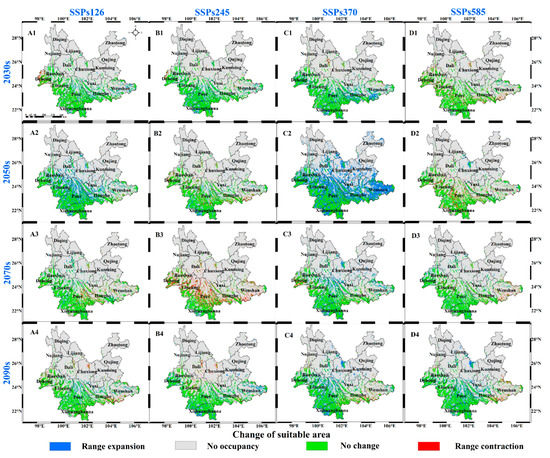
Figure 9.
Changes in the area suitable for Arabica Coffee in future scenarios. ((A1–A4) stands for SSPs126, (B1–B4) for SSPs245, (C1–C4) for SSPs370, and (D1–D4) for SSPs585.)

Table 4.
Dynamics of changes in distribution area for Arabica Coffee under four future climate scenarios/years (×104 km2).
3.4. Future Trajectory of the Center of Mass of the Distribution of Arabica coffee
In order to analyze the effect of climate change on the geographical distribution of Arabica coffee, the migration distances and directions of the mass center of the future suitable regions were calculated using ArcGIS and SDM, as shown in Figure 10 and Table 5. Under the current scenario, the mass center of the suitable region is located in Jinggu (100°52′10″,23°24′29″). Under the SSPs126 scenario, the mass center moves towards the southeast by 18.58 km, and will further move by 22.70 km, 14.69 km, and 15.53 km towards the northwest, the southwest, and the southeast in the 2050s, the 2070s, and the 2090s, respectively, finally arriving at Jinggu (100°52′22″, 23°22′42″). Under the SSPs245 scenario, the mass center moves towards the southeast by 4.73 km, and moves by 4.61 km and 17.94 km towards the southwest in the 2050s and the 2070s, respectively, and finally moved by 21.33 km towards the northeast to Jinggu (100°59′38″, 23°18′57″) in the 2090s. Under the SSPs370 scenario, the mass center moves towards the southeast by 18.98 km, and moves by 59.96 km and 49.14 km towards the northeast and the southwest in the 2050s and the 2070s, respectively; it finally moves by 27.18 km towards the northwest to Jinggu (100°43′29″, 23°31′31″) in the 2090s. Under the SSPs585 scenario, the mass center moves towards the southeast by 4.86 km, which moved by 10.79 km and 20.38 km towards the northeast and the west in the 2050s and the 2070s, respectively, and finally moves by 6.17 km southeast towards Jinggu (100°47′5″, 23°27′42″) in the 2090s.
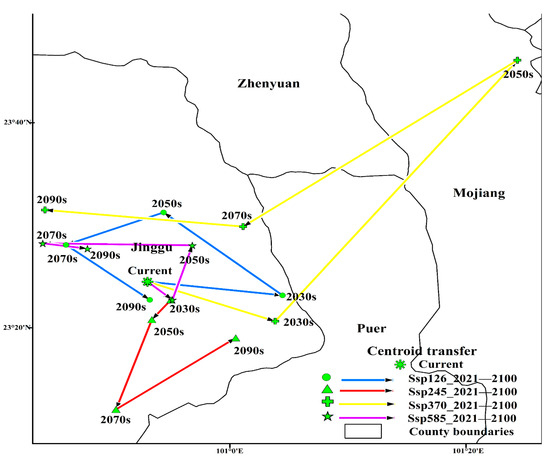
Figure 10.
The centroid migration of different periods and different carbon emissions in the present and in the future.

Table 5.
Predicted current distribution of the core distributional shifts under different climate scenarios/years for Arabica coffee.
4. Discussion
4.1. Changes in the Distribution of Suitable Areas under Future Climate Change
Using the MaxEnt model, the prediction of suitable planting regions of Arabica coffee in Yunnan were repeated ten times under the current scenario and four future climate change scenarios (SSPs126, SSPs245, SSPs370, and SSPs585). The values of AUC all exceeded 0.9, indicating the high reliability of the model prediction [35,36]. By taking into account climatic, terrain, and soil factors, the current regions suitable for planting coffee in Yunnan showed a concentrated distribution in Nujiang, Lancangjiang, Honghe, and Jinshajiang, with altitude of 500–1800 m. In terms of administrative divisions, Yunnan’s coffee plantation was mainly concentrated in Pu’er, Lincang, Baoshan, Dehong, and Xishuangbanna. By taking each 20 years as an interval (i.e., the period from 2021~2100 can be divided into four generations), the highly suitable planting area of Arabica coffee in Yunnan increased by 1.22 × 10⁴ km2, 3.9 × 10⁴ km2, 0.33 × 10⁴ km2, and 0.41 × 10⁴ km2 in 2021–2100 under the SSPs126 scenario; the highly suitable planting area increased by 1.8 × 10⁴ km2, 0.34 × 10⁴ km2, −2.16×10⁴ km2, and 1.26 × 10⁴ km2 in 2021–2100 under the SSPs245 scenario; the highly suitable planting area increased by 2.57 × 10⁴ km2, 9.65 × 10⁴ km2, 2.22 × 10⁴ km2, and 2.21 × 10⁴ km2 in 2021–2100 under the SSPs370 scenario; and the highly suitable planting area increased by −0.59 × 10⁴ km2, −0.55 × 10⁴ km2, 0.66 × 10⁴ km2, and 2.06 × 10⁴ km2 in 2021–2100 under the SSPs585 scenario. Overall, the highly suitable area of Arabica coffee showed a positive growth trend with the increase in temperature. In particular, the highly suitable regions expanded significantly under the SSPs370 scenario and were mainly distributed in the southwestern part of Xishuangbanna, the northern parts of Honghe, Lincang, and Pu’er, the eastern parts of Baoshan, Dali, and Lijiang, the southern and northern parts of Chuxiong, and most of Wenshan, which could contribute significantly to local farmers’ production and income growth. However, under the SSPs245 scenario, the highly suitable area in 2061–2080 was reduced by 2.5 × 10⁴ km2, and was concentrated in the middle of Dehong, Lincang, and Pu’er and the southern parts of Honghe and Wenshan. The farmers in these regions could appropriately reduce the planting area and minimize reliance on Arabica coffee. In addition, farmers should strengthen diversion for irrigation so as to avoid the adverse effects induced by drought, since Yunnan generally does not enter into a rainy season in February and March. According to the prediction results of the MaxEnt model, a large number of suitable lands for coffee planting could be developed and utilized in Yunnan Province. Yunnan Province could consolidate the most suitable areas, develop suitable areas and sub-suitable areas, phase out unsuitable areas, transfer from dispersion to large-scale production and regionalization, change the traditional planting methods of small farmers and establish planting bases, and finally develop large-scale planting and achieve modern agricultural standards. Despite the high accuracy and objectivity of MaxEnt model, there still exist a number of factors that affect the potential distribution of plants. For example, Arabica coffee, as a type of perennial crop, has a growth cycle of 2–3 years. Extreme climate conditions, such as drought and frost, pose a potential threat to both the growth and the development of Arabica coffee [37]. Additionally, plant diseases and insect pests also threaten the growth of Arabica coffee. Dihammus Cervinus is one of the most significant pests for the coffee trees in Yunnan, and is mainly hazardous to young coffee tree trunks, with a hazard ratio of 10–15% [38]. Although there exist a number of uncertainties under these scenarios, the key factors that affect the distribution of Arabica coffee should be analyzed in depth so as to gain a clearer understanding of the reasonable distribution of Arabica coffee plantation.
4.2. Main Environmental Variables Affecting Ecological Suitability
The study analyzed the contribution rate and importance of 31 environmental factors to establish the distribution prediction model of Arabica coffee using the Jackknife knife cutting method. Pearson correlation coefficient analysis was used to remove environmental factors with high correlation [39]. Finally, six critical environmental factors, including the maximum temperature of the warmest month (Bio5), annual precipitation (Bio12), altitude, slope, aspect, and silt, were selected as the independent variables of the prediction model. Because the flowering period from February to July is the most critical stage for the growth of Arabica coffee, the temperature during the whole period is a key factor that limits growth and distribution. The warmest month, from May to June, is when Arabica coffee flowers; when the maximum temperature reaches 25 °C, it promotes plant growth, but too high a temperature limits the net photosynthesis. Leaves are burned when the temperature exceeds 40 °C. In addition, the temperature also affects the quality formation of Arabica coffee. The contents of trigonelline, caffeine, and fat increase with the increase in temperature. Low temperatures can stimulate the activity of sucrose metabolic enzymes and increase the accumulation of sucrose and protein in cells [40]. Too much precipitation during the flowering period can lead to flower drop, which is detrimental to fruiting. At the same time, the content of fenugreek and fat decreases with increasing rainfall, and the sucrose content increases with rainfall; too little precipitation leads to drought, which reduces the quality of the coffee beans and makes them less fruitful [7,41]. Gomes et al. [42] used MaxEnt to predict the coffee-growing areas in Brazil in 2050 using 19 climate factors, which indicated that coffee was susceptible to climate change and that the area suitable for coffee production would be reduced. Meanwhile, terrain, landforms, and the soil’s physicochemical properties are of great significance to the planting, growth, and scientific site-selection of Arabica coffee. Altitude is an essential factor in the quality of Arabica coffee. The long flowering period and the late ripening of the fruit at higher altitudes are conducive to the accumulation of organic matter. At the same time, the increase in acidity and sucrose can enhance the taste of coffee beans [43]. However, high altitudes cause a decrease in temperature and precipitation, which is detrimental to the growth of Arabica coffee. Therefore, the optimum altitude range for Arabica coffee is 800–1500 m [44]. Slope affects soil depth, respiration, texture, and nutrient utilization, meaning that Arabica coffee is more suitable for cultivation on gentle slopes [45]. Aspect mainly affects the illumination time. Since sunshine can promote the metabolic activities and contribute to the growth and development of plants, Arabica coffee is more suitable for plantation in sunny, sub-sunny, and sub-shady slopes [46,47]. When the silt content is between 24% and 43%, the soil type is sandy loam, in which the nutrient content is high, and the soil is loose, aerated, permeable, and easy to cultivate. By combining the literature review and the field survey, these six key factors were found to be significant factors that affect the ecological suitability area distribution of Arabica coffee. Meanwhile, the suitable ranges of these six key factors were consistent with the actual growth requirements of Arabica coffee [48,49].
4.3. Spatial Pattern Migration under Future Climate Change
Under four climate change scenarios, the mass centers of highly suitable regions moved towards the southeast. Ultimately, the mass center of the highly suitable region was located in the southeast of Jinggu under the SSPs126 and SSPs245 scenarios, and in the northwest of Jinggu under the SSPs370 and SSPs585 scenarios. Under the SSPs126 scenario for greenhouse gas emissions, the mass center changed in the southeast of the current mass center; under the other scenarios, the mass center first moved towards the southeast and then in a northern direction, suggesting that the distribution of the highly suitable area was likely to move towards higher-altitude and higher-latitude regions [50]. Laderach et al. [51] combined MaxEnt and CaNaSTA crop suitability models to predict the possible effects of climate change on coffee suitability and quality. The results suggested that suitable areas for coffee cultivation would migrate to higher altitudes by approximately 300 m. Meanwhile, based on the prediction results, it can be concluded that the areas highly suitable for Arabica coffee would expand in limited ranges with time under the four different scenarios [52]. Therefore, we can reasonably plan the planting area of Arabica coffee according to the migration and change of the most suitable area of Arabica coffee, optimize the production layout of Arabica coffee in Yunnan, promote the effective utilization rate of land and climate resources, and further increase the income of farmers.
5. Conclusions
This study considered the impact of future climate change on areas that are ecologically suitable for coffee in Yunnan Province, China, and provides a scientific reference for the coffee-growing industry’s planning layout and risk management. This study modeled the current geographical distribution of Arabica coffee and assessed the key environmental factors that influence the distribution of Arabica coffee, predicting the potential distribution and mass center migration in Arabica-coffee-suitable zones from 2021–2100 under four greenhouse gas emission concentrations (SSPs126, SSPs245, SSPs370 and SSPs585). The main conclusions are given below:
- (1)
- The most suitable and suitable planting regions for Arabica coffee occupied 4.68% and 14.29% of the total area, and were mainly distributed in the western, southeastern, southern, and southwestern parts of Yunnan. The sub-suitable and unsuitable planting regions occupied 24.82% and 56.21% of the total area, and were mainly distributed in the middle, northeastern, eastern, and northwestern parts of Yunnan.
- (2)
- Bio5, Bio12, slope, altitude, aspect, and topsoil silt fraction were critical factors that influenced the distribution of ecologically suitable areas for Arabica coffee.
- (3)
- The regions that are highly suitable for Arabica coffee declined in the period from 2061 to 2080 under the SSPs245 scenario, and were mainly concentrated in the middle parts of Dehong, Lincang, and Pu’er and the southern parts of Honghe and Wenshan. Meanwhile, the highly suitable regions expanded in other periods under the other scenarios, mainly with concentrations in the southwestern part of Xishuangbanna, the northern parts of Lincang, Pu’er, and Honghe, the eastern parts of Baoshan, Dali, and Lijiang, the northern part of Chuxiong, and most of Wenshan.
- (4)
- Arabica coffee was inclined to move towards higher-altitude and higher-latitude regions under global warming scenarios.
Author Contributions
S.Z. and B.L. designed the study and wrote the paper. X.L. and T.Z. participated in the discussion process, editing, and revision. Q.Y. and X.X. investigated the data. All authors have read and agreed to the published version of the manuscript.
Funding
This research was funded by the Guangdong Basic and Applied Basic Research Foundation (2022A1515010931), the Hongda Zhang Scientific Research Fund, Sun Yat-Sen University, the National Natural Science Foundation of China (51979133 and 51769010), scientific research fund project of Yunnan Education Department (2021Y116) and Key Laboratories of University in Yunnan Province.
Data Availability Statement
Not applicable.
Acknowledgments
The authors would like to thank the anonymous reviewers for providing invaluable comments on the original manuscript.
Conflicts of Interest
The authors declare no conflict of interest.
References
- Sun, C.M.; Luo, J.; Wang, K.; Gao, J.Q.; Hao, S.M.; Tan, J. Comparison of chemical and health indexes of coffea arabica bean from different producing areas and varieties in Yunnan. Southwest China J. Agric. Sci. 2019, 32, 2550–2556. [Google Scholar] [CrossRef]
- Liu, Y.Z.; Jiao, D. Influence of free trade zone construction on coffee industry in Yunnan, China. World Agric. 2017, 3, 181–184. [Google Scholar] [CrossRef]
- Dai, Z.M.; Du, G.; Mao, S.Q.; Luo, Y.; Li, X.L.; Yang, Y.; Li, D.T. Present situation and development countermeasures of Yunnan Arabica coffee brand construction. Trop. Agric. China 2018, 11, 13–18. [Google Scholar]
- Huang, J.; Huang, L.; Lv, Y.; Li, Y.; Zhang, X.; Wu, R.; Li, G. Analysis on the development prospect of Chinese coffee industry. Yunnan Nongye Keji 2018, 6, 4–7. [Google Scholar]
- Yue, Y.; Zhang, P.; Shang, Y. The potential global distribution and dynamics of wheat under multiple climate change scenarios. Sci. Total Environ. 2019, 688, 1308–1318. [Google Scholar] [CrossRef]
- Bo, C.; Cheng, K.B.; Ying, X.; Jing, J.Y.; Pu, F.G.; Hui, L.; Lin, Z.; Le, C.; Juan, W.; Jun, X.; et al. Wetlands rise and fall: Six endangered wetland species showed different patterns of habitat shift under future climate change. Sci. Total Environ. 2020, 731, 138518. [Google Scholar] [CrossRef]
- Priscila, S.T.; Angelica, G.; Sin, C.C.; Adan, P.S.; Andre, A.L. Climate change impact on the potential yield of Arabica coffee in southeast Brazil. Reg. Environ. Chang. 2018, 18, 873–883. [Google Scholar] [CrossRef]
- Bunn, C.; Läderach, P.; Rivera, O.O.; Kirschke, D. A bitter cup: Climate change profile of global production of Arabica and Robusta coffee. Clim. Chang. 2015, 129, 89–101. [Google Scholar] [CrossRef]
- Davis, A.P.; Gole, T.W.; Baena, S.; Moat, J. The impact of climate change on indigenous Arabica coffee (Coffea arabica): Predicting future trends and identifying priorities. PLoS ONE 2012, 7, e47981. [Google Scholar] [CrossRef]
- Mighty, M.A. Site suitability and the analytic hierarchy process: How GIS analysis can improve the competitive advantage of the Jamaican coffee industry. Appl. Geogr. 2015, 58, 84–93. [Google Scholar] [CrossRef]
- Zhu, Y.M.; Dou, X.D.; Wang, R.F.; Xie, M.E.; Huang, W.; Li, M. Climate change impact on the region suitable for Coffea arabica growth in Yunnan province. Acta Meteorol. Sin. 2021, 79, 878–887. [Google Scholar] [CrossRef]
- Dakhil, M.A.; Xiong, Q.L.; Farahat, E.A.; Zhang, L.; Pan, K.W.; Pandey, B.; Olatunji, O.A.; Tariq, A.; Wu, X.G.; Zhang, A.P.; et al. Past and future climatic indicators for distribution patterns and conservation planning of temperate coniferous forests in southwestern China. Ecol. Indic. 2018, 107, 105559. [Google Scholar] [CrossRef]
- Jin, K.; Wu, T.J.; Yang, F.; Yi, W.S.; Chao, F.; Xiao, M.S. The moss genus Didymodon as an indicator of climate change on the Tibetan Plateau. Ecol. Indic. 2020, 113, 106204. [Google Scholar] [CrossRef]
- Dimobe, K.; Ouédraogo, A.; Ouédraogo, K.; Goetze, D.; Stein, K.; Schmidt, M.; Nacoulma, B.I.; Gnoumou, A.; Traoré, L.; Porembski, S.; et al. Climate change reduces the distribution area of the shea tree (Vitellaria paradoxa C.F. Gaertn.) in Burkina Faso. J. Arid. Environ. 2020, 181, 104237. [Google Scholar] [CrossRef]
- Guo, Y.; Li, X.; Zhao, Z.; Nawaz, Z. Predicting the impacts of climate change, soils and vegetation types on the geographic distribution of Polyporus umbellatus in China. Sci. Total Environ. 2019, 648, 1–11. [Google Scholar] [CrossRef] [PubMed]
- Abdelaal, M.; Fois, M.; Dakhil, M.A.; Bacchetta, G.; Sherbeny, G.A. Predicting the potential current and future distribution of the endangered endemic vascular plant primula boveana decne. ex duby in Egypt. Plants 2020, 9, 957. [Google Scholar] [CrossRef]
- Rong, Z.; Zhao, C.; Liu, J.; Gao, Y.; Zang, F.; Guo, Z.; Mao, Y.; Wang, L. Modeling the effect of climate change on the potential distribution of Qinghai spruce (Picea crassifolia Kom.) in Qilian Mountains. Forests 2019, 10, 62. [Google Scholar] [CrossRef]
- Zhang, K.; Zhang, Y.; Tao, J. Predicting the potential distribution of Paeonia veitchii (Paeoniaceae) in China by incorporating climate change into a Maxent model. Forests 2019, 10, 190. [Google Scholar] [CrossRef]
- Xu, N.; Meng, F.; Zhou, G.; Li, Y.; Wang, B.; Lu, H. Assessing the suitable cultivation areas for Scutellaria baicalensis in China using the Maxent model and multiple linear regression. Biochem. Syst. Ecol. 2020, 90, 104052. [Google Scholar] [CrossRef]
- Yan, Q.W.; Liang, Z.; Jin, N.W.; Wen, W.; Naudiyal, N.; Yan, L.G.; Xu, F.W. Chinese caterpillar fungus (Ophiocordyceps sinensis) in China: Current distribution, trading, and futures under climate change and overexploitation. Sci. Total Environ. 2021, 755, 142548. [Google Scholar] [CrossRef]
- Qu, Z.J.; Zhou, G.S. Regionalization of climatic suitability for major kiwifruit cultivars in China. Chin. J. Agrometeorol. 2017, 38, 257–266. [Google Scholar] [CrossRef]
- Wang, D.; Cui, B.C.; Duan, S.S.; Chen, J.J.; Fan, H.; Lu, B.B.; Zheng, J.H. Moving north in China: The habitat of Pedicularis kansuensis in the context of climate change. Sci. Total Environ. 2019, 697, 133979. [Google Scholar] [CrossRef] [PubMed]
- Komlavi, A.; Amos, T.K.; Elliott, R.D.; Thomas, A.G.; Sander, J.Z. Mapping suitability for rice production in inland valley landscapes in Benin and Togo using environmental niche modeling. Sci. Total Environ. 2020, 709, 136165. [Google Scholar] [CrossRef]
- Hu, W.J.; Wang, Y.Y.; Zhang, D.; Yu, W.W.; Chen, G.C.; Xie, T.; Liu, Z.H.; Ma, Z.Y.; Du, J.G.; Chao, B.X.; et al. Mapping the potential of mangrove forest restoration based on species distribution models: A case study in China. Sci. Total Environ. 2020, 748, 142321. [Google Scholar] [CrossRef]
- Li, J.J.; Fan, G.; He, Y. Predicting the current and future distribution of three Coptis herbs in China under climate change conditions, using the MaxEnt model and chemical analysis. Sci. Total Environ. 2020, 698, 134141. [Google Scholar] [CrossRef] [PubMed]
- Shi, X.D.; Yin, Q.; Sang, Z.Y.; Zhu, Z.L.; Jia, Z.K.; Ma, L.Y. Prediction of potentially suitable areas for the introduction of Magnolia wufengensis under climate change. Ecol. Indic. 2021, 127, 107762. [Google Scholar] [CrossRef]
- Marlon, E.; Townsend, P.A.; Narayani, B.; Luis, O.O. kuenm: An R package for detailed development of ecological niche models using Maxent. PeerJ 2019, 7, e6281. [Google Scholar] [CrossRef]
- Tang, X.G.; Ying, D.Y.; Jin, C.Z. How climate change will alter the distribution of suitable Dendrobium habitats. Front. Ecol. Evol. 2020, 8, 536339. [Google Scholar] [CrossRef]
- Phillips, S.J.; Anderson, R.P.; Dudík, M.; Schapire, R.E.; Blair, M.E. Opening the black box: An open-source release of Maxent. Ecography 2017, 40, 887–893. [Google Scholar] [CrossRef]
- Sun, S.; Yang, Z.; Di, Z.H.; Hui, W.; Qian, C.; Pei, X.F.; Ning, Y.; Pei, M.Z.; Ren, Q.W. The effect of climate change on the richness distribution pattern of oaks (Quercus L.) in China. Sci. Total Environ. 2020, 744, 140786. [Google Scholar] [CrossRef]
- Qin, A.; Liu, B.; Guo, Q.; Bussmann, R.; Ma, F.; Jian, Z.; Xu, G.; Pei, S. Maxent modeling for predicting impacts of climate change on the potential distribution of Thuja sutchuenensis Franch., an extremely endangered conifer from southwestern China. Glob. Ecol. Conserv. 2017, 10, 139–146. [Google Scholar] [CrossRef]
- Huang, J.; Li, G.; Li, J.; Zhang, X.; Yan, M.; Du, S. Projecting the range shifts in climatically suitable habitat for Chinese sea buckthorn under climate change scenarios. Forests 2017, 9, 9. [Google Scholar] [CrossRef]
- Xu, X.; Zhang, H.; Yue, J.; Xie, T.; Xu, Y.; Tian, Y. Predicting shifts in the suitable climatic distribution of walnut (Juglans regia L.) in China: Maximum entropy model paves the way to forest management. Forests 2018, 9, 103. [Google Scholar] [CrossRef]
- Zhang, K.; Yao, L.; Meng, J.; Tao, J. Maxent modeling for predicting the potential geographical distribution of two peony species under climate change. Sci. Total Environ. 2018, 634, 1326–1334. [Google Scholar] [CrossRef] [PubMed]
- Arslan, E.S.; Akyol, A.; Örücü, Ö.K.; Sarıkaya, A.G. Distribution of rose hip (Rosa canina L.) under current and future climate conditions. Reg. Environ. Change 2020, 20, 37–43. [Google Scholar] [CrossRef]
- Vargas, P.G.; Valdez, R.D.; López, A.; Flores, A.; Hernández, N.S.; Martínez, M. Current and future potential distribution of the Xerophytic Shrub Candelilla (Euphorbia antisyphilitica) under two climate change scenarios. Forests 2020, 11, 530. [Google Scholar] [CrossRef]
- Moat, J.; Gole, T.W.; Davis, A.P. Least concern to endangered: Applying climate change projections profoundly influences the extinction risk assessment for wild Arabica coffee. Glob. Chang. Biol. 2019, 25, 390–403. [Google Scholar] [CrossRef] [PubMed]
- Hailu, B.T.; Siljander, M.; Maeda, E.E.; Pellikka, P. Assessing spatial distribution of Coffea arabica L. in Ethiopia’s highlands using species distribution models and geospatial analysis methods. Ecol. Inform. 2017, 42, 79–89. [Google Scholar] [CrossRef]
- Elith, J.; Phillips, S.J.; Hastie, T.; Dudík, M.; Chee, Y.E.; Yates, C.J. A statistical explanation of MaxEnt for ecologists. Divers. Distrib. 2011, 17, 43–57. [Google Scholar] [CrossRef]
- Fourcade, Y.; Besnard, A.G.; Secondi, J. Paintings predict the distribution of species, or the challenge of selecting environmental predictors and evaluation statistics. Glob. Ecol. Biogeogr. 2018, 27, 245–256. [Google Scholar] [CrossRef]
- Chen, K. Effect of climate factors on the quality of Coffea Arabica L. J. Baoshan Univ. 2019, 38, 40–46. [Google Scholar]
- Gomes, L.C.; Bianchi, F.A.; Cardoso, I.M.; Fernandes, R.A.; Filho, E.F.; Schulte, R.O. Agroforestry systems can mitigate the impacts of climate change on coffee production: A spatially explicit assessment in Brazil. Agric. Ecosyst. Environ. 2020, 294, 106858. [Google Scholar] [CrossRef]
- Thioune, E.H.; Strickler, S.; Gallagher, T.; Charpagne, A.; Decombes, P.; Osborne, B.; McCarthy, J. Temperature impacts the response of Coffea canephora to decreasing soil water availability. Trop. Plant Biol. 2020, 13, 236–250. [Google Scholar] [CrossRef]
- Zhang, S.; Liu, X.G.; Wang, X.L.; Gao, Y.L.; Yang, Q.L. Evaluation of coffee ecological adaptability using Fuzzy, AHP, and GIS in Yunnan Province, China. Arab. J. Geosci. 2021, 14, 1366. [Google Scholar] [CrossRef]
- Zhang, M.D.; Wang, R.; Li, Y.; Hu, X.; Li, M.; Zhang, M.; Duan, C.C. Ecological suitability zoning of Coffea arabica L. in Yunnan Province. Chin. J. Eco-Agric. 2020, 28, 168–178. [Google Scholar] [CrossRef]
- de Carvalho Alves, M.; da Silva, F.M.; Sanches, L.; de Carvalho, L.G.; e Silva Ferraz, G.A. Geospatial analysis of ecological vulnerability of coffee agroecosystems in Brazil. Appl. Geomat. 2013, 5, 87–97. [Google Scholar] [CrossRef]
- Martins, M.Q.; Partelli, F.L.; Golynski, A.; de Sousa Pimentel, N.; Ferreira, A.; de Oliveira Bernardes, C.; Ribeiro-Barros, A.I.; Ramalho, J.C. Adaptability and stability of Coffea canephora genotypes cultivated at high altitude and subjected to low temperature during the winter. Sci. Hortic. 2019, 252, 238–242. [Google Scholar] [CrossRef]
- Rigal, C.; Xu, J.; Hu, G.; Qiu, M.; Vaast, P. Coffee production during the transition period from monoculture to agroforestry systems in near optimal growing conditions, in Yunnan Province. Agric. Syst. 2020, 177, 102696. [Google Scholar] [CrossRef]
- Tesfaye, S.G.; Ismail, M.R.; Ramlan, M.F.; Marziah, M.; Kausar, H. Effect of soil drying on rate of stress development, leaf gas exchange and proline accumulation in Robusta Coffee (Coffea Canephora Pierre Ex Froehner) Clones. Exp. Agric. 2013, 50, 458–479. [Google Scholar] [CrossRef]
- Zi, Y.L.; Lin, Z.; Michael, P.N.; Xiao, G.W.; Kai, W.P.; Ke, Q.W.; Mohammed, A.D.; Ming, X.D.; Qin, L.X.; Bikram, P.; et al. Climate change jointly with migration ability affect future range shifts of dominant fir species in Southwest China. Divers. Distrib. 2019, 26, 352–367. [Google Scholar] [CrossRef]
- Läderach, P.; Villegas, J.R.; Racines, C.N.; Zelaya, C.; Valle, A.M.; Jarvis, A. Climate change adaptation of coffee production in space and time. Clim. Change 2017, 141, 47–62. [Google Scholar] [CrossRef]
- Jiang, Y.L.; Hong, C.; Tong, L.; Chi, Z. The potential geographical distribution of Haloxylon across Central Asia under climate change in the 21st century. Agric. For. Meteorol. 2019, 275, 243–254. [Google Scholar] [CrossRef]
Publisher’s Note: MDPI stays neutral with regard to jurisdictional claims in published maps and institutional affiliations. |
© 2022 by the authors. Licensee MDPI, Basel, Switzerland. This article is an open access article distributed under the terms and conditions of the Creative Commons Attribution (CC BY) license (https://creativecommons.org/licenses/by/4.0/).