Article

Atmospheric CO2 Concentrations in Caves Protected as Nature Reserves and Related Gas Hazard

1
Istituto Nazionale di Geofisica e Vulcanologia, Osservatorio Etneo, 95125 Catania, Italy
2
Dipartimento di Scienze Della Terra e del Mare, Università di Palermo, 90123 Palermo, Italy
3
Legambiente Sicilia, Riserva Naturale Grotta di Santa Ninfa, 91029 Santa Ninfa, Italy
4
Legambiente Sicilia, Riserva Naturale Grotta di Carburangeli, 90044 Carini, Italy
5
Legambiente Sicilia, Riserva Naturale Grotta di Sant’Angelo Muxaro, 92020 Sant’Angelo Muxaro, Italy
6
Independent Researcher, 90146 Palermo, Italy
7
Independent Researcher, 43123 Parma, Italy
*
Author to whom correspondence should be addressed.
Atmosphere 2022, 13(11), 1760; https://doi.org/10.3390/atmos13111760
Submission received: 14 September 2022 / Revised: 13 October 2022 / Accepted: 23 October 2022 / Published: 26 October 2022
(This article belongs to the Special Issue Feature Papers in Air Quality)

Abstract

:
Atmospheric CO2 concentrations can reach high levels inside natural caves, representing a hazardous condition for both humans frequenting the underground environment and its safeguard due to the corrosion of speleothems induced by the acidification of atmospheric moisture. These issues are particularly critical for the eco-sustainable management of caves protected as nature reserves and undergoing touristic exploitation. In this paper we present the results of the C6 project, which was activated in 1999 for the monitoring of air quality inside three caves protected as nature reserves in Sicily (Italy). Near-real-time and spot measurements of air temperature and CO2 concentration have been carried out since the year 2000, giving the opportunity of evaluating the gas hazard for visitors and its potential impact on the protected underground environments, as well as the influence of meteorological and hydrological conditions in driving carbon dioxide accumulations. The analysis of data acquired in the hypogeal atmosphere, and their comparison with analogous epigeal measures, indicates that carbon dioxide accumulation is controlled by a complex interaction among cave topography, meteorological dynamics, gaseous exchanges between groundwaters and the atmosphere, and human fruition. This last factor, under particular conditions, can surprisingly diminishing underground CO2 concentrations.

1. Introduction

Carbon dioxide is asphyxiant and odorless, making it extremely insidious (it is called “the silent killer”). The health risks associated with CO2 exposure depend on both its concentrations and exposure time and consists of asphyxiation and an increase in blood acidity, triggering adverse effects on the respiratory, cardiovascular, and central nervous systems [1].
Present average atmospheric CO2 (0.042% [2]) poses no threat to human health; however, considerably higher concentrations produce negative effects. Physiological symptoms begin at concentrations of 2% and an exposure time of several hours and comprehend headaches and dyspnea upon mild exertion. At higher concentrations (3%), a 1 h exposure time triggers the same effects and, in addition, sweating and dyspnea at rest. More serious effects occur within few minutes at concentrations higher than 4%, causing unconsciousness (7–10% of CO2) and leading up to convulsions, coma, and death within 1 min for concentrations of 17–30% [1]. Recommendations for working places suggest 5000 ppmv CO2 for permanent exposure (8 h a day working time) [3,4].
Preliminary evaluation of CO2 effects in human populations suggests that acute exposure to 3% CO2 concentrations, and prolonged exposure to concentrations > 1%, may significantly affect health in the general population [5].
Site-specific risk assessments are necessary to determine potential human health risks. Both natural (caves) and artificial (mines, road and railway tunnels, hydraulic works, etc.) underground environments are particularly prone to hazardous CO2 accumulations, because (i) they are closed spaces, frequently exchanging with free air through small openings; (ii) they are often sited in a topographically depressed position, fostering the gravitative accumulation of CO2; and (iii) they foster the release to the atmosphere of geogenic CO2, produced during karst dissolution processes [6], volcanic or hydrothermal activity [7], or primarily produced by ore bodies [8].
Health threats caused by exposure to high air CO2 concentrations can be particularly significant in karst caves, especially if exploited for tourism and frequented by a huge number of visitors (large show caves as Castellana in Italy or Postojna in Slovenia) [9]. Air breathed by cave visitors, enriched in CO2 due to the respiratory process, can lead to carbon dioxide concentrations that are dangerous for visitors themselves [10] but, on the other side of the coin, represents an environmental threat for the safeguard of these environments; elevated air CO2 concentrations promote the acidification of condensed atmospheric moisture particles, which chemically attack calcite speleothems, causing their rapid degradation [11].
These issues are critical in cases of caves protected as nature reserves, but which are open to a regulated, eco-sustainable, touristic exploitation. This is the case for the Carburangeli, Santa Ninfa, and Sant’Angelo Muxaro (hereafter referred as Sant’Angelo) caves, located in Sicily (southern Italy), which have been protected as nature reserves since 1995 (Figure 1) [12].
The Italian NGO Legambiente, which is the managing institution of the caves on the behalf of a contract with the Sicilian Regional Government [12], co-promoted since 1999 a monitoring program, which has the acronym C6 [14], aimed to the assessment of both the possible impact of touristic exploitation and the health hazards related to CO2 accumulations in the underground atmosphere [14,15]. Spot and near-real-time meteorological and carbon dioxide concentration data, inside and outside the caves, have been collected since 2000.
This work presents the complete dataset of CO2 concentrations (and related side meteorological parameters) collected in the three caves, merging previously published data with new original information. The comprehensive dataset is analyzed to evaluate the gas hazard for visitors and its potential impact on the underground environments, as well as the influence of meteorological and hydrogeochemical parameters in driving carbon dioxide accumulations.

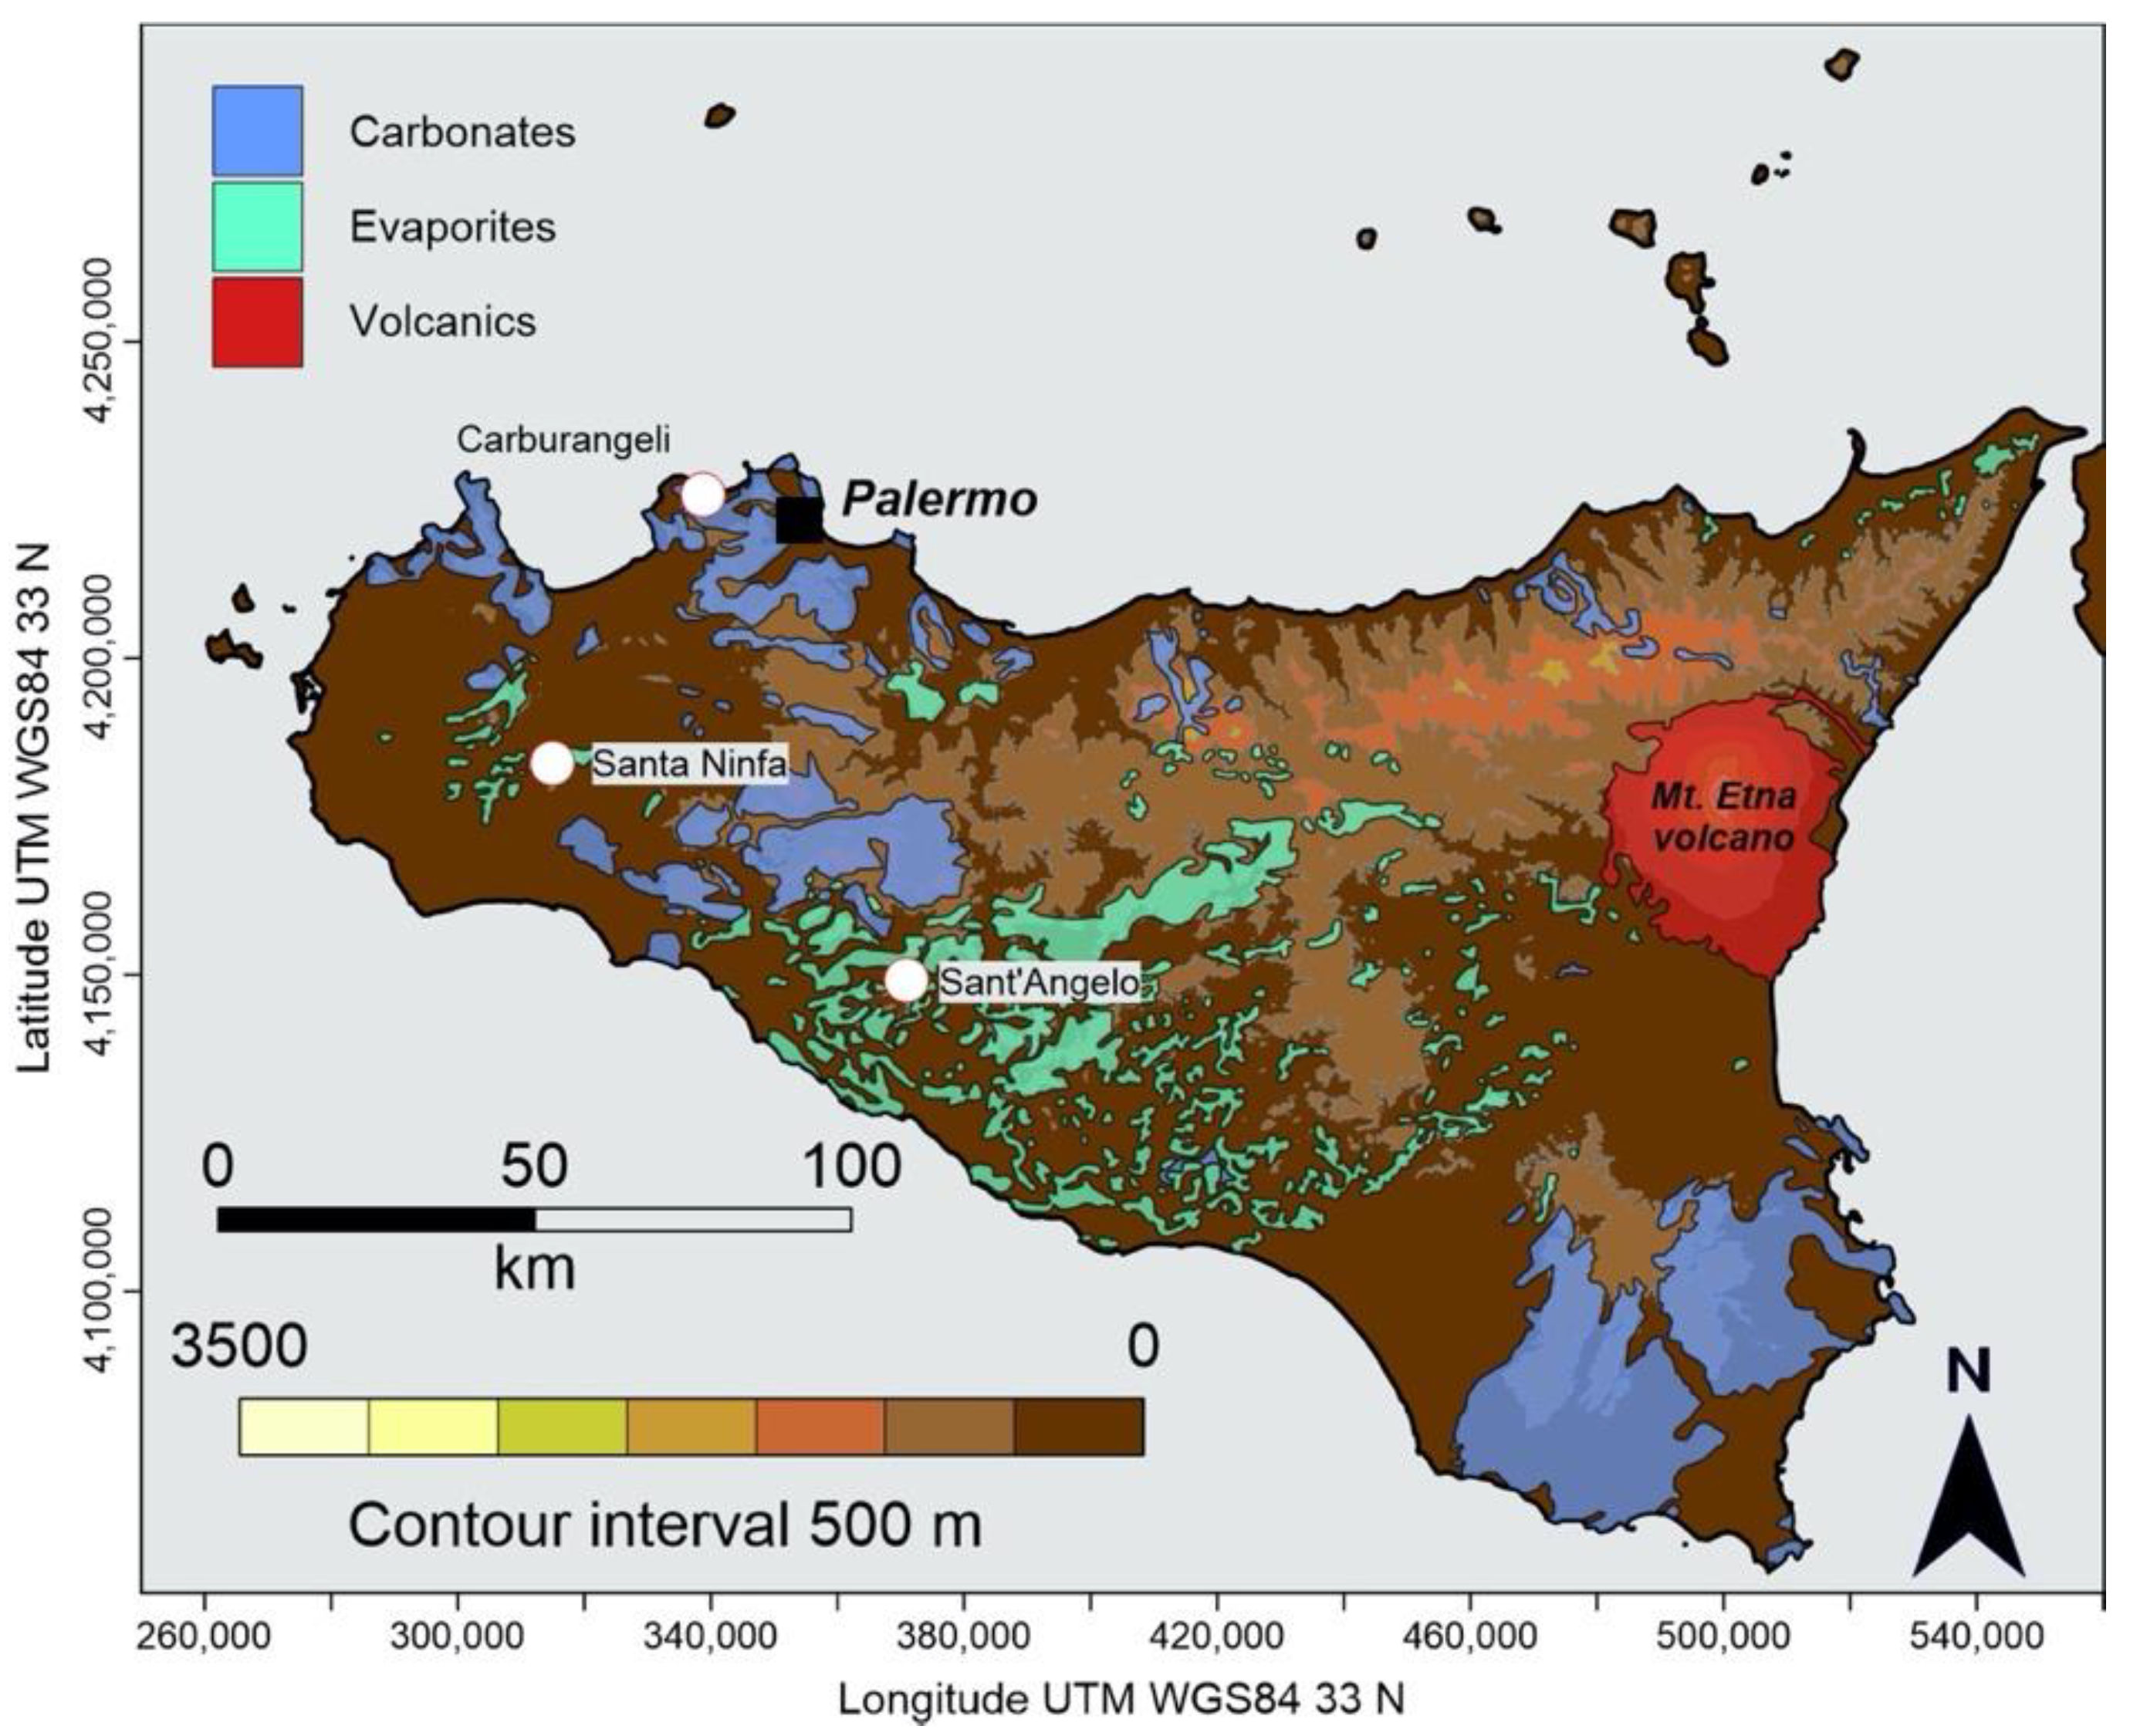
2. Study Area: Topography, Climate, Geology, and Geomorphology

The studied caves are in western Sicily (Figure 1). Western Sicily shows an articulated landscape composed of the following features: (i) a mountain belt in Mesozoic carbonate rocks to the north, with northern slopes ending directly on the Tyrrhenian sea or surrounding small and discontinuous coastal plains open to the sea; (ii) a hill area in Cenozoic terrigenous or evaporite rocks, typical of the central sector; and (iii) a wide, flat, coastal strip in Plio-Quaternary clastic rocks, that characterizes the southern and western sectors. Considering its average conditions and the climate classification of Köppen–Geiger [16], Sicily shows a sub-tropical, humid, mesothermic, mediterranean climate (Csa type), with an average temperature of the coldest month being below 18 °C and above −3 °C, summer dry, average temperature of the hottest month above 22 °C, and rainfall concentrated in the autumn–winter season. Within this macroclimate location, several climate subtypes can be distinguished due to the topographic setting, as shown by the climate parameters of the three studied areas reported below, which have been reconstructed thanks to the consultation of the meteorological data elaborated by Servizio Informativo Agrometeorologico Siciliano (SIAS—Agrometeorological Information Service of Sicily) [17] for the thirty years 1965–1994, selecting the weather stations closest to the investigated areas.
The Carburangeli area lies on a coastal plain, in the northern sector of western Sicily. It consists of a flight of marine terraces of the middle-upper Pleistocene, carved on Calabrian clastic rocks or on Mesozoic carbonate rocks, which extend from sea level up to about 100 m above sea level [18] and references therein. To the south, the plain is interrupted along large abandoned coastal cliffs that are hundreds of meters high. The topographic setting exposes the Carburangeli area to winds and atmospheric disturbances from the northern quadrants. The climate has a warm temperate, showing an arid period from May to August [17]. On annual average, they record 18.8 °C temperature (24.6 °C maximum and 15 °C minimum temperatures) and 756 mm rainfall. August (25.9 °C) is the hottest month, January (12.5 °C) the coldest one. The wettest season is autumn (290 mm), with maximum rainfall in October (100 mm); the driest season is summer (61 mm), with minimum rainfall in July (3 mm). The Carburangeli Cave opens along a late Pleistocene abandoned coastal cliff 3–5 m high. It shows a horizontal development of almost 400 m, at an altitude between about 20–25 m above sea level (Figure 2).
Its three entrances are north-facing and represent ancient sea caves—abandoned, opened by the sea, and carved on Calabrian calcarenites. Inside, about 250 m from entrances, the cave develops in Mesozoic limestones [13], and references therein. It is a flank margin cave whose genesis was produced by karst processes controlled by the mixing of discharging freshwater with marine water.
The Santa Ninfa area is a hill relief between about 300 and 650 m above sea level, in the central-western sector of western Sicily. It is occupied by a large upland in Messinian gypsum rocks, where numerous surface karst landforms (karren, dolines, canyons, and blind or dry valleys) occur [13], and references therein. Its summit position exposes this upland to winds from all directions. The climate is between temperate and cold, with a dry period from May to August and a temperate period from September to April [17]. On annual average, they record 16.6 °C temperature (22.3 °C maximum and 12.4 °C minimum temperatures) and 737 mm rainfall. August (25.6 °C) is the hottest month, January (9.2 °C) the coldest one. The wettest season is autumn (268 mm), with maximum rainfall in December (100 mm); the driest season is summer (58 mm), with minimum rainfall in July (4 mm). The Santa Ninfa Cave opens at the end of a blind valley and extends for about 1400 m, along two systems of karst galleries (an upper dry system developed and branched; a lower system still active) occurring in gypsum rocks [13], and references therein. The maximum difference in height is about 20 m (Figure 3). Its genesis is due to dissolution processes controlled by the lowering of the karst base level.
The Sant’Angelo area is an isolated hill relief in the central sector of western Sicily, whose flat top reaches 350 m above sea level. It is made up of Messinian gypsum rocks, where many karren occur [13], and references therein. Being isolated, the hill is exposed to all winds. The climate is dry from May to August and temperate from September to April [17]. On annual average, the area records a 16.2 °C temperature (21.7 °C maximum and 12.1 °C minimum temperatures) and 667 mm rainfall. August (25.3 °C) is the hottest month, January (8.4 °C) the coldest one. The wettest season is autumn (245 mm), with maximum rainfall in December (90 mm); the driest season is summer (53 mm), with minimum rainfall in June and July (3 mm). The Sant’Angelo Cave begins with a sinkhole at 173 m above sea level and ends with a resurgence at 126 m above sea level, showing an overall development of about 1700 m. The cave is composed of a short system of dry galleries along an upper level and a well-developed system of active galleries at a lower level, carved into gypsum rock (Figure 4). Its genesis is due to dissolution processes controlled by a prolongated standstill phase of the karst base level.

3. Materials and Methods

Information used in this work include measures of air temperature and CO2 concentrations from spot campaigns and near-real-time data acquired by dataloggers. Part of these were published in previous papers available online, part were published in a local journal (in Italian, printed only), and part are original data which are previously unreleased.
Spot measures of underground air temperature (±1 °C) and CO2 concentrations (full range 9999 ppmv, error ±5% of the measure) were acquired using a Testo 535 infrared portable spectrometer.
Near-real-time data of cave air temperatures (±0.3 °C) were acquired hourly using IP68, 12 bit, Tinytag Plus Gemini loggers.
Near-real-time data of underground air CO2 concentration were taken using a Vaisala Carbo Cap IR spectrometer (range 0–20,000 ppmv), for which 4–20 mA analogic output was recorded by a Gemini 12-bit Tinytag Plus current logger. For ensuring a reasonable duration of the batteries before substitution (3 months), the spectrometer operated by a timer once a day for 30 min (12:00–12:30) at Carburangeli cave. Measures were acquired by the current logger at 12:20 to prevent missing acquisitions due to differential time shifts between the logger and the timer clocks. The instrument was moved to Santa Ninfa cave in the period August–October 2011, where it operated by acquiring data every 6 h. Near-real-time data were not acquired at Sant’Angelo cave due to limitations of funds for supporting this activity
Meteorological side parameters were acquired (Carburangeli and Santa Ninfa reserves only) by 12 bit ONSET Micro station loggers, equipped with 12 bit Smart sensors, measuring hourly rain, air temperature, and atmospheric pressure.
Table 1 summarizes the data and their sources used in this study.

4. Results

Type of data, and their sources, have been reported in Table 1.
The most complete data record concerns Carburangeli cave, where, in the year 2000 (19 June), an experiment was carried out, which aimed to evaluate the effects of the presence of some tens of visitors in the same day by measuring concentrations of air CO2 at three points, at three different heights, each [19]. Other spot campaigns, in these and other sites, were carried out between 2002 and 2007, while quasi-real time of hypogeal air CO2 and temperature and epigeal meteorological parameters were acquired in the period 2006–2011. An experiment similar to that previously described was carried out at the Santa Ninfa cave (26–28 July 2000). Here, similarly to Carburangeli, other spot campaigns were conducted between 2004 and 2007, and near-real-time data were acquired for a few months in 2011. Finally, spot air CO2 and temperature measures were acquired inside Sant’Angelo cave between 2005 and 2007. These data will be presented in the next sub-sections.

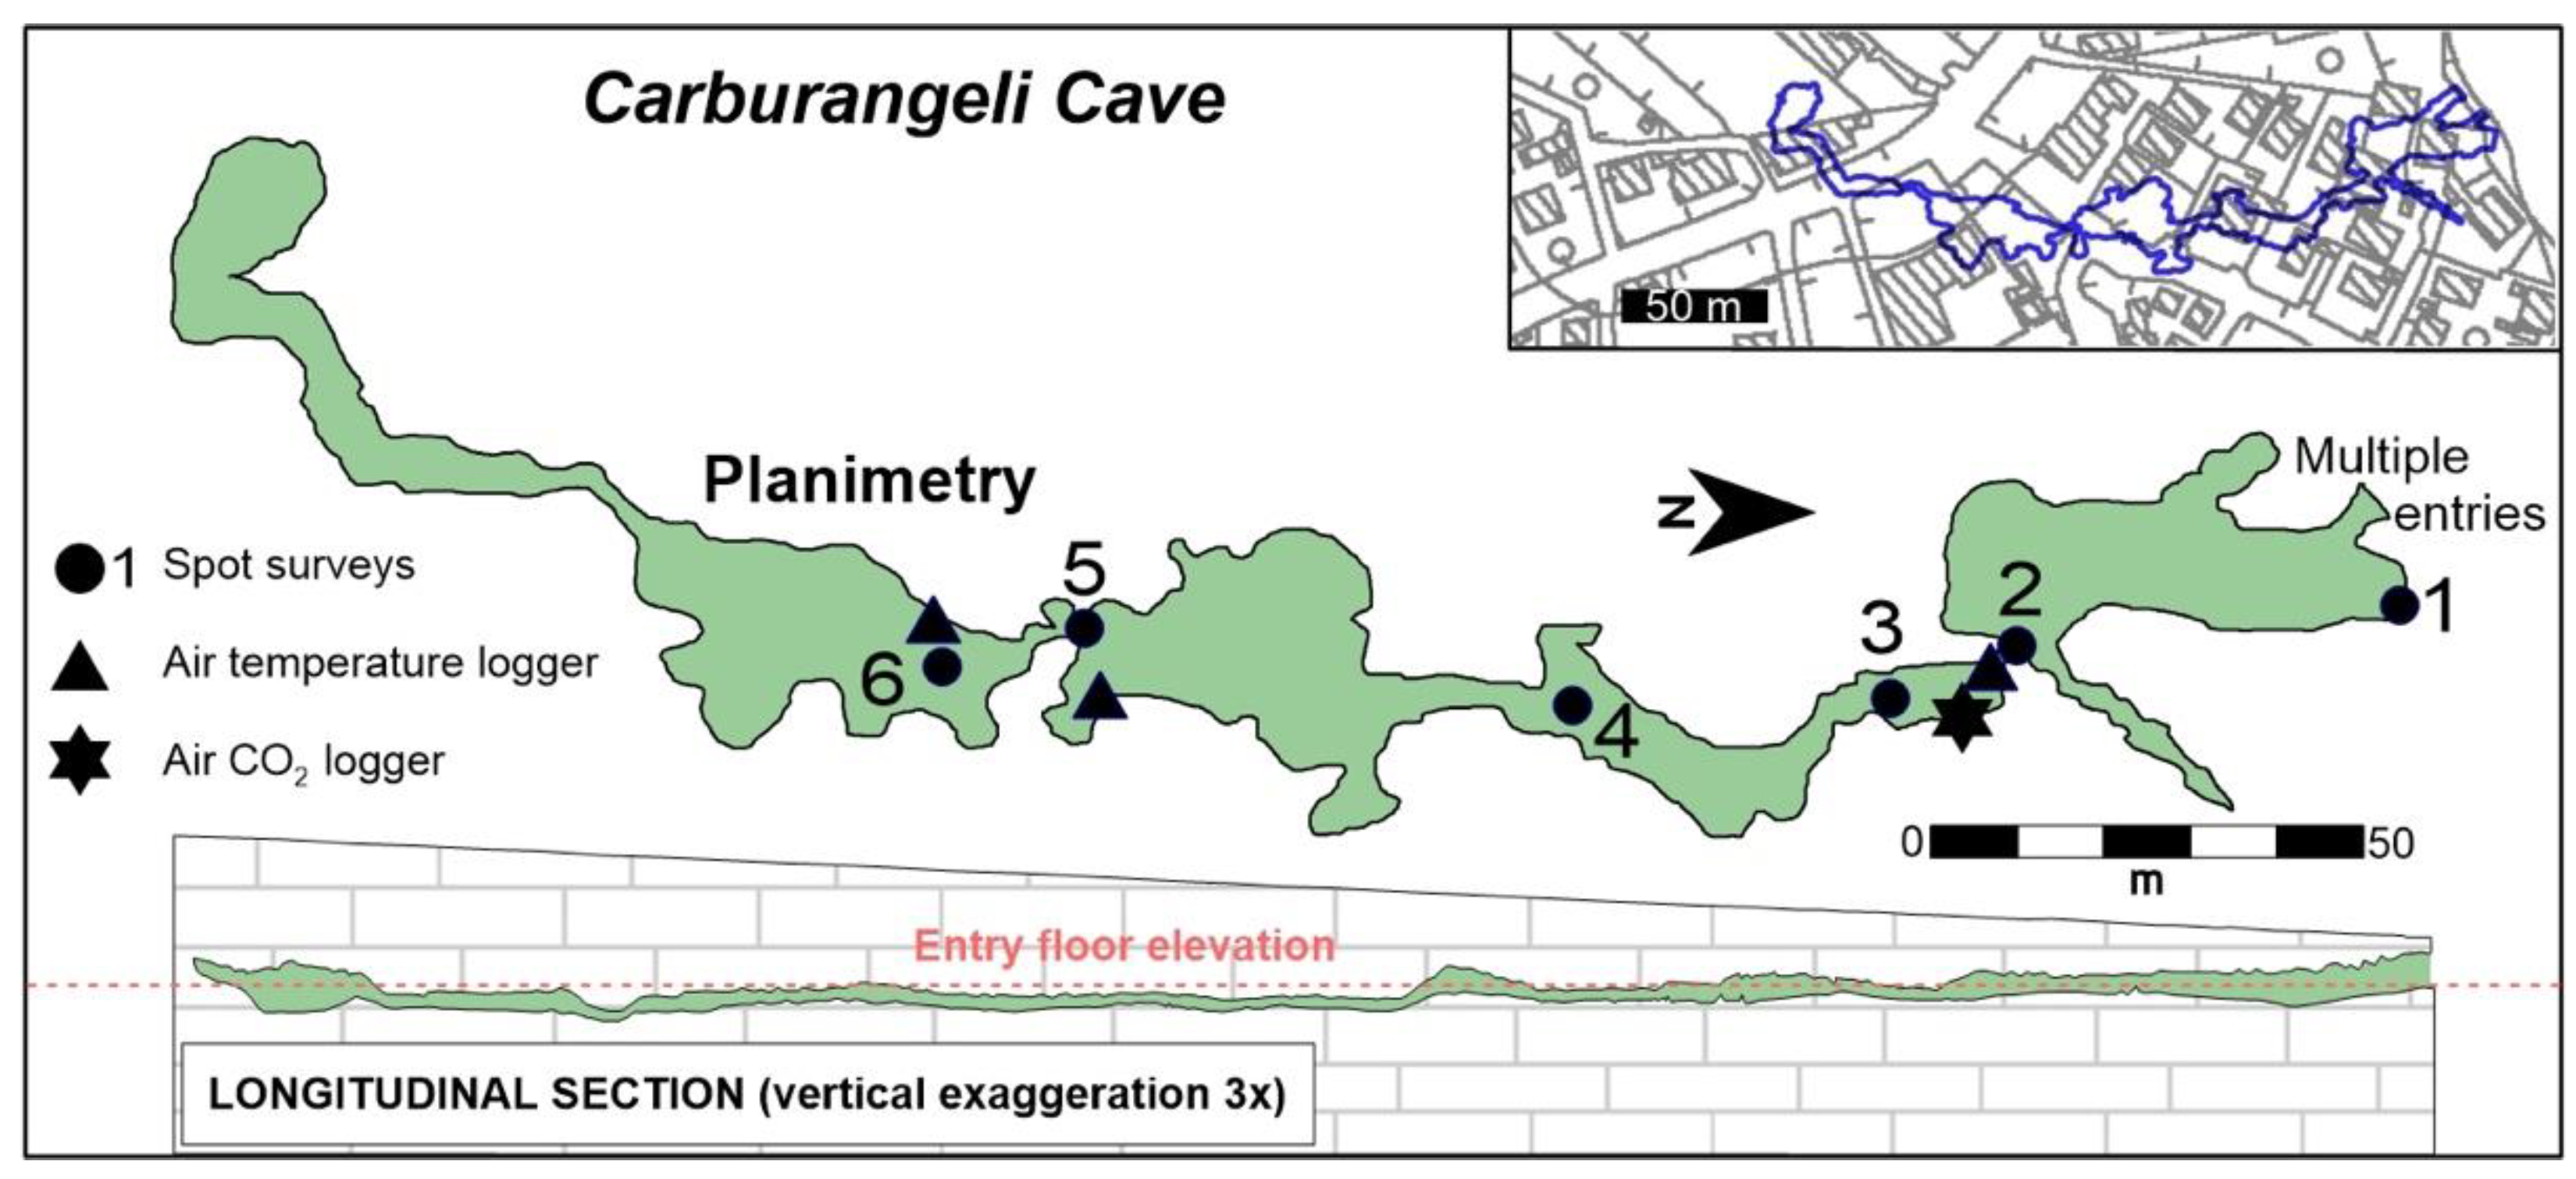
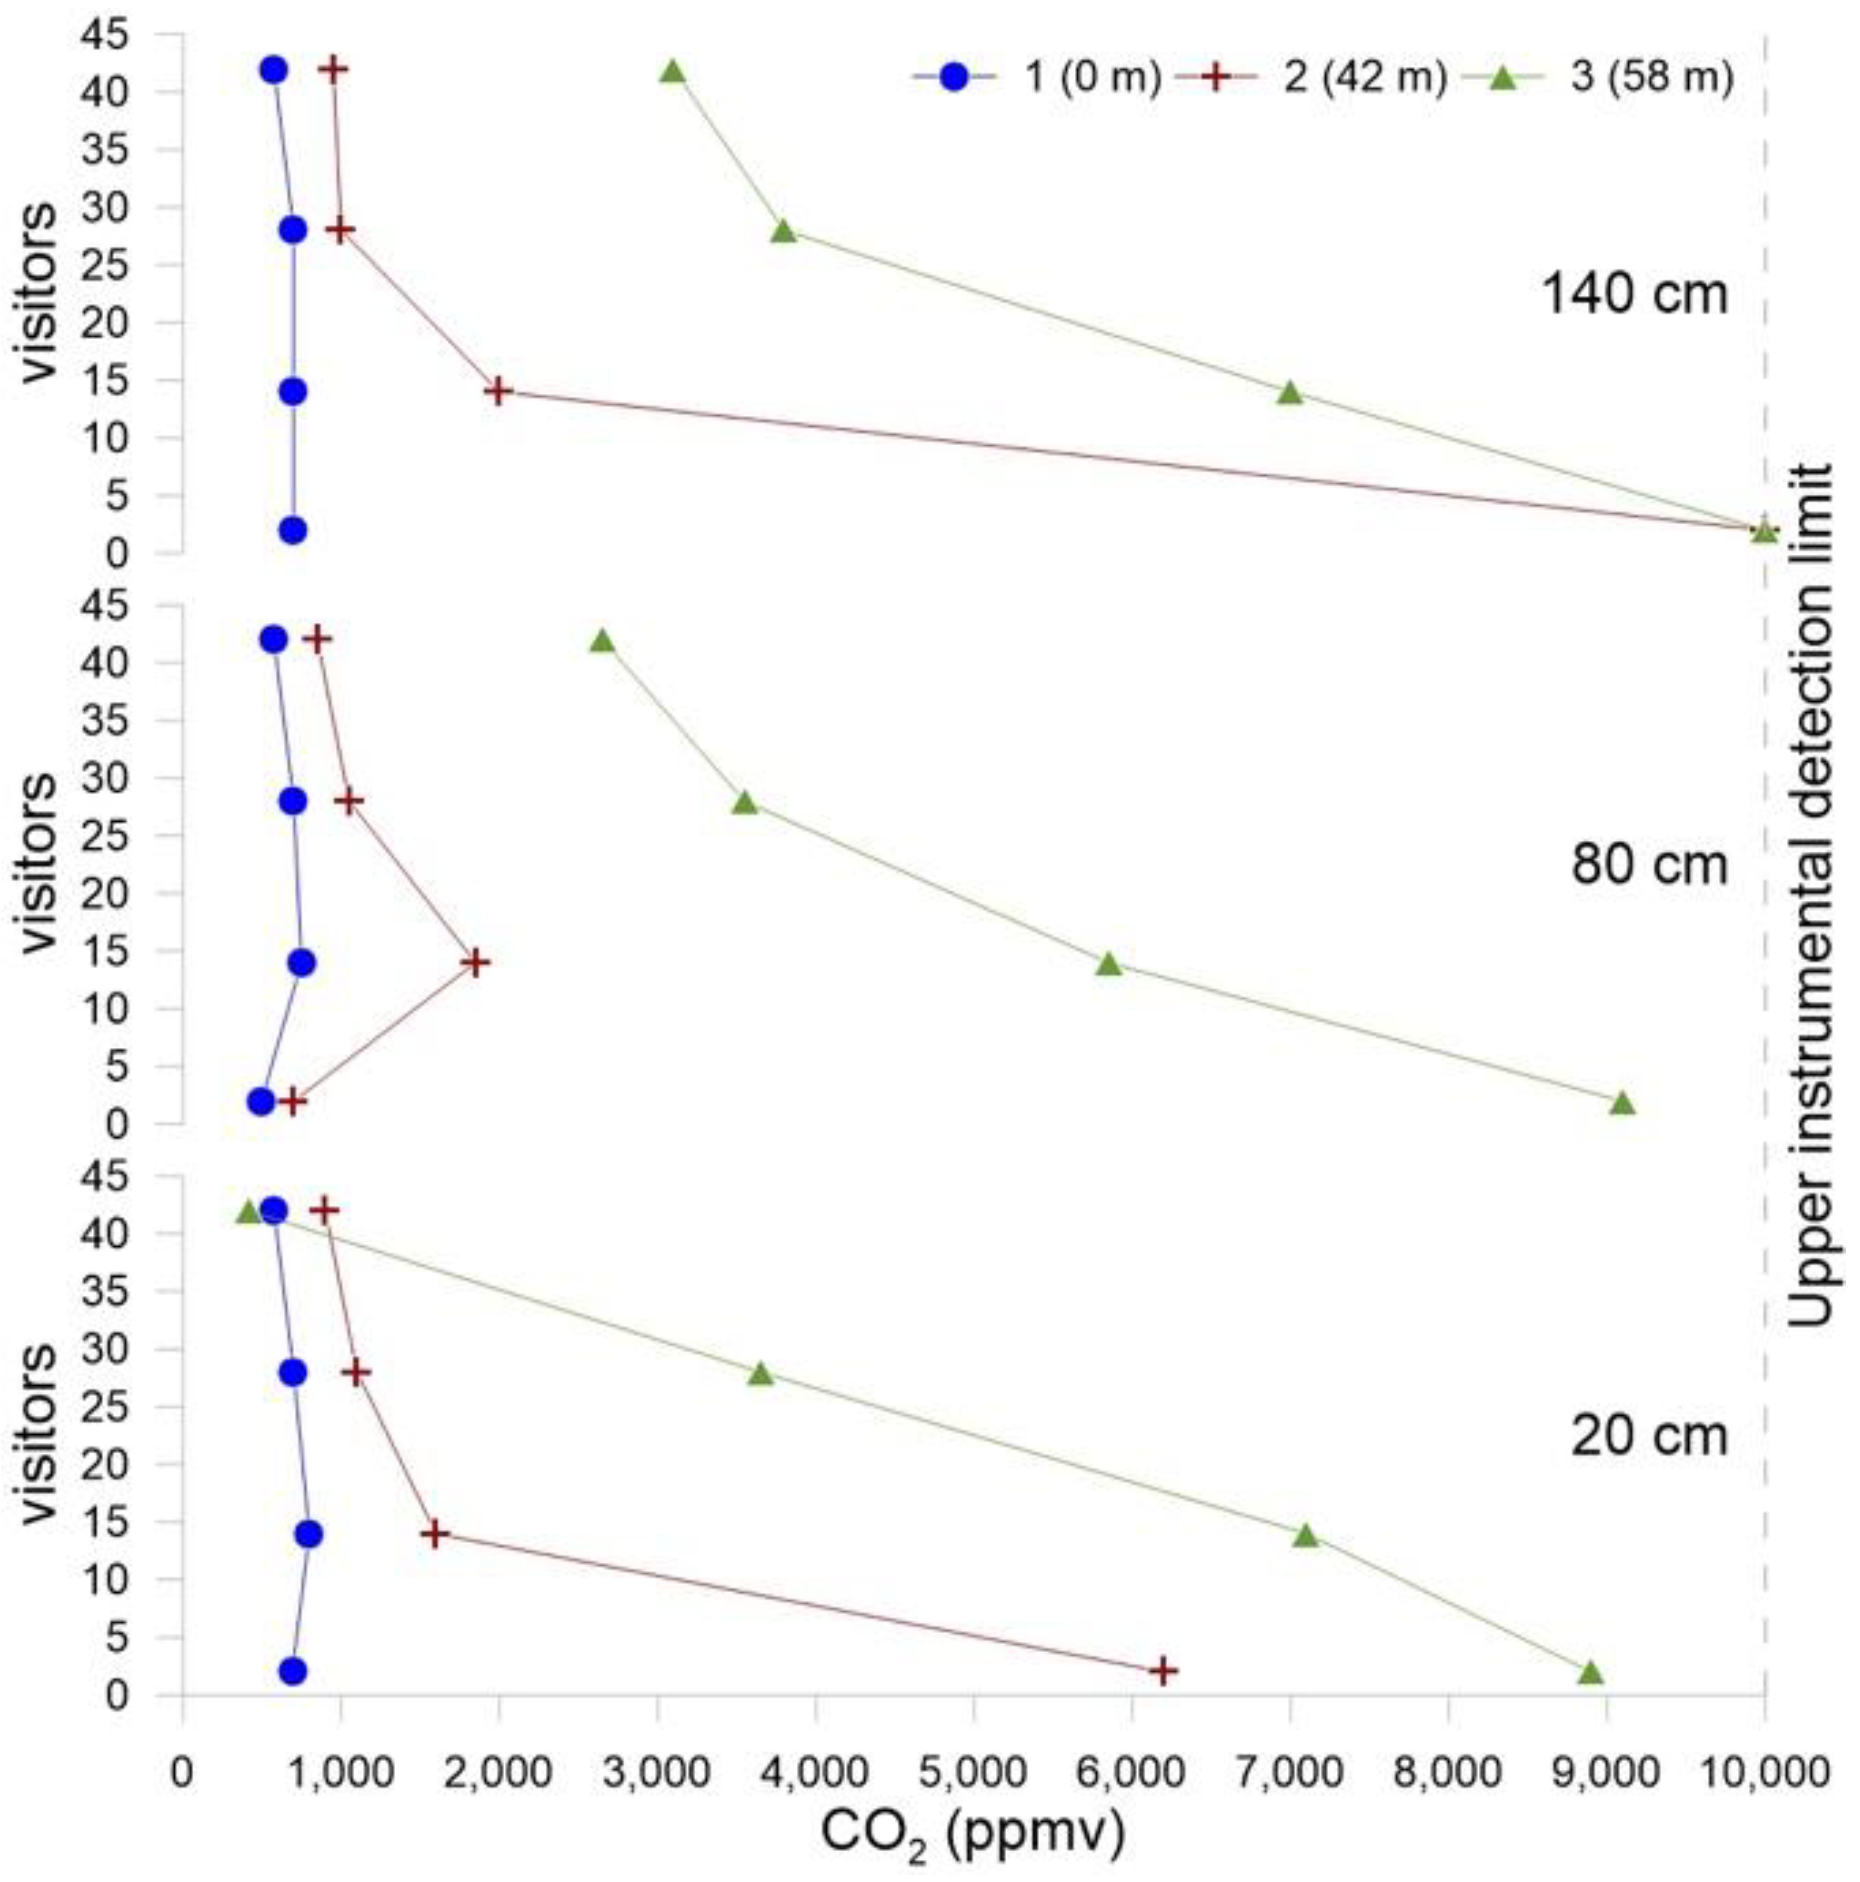
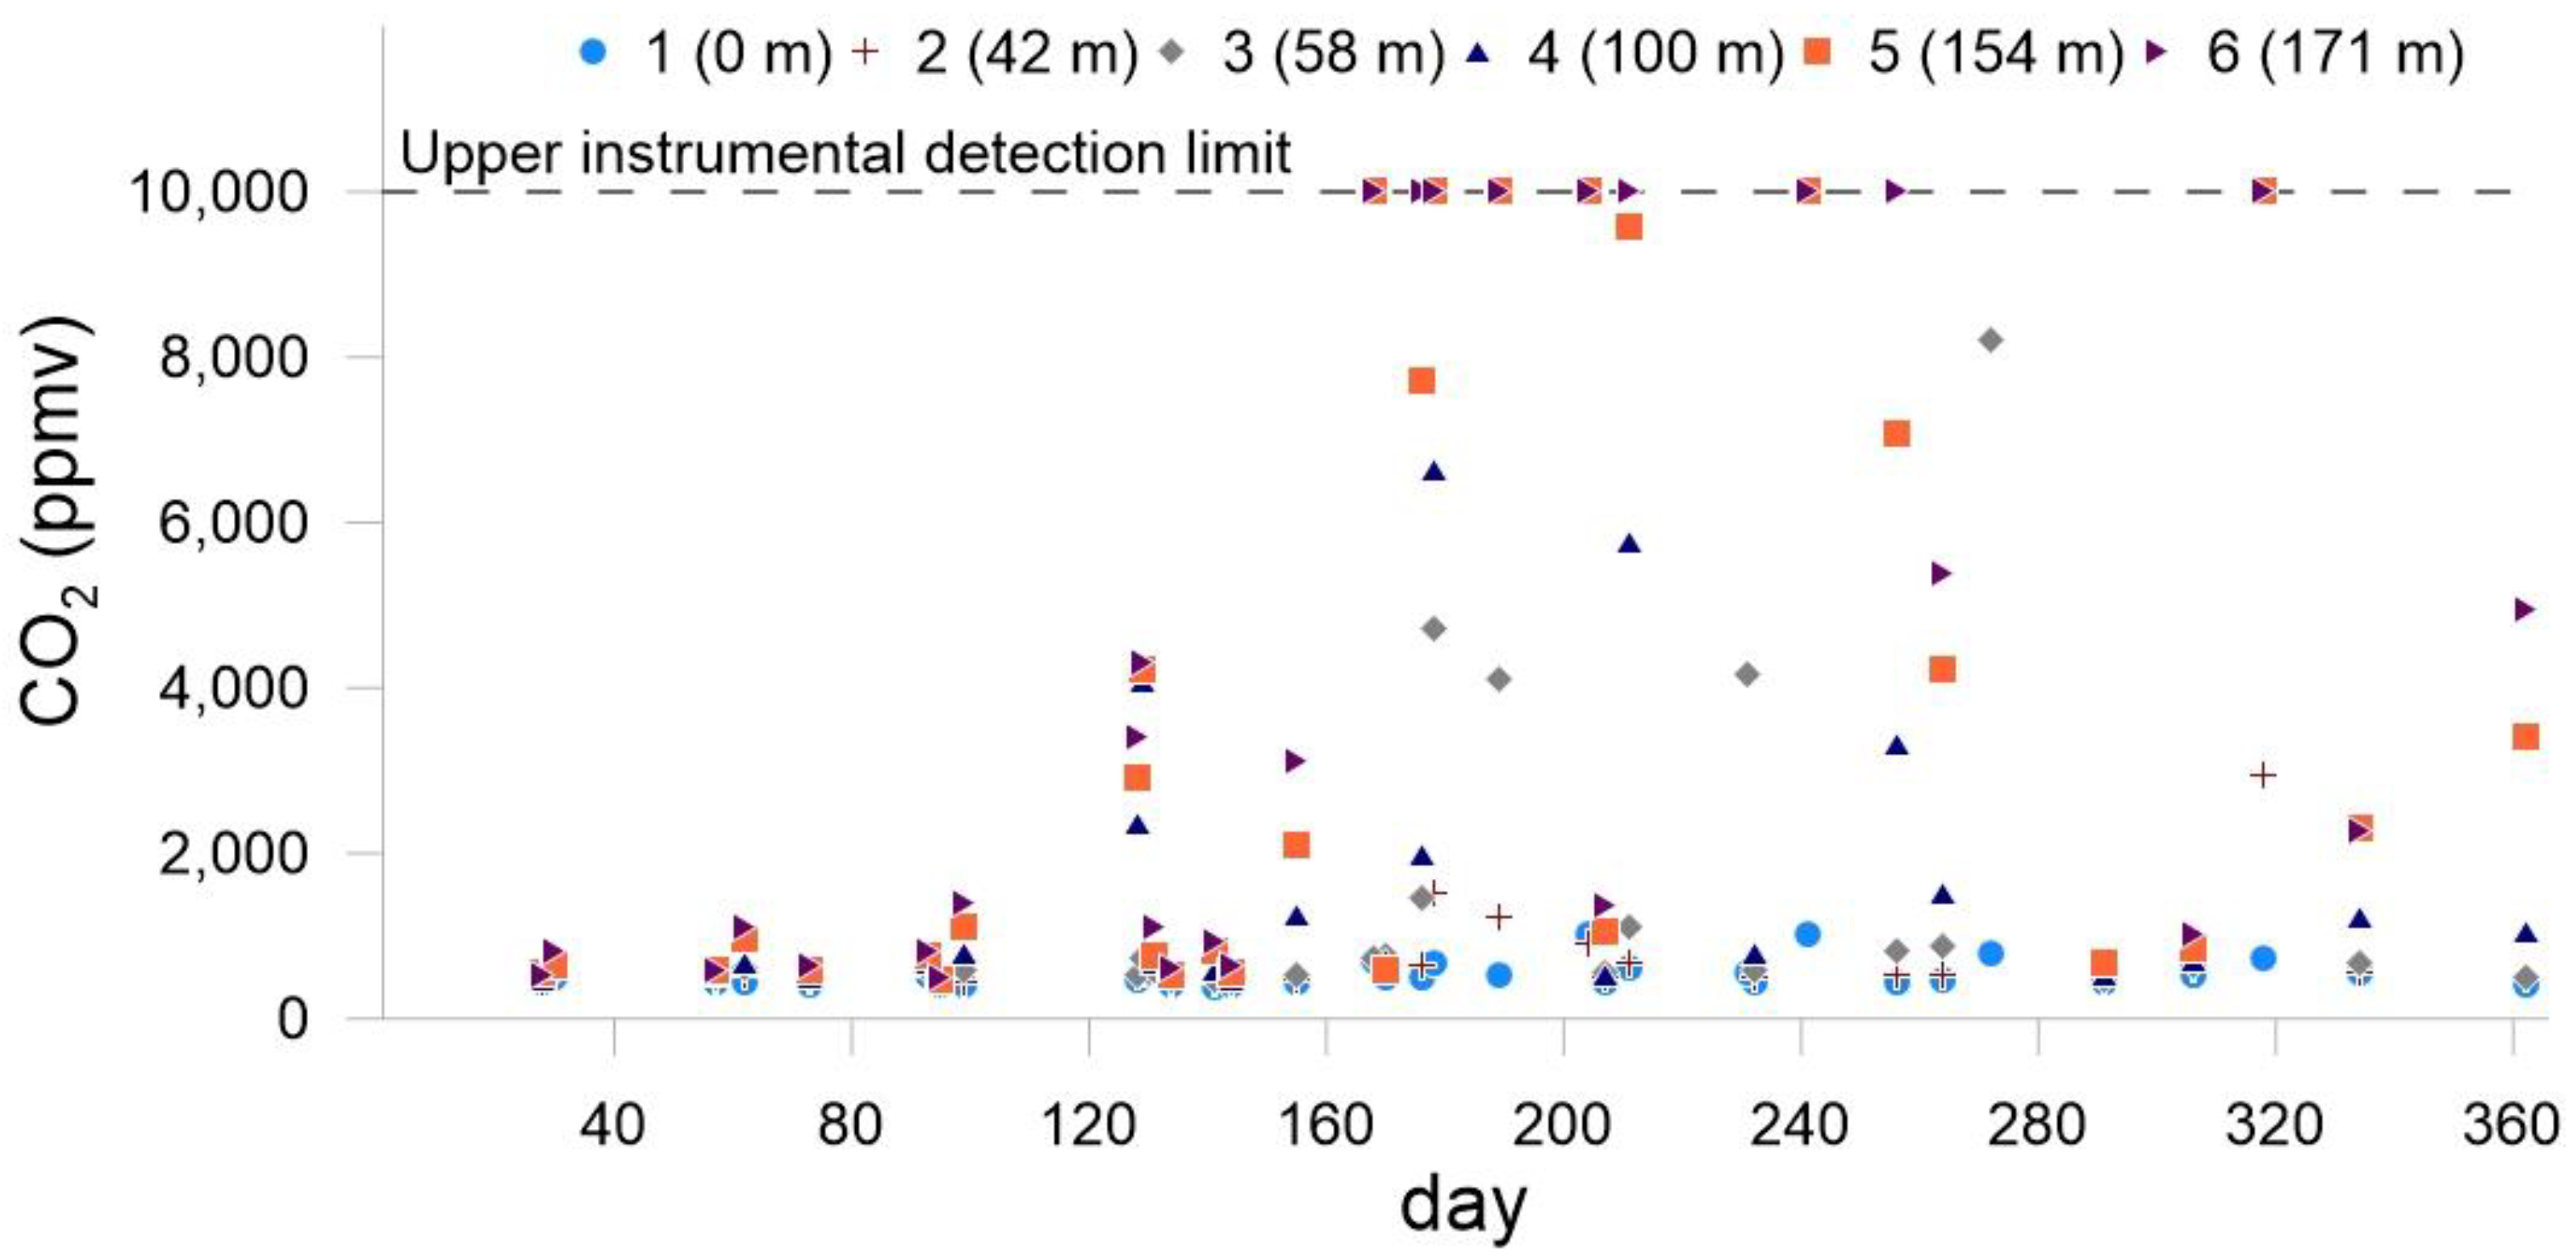
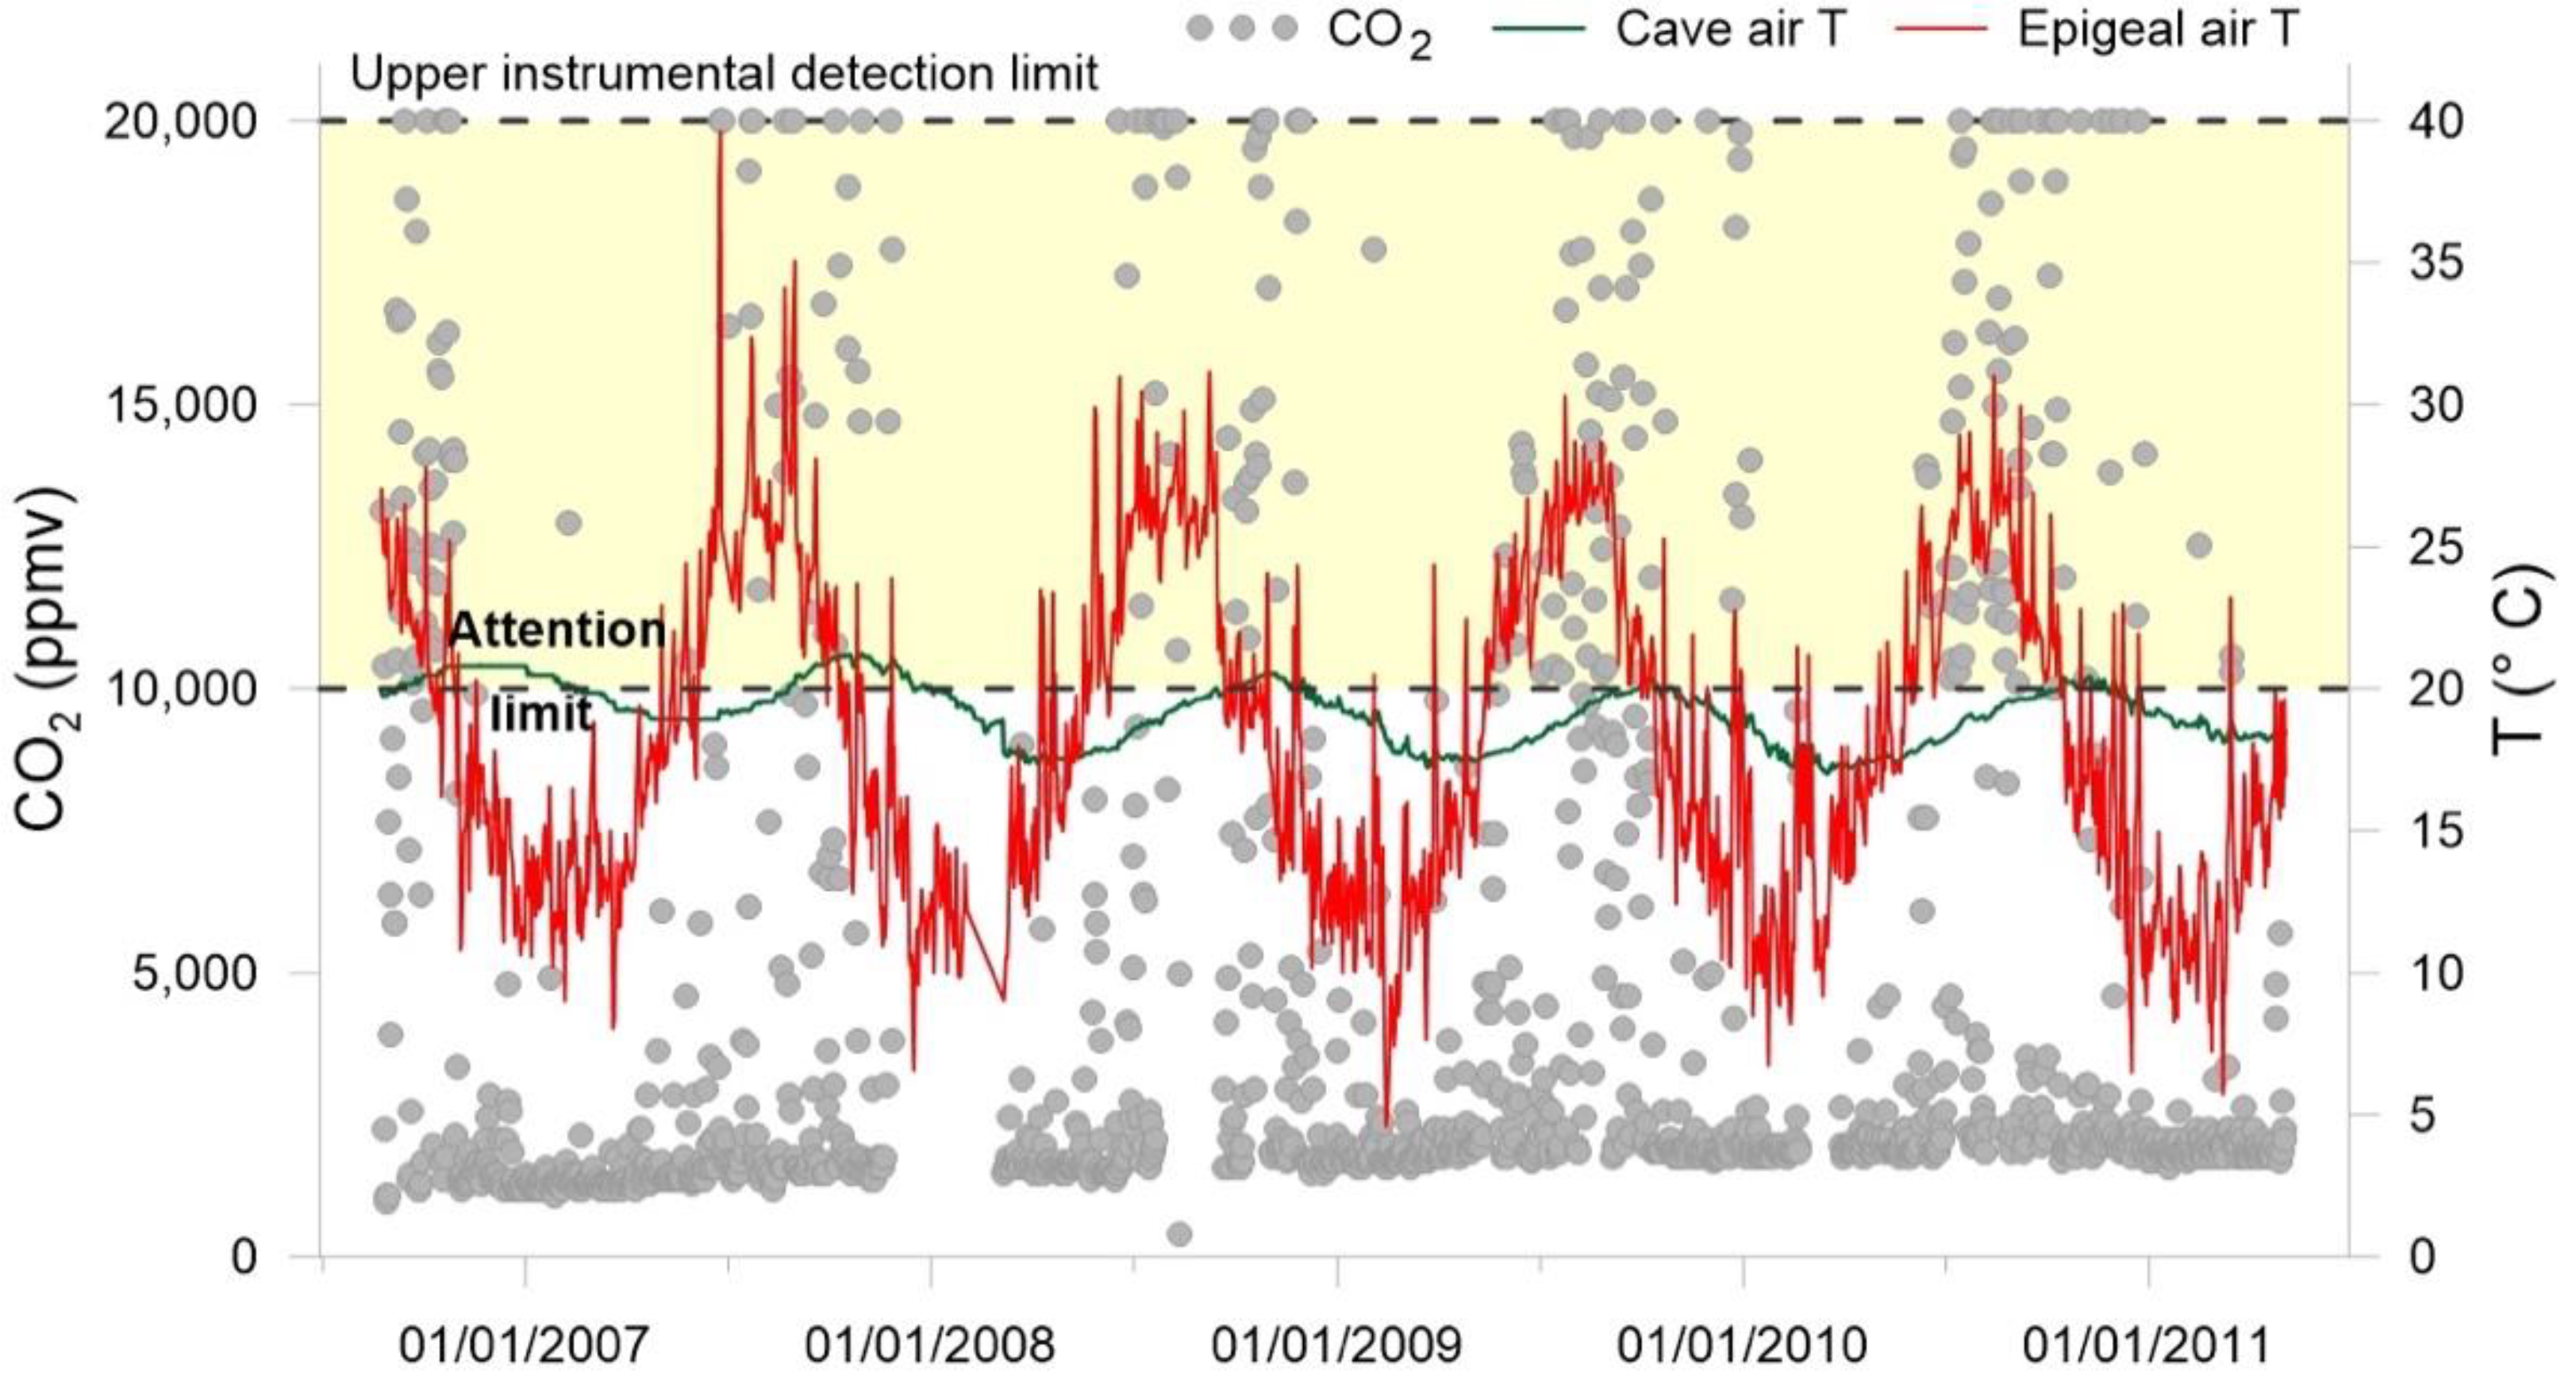
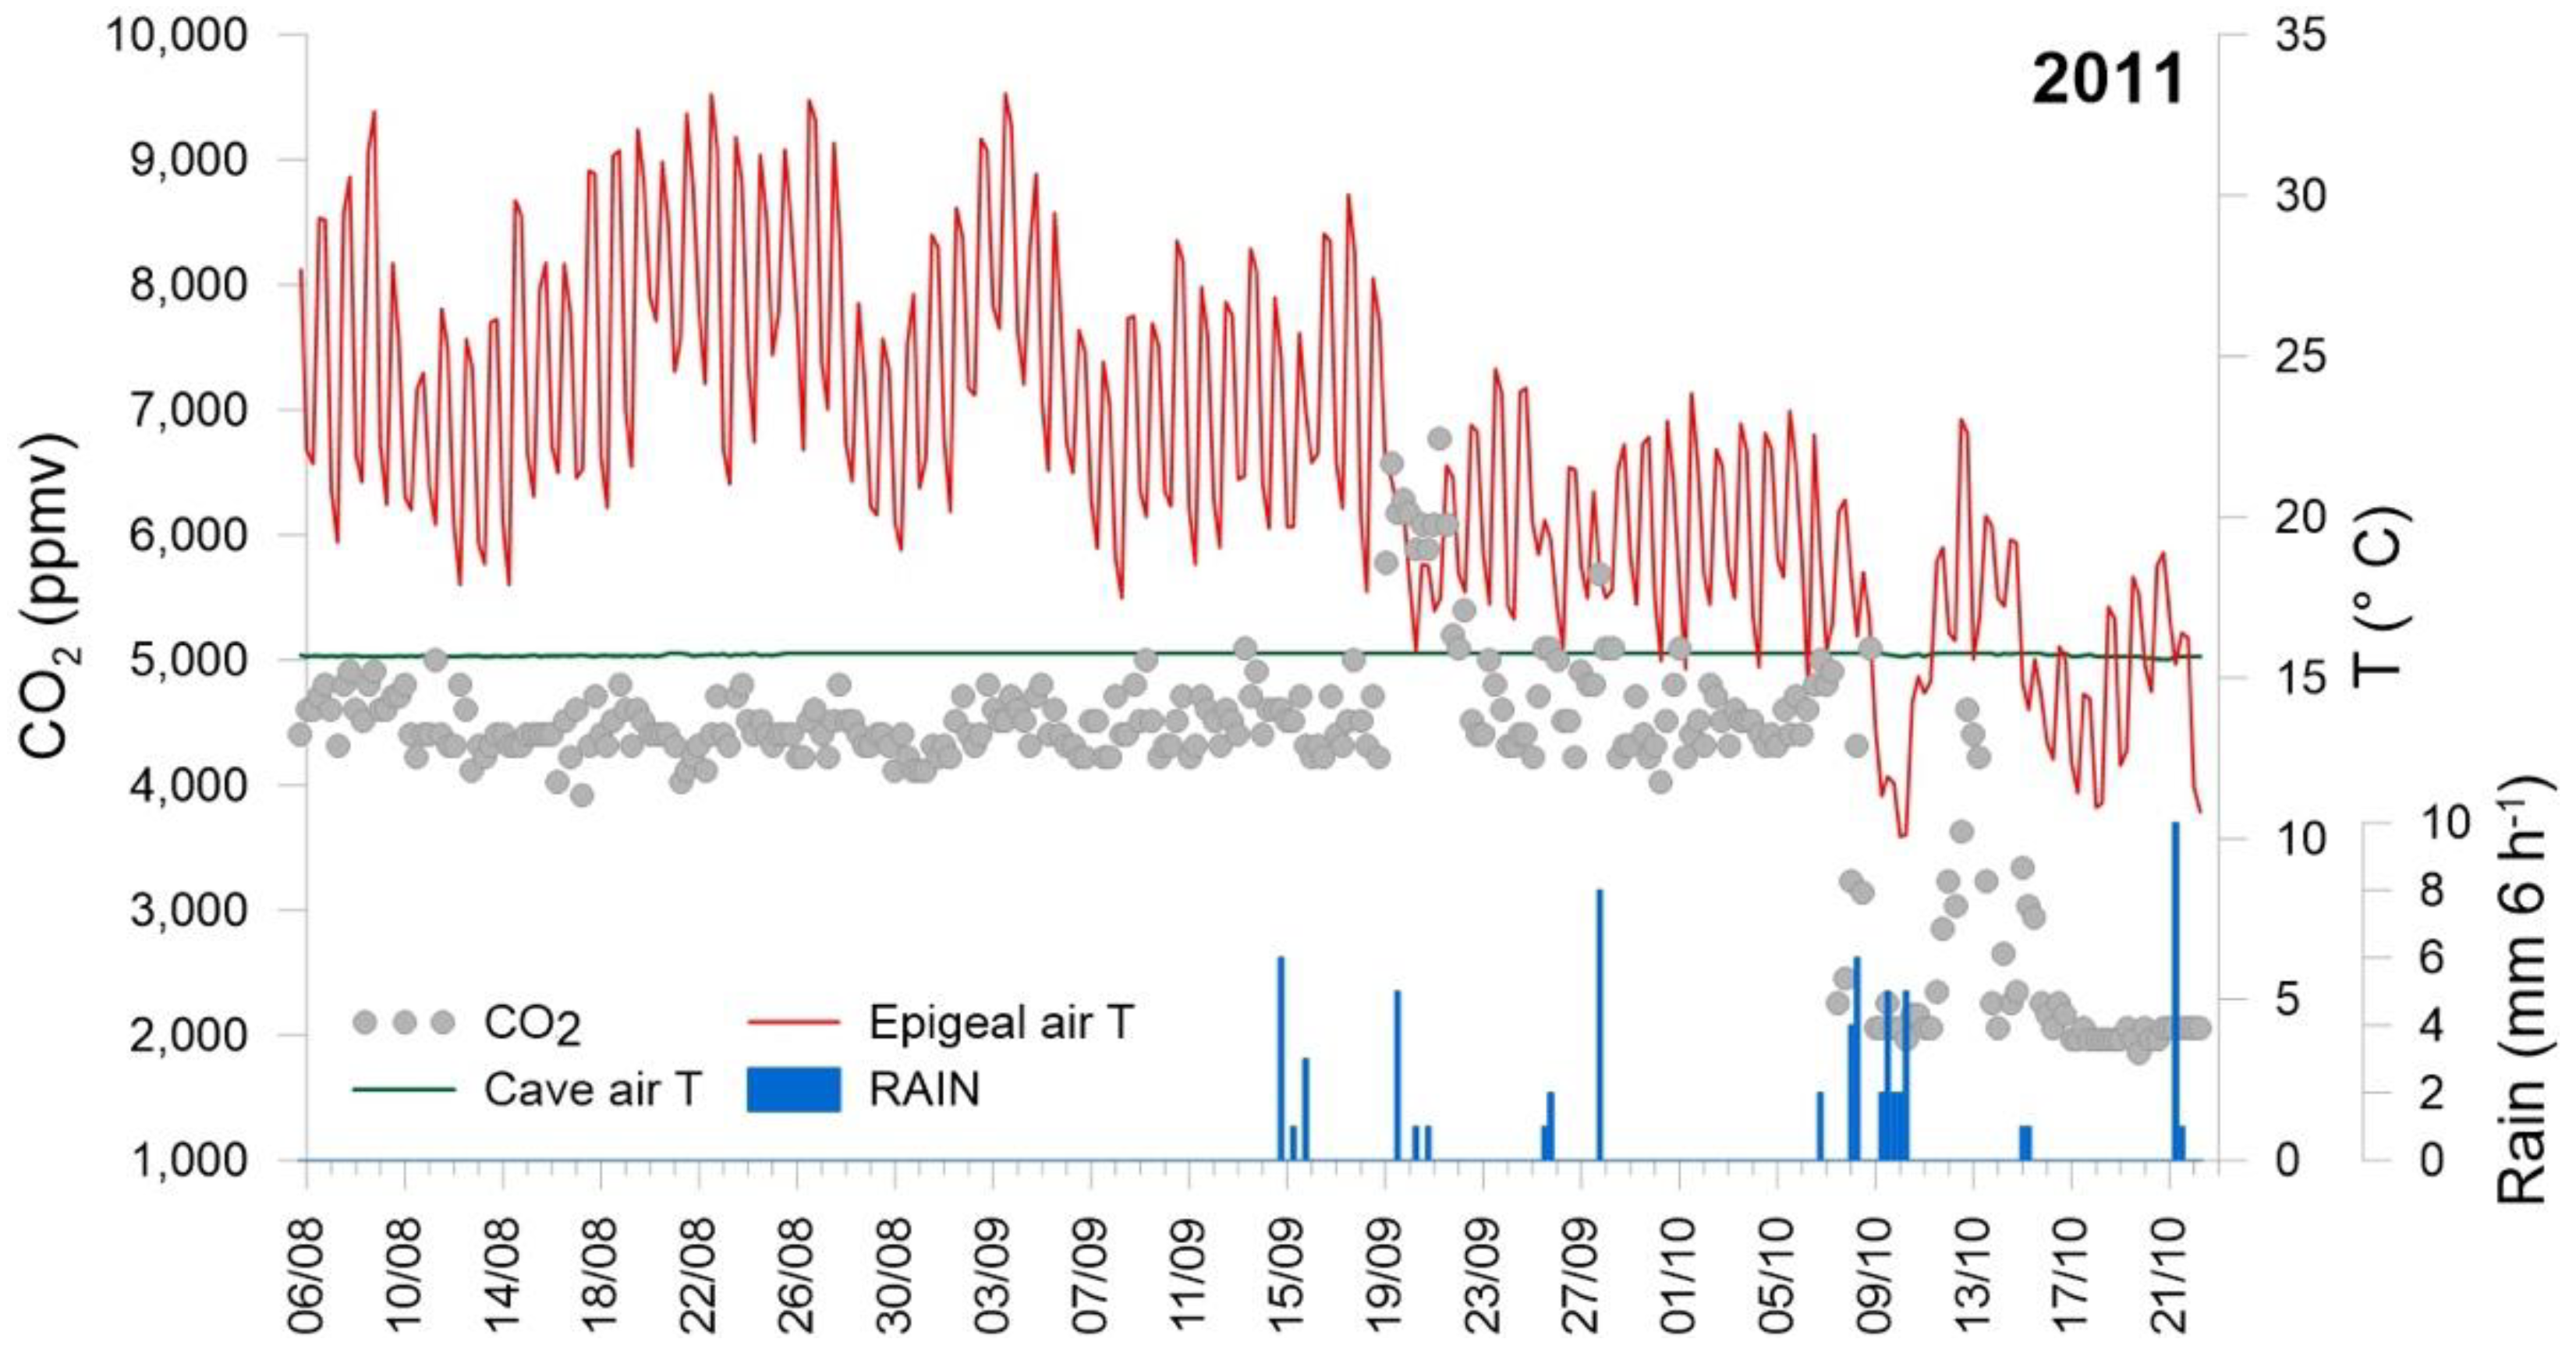
4.1. Carburangeli Cave

Results of the experiment carried out on 19 June 2000 [15] are illustrated in the following Figure 5. Atmospheric CO2 concentrations were measured in three points located in the outer portion of the cave, normally open to visitors (see Figure 2 for their location); measures were taken at three different heights (20, 80 and 140 cm) for evaluating the possible effect of vertical density stratification.
A total of four series of measures were taken: the first one before the fruition event (only two persons into the cave), and the other three following the succession of the group of visitors, who frequented the cave for about 20 min each. Results were really surprising; at the cave entrance (point one), the CO2 concentration remained unaltered (at the net of minor variations), as well as at 80 cm at point two, where concentrations first increased and then diminished. At the other heights at point two, and at all heights at point three, concentrations showed a dramatic diminution, moving from maxima equal to the full scale of the instrument (9999 ppmv), as at 140 cm at points two and three, to a minimum of 415 ppmv at 20 cm at point three, to even lower than the correspondent measure at point one.
Analogous measures, at a 60 cm height, have been taken since 2007 at the same points of the 2000 experiment and at the other three located in the inner part of the cave, as reported in Figure 6.
As illustrated in the figure, a different behavior is observed between the cold (January–April and October–December) and warm (May–September) months. In the cold season, when air temperature in the cave is generally higher than the outer one (see following Figure 7), CO2 concentrations in the cave atmosphere are lower, on average, than during the warm months, and often with no appreciable differences among the different point of measure. The opposite is observed in the warm season, when cave air temperature is lower than the outer one: CO2 concentrations range up to the upper detection limit of the instrument (9999 ppmv), with noticeable differences among the points.
The seasonality of air CO2 concentrations inside the cave is remarked by the quasi-real time data acquired by the logger located between points two and three (Figure 2), which operated from summer 2006 to spring 2011, illustrated in Figure 7. When cave air temperature is stably higher than that one of free air, namely between late autumn and early spring, only sporadically high CO2 concentrations are observed. Vice versa, during the warm months, concentrations frequently rose up to the upper instrumental detection limit (20,000 ppmv).

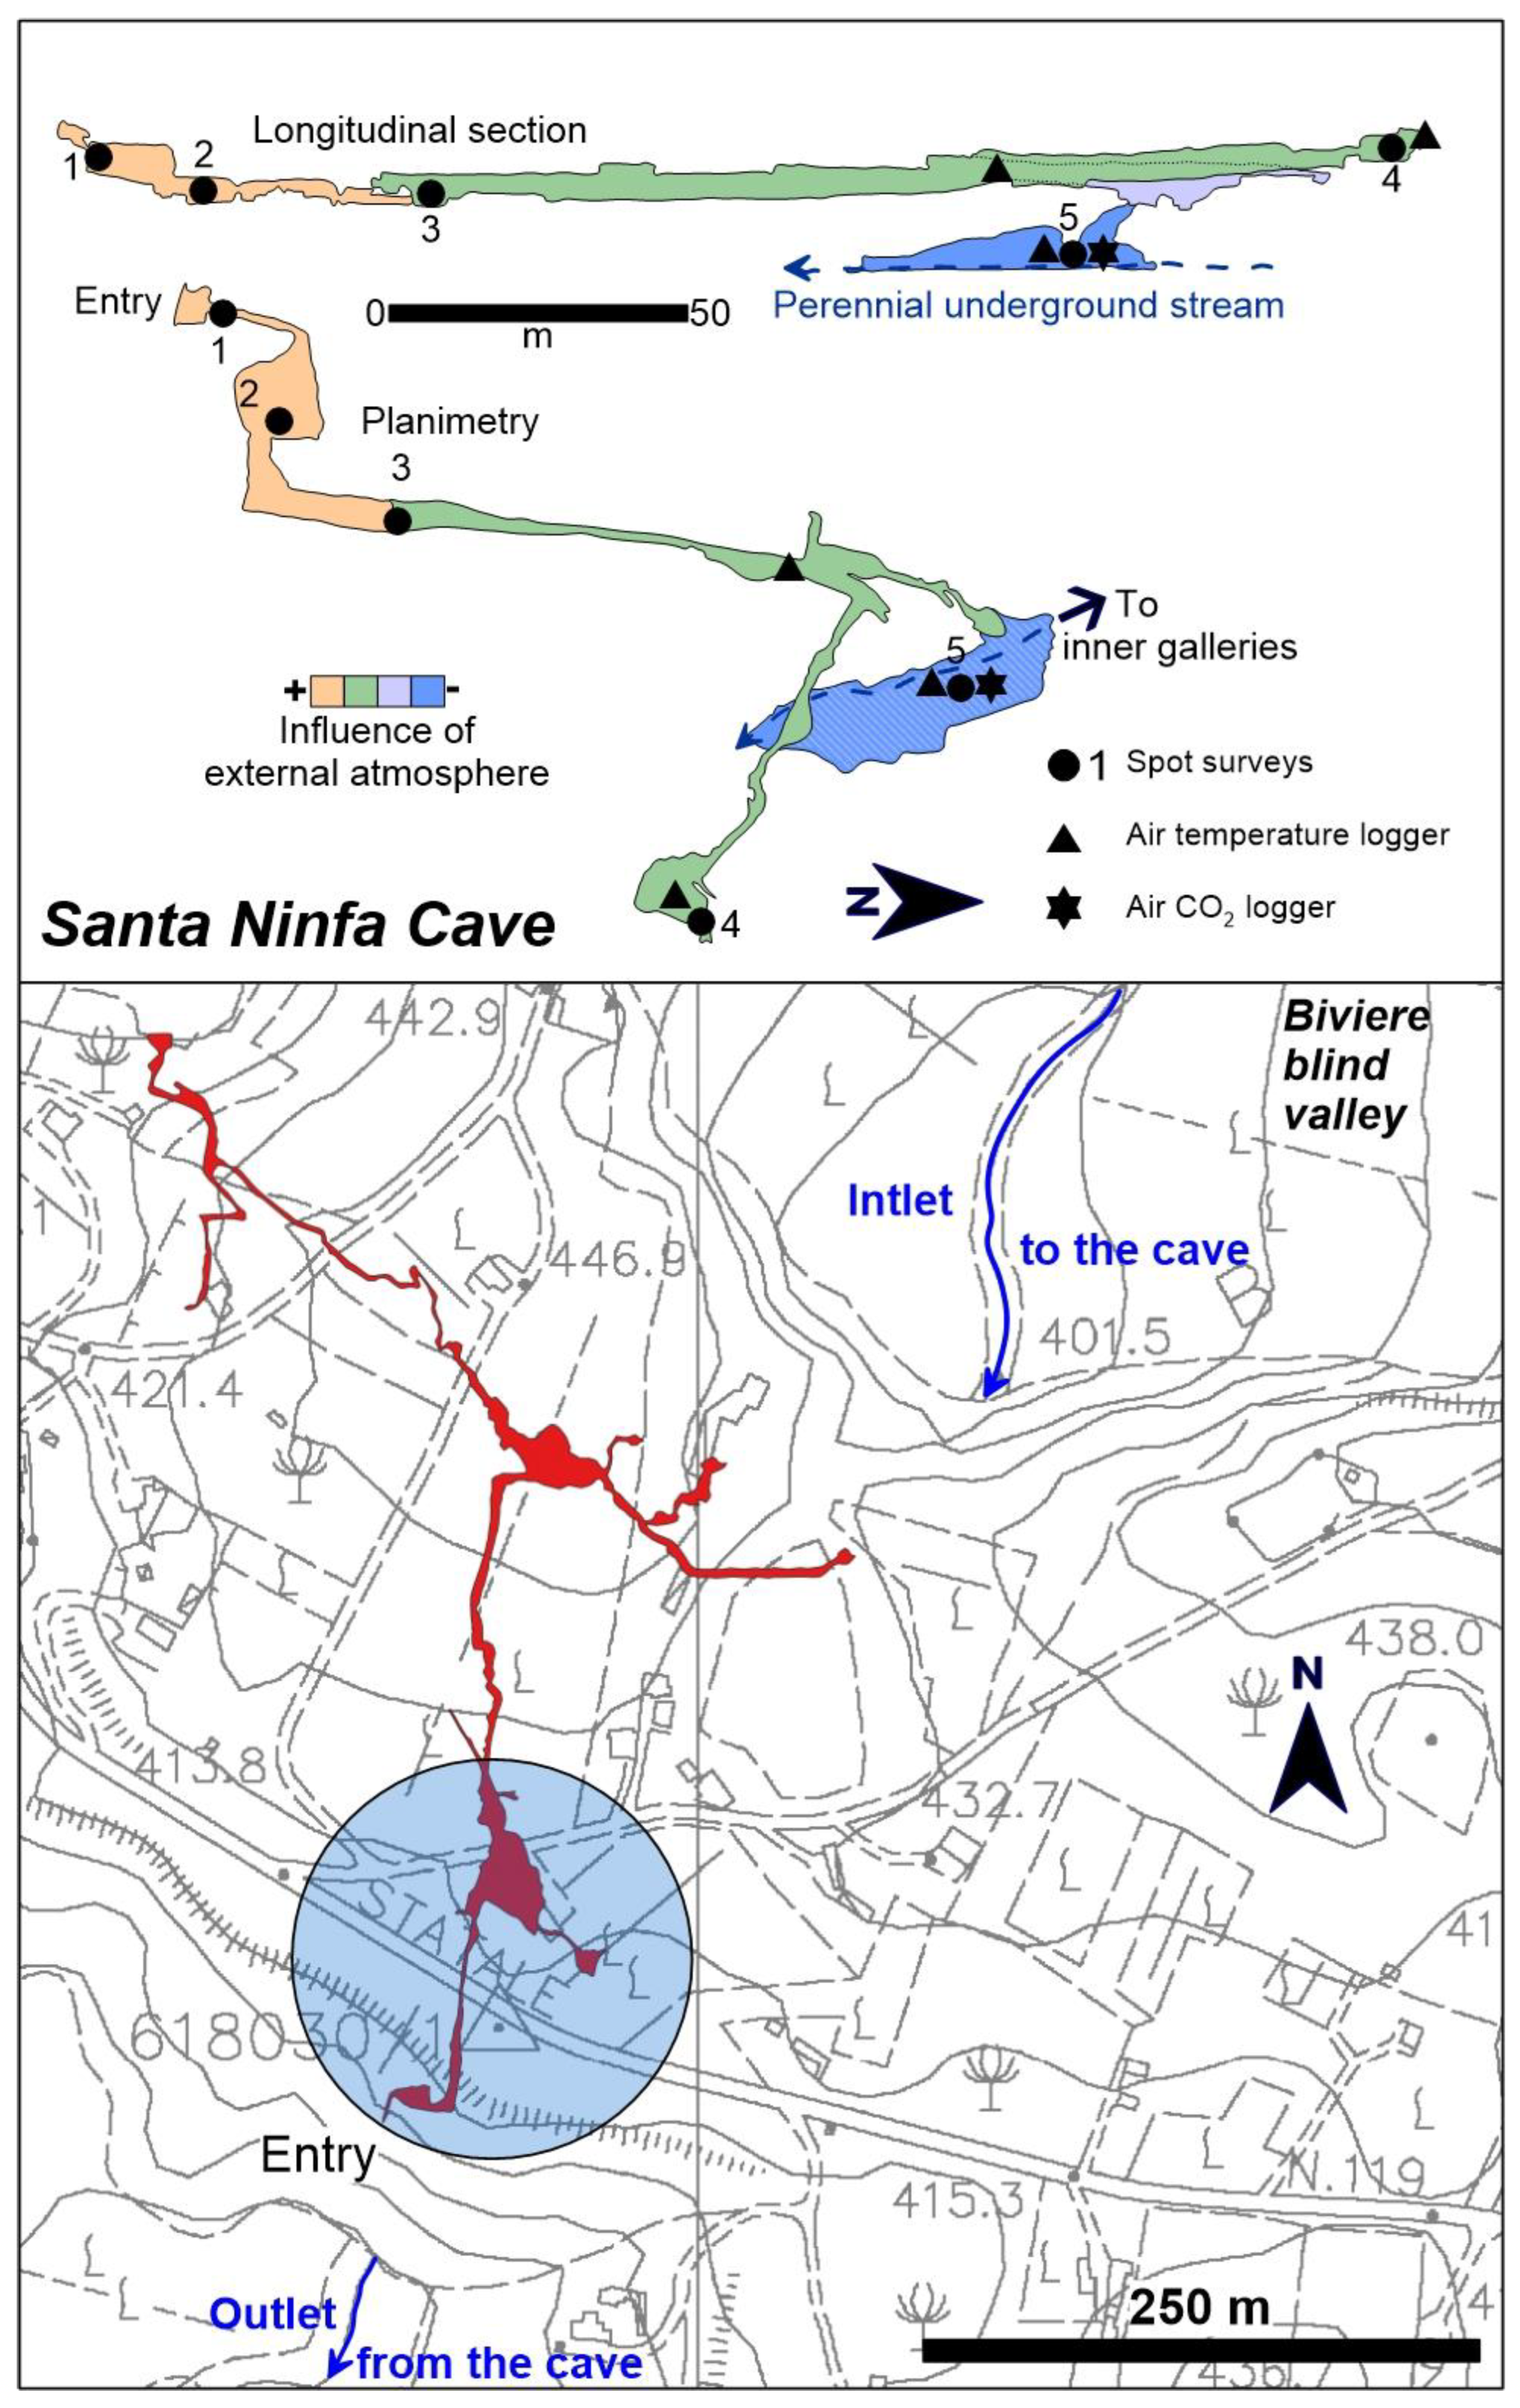
4.2. Santa Ninfa Cave

An experiment analogous to the one of Carburangeli was carried out here on 26 July 2000 (Figure 8).
Carbon dioxide concentrations were measured, at the same heights, prior to the fruition event, twice during it, and in the following 2 days, in five points (Figure 3): four were located in the upper dry gallery, where visitors walked, and the last one (point five) in the lower gallery, at the level of the underground stream. Differently from what was observed at Carburangeli, and as expected, the initial CO2 concentrations, comprised between 1650 ppmv at point one and 2200 ppmv at 140 cm at point three, incremented up to 2450 ppmv in the same point during the touristic fruition event; it is worth of note that the increment continued during the two following days, with a maximum concentration of 3000 ppmv recorded at point four.
Measures repeated at 60 cm height in the same points during the following years (up to 2007) are illustrated in Figure 9.
As at Carburangeli, a clear seasonality is observed, with lower concentrations and no significant differences among the points during the cold season, a progressive increment culminating in a maximum of 7000 ppmv at point five in September, followed by a diminution in October; no measures were taken between November and January. In the warm season, strong concentration differences were observed among the points.
Near-real-time data were collected at Santa Ninfa for a short period, from August to October 2011, temporarily moving the instrument operating at Carburangeli here. Related data are presented in Figure 10.
Looking at the figure, and although the data cover a limited period, the seasonal effects are evidenced by the diminution of the CO2 concentrations after the first days of October, from 4500 to 2500 ppmv on average before and after the 9 October, respectively, when epigeal air temperature started to diminish below that one of the caves. An interesting relationship between rain episodes and CO2 concentration is also observed: short-term increments were observed in coincidence of the rainfalls occurred on 19–20 and 27 September, whereas no increments were observed on 8–10 and 21 October, when epigeal air temperatures suddenly fell down. The role of epigeal meteorological condition in driving underground CO2 degassing will be discussed in the next section.

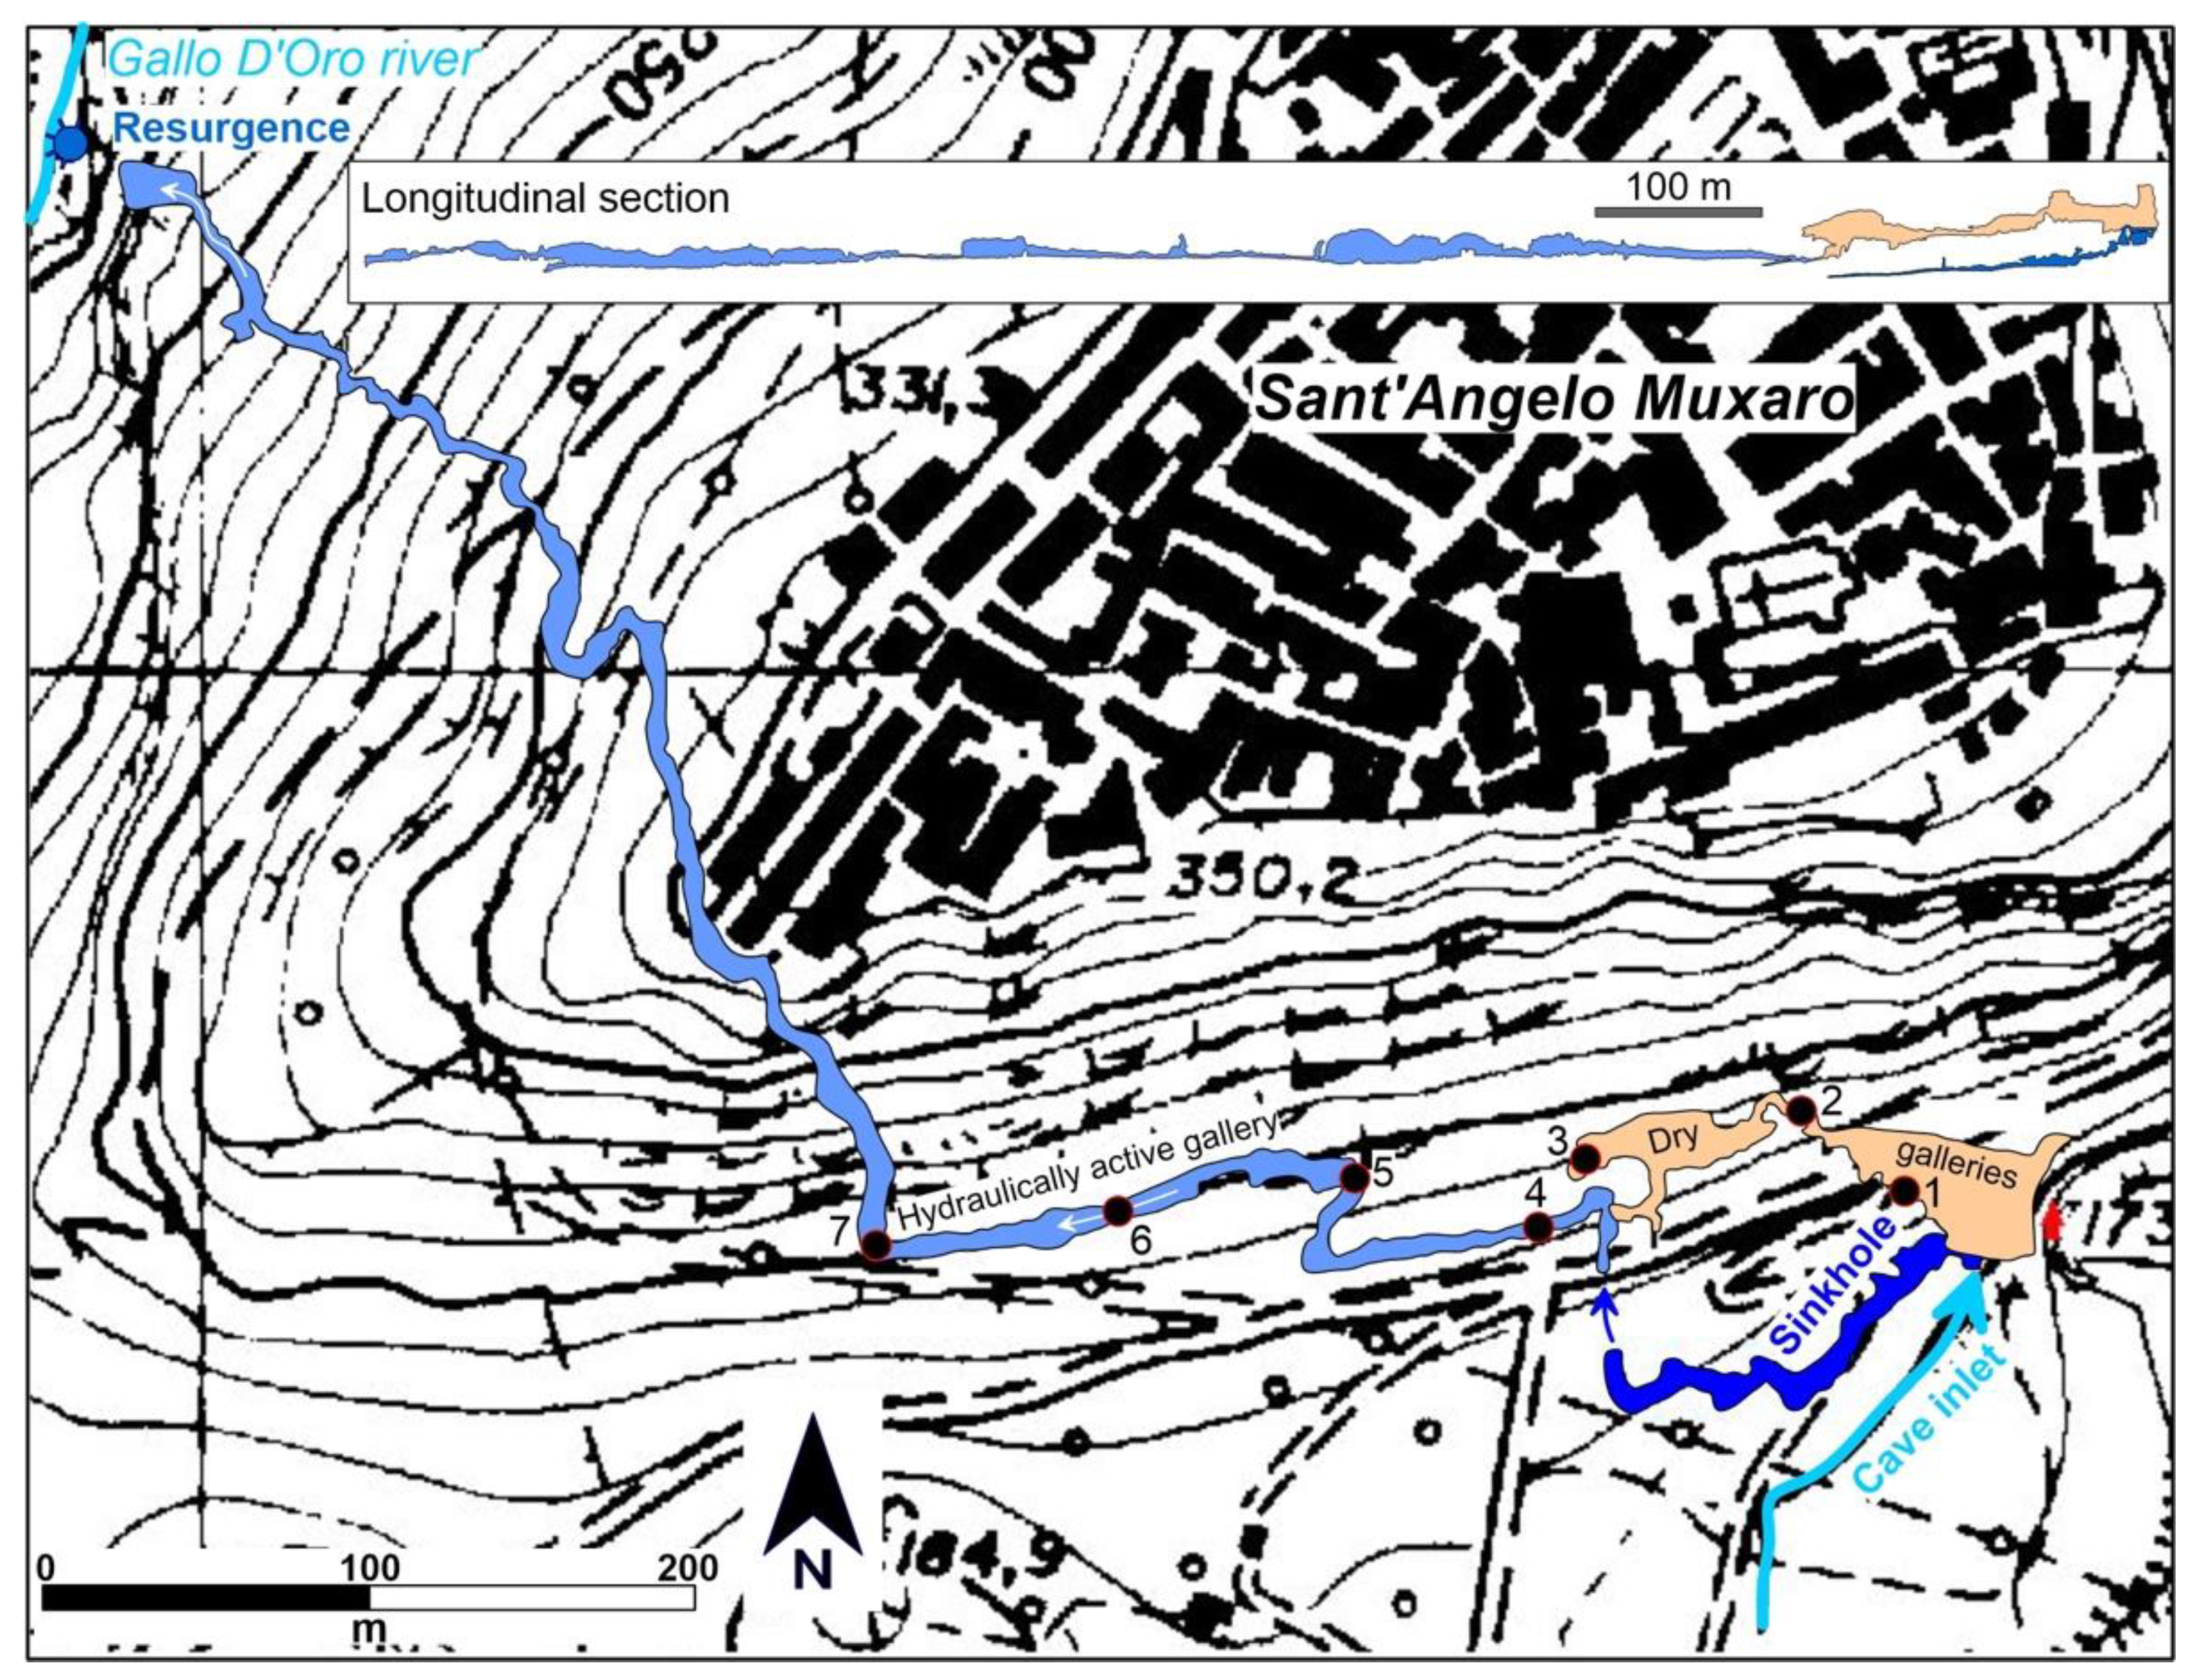
4.3. Sant’Angelo Muxaro

Spot measures of CO2 concentrations were acquired at 60 cm heights at Sant’Angelo cave between 2005 and 2007 (Figure 11), at seven sites located both in the upper dry and lower hydraulically active galleries (Figure 4).
The same seasonal effect observed in the other caves is found here: lower and more homogeneous concentrations in the cold season, higher values with wider differences between points in the warm one. In general, CO2 concentrations at Sant’Angelo are definitely lower than in the other two caves, with minima of 500 ppmv and maxima not exceeding 1300 ppmv.

5. Discussion

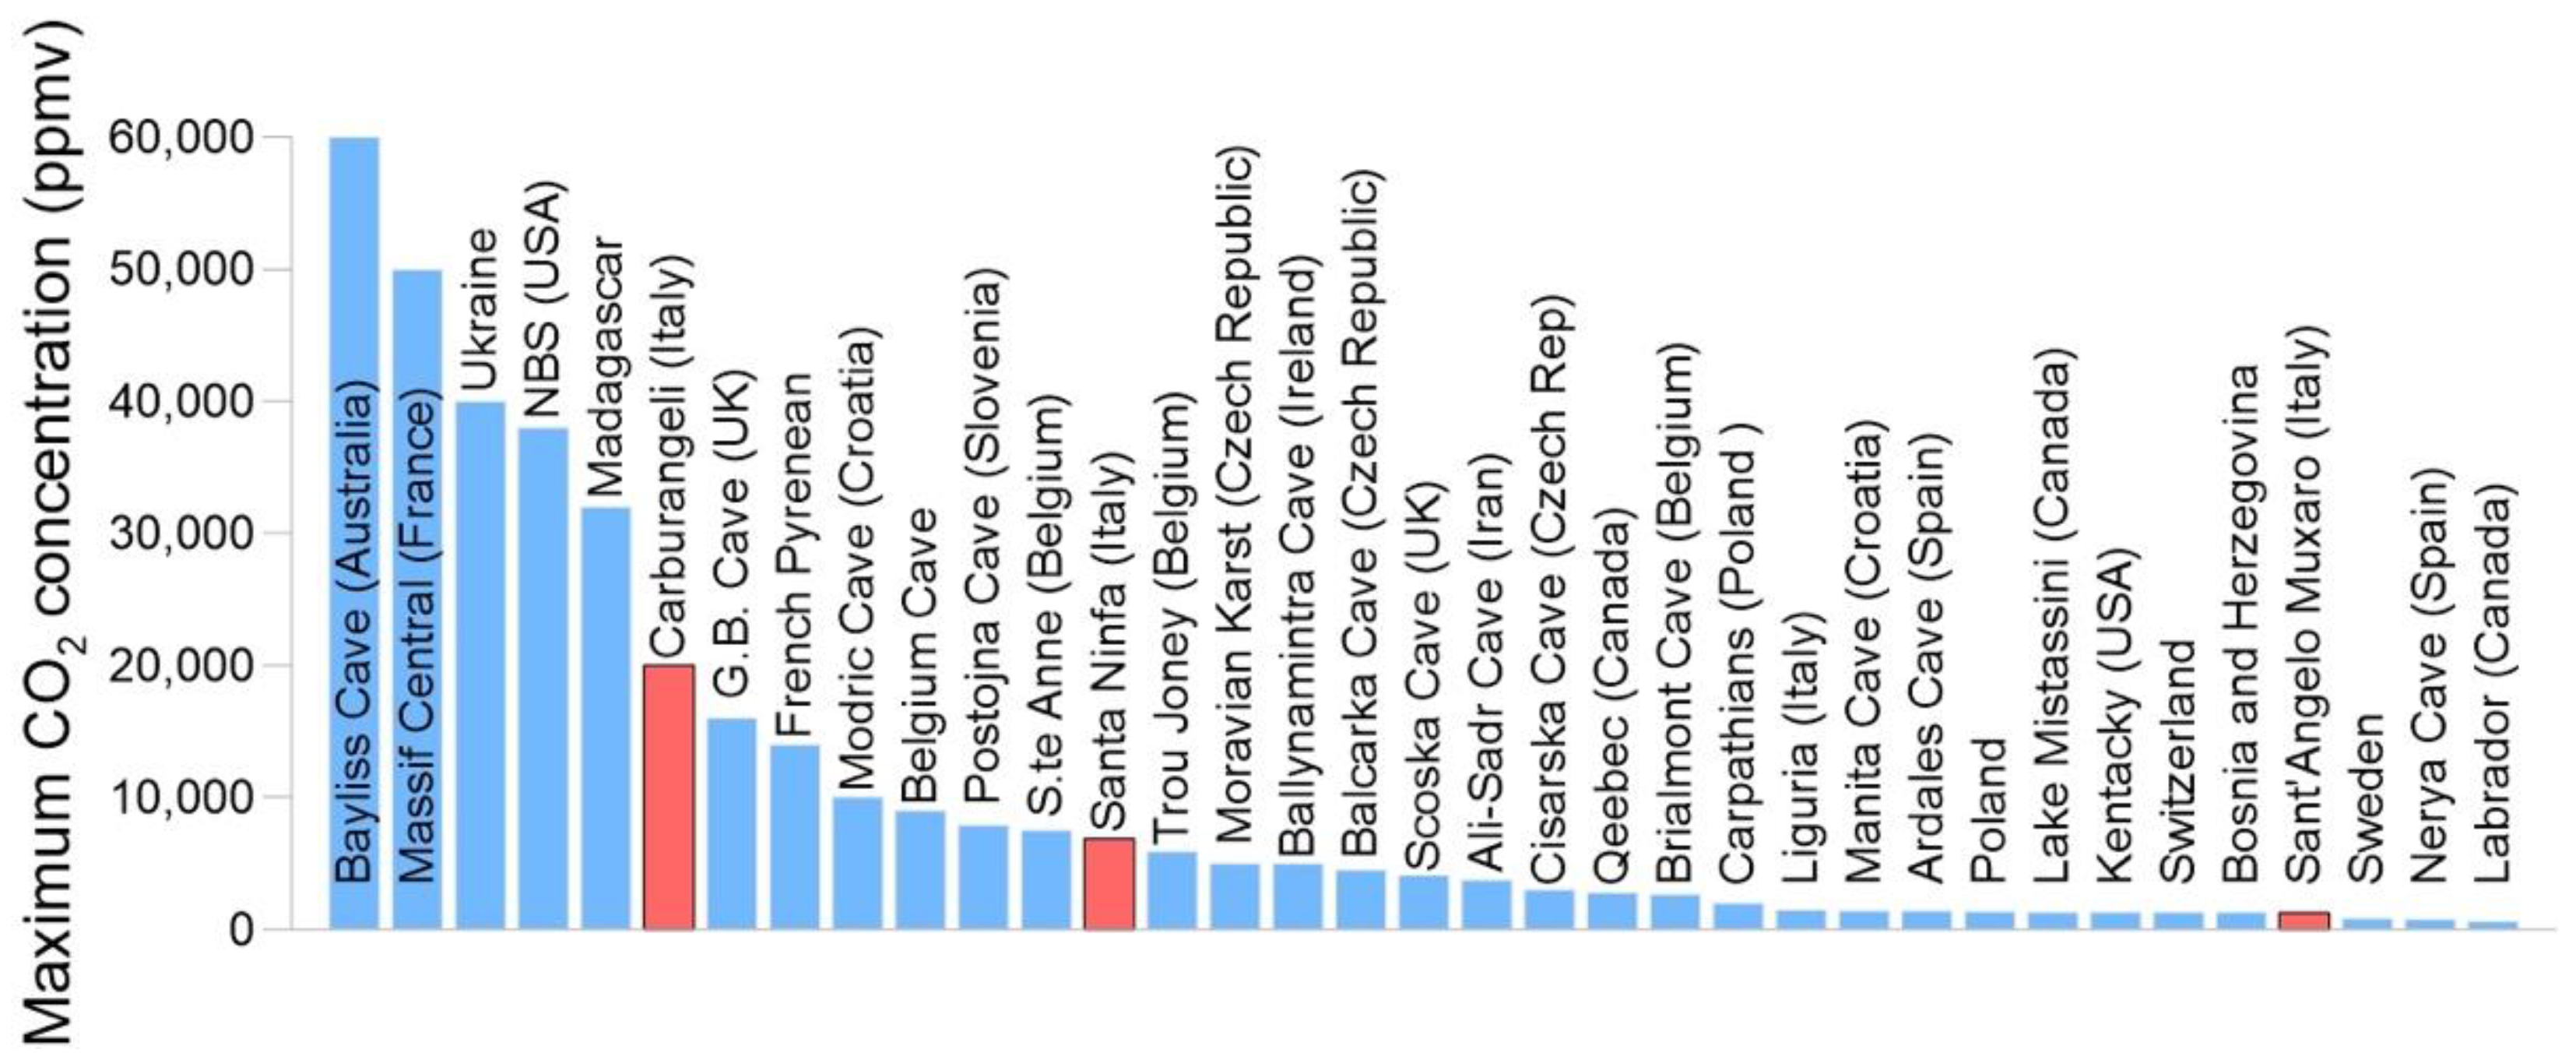
5.1. General Considerations about CO2 Hazard Evaluation in Caves
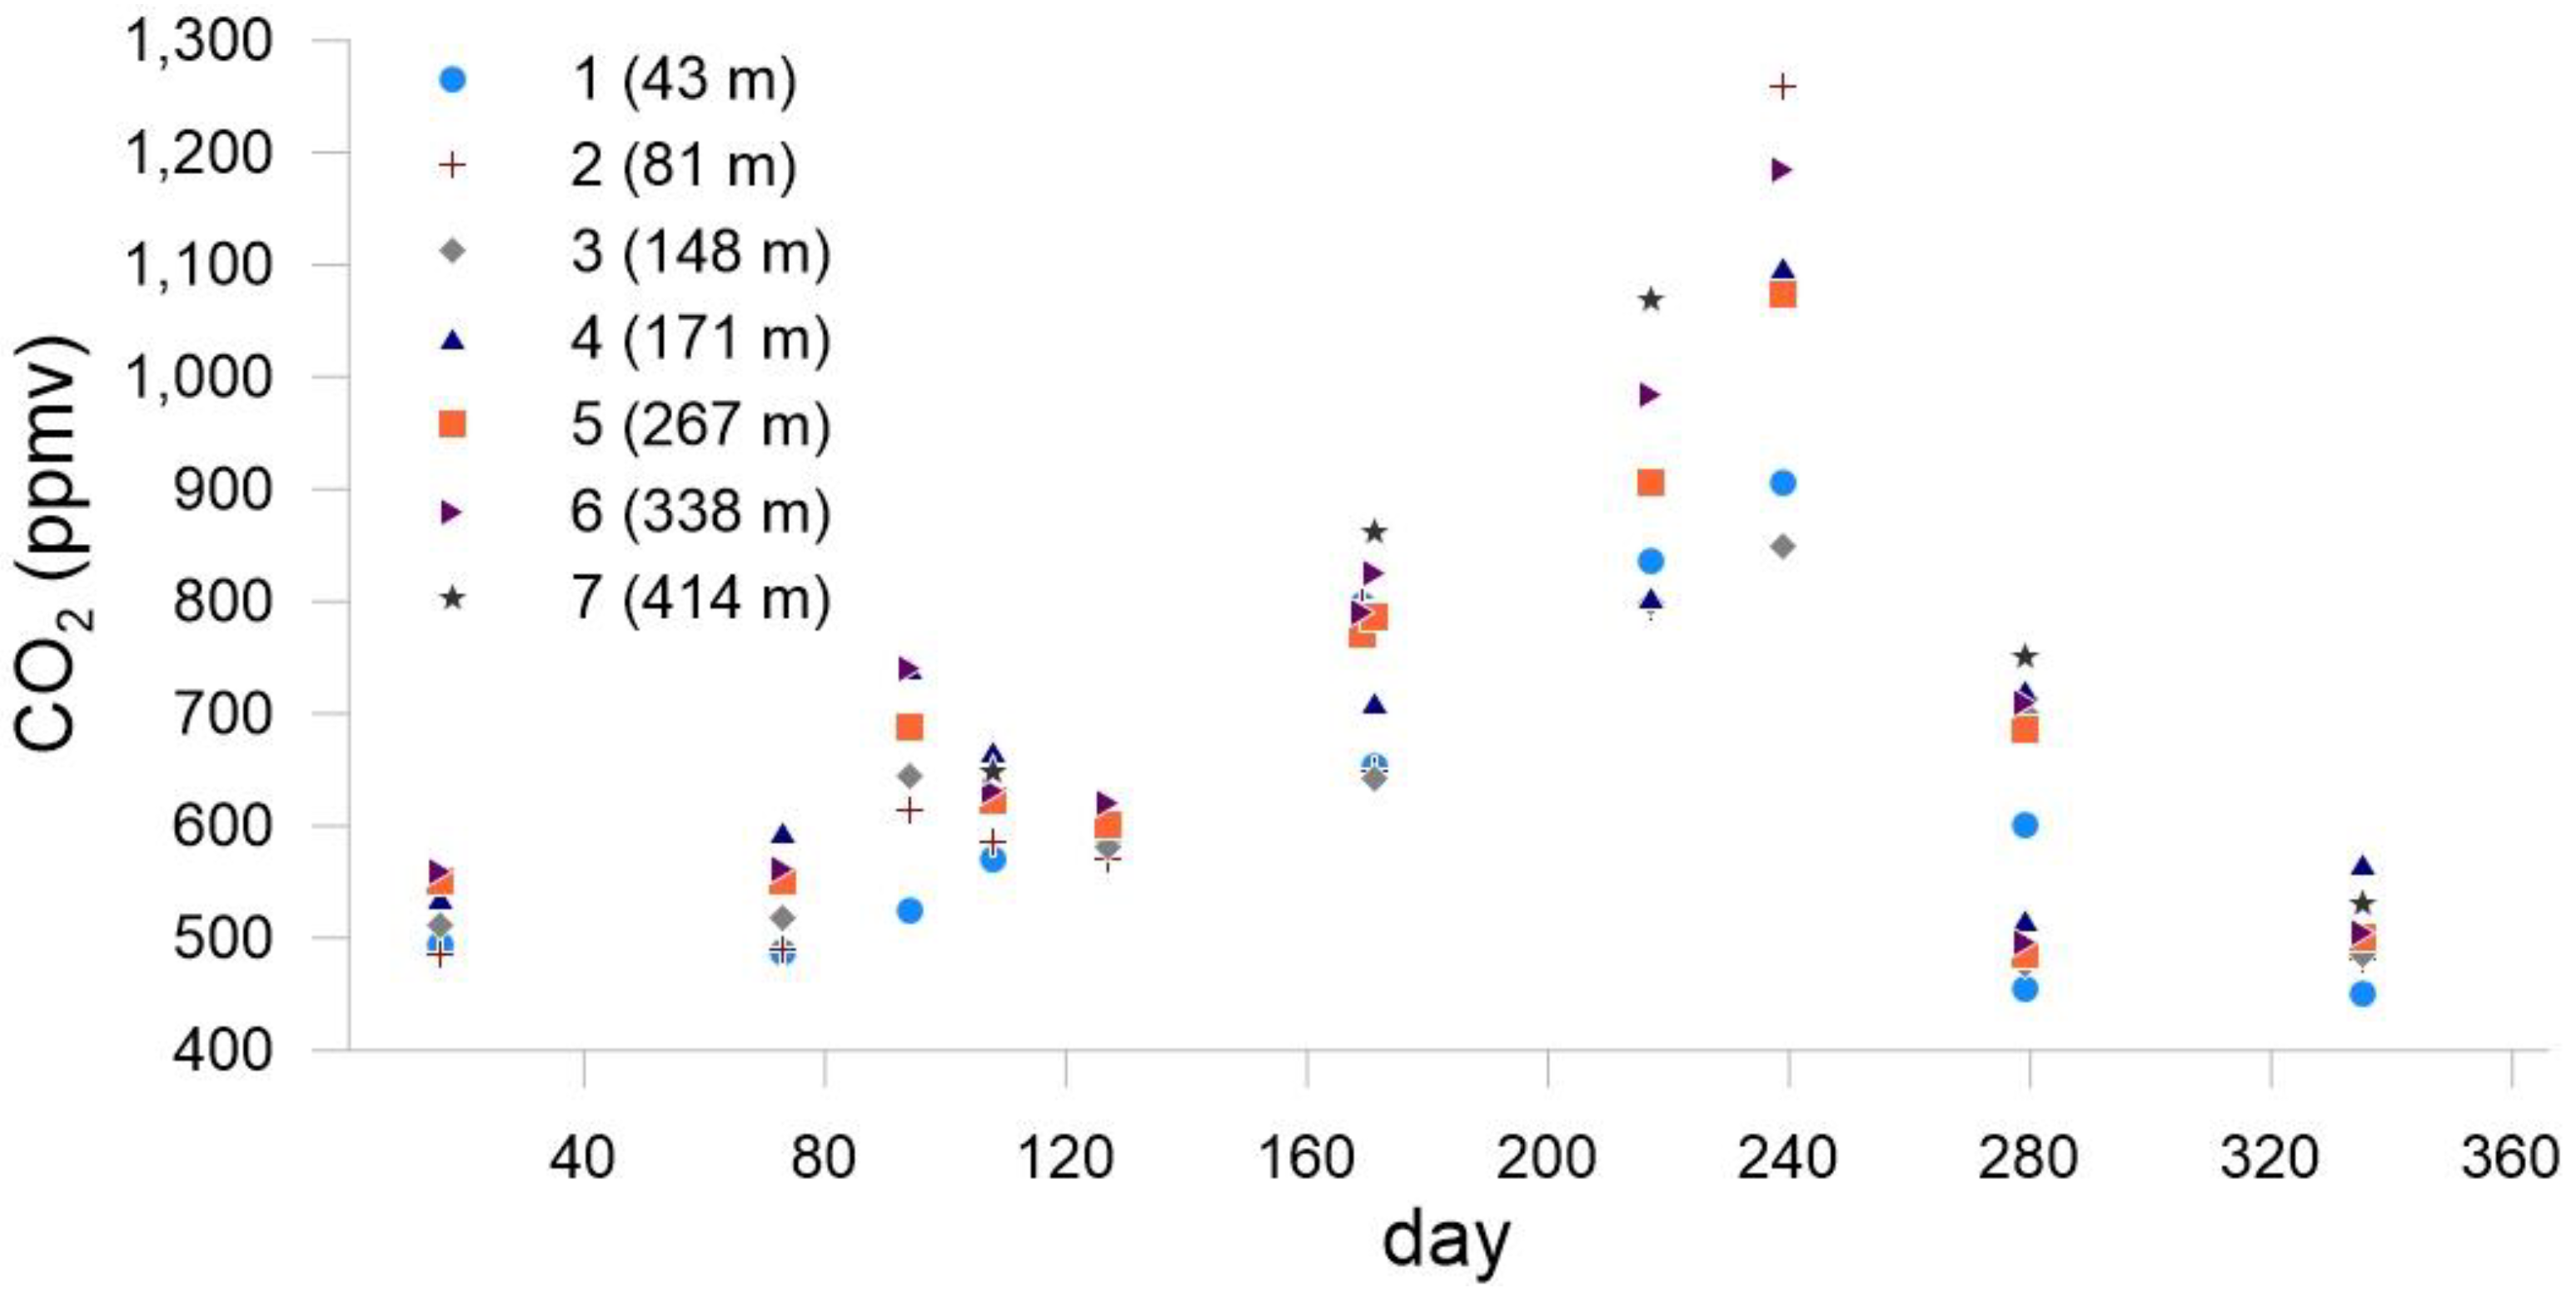
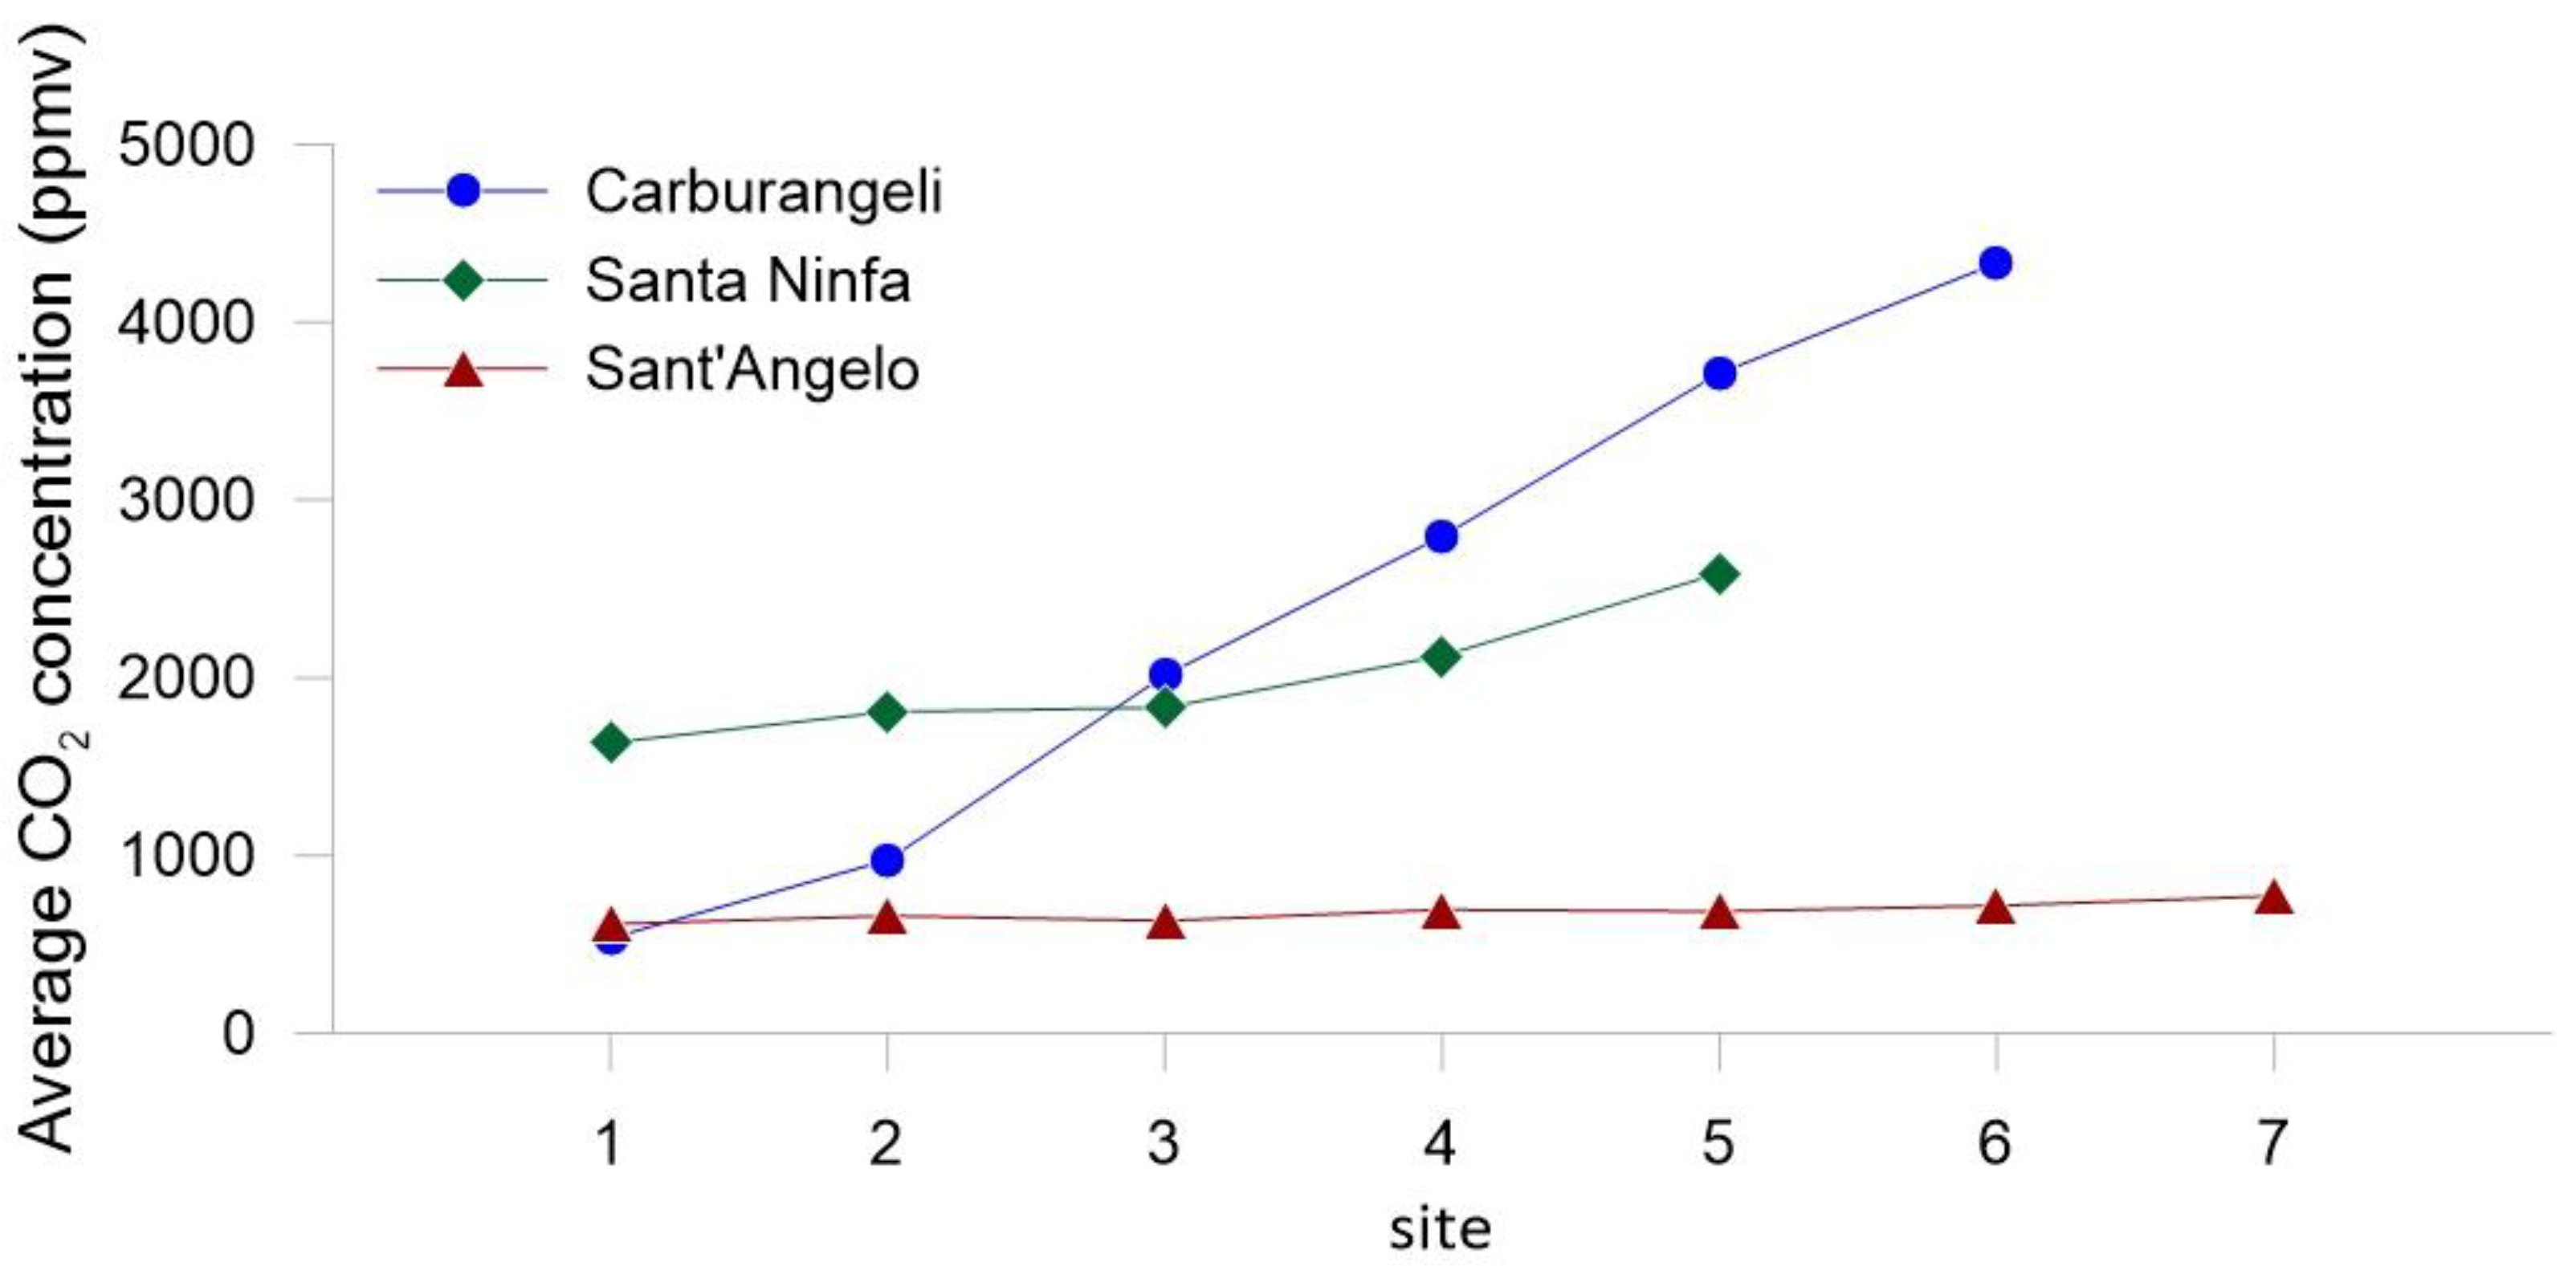
Results arising from spot and near-real-time data acquired in the studied caves, can be interpreted from two opposite focuses: the CO2 gas hazard for workers and visitors frequenting the caves and the impact of anthropogenic CO2 on the protected underground environments.
Since CO2 is not considered toxic, but an asphyxiant gas whose adverse health effects are triggered by its capacity to displace oxygen, no safety limits are indicated by organizations as WHO, EPA, or others. In the specific case of cave atmosphere, although the related scientific literature is very rich [9,20,21,22,23,24,25,26,27,28,29,30,31,32], among the others, neither indications about safety limits nor protocols were generally presented. Surić et al. [6] suggested an alarm threshold fixed at 1%, but this limit is, in our opinion, excessively conservative; it represents the minimum concentration above which, and for exposure times of several hours, some physiological and metabolic effects start to occur, but without causing immediately hazardous health conditions [1,33]. As illustrated in the introduction, higher air CO2 concentrations (>2%) lead to minor physiological symptoms for exposure times of several hours, while for concentrations >3%, shorter exposure times (1 h) lead to more serious adverse health effects [1].
Based on the above considerations, we propose a “3A” (Attention, Alert, and Alarm) scale, on which some base risk-mitigation actions could be adopted, following the criteria illustrated in Table 2.
Fixed at 3% the alarm threshold, instruments used for measuring air CO2 concentrations, aimed to evaluate the CO2 hazard in caves, should have the same value at least as a full scale. Since the higher is a full scale the lower the resolution, such a kind of devices (full scale of the order of percents) are not a good solution for studies aimed to investigate nonanthropogenic factors controlling underground CO2 accumulation, which need more sensible devices. As a matter of fact, most of the instruments used in previous research have lower full scales, typically 1% or lower [6,15,22,24,26,29,30], and in some cases their upper detection limit was reached [6,15], including surveys presented in this work. The reason is that the experimental design followed by these applications has been mainly focused to investigate the parameters controlling underground CO2 degassing, namely thermal regimes, air circulation, rainfall and dripping rates, human fruition, whereas the evaluation of gas hazard has been considered as a secondary, side goal.

5.2. Spot Data

Figure 12 reports the maximum air CO2 concentrations measured inside Carburangeli, Santa Ninfa and Sant’Angelo caves (red bars), compared to those reported in the considered references (blue bars) [20,21,22,23,24,25,26,27,28,29,30,31,32].
Carburangeli (maximum CO2 > 2%) is included within the caves showing the highest concentrations and Santa Ninfa is within the medium-high ones, while Sant’Angelo falls in the group with the lowest observed carbon dioxide accumulations. According to diverse authors [6,21,24], the main CO2 sources in caves are (i) diffusion through fractures and other geological discontinuities of CO2 produced by soil respiration and organic matter decay, this last also occurring directly in the cave atmosphere (i.e., guano deposit decomposition); (ii) degassing from groundwater; (iii) deep contributions from volcanic, hydrothermal, and tectonic activities; and (iv) anthropogenic CO2 from visitors’ breathing. On the other side, main CO2 sinks are (i) cave ventilation, through exchanges with the outside atmosphere and (ii) uptake by under-saturated groundwater circulating through caves.
The differences observed among the three studied caves are generally coherent with the above intake/uptake processes, although some short-term variations suggest that more complex interactions occur, inverting the role between sources and sinks. Average (from data presented in Figure 6, Figure 9, and Figure 11) air CO2 concentrations measured in all the sites are illustrated in Figure 13 (see Figure 2, Figure 3 and Figure 4 for point location).
Coherently with similar observations in other caves [6,29], the distance from the entrance, namely the exchange section with the outside atmosphere, controls CO2 accumulations: the farer is the point, the higher the concentration. It is worth of note that the concept of “distance” is intended in a 3D space: since CO2 is the heaviest atmospheric component, it moves also through density flows, from higher to lower elevations. As in the Santa Ninfa cave, the more distal point is not site four (highest planar distance from the entrance), but site five (second for planar distance, but first for elevation change). Please note that the maximum concentration gradient is observed at Carburangeli cave, which exhibits the lowest elevation gradient (longitudinal sections in Figure 2, Figure 3 and Figure 4); this anomalous behavior will be discussed later, while commenting short term variations.
The average air CO2 concentration rank, Carburangeli > Santa Ninfa > Sant’Angelo, is well-explained, invoking the CO2-controlling factors previously described. Carburangeli cave is located in a limestone karst system, has small internal volumes and a thin (from few to 20 m thick) bedrock coverage (Figure 2), densely fractured and giving rise to an impressive stalactite (dripwater inlets) density on the cave roof (Figure 14a), fostering a rapid and massive intake of CO2 from soil and groundwater (7.75 mM L−1 of HCO3 in dripwater, on average [15]).
The Santa Ninfa cave was generated by groundwater circulation in an evaporitic karst system, characterized by smaller amounts of dissolved carbon species (4.5 mM L−1 of HCO3 in dripwater, on average [34]), bedrock coverage from few meters (highest sectors of the upper galleries) to some tens of meters (lower galleries) (Figure 3), and a fracture network less developed than at Carburangeli; inlets of CO2 rich percolating waters, able to form speleothems, are sporadically present (Figure 14b), as well as direct gaseous exchanges with the overlaying biologically productive soil are active in sectors of the upper galleries closer to the surface.
Sant’Angelo cave is, as the previous one, a gypsum karst system, with a similar groundwater chemistry (4.7 mM L−1 of HCO3 in the stream entering the cave [35]), but developing under a massive bedrock coverage, thicker than at Santa Ninfa (from tens of meters up to 200 m, Figure 4), whose continuity is interrupted by a network of few, wide fractures. Under these conditions, CO2 intakes (both from groundwater circulation and direct exchange with soil) are limited, as highlighted by the total absence of any kind of speleothem inside the cave (Figure 14c). The low air CO2 contents are responsible for their small seasonal variations (Figure 9), higher during the warm season (maxima up to 1300 ppmv) than in the cold one (minimum at 490 pmmv), associated to lower differences among the points. This is a typical behavior for cave atmospheres, characterized by more efficient exchanges with the outside when the inner temperature is higher than the outer one [22,23,26]. Anyway, even the higher CO2 concentration values are compatible with long (hours) staying times, not posing any threat for human health.
Seasonal variations of air CO2 at Santa Ninfa (Figure 9) are quite similar to those of Sant’Angelo. Lower values (minima at 500 ppmv), and no significant differences among points at progressive distances from the entrance, are recorded during the cold season. Higher concentrations (up to 7000 ppmv), and major differences among points, are shown during the warm months, when ventilation is reduced due to the positive air temperature differential between the cave and the outside. Although CO2 concentrations are much higher than at Sant’Angelo, they remain below the attention limit (10,000 ppmv), not creating gas hazard conditions for people frequenting the cave.

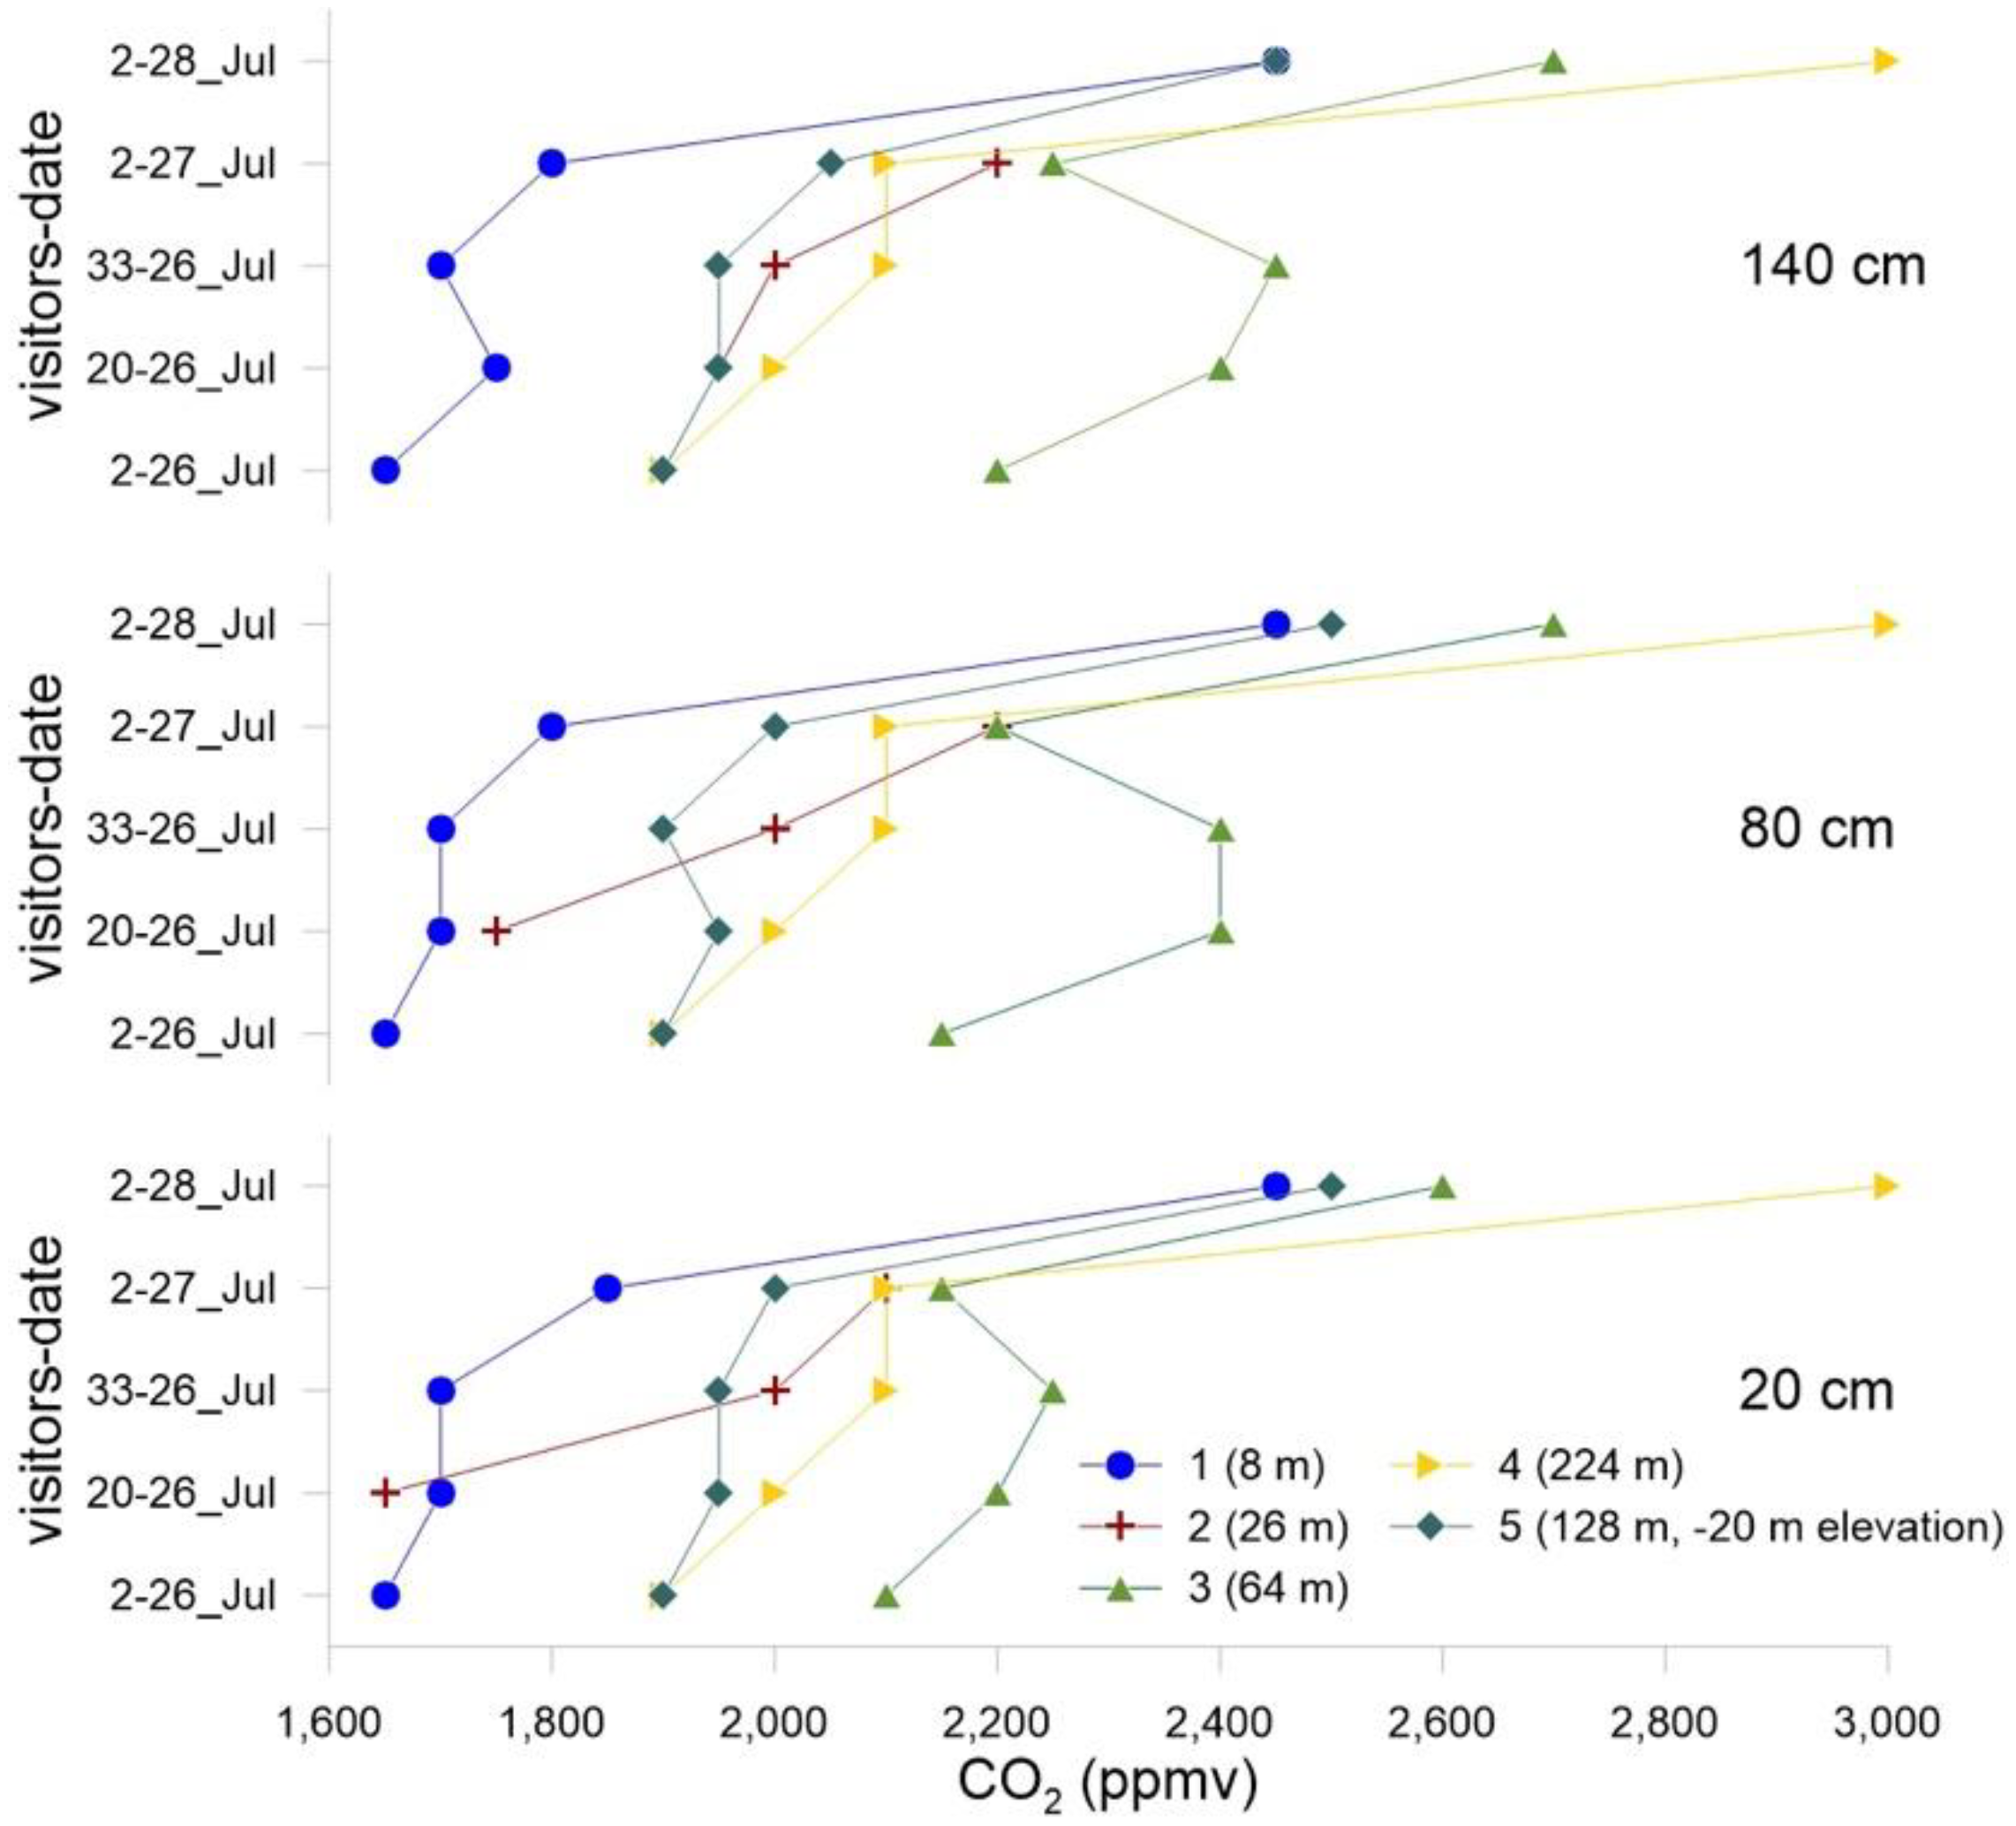
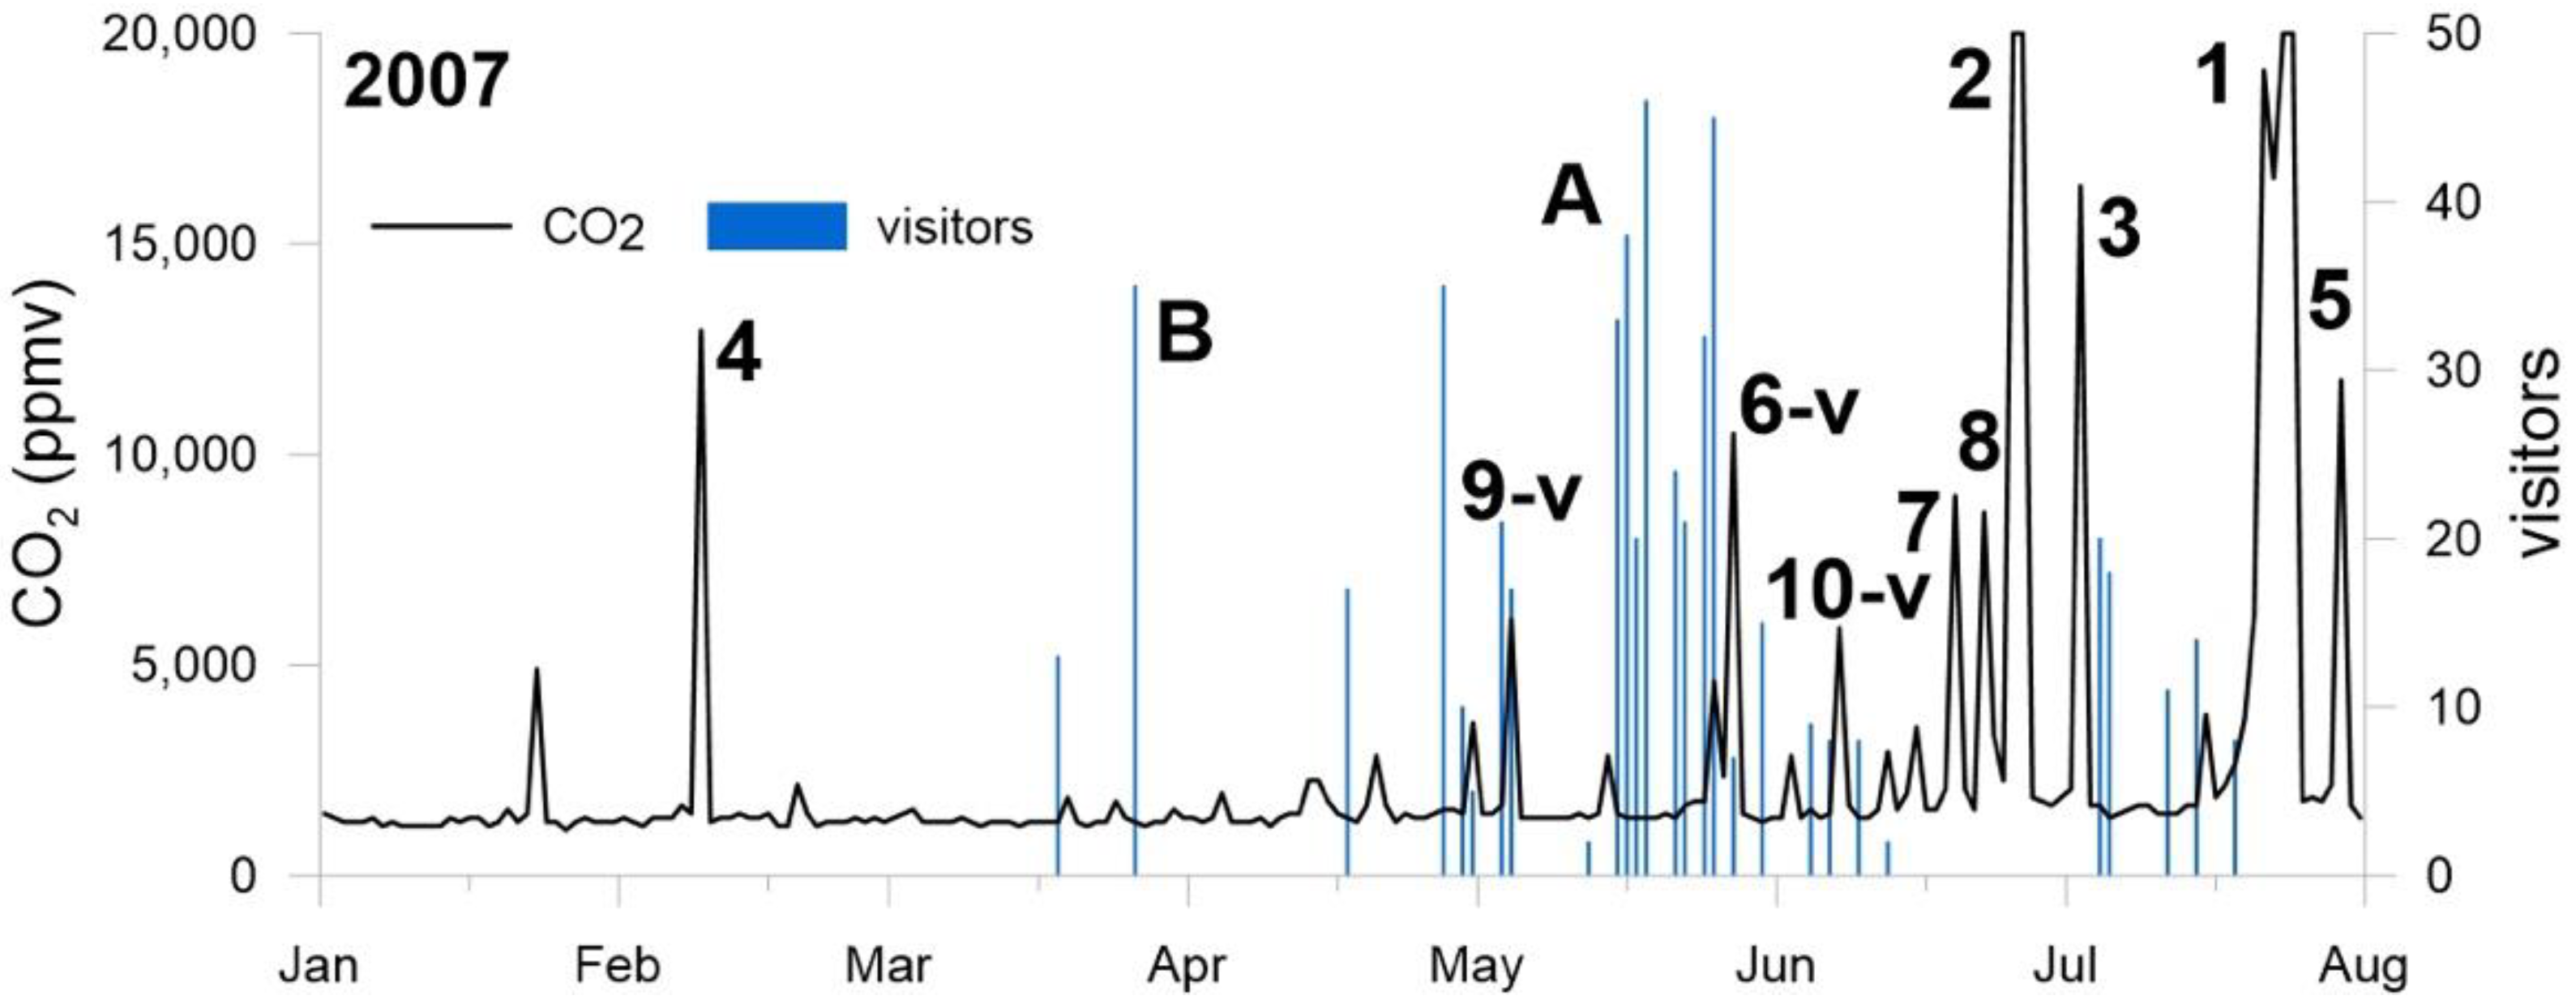
5.3. Near-Real-Time Data and CO2 Impact by/to Visitors

The discussion will be limited to the other two caves, because neither near-real-time nor fruition-experiment data are available for Sant’Angelo.
While the air CO2 near-real-time acquisition system was working at Santa Ninfa cave, eight fruition events, by groups composed of a maximum of twelve persons, were carried out; related data are presented in Figure 15.
Five events (1, 4, 5, 6, and 8, green circles) did not produce any variations in CO2 concentration, CO2 decreased shortly after two of them (2, 3, blue circles) and, in a single case (7, orange circle), a modest increment was recorded. On the contrary, the 5 main short-term increments of air CO2 occurred without any time correlation with the presence of visitors (red circles); anyway, the smallest of these showed an amplitude twice as large as the only increase attributable to a fruition event. A doubt could be expressed for event A, when after the presence of a group of visitors the main CO2 increment was recorded, although equally numerous groups visiting the cave in the same season had not produced any variation. Really, as shown in Figure 10, increment A followed a rainfall event (19 September), the second one after the end of the dry season. The most plausible explanation is related to the surface runoff triggered by the rain that, catch by the sink hole feeding the underground stream (Figure 3), incremented its flow rate. The major solid transport capacity caused erosion and transport of underground clayey deposits, rich in organic matter, whose degradation had produced the additional CO2 released to the cave atmosphere.
This interpretation highlights that discharging on the ground substances, able to produce CO2 through their degradation, could represent a threat for the underground environment; a specific example of such a case is the illegal discharge of the pomace deriving from the production of extra virgin olive oil. A last consideration is that the choice by the nature reserve managers, of limiting to small groups the fruition events of the cave, adopted following the experiment previously described in Figure 8, works well: none of the presence of visitors, even if occurred during the warm season, when cave ventilation is reduced, caused any air CO2 increment.
Much more complicated is the interpretation of the analogous data from Carburangeli cave. The first unexpected results were from the 2000 experiment (Figure 5), during which more than 40 visitors traversed the cave until point three (Figure 2), causing not a CO2 increment, but its huge diminution from initial values higher than 9000 ppmv to final concentrations lower than 1000 ppmv. This is even more unexpected if considering the small volume of the cave atmosphere in the section involved in the experiment. The estimation of the cave volume between points two and three (Figure 2) is equal to 250 m3. Considering the presence of 42 visitors for an individual time of 10 min each, breathing 20 L m−1 of air [36], with a CO2 concentration of 3.8% in the exhaled air [37], we should have an additional CO2 inlet of 0.32 m3, which referred to the volume of 250 m3 should produce a net increment of 13 ppmv. Since this value is within the instrumental error (see Methods), we should had not observe any variation after the fruition event, but certainly not a dramatic diminution of air CO2, as occurred.
The longitudinal section shown in Figure 2 indicates that there is not any significant variation of the roof elevation, from the entrance to the inner point of the cave, but it continuously moves up and down the height of the entrance. This implies that the accumulated CO2 cannot move through density flows along the cave pavement, but ventilation is ensured by diffusion processes driven by thermal or pressure differentials between the interior of the cave and the outside. In our interpretation, such a condition can trigger a kind of “supercritical” static atmospheric condition, which can be disrupted by simple air stirring and piston effects, caused by the passage of visitors. Following this interpretation, the presence of visitors, contrary to what observed in other caves, but limited to this specific section of the cave, could act as an anthropogenic sink and not a source of CO2.
The near-real-time data presented in Figure 7 are reported in the following Figure 16 for the period January–August 2007 and compared to the number of visitors.
The hypothesis of an instable supercritical stativity of the Carburangeli atmosphere seems corroborated by the huge and sudden air CO2 increases recorded in the examined period. The first five higher increases, and seven out of the ten main ones, occurred not in time relation with the presence of visitors; one of these, the fourth in decreasing order of magnitude, was recorded on February, under maximum cave ventilation conditions. On the contrary, the main fruition event (A, more than 200 visitors in few days) and another massive (40 visitors) event on March (B), did not cause any variation. Only in three cases (6, 9 and 10) there was a time correlation between the presence of visitors and carbon dioxide increments. It must be noted that the quasi totality of visitors stopped at point two, because for safety reasons this is the part of the cave open to ecotourism; under these conditions, the additional anthropogenic CO2 could arrive to the detector (located at point three) by diffusion or if the air flow were directed to the interior.

6. Conclusions

The retrospective interpretation of meteorological and air CO2 concentration data, acquired at Carburangeli, Santa Ninfa, and Sant’Angelo caves from 2000 to 2011, and the comparison with other bibliographic information, allowed us to extract some considerations of general interest.
A protocol for evaluating the CO2 gas hazard in caves was proposed, suggesting concentration thresholds for activating progressive mitigation actions.
Peculiar potential gas hazard conditions, related to the surface discharge of substances able to produce CO2 by organic matter degradation, have been individuated.
The possibility that the presence of visitors could unexpectedly act as CO2 sink and not as a source, under particular meteorological and morphological conditions, has been suggested.
Finally, the efficiency of the monitoring protocols of the studied caves, protected as nature reserves, has been tested, verifying that the management of speleological eco-tourism has been implemented, ensuring the correct protection of these environments.

Author Contributions

Conceptualization, M.C. and P.M.; methodology, M.C. and P.M.; formal analysis, M.C. and P.M.; investigation, all authors; data curation, M.C. and P.M.; writing—original draft preparation, M.C., C.D.M. and P.M.; writing—review and editing, all authors; supervision, P.M.; project administration, G.C., R.D.P. and M.I.; funding acquisition, G.C., R.D.P. and M.I. All authors have read and agreed to the published version of the manuscript.

Funding

This research was funded by Regione Siciliana, Assessorato del Territorio e dell’Ambiente.

Informed Consent Statement

Not applicable.

Data Availability Statement

The data presented in this study, and not contained in the main article, are available on request from the corresponding author. The data are not publicly available due to the traceability on their use from third parties, as requested by the managing authorities of the nature reserves involved in the study.

Acknowledgments

This research has been carried out as a part of the C6 project coordinated by the Italian National Institute for Geophysics and Volcanology (INGV). We wish to thank the personnel and volunteers of Legambiente Sicilia for having helped us during field activity.

Conflicts of Interest

The authors declare no conflict of interest.

References

  1. Environmental Protection Agency. Available online: https://www.epa.gov/sites/default/files/2015-06/documents/co2appendixb.pdf (accessed on 11 September 2022).
  2. Global Monitoring Laboratory. Available online: https://gml.noaa.gov/ccgg/trends/data.html (accessed on 11 September 2022).
  3. EH40/2005. Workplace Exposure Limits. Available online: https://books.hse.gov.uk/ (accessed on 9 September 2022).
  4. L’Anidride Carbonica. Aspetti di Sicurezza. Available online: https://assogastecnici.federchimica.it/docs/default-source/ATTI-CONVEGNI/2016_05_24-seminario-co2/04_safety-de-lorenzi-ppt.pdf?sfvrsn=a15ae528_2 (accessed on 9 September 2022).
  5. Human Health Risk Assessment of CO2: Survivors of Acute High-Level Exposure and Populations Sensitive to Prolonged Low-Level Exposure. Available online: https://citeseerx.ist.psu.edu/viewdoc/download?doi=10.1.1.521.9527&rep=rep1&type=pdf (accessed on 11 September 2022).
  6. Surić, M.; Lončarić, R.; Kulišić, M.; Sršen, L. Spatio-temporal variations of cave-air CO2 concentrations in two Croatian show caves: Natural vs. anthropogenic controls. Geol. Croat. 2021, 74, 273–286. [Google Scholar] [CrossRef]
  7. Viveiros, F.; Ferreira, T.; Silva, C.; Gaspar, J.L. Meteorological factors controlling soil gases and indoor CO2 concentration: A permanent risk in degassing areas. Sci. Total Environ. 2009, 407, 1362–1372. [Google Scholar] [CrossRef] [PubMed]
  8. Wrona, P.; Ro’zan´ski, Z.; Pach, G.; Suponik, T.; Popczyk, M. Closed coal mine shaft as a source of carbon dioxide emissions. Environ. Earth Sci. 2016, 75, 1139. [Google Scholar] [CrossRef] [Green Version]
  9. Prelovšek, M.; Šebela, S.; Turk, J. Carbon dioxide in Postojna Cave (Slovenia): Spatial distribution, seasonal dynamics and evaluation of plausible sources and sinks. Environ. Earth Sci. 2018, 289, 289. [Google Scholar] [CrossRef]
  10. Foul Air in Limestone Caves and Its Effects on Cavers. Available online: https://wasg.org.au/index.php/2015-09-05-08-07-15/2016-06-09-12-53-47/foul-air (accessed on 12 September 2022).
  11. Baker, A.; Genty, D. Environmental pressures on conserving cave speleothems: Effects of changing surface land use and increased cave tourism. J. Environ. Manag. 1998, 53, 165–175. [Google Scholar] [CrossRef]
  12. Casamento, G. Introduzione e ringraziamenti. In Le Riserve Naturali Siciliane Gestite da Legambiente: Un Contributo alla Conoscenza ed alla Tutela; Casamento, G., Ed.; Società Siciliana di Scienze Naturali: Palermo, Italy, 2001; Volume 25, pp. 3–4. [Google Scholar]
  13. Di Maggio, C.; Madonia, G.; Parise, M.; Vattano, M. Karst of Sicily and its conservation. J. Cave Karst Stud. 2012, 74, 157–172. [Google Scholar] [CrossRef]
  14. Madonia, P. Monitoring Climatic Changes and Carbon Cycle in Canyons and Caves: The C6 Project. J. Environ. Sci. Eng. 2011, 5, 281–288. [Google Scholar]
  15. Madonia, P.; Bellanca, A.; Di Pietro, R.; Mirabello, L. The role of near-surface cavities in the carbon dioxide cycle of karst areas: Evidence from the Carburangeli Cave Natural Reserve (Italy). Environ. Earth Sci. 2012, 67, 2423–2439. [Google Scholar] [CrossRef]
  16. Geiger, R. Köppen-Geiger/Klima der Erde; Überarbeitete Neuausgabe von Geiger, R., Ed.; Klett-Perthes: Gotha, Germany, 1961; Wandkarte 1:16 Mill. [Google Scholar]
  17. SIAS. Climatologia della Sicilia; Servizio Informativo Agrometeorologico Siciliano (SIAS), Assessorato Agricoltura e Foreste, Regione Siciliana: Palermo, Italy, 2002; pp. 1–642. [Google Scholar]
  18. Di Maggio, C.; Madonia, G.; Vattano, M.; Agnesi, V.; Monteleone, S. Geomorphological evolution of Western Sicily, Italy. Geol. Carp. 2017, 68, 80–93. [Google Scholar] [CrossRef] [Green Version]
  19. Madonia, P. Considerazioni preliminari sul monitoraggio di temperatura, umidità e concentrazione di CO2 nell’atmosfera ipogea della Grotta di Santa Ninfa. In Le Riserve Naturali Siciliane Gestite da Legambiente: Un Contributo alla Conoscenza ed alla Tutela; Casamento, G., Ed.; Società Siciliana di Scienze Naturali: Palermo, Italy, 2001; Volume 25, pp. 255–269. [Google Scholar]
  20. Ek, C.; Gewelt, M. Carbon dioxide in cave atmospheres. New results in Belgium and comparison with some other Countries. Earth Surf. Process. Landf. 1985, 10, 174–187. [Google Scholar] [CrossRef] [Green Version]
  21. Whitaker, T.; Hones, D.; Baldini, J.U.L.; Baker, A.J. A high-resolution spatial of cave air carbon dioxide concentrations in Scoska Cave (North Yorkshire, UK): Implications for calcite deposition and re-dissolution. Cave Karst Sci. 2009, 36, 3. [Google Scholar]
  22. Linan, C.; Vadillo, I.; Carrasco, F. Carbon dioxide in air within the Narja Cave (Malaga, Andalusia, Spain). Int. J. Speleol. 2008, 37, 99–106. [Google Scholar] [CrossRef]
  23. Cowan, B.D.; Osborne, M.C.; Banner, J.L. Temporal variability of cave-air CO2 in Central Texas. J. Cave Karst Stud. 2013, 75, 38–50. [Google Scholar] [CrossRef]
  24. Faimon, J.; Stelcl, J.; Sas, D. Anthropogenic CO2-flux into cave atmosphre and its environmental impact: A case study in the Cisarska Cave (Moravian Karst, Czech Republic). Sci. Total Environ. 2006, 369, 231–245. [Google Scholar] [CrossRef]
  25. Faimon, J.; Licbinska, M. Carbon dioxide in the soils and adjacent caves of the Moravian Karst. Acta Carsol. 2010, 39, 463–475. [Google Scholar] [CrossRef] [Green Version]
  26. Faimon, J.; Troppova, D.; Baldik, V.; Novotny, R. Air circulation and its impact on microclimatic variables in the Cisarska Cave (Moravian Karst, Czech Republic). Int. J. Climatol. 2012, 32, 599–623. [Google Scholar] [CrossRef]
  27. Maleki, A.; Soltani, P.K. Touristis and their role in microclimatic changes inside the caves case study: Ali Sadr Cave (Hamedan, Iran). J. Biodiv. Environ. Sci. 2015, 6, 535–541. [Google Scholar]
  28. Faiman, J.; Licbinska, M.; Zajicek, P. Relationship between carbon dioxide in Balcarka Cave and adjacent soils in the Moravian Karst region of the Czech Republic. Int. J. Speleol. 2012, 41, 17–28. [Google Scholar] [CrossRef]
  29. Milanolo, S.; Gabrovsek, F. Analysis of Carbon Dioxide Variations in the Atmosphere of Srednja Bijambarska Cave, Bosnia and Herzegovina. Bound. Layer Meteorol. 2009, 131, 479–493. [Google Scholar] [CrossRef]
  30. Fernandez-Cortes, A.; Cuezva, S.; Sanchez-Moral, S.; Canaveras, J.C.; Porca, E.; Jurado, V.; Martin-Sanchez, P.M.; Saiz-Jimenez, C. Detection of human-induced environmental disturbances in a show cave. Environ. Sci. Pollut. Res. 2011, 18, 1037–1045. [Google Scholar] [CrossRef] [Green Version]
  31. Howarth, F.G.; Stone, F.D. Elevated Carbon Dioxide Levels in Bayliss Cave, Australia: Implications for the Evolution of Obligate Cave Species. Pac. Sci. 1990, 44, 207–218. [Google Scholar]
  32. Baldini, J.U.L.; Baldini, L.M.; McDerott, F.; Clipson, N. Carbon Dioxide Sources, Sinks, And Spatial Variability in Shallow Temperate Zone Caves: Evidence from Ballynamintra Cave, Ireland. J. Cave Karst Stud. 2006, 68, 4–11. [Google Scholar]
  33. Azuma, K.; Kagi, N.; Yanagi, U.; Osawa, H. Effects of low-level inhalation exposure to carbon dioxide in indoor environments: A short review on human health and psychomotor performance. Environ. Int. 2019, 121, 51–56. [Google Scholar] [CrossRef] [PubMed]
  34. Madonia, P.; Madonia, G. The Santa Ninfa Cave (Belice Valley): Hydrogeochemical features and relationships with neotectonics. Ann. Geophys. 2020, 63, SE103. [Google Scholar] [CrossRef] [Green Version]
  35. Censi, V.; Zuddas, P.; Sposito, F.; Cangemi, M.; Inguaggiato, C.; Piazzese, D. Boron and lithium behaviour in river waters under semiarid climatic conditions. Chemosphere 2022, 306, 135509. [Google Scholar] [CrossRef]
  36. Tsega, E.G.; Katiyar, K.; Gupta, P. Breathing Patterns of Healthy Human Response to Different Levels of Physical Activity. J. Biomed. Eng. Technol. 2019, 7, 1–4. [Google Scholar] [CrossRef]
  37. What Is Carbon Dioxide. Available online: https://www.co2meter.com/blogs/news/10709101-what-is-carbon-dioxide (accessed on 12 September 2022).
Figure 1. Distribution of karst areas in Sicily [13] and location of the studied caves.
Atmosphere 13 01760 g001
Figure 2. Planimetry and longitudinal section of the Carburangeli cave, with location of the points of measure (spot and quasi-real time); in the inset, surface projection of the area occupied by the cave.
Atmosphere 13 01760 g002
Figure 3. At the top, planimetry and longitudinal section of the Santa Ninfa cave, with location of the points of measure (spot and quasi-real time); volumes with different degree of connection with the epigeal atmosphere are also indicated. At the bottom, surface projection of the area occupied by the cave (the blue circle indicates the portion of the cave involved in the monitoring program).
Atmosphere 13 01760 g003
Figure 4. Surface projection of the area occupied by the Sant’Angelo cave and its longitudinal section, with location of the points of measure (spot); different colors indicate the hydraulic regime of different volumes of the cave.
Atmosphere 13 01760 g004
Figure 5. Air CO2 concentrations measured inside Carburangeli cave during the 19 June 2000 experiment (modified from [14]). Progressive distances of the points from cave entrance are reported between round brackets (see also Figure 2 for point locations).
Atmosphere 13 01760 g005
Figure 6. Spot air CO2 concentrations data, measured inside Carburangeli cave at 60 cm from the cave floor, in the period 2000–2007; data related to the 2000 experiment refer to measures collected at 80 cm height. Time is expressed as the ordinal of the day of the year of acquisition of each measure. Progressive distances of the points from cave entrance are reported between round brackets (see also Figure 2 for point locations).
Atmosphere 13 01760 g006
Figure 7. Near-real-time data of air temperature (daily average, green line) and CO2 concentrations (grey points, 1 acquisition per day) acquired inside Carburangeli cave between 2006 and 2011; daily average epigeal air temperatures (red line) are reported for comparison. See Discussion for the definition of attention limit line.
Atmosphere 13 01760 g007
Figure 8. Air CO2 concentrations measured inside Santa Ninfa cave during the 26–28 July 2000 experiment. Progressive distances of the points from cave entrance are reported between round brackets (see also Figure 3 for point locations).
Atmosphere 13 01760 g008
Figure 9. Spot air CO2 concentrations data, measured inside Santa Ninfa cave in the period 2000–2007. Time is expressed as the ordinal of the day of the year of acquisition of each measure. Progressive distances of the points from cave entrance are reported between round brackets (see also Figure 3 for point locations).
Atmosphere 13 01760 g009
Figure 10. Near-real-time data of air temperature (hourly, green line) and CO2 concentrations (grey points, 1 acquisition every 6 h) acquired inside Santa Ninfa cave between August and October 2011; daily average epigeal air temperatures (red line) and rainfall amount (vertical blue bars, every 6 h) are reported for comparison.
Atmosphere 13 01760 g010
Figure 11. Spot air CO2 concentrations data, measured inside Sant’Angelo cave in the period 2005–2007. Time is expressed as the ordinal of the day of the year of acquisition of each measure. Progressive distances of the points from cave entrance are reported between round brackets (see also Figure 4 for point locations).
Atmosphere 13 01760 g011
Figure 12. Maximum measured air CO2 concentrations in the studied caves (red bars) compared to those from literature data (blue bars) [20,21,22,23,24,25,26,27,28,29,30,31,32].
Atmosphere 13 01760 g012
Figure 13. Average values of all air CO2 concentrations measured inside the caves investigated in this study; refer to Figure 2, Figure 3 and Figure 4 for location of points at Carburangeli, Santa Ninfa and Sant-Angelo caves, respectively.
Atmosphere 13 01760 g013
Figure 14. (a) Roof of the Carburangeli cave densely covered by stalactites; (b) The upper gallery of Santa Ninfa cave, showing calcite speleothems; (c) The active gallery of Sant’Angelo cave, flown by the underground stream.
Atmosphere 13 01760 g014
Figure 15. Near-real-time data (6 h) of air CO2 concentration in the atmosphere of the Santa Ninfa cave (black line), compared to the visitor number (blue vertical bars). Green, blue and orange circles identify fruition events after which CO2 did not variate, diminish, or increase, respectively. Red circles indicate CO2 increments occurred independently of the presence of visitors.
Atmosphere 13 01760 g015
Figure 16. Near-real-time data (daily) of air CO2 concentration in the atmosphere of the Carburangeli cave (black line), compared to the visitor number (blue vertical bars). Letters indicate the main fruition events not followed by any air CO2 increase. Numbers indicate the 10 main CO2 increments, in decreasing amplitude order; the letter “v” highlights those possibly related to fruition events.
Atmosphere 13 01760 g016
Table 1. Source of data used in this study. CAR, SNI, and SAM are Carburangeli, Santa Ninfa, and Sant’Angelo caves, respectively; T is temperature; NRT is Near-Real Time; HC is hardcopy only, in Italian, not available online.
CaveDataYearSource
CART, CO2 (spot)2000[15]
CART, CO2 (spot)2002–2003This work
CART, CO2 (spot and NRT)2006–2007[15]
CART, CO2 (NRT)2007–2011This work
SAMT, CO2 (spot)2005–2007This work
SNIT, CO2 (spot)2000[19] HC
SNIT, CO2 (spot)2004–2007This work
SNIT, CO2 (NRT)2011This work
Table 2. Attention, alert and alarm limits based on increasing air CO2 concentrations and proposed risk mitigation actions.
LevelCO2
Concentration
Mitigation Actions
1. Attention1%Limit to 2–3 h visiting times; Avoid numerous visitor groups; Pay attention to symptoms of physiological sufferance and, in case, immediately exit the cave
2. Alert.2%Access to specialized personnel only (cavers, scientists, workers); Limit to 1 h visiting times; Small groups (maximum 4–5 persons); Pay attention to early symptoms of physiological sufferance and, in case, immediately exit the cave
3. Alarm3%Access to specialized personnel only (cavers, scientists, workers); No access without wearing Individual Protection Devices (breathing apparatus); Visiting time controlled by breathing apparatus autonomy; Very small groups (3 persons); Pay attention to very early and light symptoms of physiological sufferance and, in case, immediately exit the cave
Publisher’s Note: MDPI stays neutral with regard to jurisdictional claims in published maps and institutional affiliations.

