Article

Global Ionospheric Disturbance Propagation and Vertical Ionospheric Oscillation Triggered by the 2022 Tonga Volcanic Eruption

1
College of Geodesy and Geomatics, Shandong University of Science and Technology, Qingdao 266590, China
2
Key Laboratory of Geospace Environment and Geodesy, School of Geodesy and Geomatics, Wuhan University, Wuhan 430079, China
*
Author to whom correspondence should be addressed.
Atmosphere 2022, 13(10), 1697; https://doi.org/10.3390/atmos13101697
Submission received: 19 September 2022 / Accepted: 13 October 2022 / Published: 16 October 2022
(This article belongs to the Special Issue Advances in Seismic-Ionospheric Coupling)

Abstract

:
The Tonga volcano erupted on 15 January 2022, at 04:15:45 UTC, which significantly influenced the atmosphere and space environment, at the same time, an unprecedented opportunity to monitor ionospheric anomalies is provided by its powerful eruption. In current studies of traveling ionospheric disturbance (TID) triggered by the 2022 Tonga volcanic eruption, the particular phenomenon of ionospheric disturbances in various parts of the world has not been reasonably explained, and the vertical ionospheric disturbances are still not effectively detected. In this paper, we calculate the high-precision slant total electron content (STEC) from more than 3000 ground-based GPS stations distributed around the world, then we obtain the radio occultation (RO) data from near-field COSMIC-2 profiles and investigate the horizontal TID and the vertical ionospheric disturbances by the singular spectrum analysis (SSA). Horizontal TID propagation captured by GPS STEC results indicates that acoustic-gravity waves dominate the energy input at the beginning of the ionospheric disturbance with an approximate speed of 1050 m/s initially. With the dissipation of the shock energy, lamb waves become a dominant mode of ionospheric disturbances, moving at a more stable speed of about 326 m/s to a range of 16,000 km beyond the far-field. Local characteristics are evident during the disturbance, such as the ionospheric conjugation in Australia and the rapid decay of TID in Europe. The shock-Lamb-tsunami waves’ multi-fluctuation coupling is recorded successively from the COSMIC-2 RO observation data. The shock and Lamb waves can perturb the whole ionospheric altitude. In contrast, the disturbance caused by tsunami waves is much smaller than that of acoustic-gravity waves and Lamb waves. In addition, influenced by the magnetic field, the propagation speed of TID induced by Lamb waves is higher towards the northern hemisphere than towards the southern hemisphere.

1. Introduction

The Tonga volcano erupted on 15 January 2022, at 04:15:45 UTC, which had been the world’s most powerful volcanic eruption event since the 21st century with a volcanic eruption intensity (VEI) of about 6. Through the comprehensive judgment, its degree is comparable to Krakatoa, Indonesia, in 1883 [1], and it significantly affected the Tonga Islands. It recorded strong air pressure waves by meteorological and infrasound sensors dispersed worldwide. The Tongan volcano eruption also resulted in a transoceanic tsunami that impacted the whole Pacific coast [2].
With the development of GNSS technology, densely distributed ground-based GPS tracking stations can provide data support for the inversion of the high-precision ionosphere [3,4,5,6,7]. The energy released from volcanic eruptions may lead to atmospheric disturbances that propagate upward into the ionosphere and result in periodic oscillations in electron density and total electron content, which is traveling ionospheric disturbances (TID) [8,9]. Many studies on TID triggered by volcanic eruptions in Tonga mainly focused on the analysis of the phenomenon of resonance of Lamb waves with the atmosphere [10]. Research results showed that acoustic-gravity waves dominated the initial disturbance of the Tonga eruption to the ionosphere eruption and then TID excited by Lamb wave propagated at the near-ground speed of sound [11], circling three times around the Earth and six times over the continental United States within 100 h after the eruption [12]. Visual analysis of the Lamb waves based on thermal infrared images from the Himawari-8 satellite proved that the waves propagate at the speed of approximately 310 m/s [13]. At present, papers on the ionospheric disturbance of Tonga volcanoes mainly concentrated on the ionospheric disturbance of Lamb waves in the global horizontal direction and did not analyze the local and vertical characteristics of the disturbance, and seldom involved the research of the ionosphere’s disturbance by acoustic-gravity waves and tsunami waves caused by volcanic eruptions.
COSMIC (Constellation Observing System for Meteorology, Ionosphere, and Climate) are some miniature remote sensing satellites used to collect and forecast atmospheric data, meteorology, and ionosphere, climate, and gravity. Its RO (radio occultation) observations can provide data for detecting ionospheric anomalies in the vertical direction, and vertical ionospheric disturbances also provide new ways for the coupling mechanism of the volcanic ionosphere [14,15]. Today’s studies about using COSMIC data to monitor ionospheric electron density disturbances are nothing new and they mainly focused on the relationship between earthquakes and vertical ionospheric disturbances, including the effects of earthquake-induced Rayleigh and tsunami waves on ionospheric electron density [16], the inhomogeneity and directionality of earthquake-induced TID [17], and the dynamic anomalies in the ionosphere before earthquakes [18]. COSMIC RO profile data, different from STEC data [19,20], can offer vertical near-field detection of ionospheric disturbance of Tonga volcanic eruptions. However, few studies have applied COSMIC RO profile data to TID disturbance analysis of volcanic eruptions. The number of radio occultation points worldwide per day is over 4000 with the normal operation of COMSIC2. The improved spatial and temporal resolution of RO points can ensure the accuracy of TID near-field disturbance detection. The comprehensive analysis of GPS STEC and COSMIC-2 RO makes it possible for us to dynamically monitor the multidimensional and multi-atmospheric variations paired with the TID of the Tonga volcanic eruption.
The current study of TID triggered by volcanoes in Tonga in 2022 mainly focuses on the horizontal direction, and there is little analysis of the local characteristics of the disturbance in various regions of the globe as well as the vertical ionospheric disturbance. Therefore, in this paper, we will carry out detailed research on the above issues. Section 2 introduces the data and the methods of the data process. In Section 3, we will exploit the data from more than 3000 GNSS stations worldwide to invert the high-precision STEC and then extract the ionospheric disturbance based on singular spectrum analysis to capture the global TID propagation of the volcanic eruption and the local characteristics of TID. In Section 4, we will analyze the 3D disturbance pattern of the near-field ionosphere with COSMIC-2 RO profile data. In Section 5, we will discuss the horizontal and vertical propagation characteristics of TID caused by the Tonga eruption and the coupling of various fluctuations, and analyze the difference in propagation velocity of TID triggered by Lamb waves in the south and north directions in a joint confirmation by near and far field STEC TID and COSMIC RO oscillation. In Section 6, we will conclude the impact of the 2022 Tonga volcanic eruption on the ionosphere. This paper will provide a new reference for studies related to ionospheric disturbances of volcanic eruptions.

2. Materials and Methods

2.1. STEC Data

The inversion of the STEC from GNSS raw observations offers a significant database for global ionospheric disturbance studies, and the ionospheric slant total electric content (STEC) can be inferred from the dual-frequency carrier phase and pseudorange [21,22,23,24]. We take the distance range of 5000 km around Tonga as the near-field and beyond 5000 km as the far-field. In order to track the global propagation of TID, this paper applies GPS observations from more than 3000 globally distributed GPS tracking stations to participate in STEC solving, and the GPS data are mainly obtained from Crustal Dynamics Data Information System(CDDIS), International GNSS Service (IGS), Instituto Geográfico Nacional (IGN), Crustal Movement Observation Network of China (CMONOC), European Permanent GNSS Network (EUREF), Space Weather Services (SWS), UNAVCO, Dados, TrigNet, GeoNet, etc. Figure 1 shows the distribution of all sites.
The TID propagation characteristics are examined in this work using a shell model with an altitude of 450 km, and the average sampling interval of data is 30 s. The original observations are pre-processed with Bernese 5.2 software before STEC inversion. The pre-processing mainly includes the detection of cycle slip with Melbourne-Wübbena observations, computation of phase smoothed pseudorange, the estimation of satellite and receiver differential code biases (DCB) [25,26], and the DCB correction in the STEC solution [27]:
P 4 ¯ = L 4 1 n k = 1 n ( P 4 + L 4 ) S T E C = P 4 ¯ D C B s D C B r 40.3 ( 1 f 1 2 1 f 2 2 )
where P 4 ¯ is phase-smoothed pseudorang, f1 and f2 are carrier frequencies, P4 and L4 denote pseudorange and phase geometric-free combination observations, n is the number of ephemerides in the smoothed arc segment, DCBs and DCBr represent the DCB of the satellite and receiver, respectively.

2.2. COSMIC-2 Profile Data

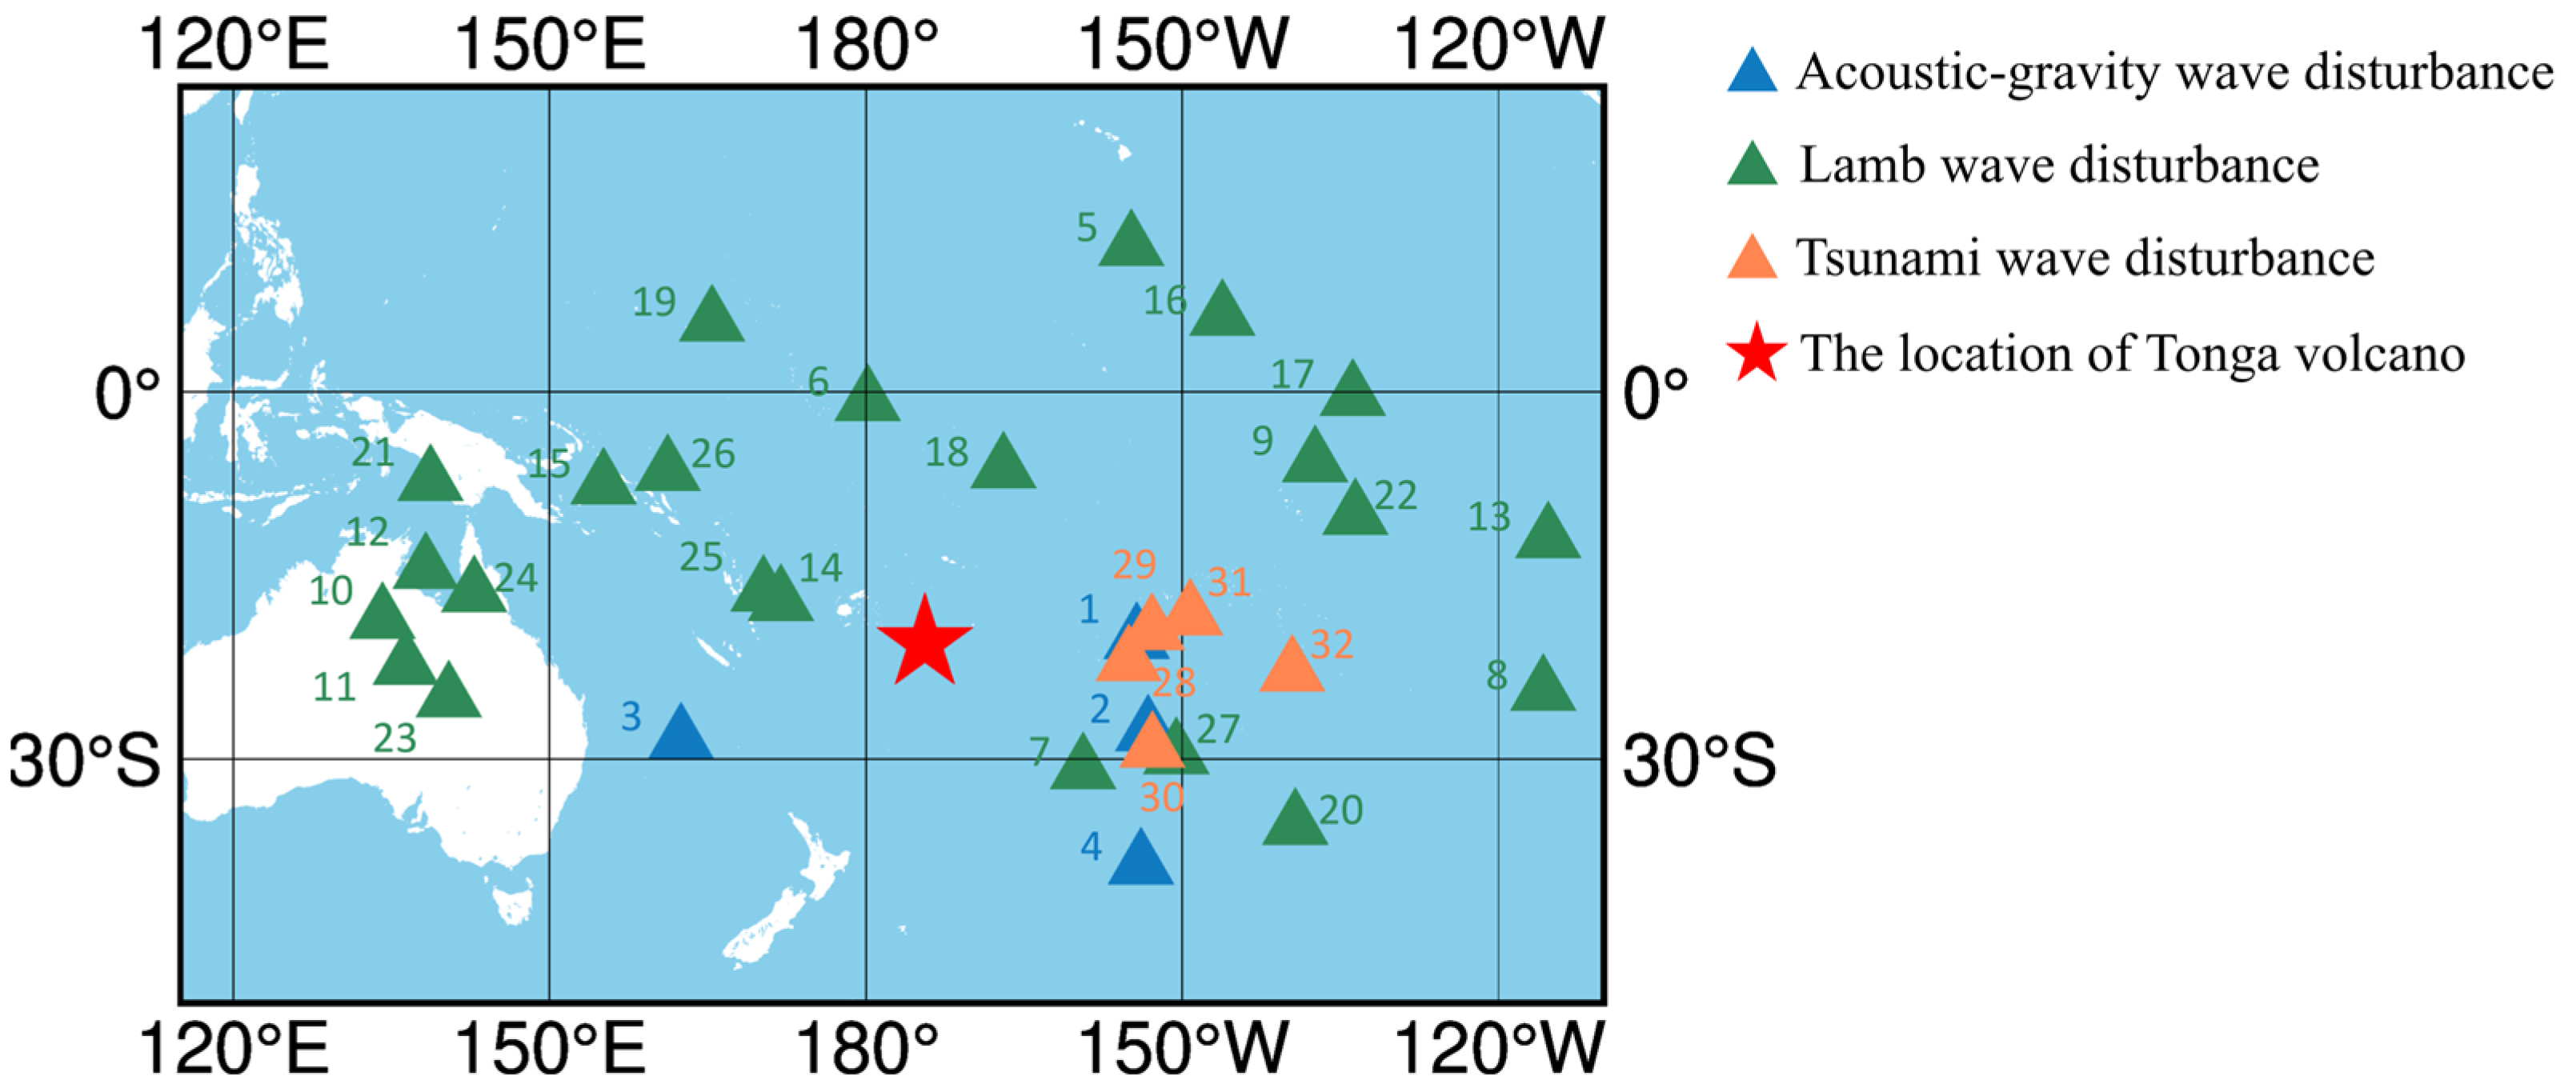
COSMIC-2 RO profile observations exploited in this paper are available from the Taiwan Analysis Center for COSMIC (TACC) and COSMIC Data Analysis and Archival Center (CDAAC), and the data can be applied to detect vertical ionospheric disturbances. By the RO technique, we can obtain the vertical ionospheric electron density of the ionosphere at a given moment. The RO observation data contains the latitude and longitude information of the RO point so that COSMIC-2 RO data can be used to obtain an ionospheric electron density profile at an altitude of 100–800 km. In this paper, we selected RO profiles within 6500 km of Tonga within 6 h of the volcanic eruptions. After pre-processing (see [21] for details of the steps), we screened 32 of the 265 profiles in this range, as shown in Figure 2. A linear interpolation was performed on the 32 profiles screened to give a uniform resolution of 2.5 km. In addition, limited by the observation quality of COSMIC-2 RO profile data, only 100–500 km altitude data are selected in this paper.

2.3. Methods for Extracting Disturbance

In order to extract the disturbance signal, this paper applies SSA to remove the background trend from the STEC and RO data, which effectively extracts periodic oscillations in time series and has been applied to the analysis of several ionospheric disturbance events [28,29,30]. First, each observed arc segment is chosen as a time series {x} to build the time delay matrix X:
X = x 1 x 2 x N M + 1 x 2 x 3 x N M + 2 x 4 x M + 1 x N
where N is the time series length and M is the time window, M should meet the condition: 1 M N 2 .
Then the auto covariance matrix Tx of the time delay matrix X:
T x = S ( 0 ) S ( 1 ) S ( M 1 ) S ( 1 ) S ( 0 ) S ( M 2 ) S ( M 1 ) S ( M 2 ) S ( 0 )
where Tx is a symmetric matrix and the diagonal S ( 0 ) and S ( j ) ( 0 j M 1 ) are the covariance and self-covariance of {x}, respectively. We can calculate the eigenvalues λ and eigenvectors E of Tx, the eigenvectors Ek(k = 1,2,…,M) corresponding to λk is Temporal Empirical Orthogonal Function (T-EOF), then the projection of matrix X can be calculated on Ek:
a i k = k = 1 M x i + j E j k 0 i N M
where 0 ≤ iNM, 1 ≤ jM, a i k is the time principal component (T-PC). Finally, the reconstructed components can be obtained by:
x i k = 1 i j = 1 M a i j k E j k , 1 i M 1 1 M j = 1 M a i j k E j k , M i N M 1 1 N i + 1 j = i N + M M a i j k E j k , N M + 2 i N
SSA can reconstruct M components, in which the reconstructed components (RC) of the low-frequency signal can effectively present the main changeable characteristics of the original sequence. The original sequence can be approximated by adding several RCs at the front together, while the disturbance of the original sequence can be obtained by subtracting these RCs from the original sequence.
This paper sets the length of the sliding window to 1/3 of the length of the observation arc and intercepts the first seven RC components to generate the principal components of the time series STECmain and ROmain, and the ionospheric STEC and RO disturbance signals can be obtained by deducting the principal components from the original data:
ΔSTEC = STECSTECmain
ΔRO = ROROmain

3. Global TID Dissemination Captured by STEC

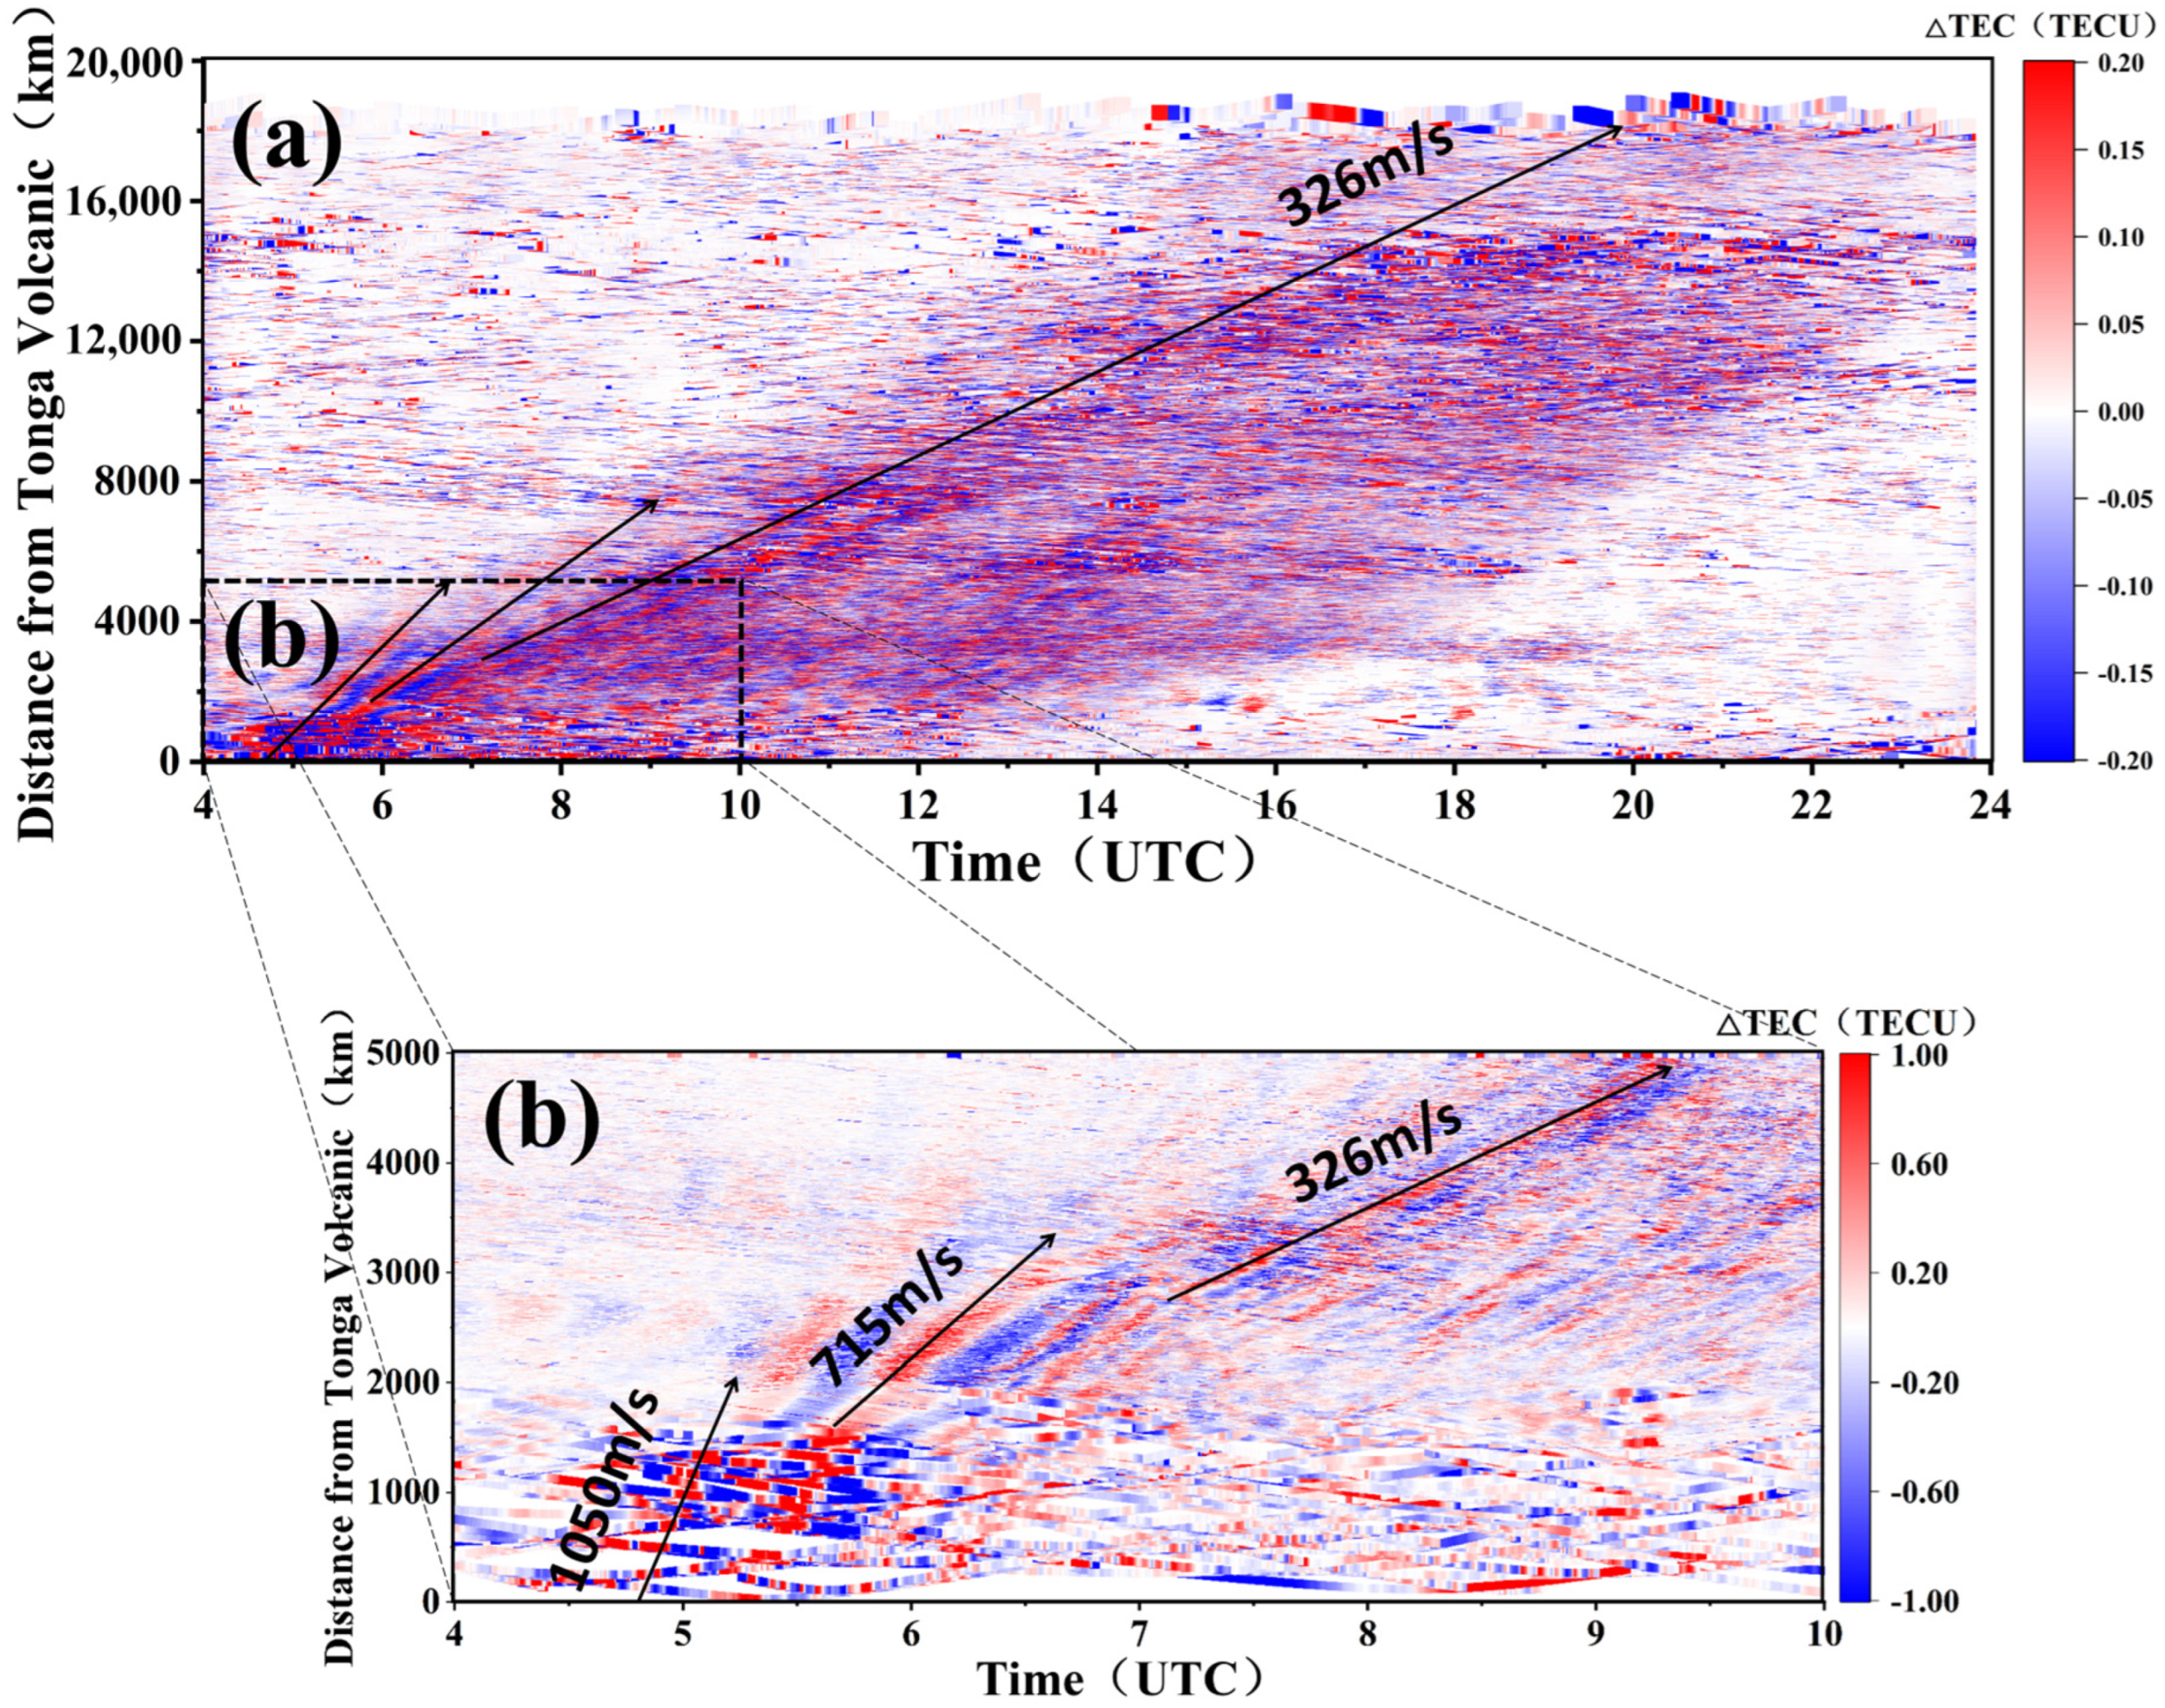
The center of the Tonga eruption is located at (20.5° S, 175.4° W), and the distance between the ionospheric pierce point (IPP) and the center of the eruption can be obtained with their latitudes and longitudes. The distance-time analysis chart can be plotted according to the distance and the arrival time, as shown in Figure 3. In this work, the distance-time analysis chart is adopted to analyze the disturbance of the near-field and far-field [14], which can well solve the problems of sparse distribution of stations in the ocean and the uneven distribution of the global STEC solution. The TID peak points corresponding to the eruption of the Tonga volcano are fitted with the least-squares method, and the disturbance propagation velocity can be obtained by the slope of the fitted straight line.
From Figure 3b, we can see that the disturbance propagated at a speed of about 1050 m/s within one hour after the eruption, which indicates that the acoustic-gravity waves and the infrasound formed by the eruption produced a rapid disturbance of the ionosphere. After one hour, as the shock disturbance of the ionosphere gradually weakened, other atmospheric wave disturbances took over the dominant role, and the velocity of the ionospheric disturbance stabilized at 326 m/s three hours after the outbreak. Therefore, it can be concluded that the initial shock fluctuations of the Tonga eruption affected the ionosphere for almost three hours and over a distance of 3500 km. As can be seen in Figure 3a, the propagation velocity of the ionospheric disturbance stabilizes at 326 m/s after the complete dissipation of the acoustic-gravity wave energy, which is similar to the propagation velocity of Lamb waves [13]. Although Lamb waves propagate at the speed of sound and exist only in the troposphere, their resonance with the atmosphere can transmit wave energy to the ionosphere [31,32]. In a word, at the beginning of the eruption, the amplitude of the acoustic-gravity wave was larger. With the rapid dissipation of the shock energy, the acoustic-gravity wave persisted only in the near field. However, the amplitude of the Lamb wave disturbance was smaller, but the duration and disturbance range were larger, and the whole disturbance lasted at least 8 h, and it disturbed 16,000 km from Tonga on the day of the eruption and gradually dissipated 16,000 km away.

3.1. Disturbance Propagation in the Pacific Rim

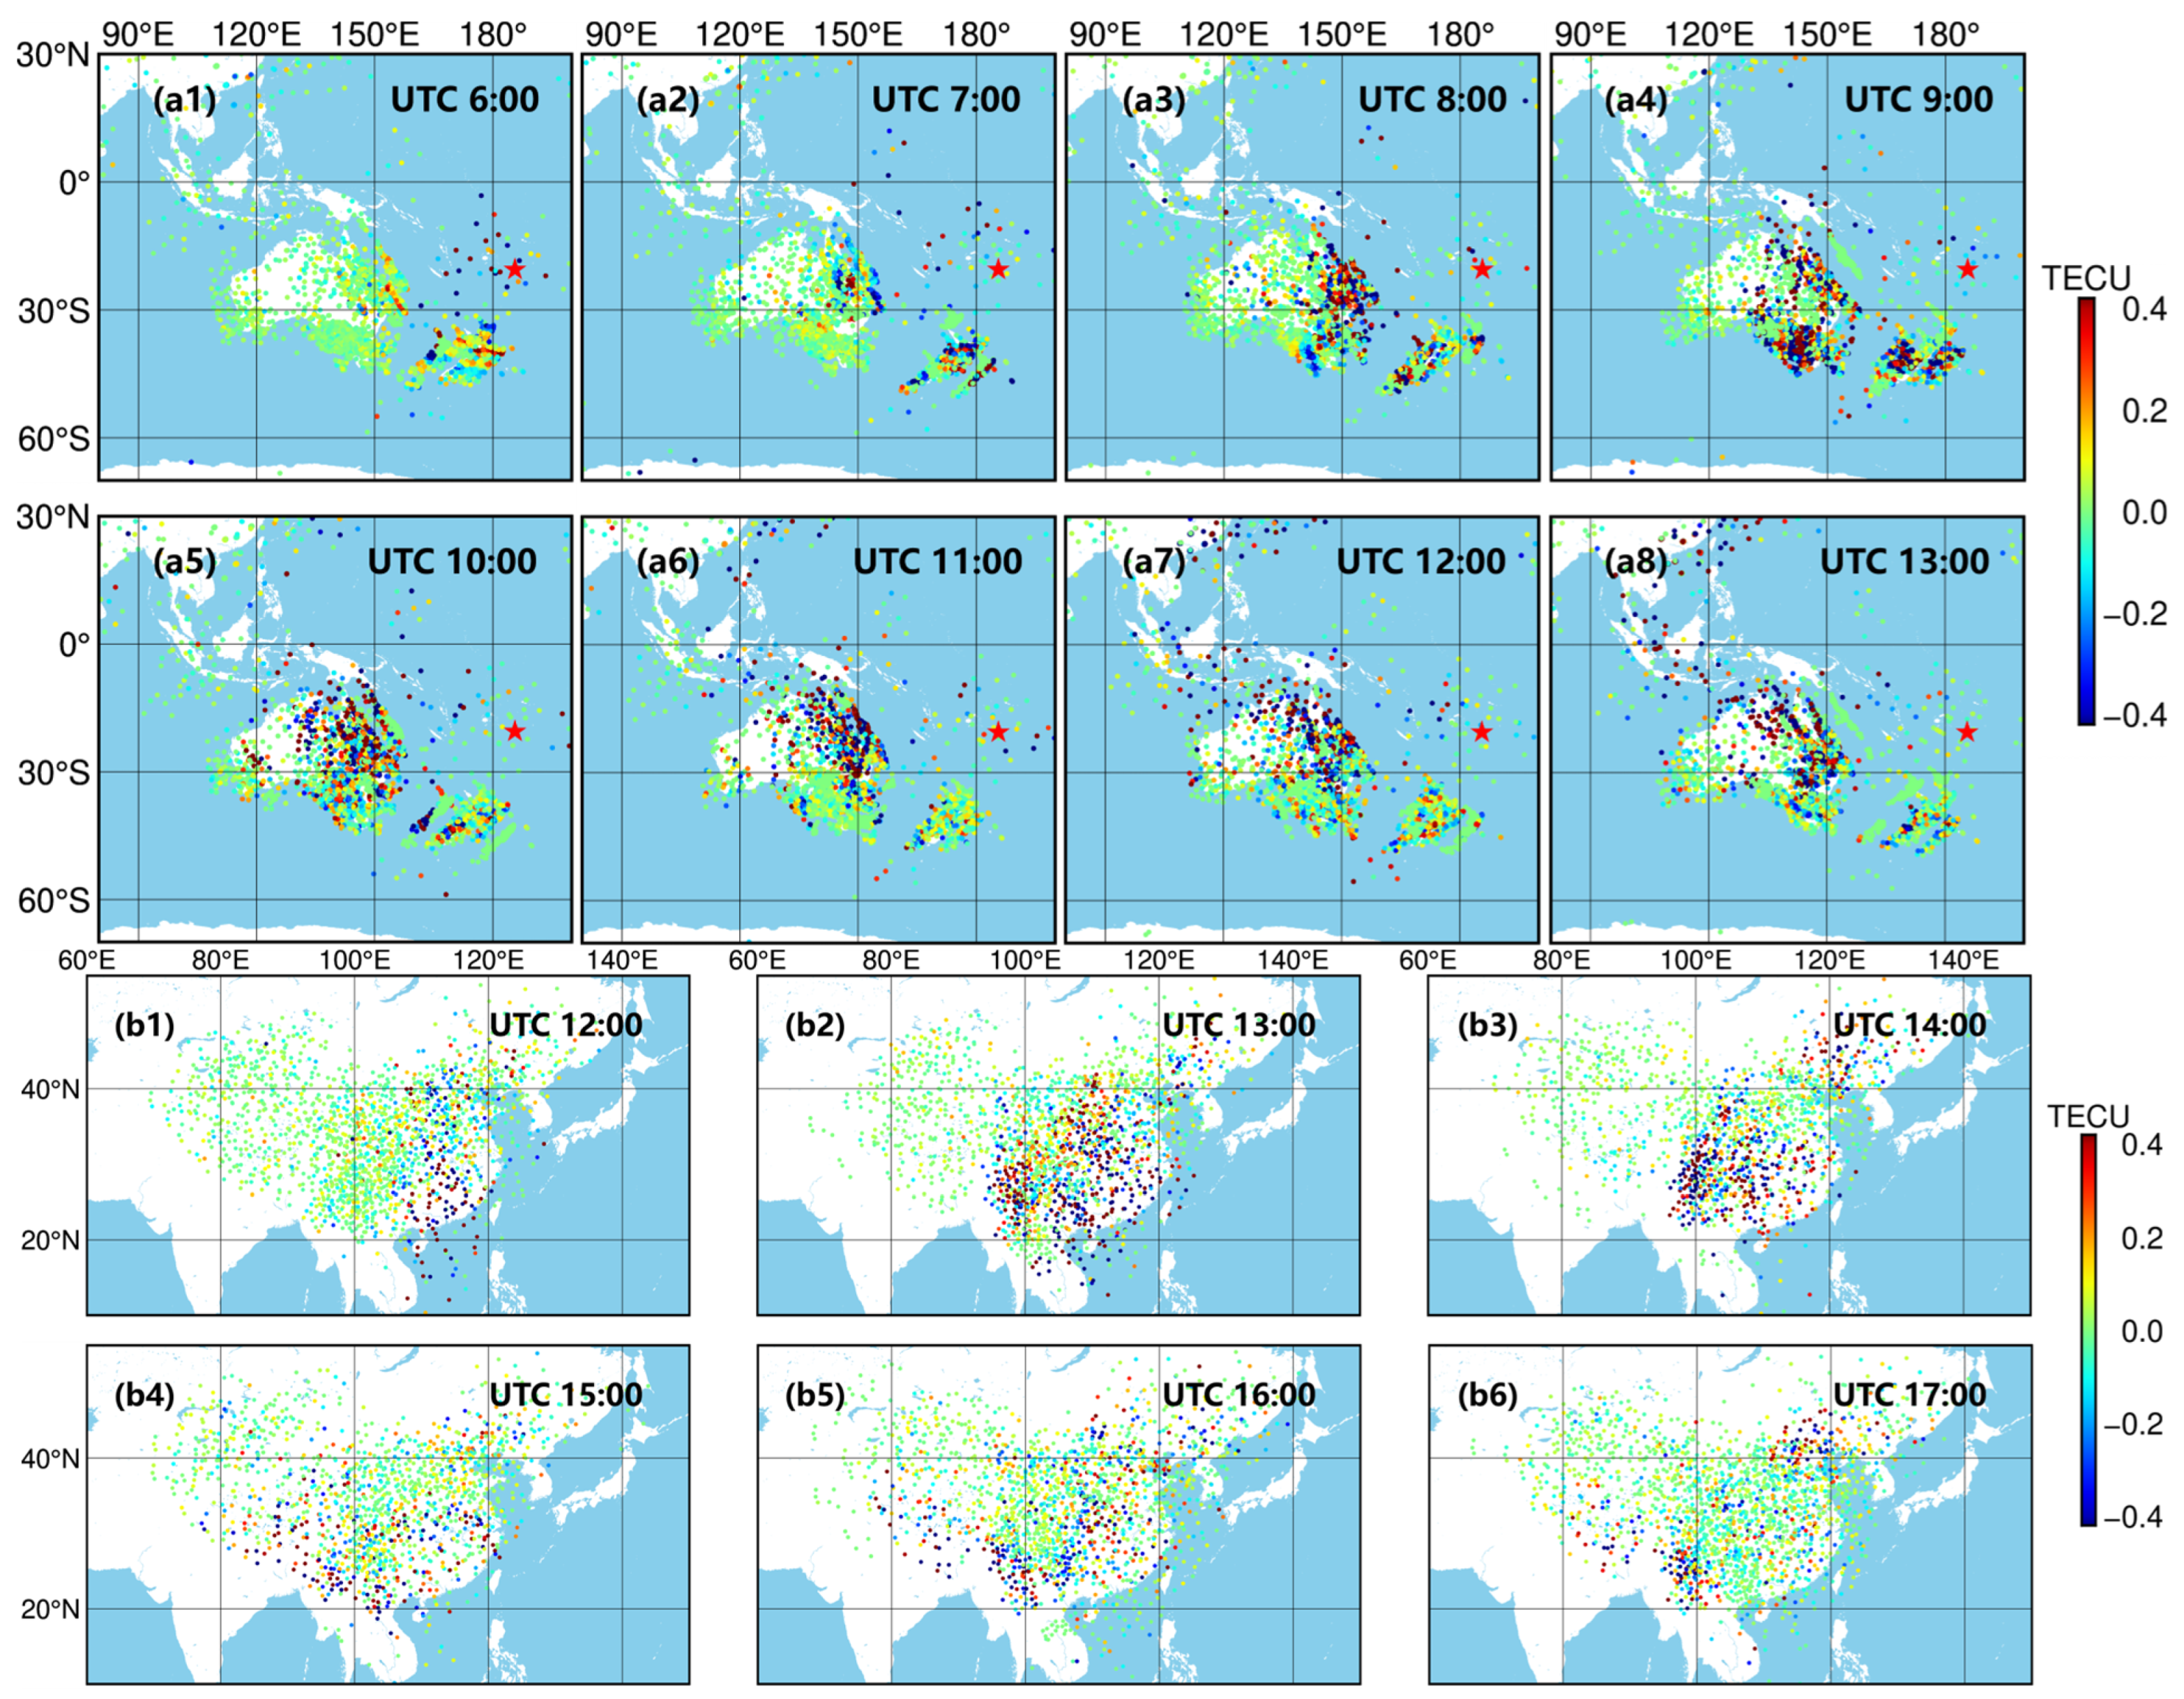
Figure 4 shows the propagation of the disturbance in the western part of the Pacific Rim (see Supplementary Videos S1 and S2). In Australia, the TID first arrived in the east at 6:00 UTC. However, as time passed, the TID was present in northeastern Australia for a long time and did not seem to travel, and the phenomenon might be related to the conjugation of the TID between the northern and southern hemispheres. Similar opinions have been presented by several researchers [33,34,35]. Using dense GNSS receivers in New Zealand, Australia, and Japan, Lin et al. found the intriguing interhemispheric coupling from the magnetic conjugate regions in the southern hemisphere [33], with air pressure waves arriving in central Australia at about 8:00 UTC and conjugation TID appearing almost simultaneously in the northern hemisphere through interhemispheric coupling, arriving in Japan three hours earlier [33]. Similarly, when the Lamb wave-induced TID arrives in Japan, it was again mapped to Australia in the southern hemisphere along the conductive magnetic field lines [33]. Lamb wave arrived in Japan immediately after leaving Australia, here the external electric field variation generated the TID observed in Australia, and the electric field propagated to the F region and magnetically conjugate ionosphere along magnetic field lines with the local Alfven speed [34], which led to a long stay of TID in Australia. The conjugate appearance of TID between the northern and southern hemispheres was common, Chou et al. showed conjugate signatures of medium-scale traveling ionosphere disturbances (MSTID) produced by the tsunami propagation during the 2011 Tohoku earthquake [35], Australia in the Tonga event went through a similar process.
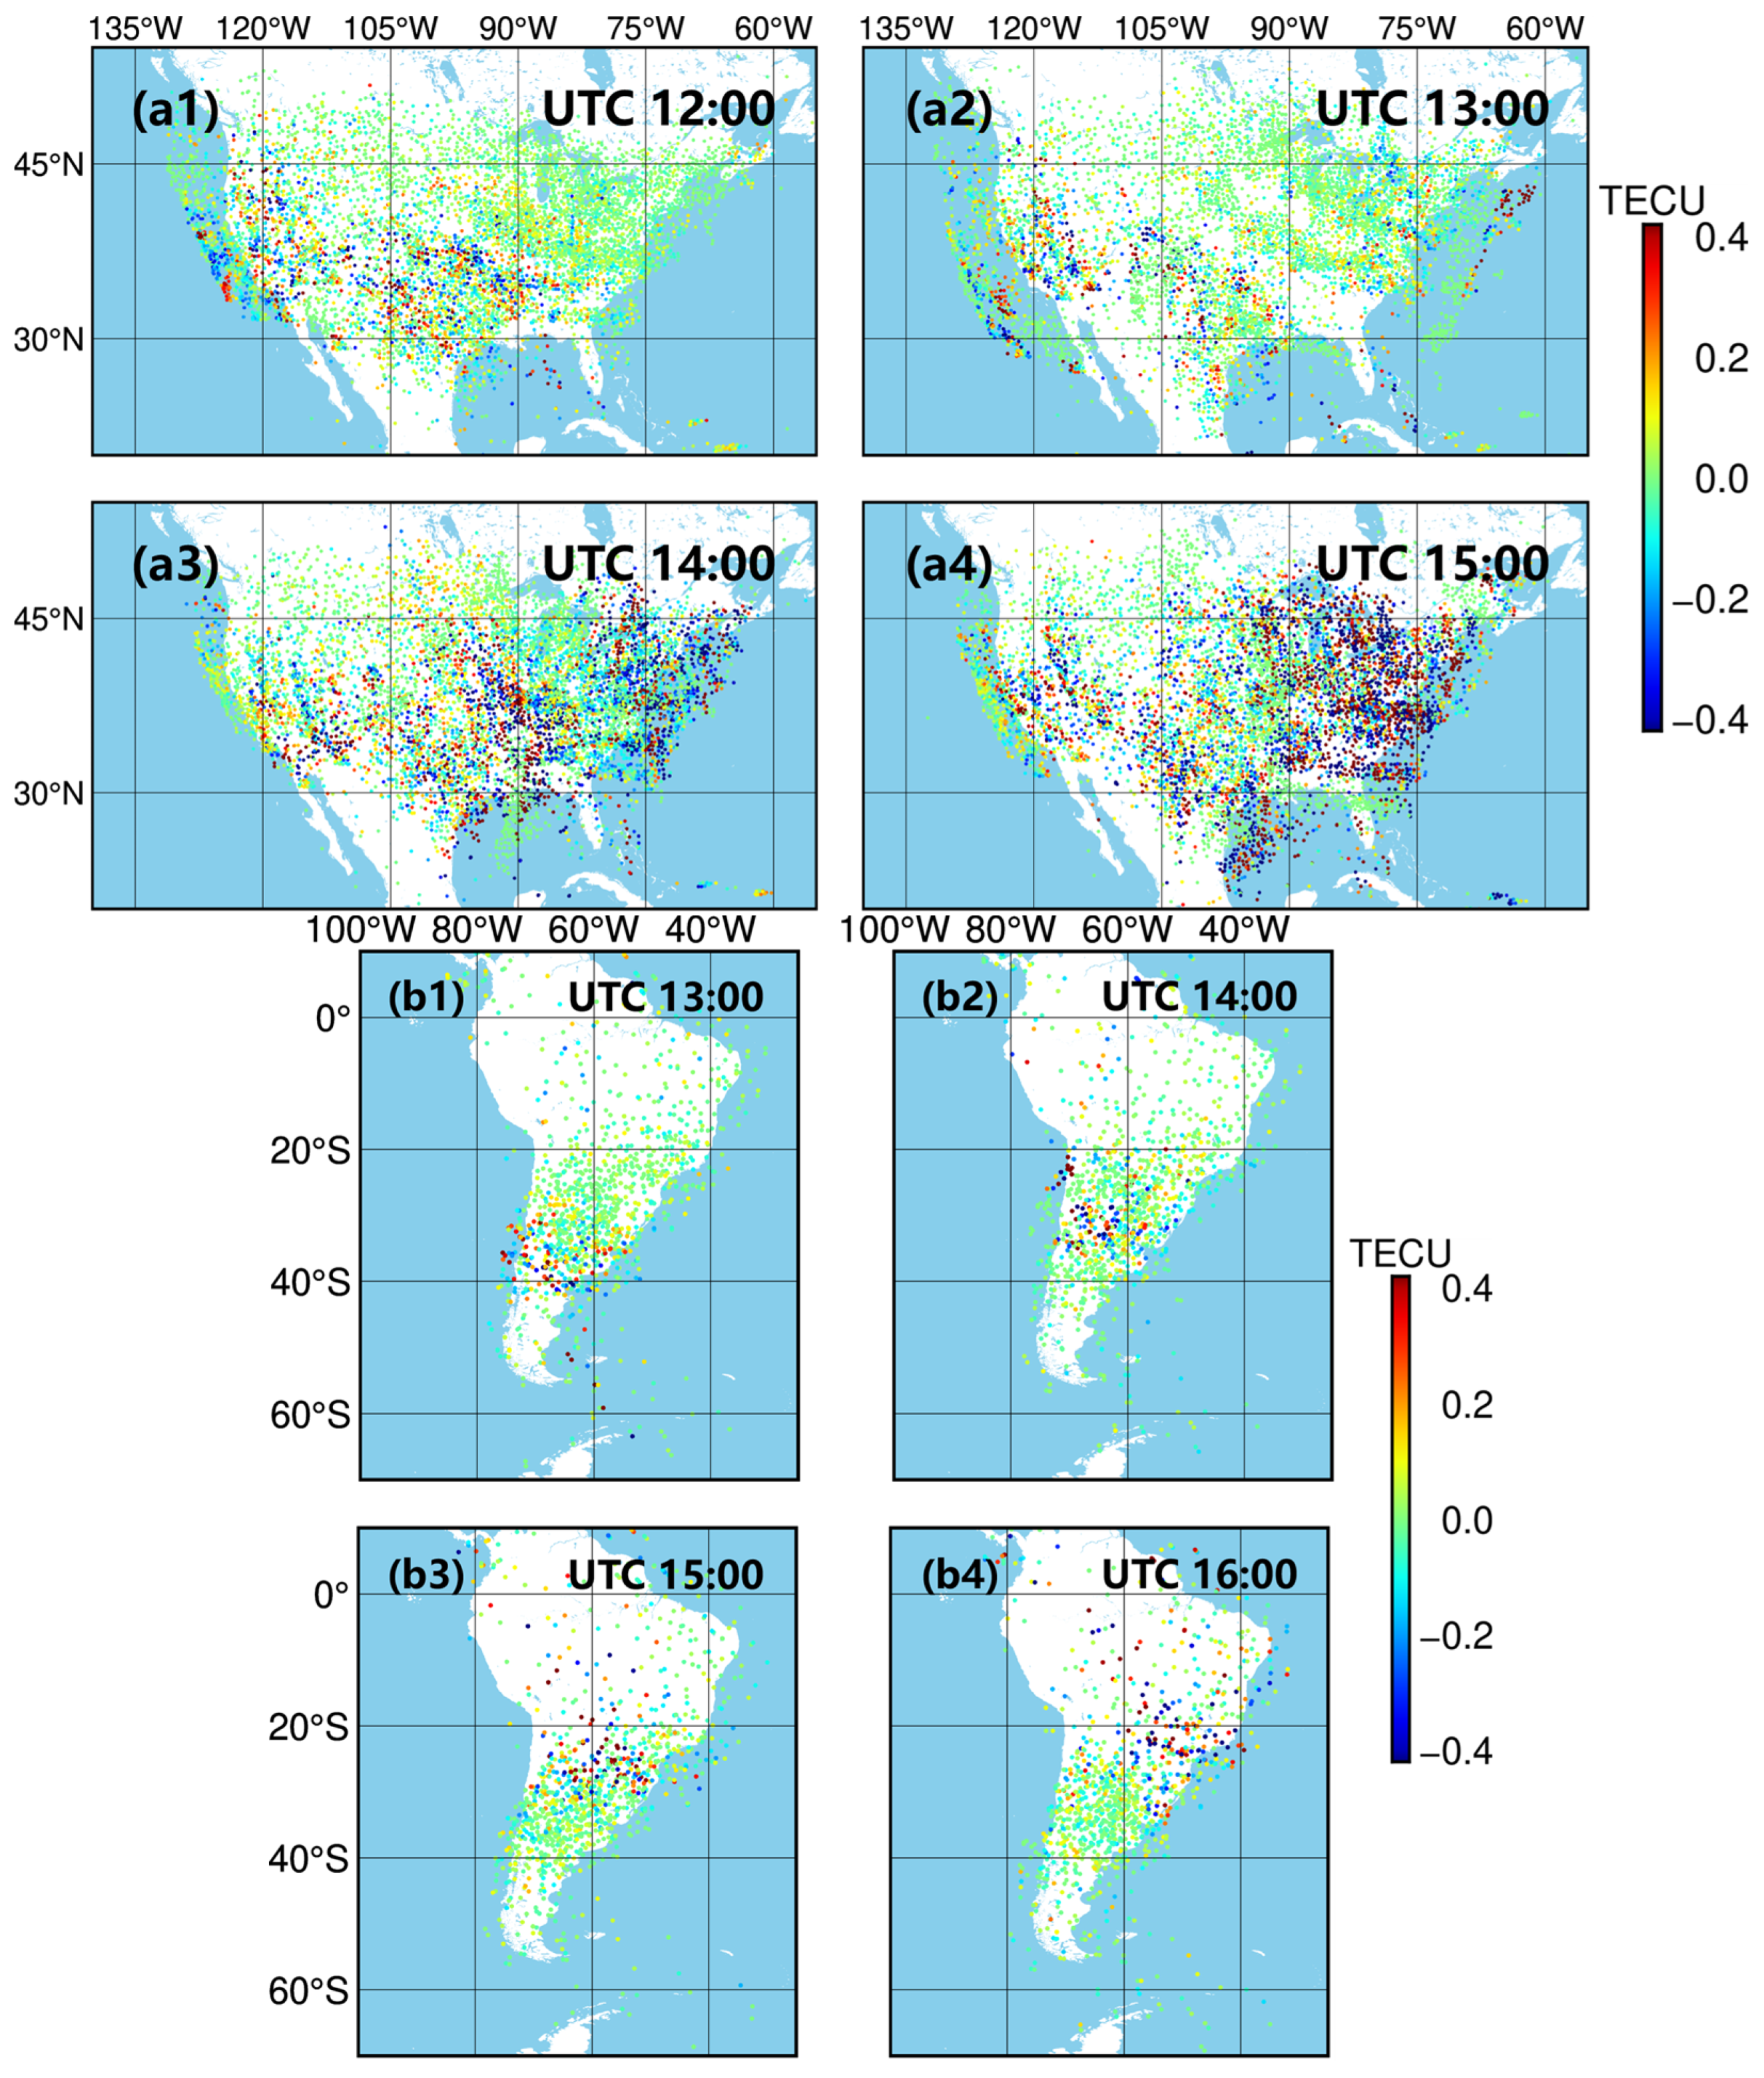
The propagation of the disturbance in the eastern part of the Pacific Rim proceeds in a radial direction, as shown in Figure 5 (see Supplementary Videos S3 and S4). The distance from the mainland US to Tonga is as almost far as that from South America to Tonga. The ionospheric disturbance reached the western part of the mainland U.S. at UTC 12:00 and left the eastern part of the mainland U.S. at UTC 18:00, affecting the whole mainland U.S. within 6 h. The above findings of this paper are similar to the disturbance propagation phenomenon in the US analyzed by Zhang et al. [11] and Themens et al. [12]. Both studies mentioned that the disturbance first reached the west coast of the United States at about UTC 12:00, and the earliest wavefront left the east coast at about 13,000 km at about UTC 16:00. However in South America, the ionospheric disturbance arrived at UTC 13:00 and left South America at UTC 17:00, and the whole disturbance process lasted for 4 h. So we can speculate that there has a slight anisotropy in the propagation speed of the ionospheric disturbance by the Lamb waves generated by the Tonga volcanic eruption.

3.2. Disturbance Propagation in Europe and South Africa

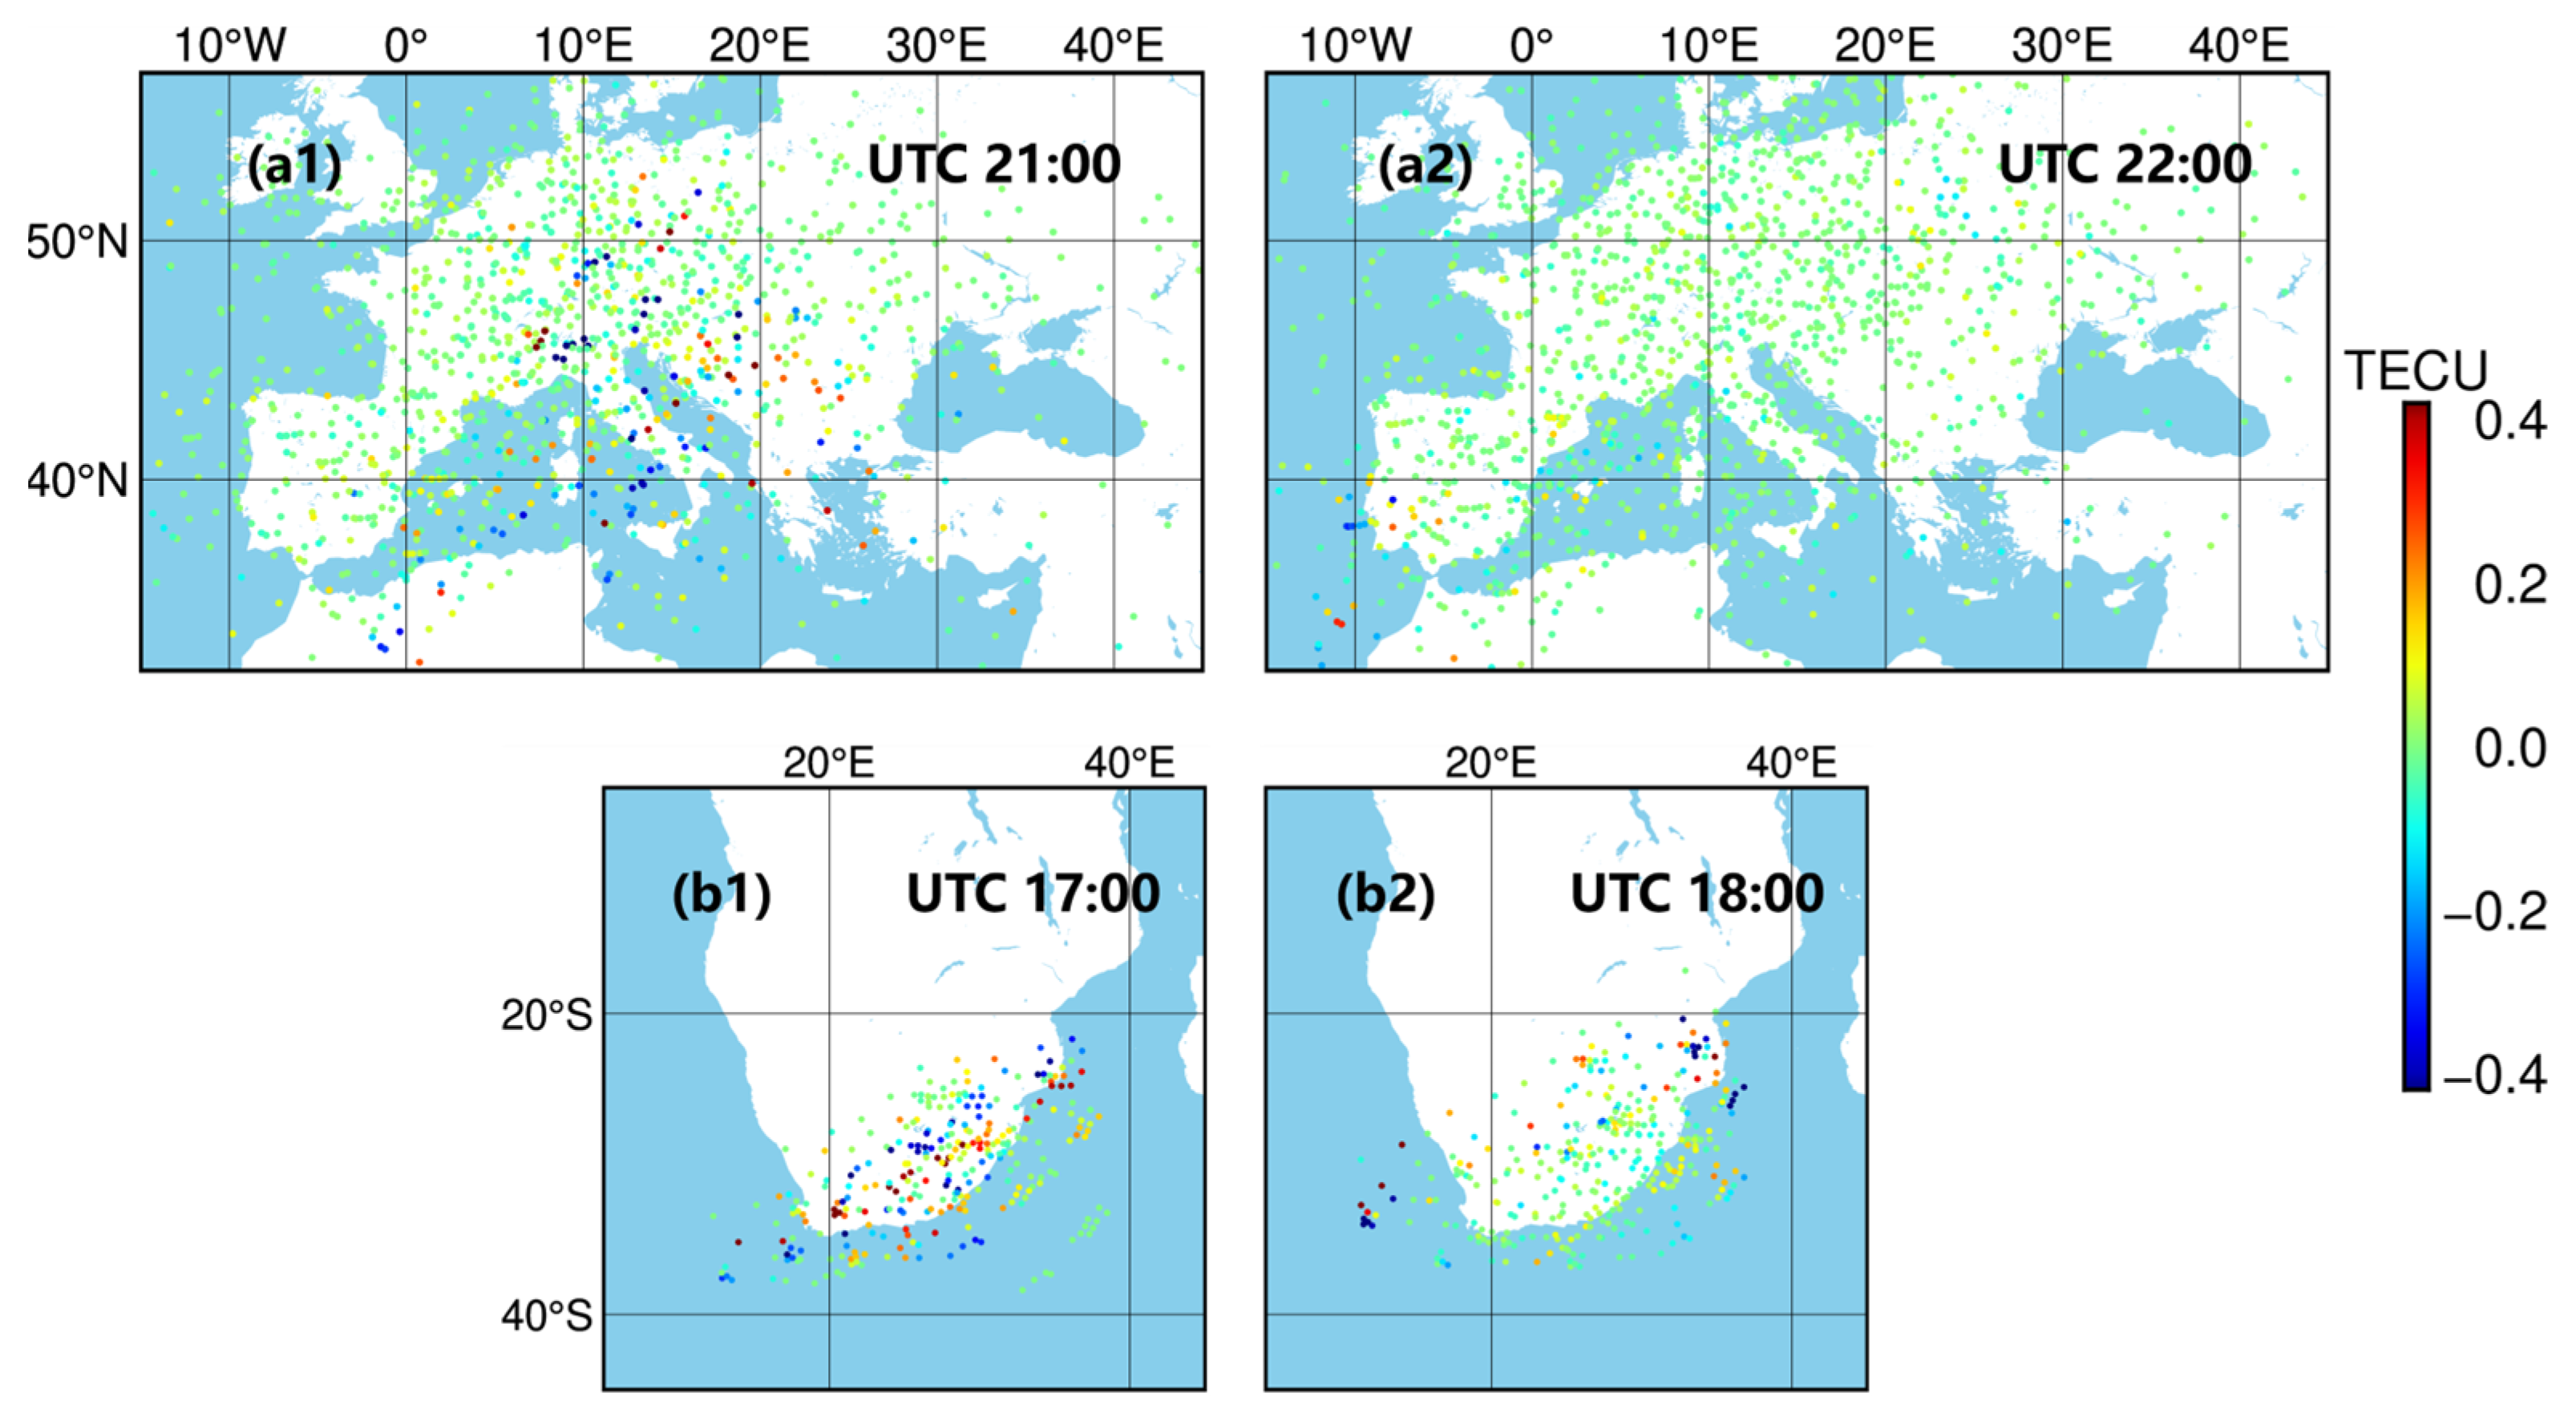
The disturbance propagations in Europe and South Africa are shown in Figure 6 (see Supplementary Videos S5 and S6). Zhang et al. [11] pointed out that the lack of significance of the TID in Europe is caused by the influence of polar light source waves at mid and high latitudes, which can be confirmed in this paper, that is, the atmospheric disturbances reach the European far-field with rapid energy attenuation. It has been shown that there is energy deposition in the ionosphere in the polar region, and large-scale traveling ionospheric disturbances (LSTID) may be affected this region [36,37]. Because the propagation of the disturbance in the direction of South Africa passes through the Antarctic, although the distance between South Africa and Tonga is similar to that of the eastern part of the U.S. mainland between Tonga, the disturbance size of South Africa is significantly smaller than that of the east part of the U.S. mainland.

4. Effects of Multiple Atmospheric Wave Disturbances in Near-Field TID Recorded by COSMIC-2 RO

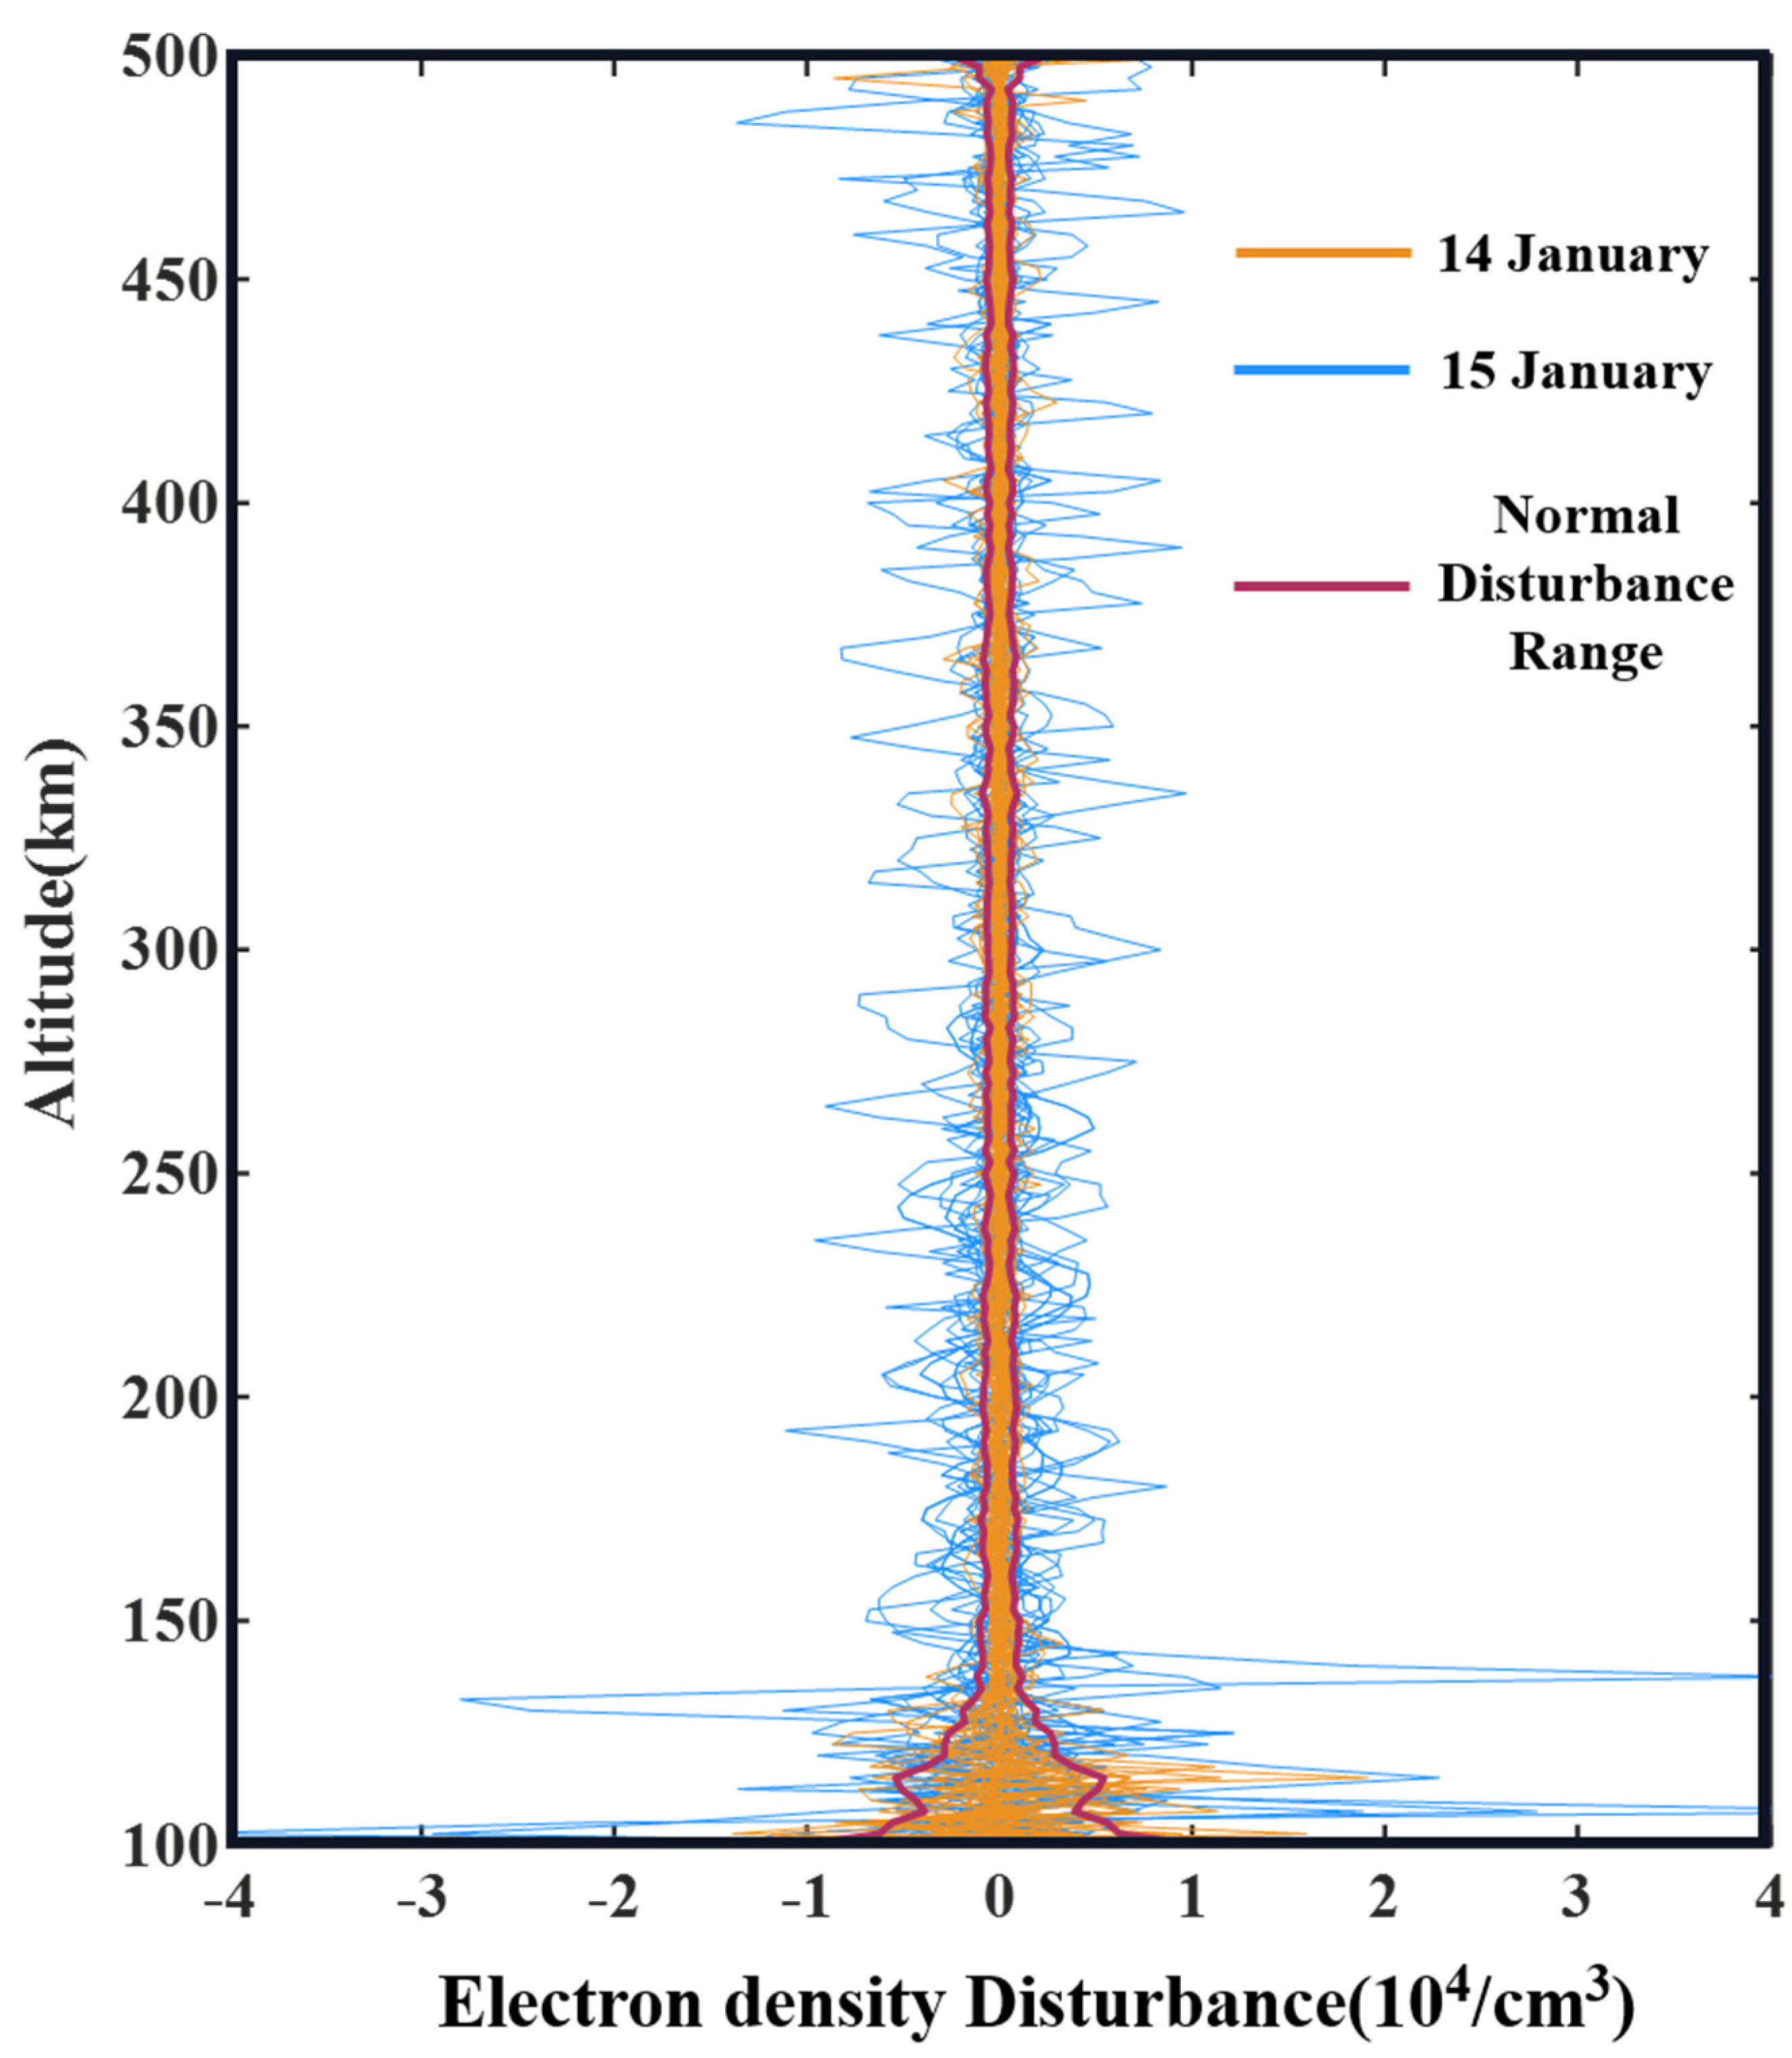
The COSMIC profile data will show slight fluctuations even when the ionosphere is in quiet condition [38]. The range of COSMIC data disturbances under normal conditions can be determined by extracting the slight disturbances on 14 January, which will be used as a reference for monitoring the TID disturbances after the Tonga volcanic eruption on 15 January. The geomagnetic DST index of 14 January ranged from −1 to 14 nT at UTC 4:00–10:00, and there was no magnetic storm phenomenon during this time period. The solar radiation index F10.7 on 14 January was about 105 SFU (Solar Flux Unit), with a relatively moderate solar activity. In this paper, all the profiles within 6500 km around Tonga on 14 January (the day before the eruption) and 15 January (the day of the eruption) within 6 h after the eruption are selected for the ionospheric disturbance analysis in the vertical direction. Figure 7 shows the disturbance oscillations extracted based on SSA for 14 January (indicated by the orange line) and 15 January (indicated by the blue line).
At each altitude interval (2.5 km), we calculated the absolute values of the disturbance oscillation for all profiles on 14 January and then calculated the mean of the absolute values, and two times the mean value was taken as the normal disturbance range (confidence interval ~95%, indicated by the red line), as shown in Figure 7. From Figure 7, we can see that the amplitude of the post-eruption profile oscillations on 15 January was more potent than on 14 January, and the selected 32 profile disturbances on 15 January were all outside the normal range, from which we can assume that the anomaly was caused by the volcanic eruption.
When analyzing the profile, this paper assumes that the disturbance first propagates in the near-surface atmosphere and then propagates vertically to the ionosphere. Since the eruption time, the detection time, and the position of the profile are known, the time and distance of the disturbance transmission to the profile can be gained so that the velocity of the disturbance reaching the profile can be calculated, and according to this velocity, the type of the disturbance wave can be judged. The velocities of acoustic-gravity waves and Lamb waves have already been analyzed in Section 3, and the speed of tsunami waves is known to be about 200 m/s [39], and the wave pattern of each profile disturbance can be analyzed based on the horizontal velocity of the disturbance propagation. Since the disturbance takes about 540–840 s to pass from near the ground to the ionosphere, and considering that the eruption of Tonga volcano lasted about 10 min, it needs to be deducted from the arrival time and then obtains the horizontal velocity range of the disturbance propagation.
The profile disturbance can be obtained by detrending the 32 profiles selected in Figure 2 using the SSA method, as shown in Figure 8:
In Figure 2 and Figure 8, the blue profiles (Prof#1–Prof#4) indicate the disturbances caused by the eruption acoustic-gravity waves, which are all within 3000 km from the eruption center, and the detection times of the profiles are all within two hours after the eruption. The horizontal velocities of the disturbances are between 540 and 901 m/s, with prominent acoustic-gravity wave characteristics, and are mainly concentrated in the southeast direction. The green profiles (Prof#5–Prof#27) represent disturbances caused by Lamb waves with disturbance velocities between 273 and 402 m/s and are distributed around Tonga with no apparent directionality. The orange profiles (Prof#28–Prof#32) show disturbances caused by tsunami waves, that are all detected after UTC 9:00 when the impact of acoustic-gravity waves and Lamb waves have already passed through these profiles, and the disturbance horizontal propagation velocity is similar to that of tsunami waves, also concentrating on the southeast direction.
Figure 8 simultaneously shows the specific disturbances in 32 profiles on 15 January 2022. It can be seen that the disturbances caused by acoustic-gravity waves and Lamb waves crossed the ionospheric height of 100–500 km, and both shock and Lamb waves led to electron density disturbances of about 1.5 × 10⁴/cm3 to cause high-frequency oscillations in the vertical ionosphere and short-wave fluctuations of 20 km. After the acoustic-gravity wave and Lamb wave affected ionospheric electron density, the tsunami wave perturbed the vertical ionosphere again. Unlike the acoustic-gravity wave and Lamb wave, the ionospheric disturbance caused by the tsunami wave did not pass through the entire ionospheric altitude. The ionospheric disturbance caused by tsunami waves could reach only 320 km altitude, and led to the fluctuations of long-wave about 220 km. The disturbance amplitude was about 0.5 × 10⁴/cm3, and it was smaller than that caused by acoustic-gravity waves and Lamb waves.

5. Discussion

At present, many scholars have carried out research on TID caused by volcanic eruptions. In 1980, Lamb waves induced by the eruption of Mount St. Helens led to a large-scale traveling ionospheric disturbance within a radius of 9000 km [40], and the disturbance propagated horizontally with a velocity of slightly more than 300 m/s [41]. In 1991, the ionospheric disturbance caused by the eruption of Mount Pinatubo affected at least 2000–3000 km in Asia, which demonstrated the lithosphere-atmosphere-ionosphere coupling [42]. Li et al. indicated that the occurrence rate of TEC anomalies before great volcanic eruptions was related to the volcanic type and geographical position [43]. In this paper, we find that there are three processes of the disturbance of the ionosphere by the Tonga volcanic eruption. Firstly, the initial shock disturbance caused by the Tonga volcanic eruption had an impact on the ionosphere, lasting for three hours and transmitting to 3500 km. Secondly, after the dissipation of the acoustic-gravity wave energy, the Lamb wave dominated the atmospheric resonance and transferred the energy to the ionosphere, which continued to perturb the ionosphere and affected the global ionosphere at a rate of about 326 m/s. Finally, after being influenced by the acoustic-gravity wave and Lamb wave, the ionosphere continued to be disturbed by the tsunami wave. By analyzing COSMIC-2 RO data, this paper finds that both acoustic-gravity waves and Lamb waves can produce high-frequency oscillations in the vertical ionosphere and lead to short wave fluctuations of 20 km. After the ionosphere was affected by acoustic-gravity waves and Lamb waves, we again monitored the tsunami waves perturbing the vertical ionosphere. Unlike acoustic-gravity waves and Lamb waves, the ionospheric disturbance caused by tsunami waves did not pass through the entire ionospheric altitude, and its disturbance to ionospheric electron density only reached 320 km altitude with long-wave fluctuations of about 220 km, and the amplitude of the disturbance was much smaller than that of acoustic-gravity waves and Lamb waves.
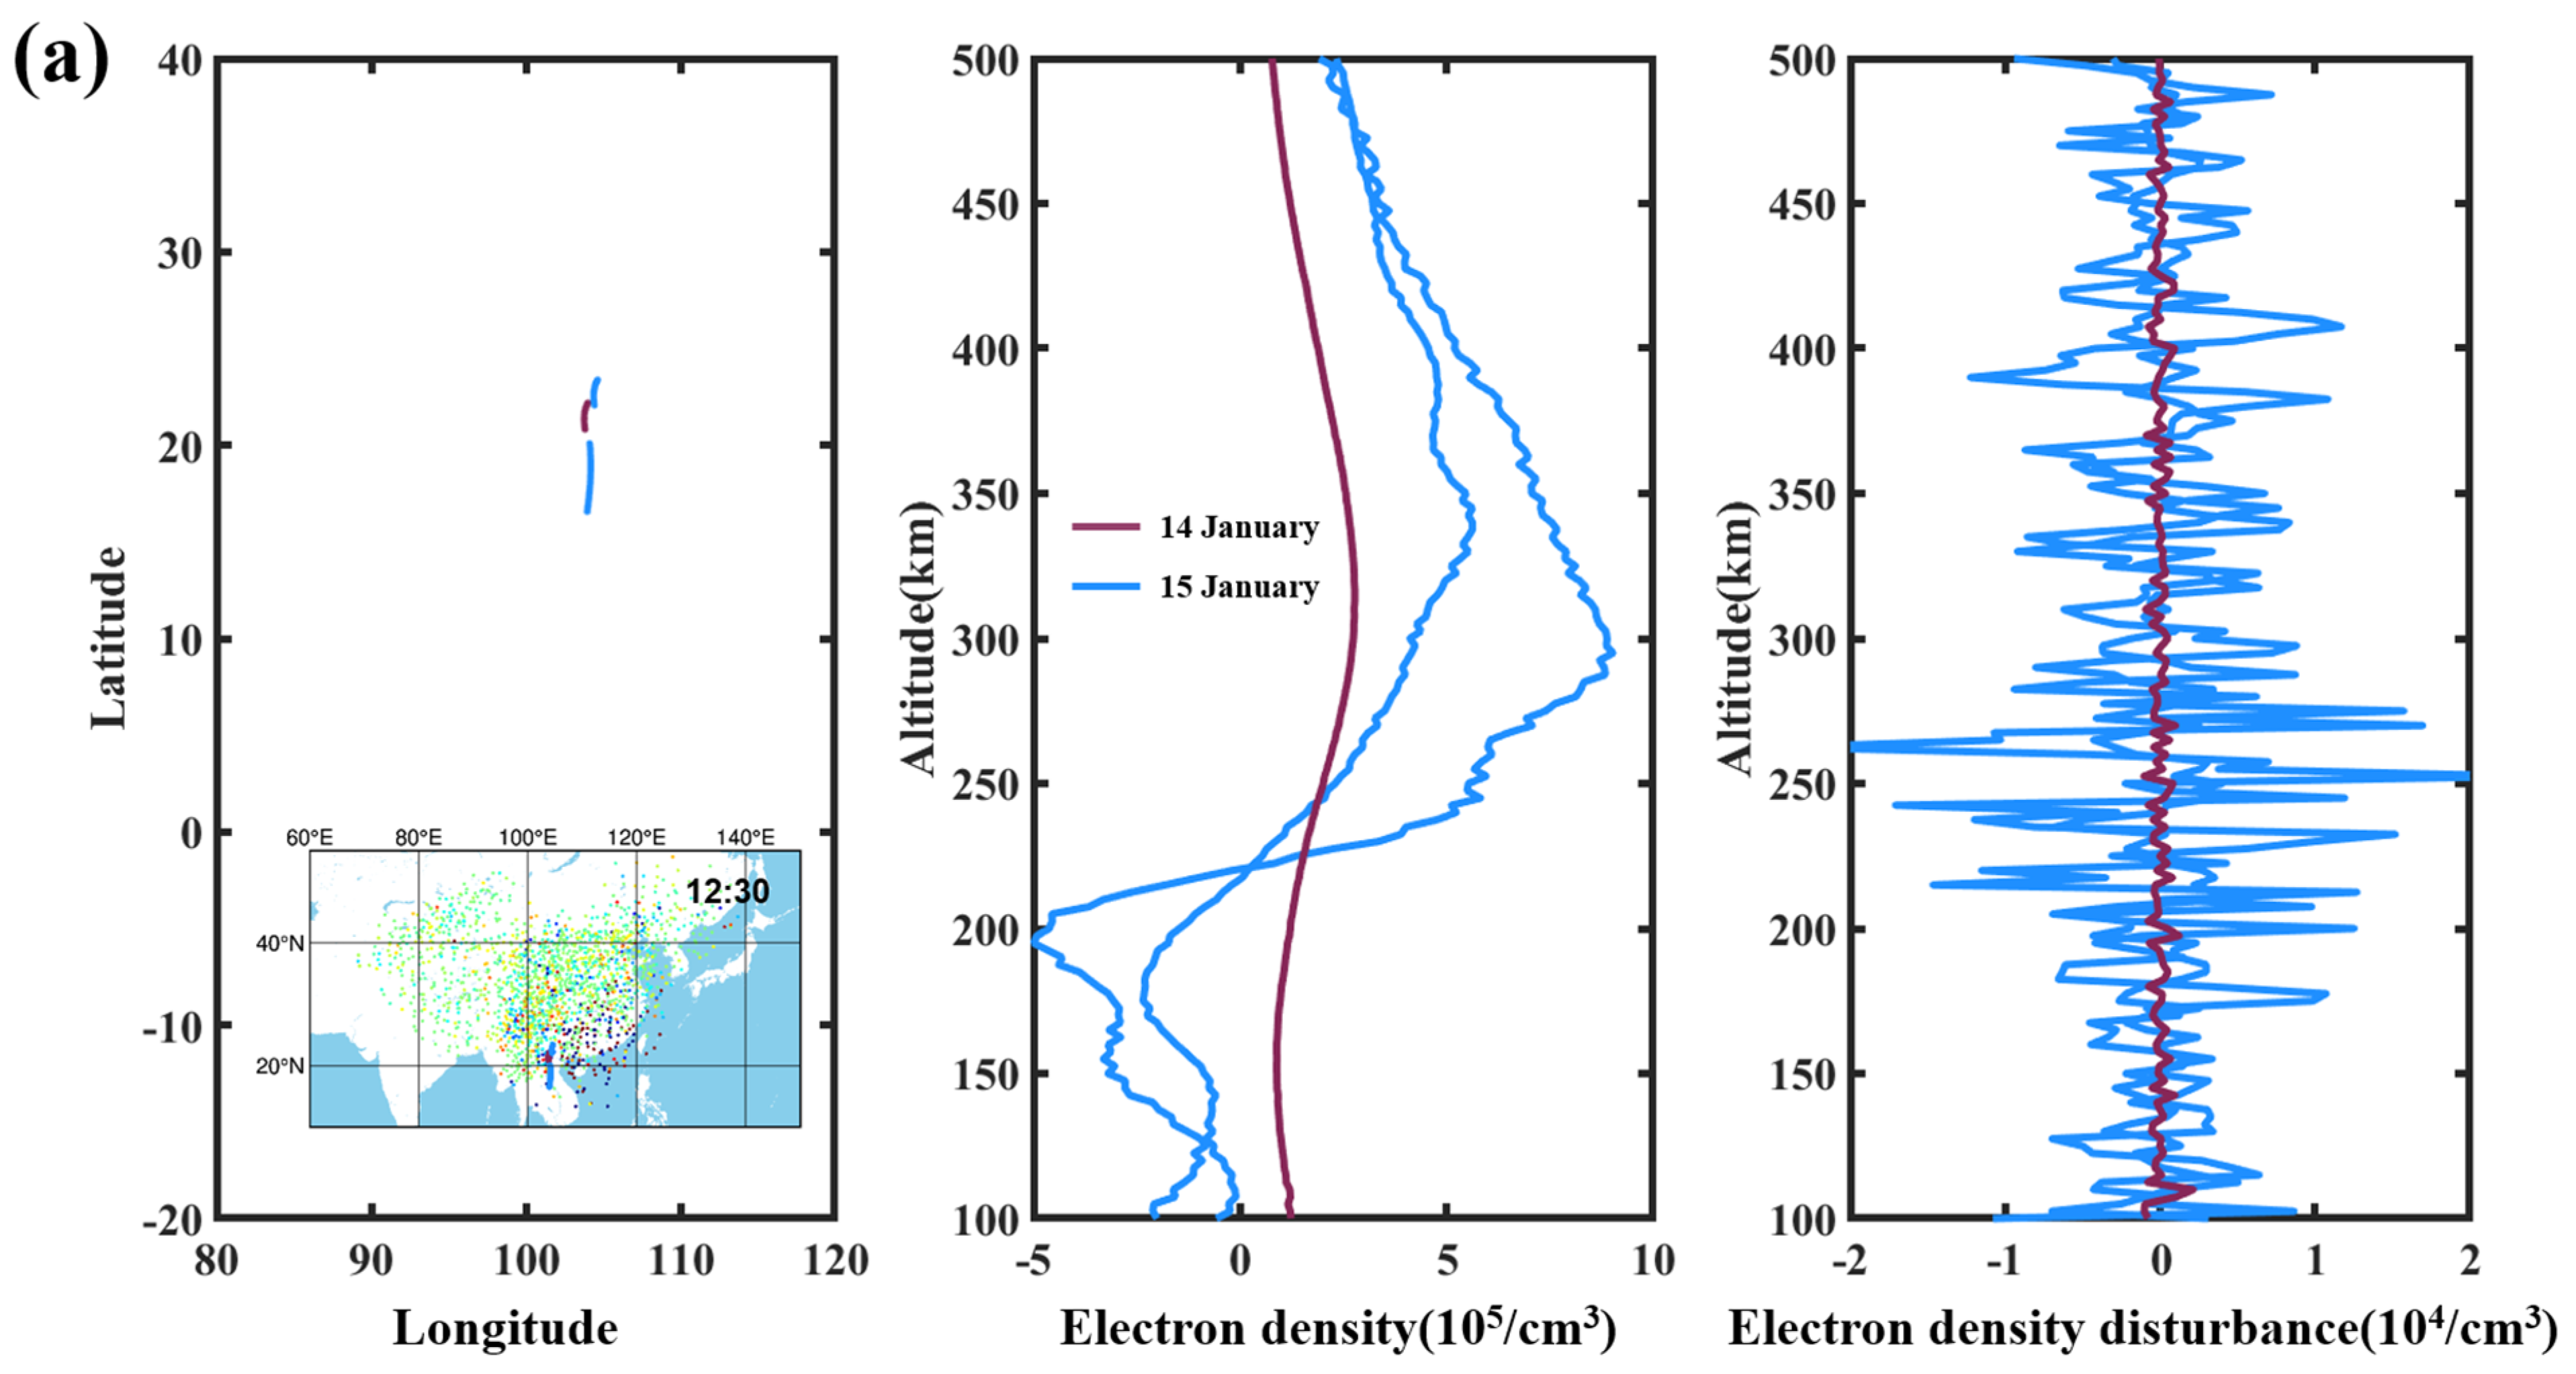
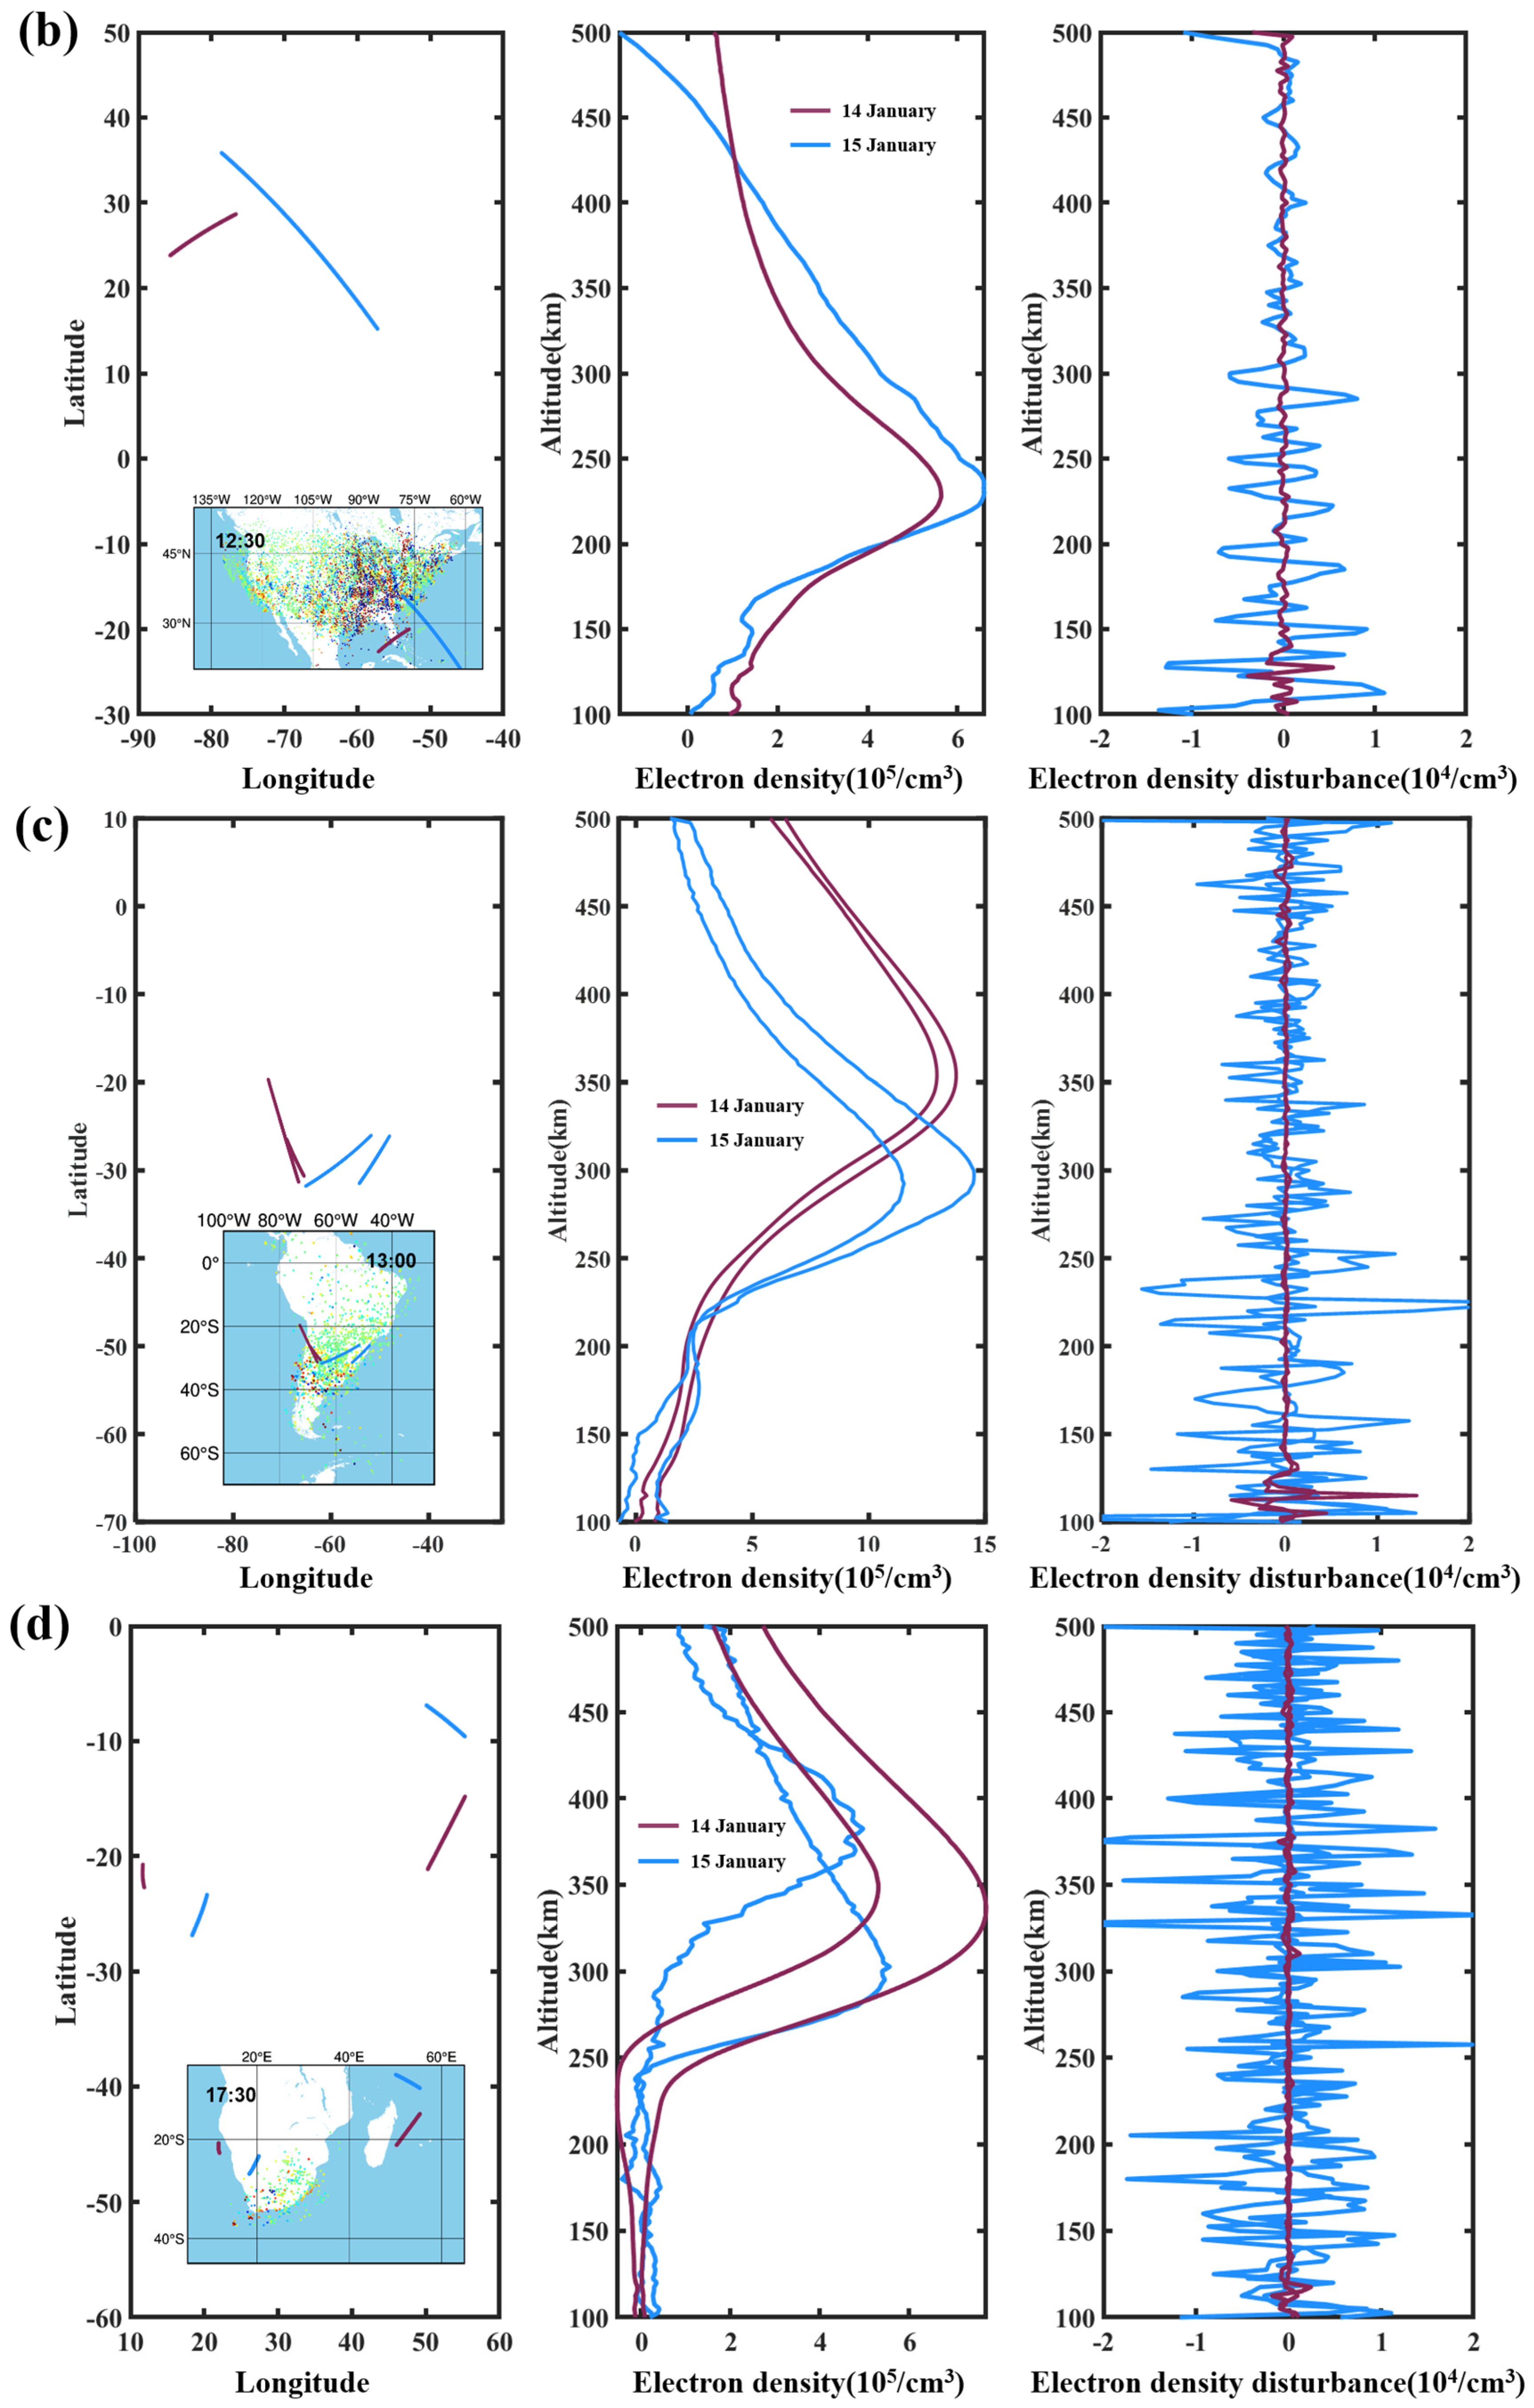
In the aforementioned analysis of the near-field COSMIC-2 profile disturbance, we found that the propagation velocity of the ionospheric disturbance caused by Lamb waves seems to be inconsistent with the southward and northward directions [44,45]. To further verify the North-South velocity difference and the ionospheric vertical structure anomaly in the far field, we selected the proper profiles from the day before and the day of the eruption with close locations and times in each analyzed TID region, and then used SSA to detrend them to extract disturbances, and the distribution of the profiles and their disturbances are shown in Figure 9.
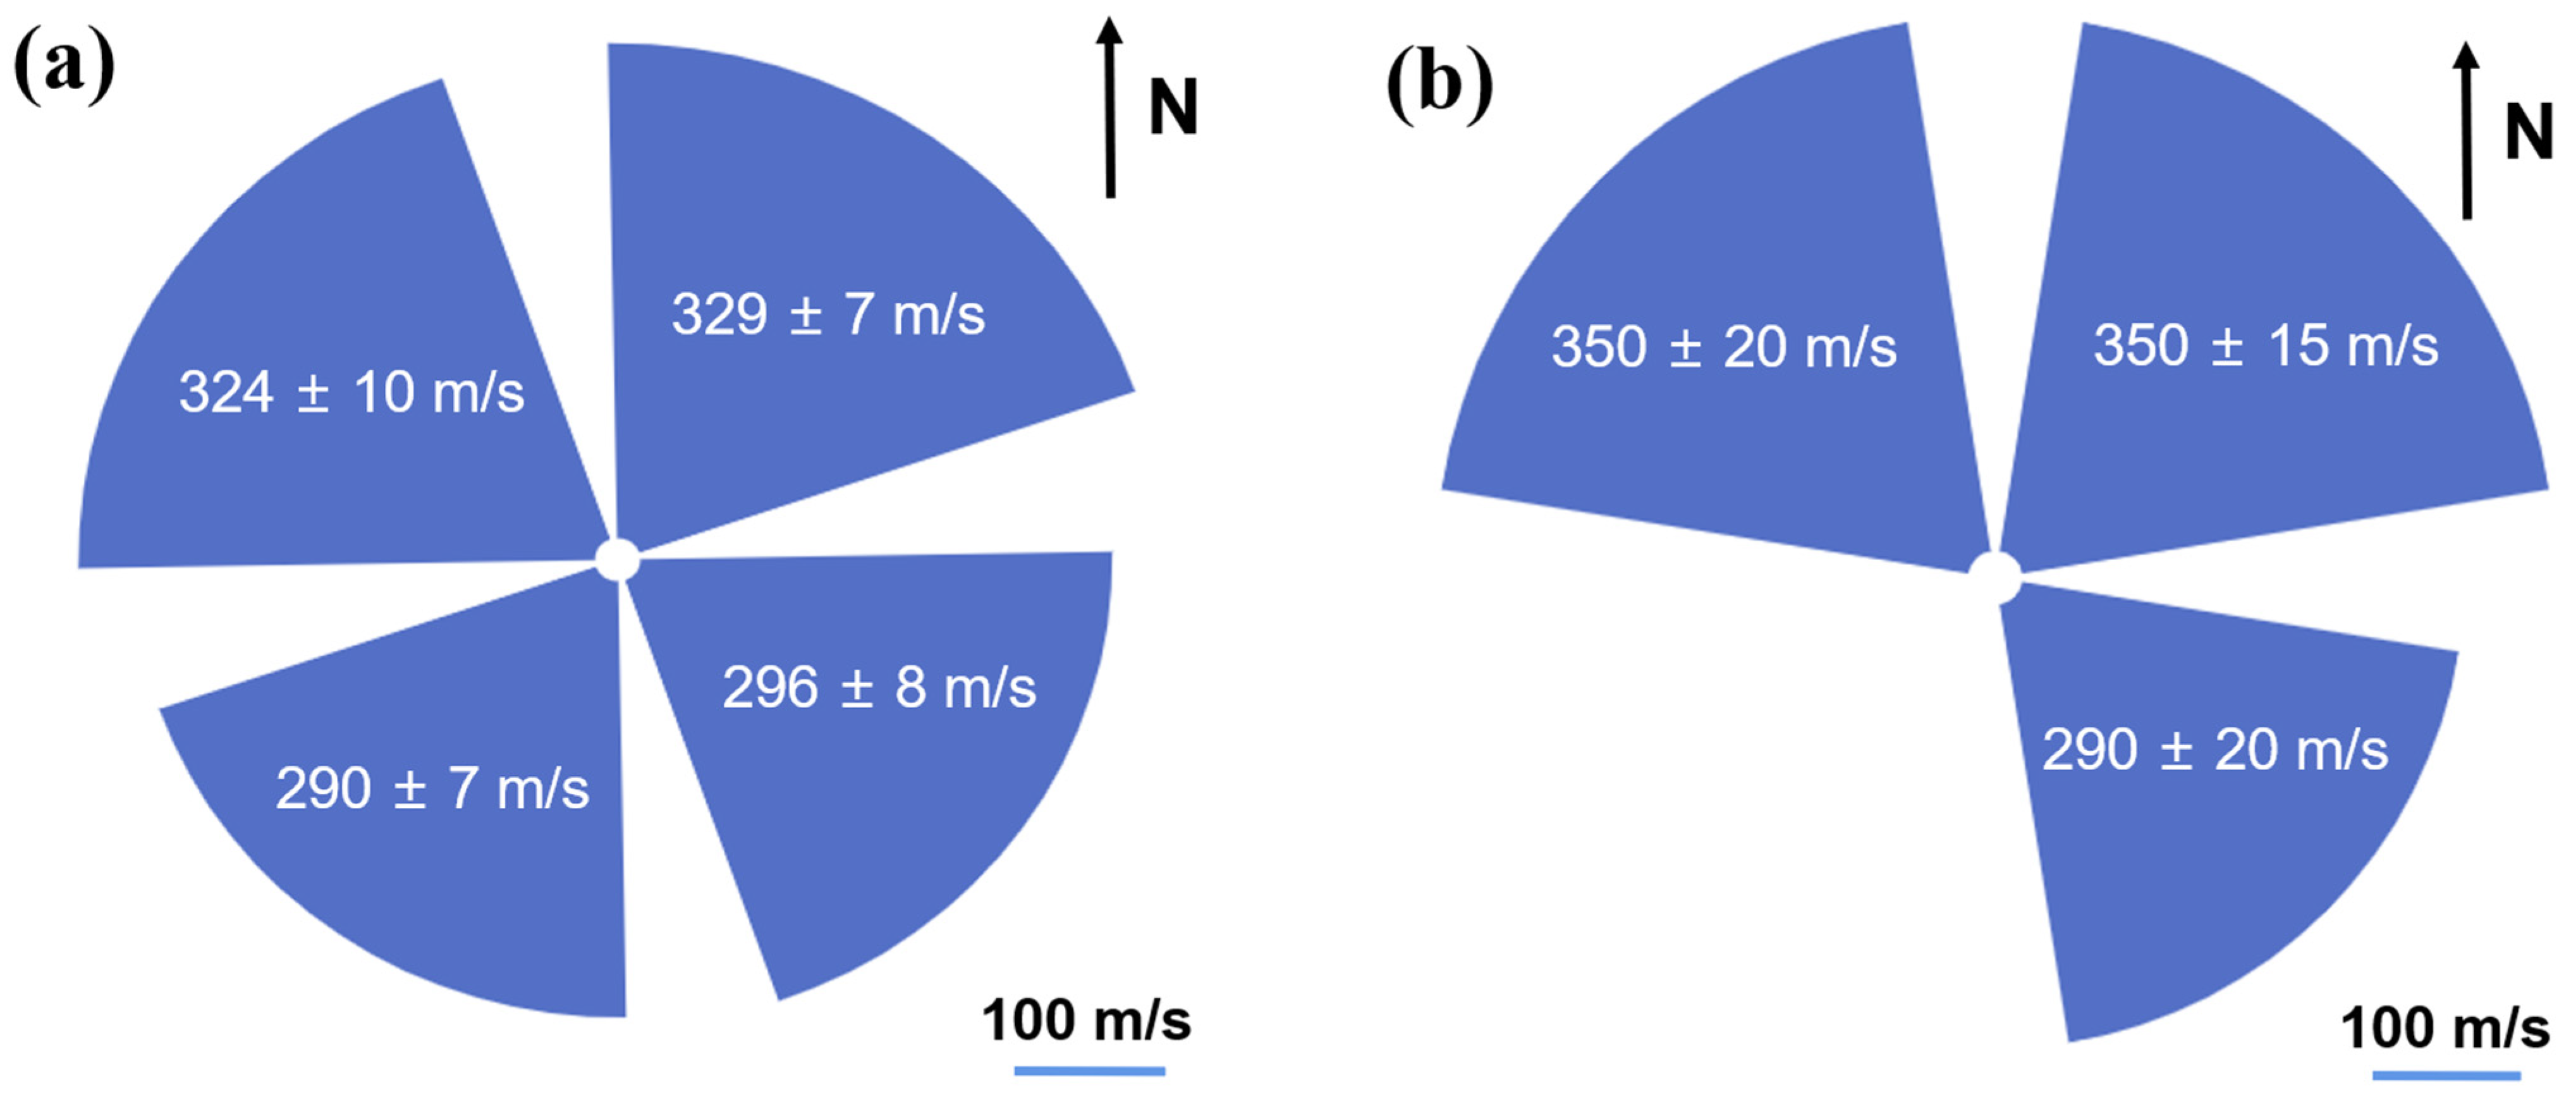
From Figure 9, we can see that the disturbance on the day of the eruption is more significant than that before the eruption, and its amplitude also indicates that it is not caused by observation errors, but by the Tonga volcano eruption. At all the moments when the TID traveled to the southeast of China, the U.S., South Africa, or southern of South America, there was a significant vertical RO oscillation over these regions. Consistent with the RO oscillation induced by the near-field Lamb wave, the far-field Lamb wave is present with a short wave with a wavelength of about 20–30 km, and the amplitude of the oscillation is also about 1.5 × 10⁴/cm3. These features show that during global propagation, the Lamb wave inputs massive energy into the atmosphere and has stimulated intensive disturbances from the bottom to the upper ionosphere. We calculated the velocity of the Lamb wave disturbance considering the duration of the Tonga eruption (10 min) and obtained the propagation velocity range of the far-field Lamb wave-induced ionospheric disturbance in each direction by analyzing RO data, as shown in Figure 10a. Similarly, we calculated the range of propagation velocities of the near-field Lamb wave-induced ionospheric disturbances in each direction based on Figure 2 and Figure 8, as shown in Figure 10b. Based on the disturbance velocity range, we can see that the propagation velocity of the ionospheric disturbance caused by Lamb waves is different in the north and south directions.
As can be seen from Figure 10, both near-field COSMIC-2 RO and far-field STEC TID prove the disturbance propagation velocity has an obvious difference in the south and north directions. The northward propagation speed of the disturbance is higher than that of the southward, in that the Coulomb force exerted by the geomagnetic field makes it easier for charged particles to move along magnetic field lines [37]. In addition, the Tonga volcanic eruption in the southern hemisphere makes the disturbance tend to propagate to the northern hemisphere.

6. Conclusions

For the research on TID caused by Tonga volcanic eruption, most scholars focused on the horizontal ionospheric disturbance caused by Lamb waves. In order to comprehensively evaluate the impact of this Tonga volcanic eruption on ionospheric disturbances, this paper not only analyzed the ionospheric disturbances caused by Lamb waves in the horizontal direction but also specifically discussed the local characteristics of the ionospheric disturbances in some regions and studied the ionospheric disturbances in the vertical direction in detail. According to the experimental analysis, we found that:
  • The disturbance of the ionosphere by the volcanic eruption of Tonga in 2022 can be divided into three processes: acoustic-gravity wave disturbance with a disturbance speed of about 1050 m/s, affecting a range of 3500 km; Lamb wave disturbance with a disturbance speed of about 326 m/s, affecting a range of 16,000 km; and tsunami wave disturbance with a disturbance speed of about 200 m/s.
  • Both acoustic-gravity waves and Lamb waves can cause high-frequency oscillations in the ionosphere in the vertical direction and cause short-wave fluctuations of 20 km, while tsunami waves cause long-wave fluctuations in the ionosphere of about 220 km, and the amplitude of the disturbance is much smaller than that of acoustic-gravity waves and Lamb waves.
  • There are local features in the TID propagation process, including the TID conjugation in Australia and the TID rapid attenuation phenomenon in Europe.
  • The propagation velocity of ionospheric disturbances induced by Lamb waves is different in the southward and northward directions, and is influenced by the magnetic field, besides, its propagation velocity to the northern hemisphere is higher than to the southern hemisphere in both the near and far fields.
This paper will provide a new reference for the related research on volcanic eruption-induced TID.

Supplementary Materials

The following supporting information can be downloaded at: https://www.mdpi.com/article/10.3390/atmos13101697/s1. Video S1: Propagation of TID in New Zealand and Australia, Video S2: Propagation of TID in China, Video S3: Propagation of TID in the United States, Video S4: Propagation of TID in South America, Video S5: Propagation of TID in Europe, Video S6: Propagation of TID in South Africa.

Author Contributions

Conceptualization, writing and funding acquisition, C.L., Q.K. and J.G.; software and formal analysis, K.S. and J.H.; investigation and validation, T.W.; methodology and resources, Q.B. and Y.C. All authors have read and agreed to the published version of the manuscript.

Funding

This work was supported by the National Natural Science Foundation of China (Grant No. 41704015, 41774001), the Shandong Natural Science Foundation of China (Grant No. ZR2017MD032, ZR2021MD030), a Project of Shandong Province Higher Education Science and Technology Program (Grant No. J17KA077), Talent introduction plan for Youth Innovation Team in universities of Shandong Province (innovation team of satellite positioning and navigation).

Data Availability Statement

The GNSS data used in this study was provided by the following organizations: Crustal Movement Observation Network of China (CMONOC, the data is not disclosed, application is required), ARGN (https://www.ga.gov.au/scientific-topics/positioning-navigation/geodesy/gnss-networks/data-and-site-logs (accessed on 16 May 2022)), Crustal Dynamics Data Information System (CDDIS, https://cddis.nasa.gov/archive/gnss/data/daily/ (accessed on 16 May 2022), registration required for access), International GNSS Service (IGS), UNAVCO (https://www.unavco.org/data/gps-gnss/gps-gnss.html (accessed on 17 May 2022)), DADOS (ftp://geoftp.ibge.gov.br/informacoes_sobre_posicionamento_geodesico/rbmc/dados/ (accessed on 16 May 2022)), TrigNet South Africa (ftp://ftp.trignet.co.za (accessed on 17 May 2022)), Système d’Observation du Niveau des Eaux Littorales (SONEL, https://www.sonel.org/ (accessed on 17 May 2022)), GPSNet (ftp://ftp.data.gnss.ga.gov.au/daily/ (accessed on 16 May 2022)), European Permanent GNSS Network (EUREF, https://www.epncb.oma.be/_networkdata/data_access/dailyandhourly/datacentres.php (accessed on 18 May 2022)), Argentina Instituto Geográfico Nacional (https://www.ign.gob.ar/NuestrasActividades/Geodesia/Ramsac/DescargaRinex (accessed on 18 May 2022)), Australian Space Weather Services (https://downloads.sws.bom.gov.au/wdc/gnss/data/ (accessed on 17 May 2022)), GeoNet New Zealand (https://www.geonet.org.nz/data/types/geodetic (accessed on 16 May 2022)). The COSMIC data used in this article are mainly provided by COSMIC Data Analysis and Archival Center (CDAAC, https://cdaac-www.cosmic.ucar.edu/ (accessed on 6 June 2022)), Taiwan Analysis Center for COSMIC (TACC, http://tacc.cwb.gov.tw (accessed on 8 June 2022)).

Conflicts of Interest

All authors declare no competing interest.

References

  1. Matoza, R.S.; Fee, D.; Assink, J.D.; Iezzi, A.M.; Green, D.N.; Kim, K.; Toney, L.; Lecocq, T.; Krishnamoorthy, S.; Lalande, J.M.; et al. Atmospheric waves and global seismoacoustic observations of the January 2022 Hunga eruption, Tonga. Science 2022, 377, 95–100. [Google Scholar] [CrossRef] [PubMed]
  2. Kubota, T.; Saito, T.; Nishida, K. Global fast-traveling tsunamis driven by atmospheric Lamb waves on the 2022 Tonga eruption. Science 2022, 377, 91–94. [Google Scholar] [CrossRef] [PubMed]
  3. Mannucci, A.J.; Wilson, B.D.; Yuan, D.N.; Ho, C.H.; Lindqwister, U.J.; Runge, T.F. A global mapping technique for GPS-derived ionospheric total electron content measurements. Radio Sci. 1998, 33, 565–582. [Google Scholar] [CrossRef]
  4. Schaer, S. Mapping and predicting the Earth’s ionosphere using the Global Positioning System. Ph.D. Dissertation, Astronomical Institute of the University of Bernese, Bernese, Switzerland, 1999. [Google Scholar]
  5. Yuan, Y.B. Study on theories and methods of correcting ionospheric delay and monitoring ionosphere based on GPS. Ph.D. Dissertation, Institute of Geodesy and Geophysics, Chinese Academy of Science, Wuhan, China, 2002. [Google Scholar] [CrossRef]
  6. Yuan, Y.; Huo, X.; Ou, J.; Zhang, K.; Chai, Y.; Wen, D.; Grenfell, R. Refining the Klobuchar ionospheric coefficients based on GPS observations. IEEE Trans. Aerosp. Electron. Syst. 2008, 44, 1498–1510. [Google Scholar] [CrossRef]
  7. Roma-Dollase, D.; Hernández-Pajares, M.; Krankowski, A.; Kotulak, K.; Ghoddousi-Fard, R.; Yuan, Y.; Gómez-Cama, J.M. Consistency of seven different GNSS global ionospheric mapping techniques during one solar cycle. J. Geodesy 2018, 92, 691–706. [Google Scholar] [CrossRef] [Green Version]
  8. Artru, J.; Ducic, V.; Kanamori, H.; Lognonné, P.; Murakami, M. Ionospheric detection of gravity waves induced by tsunamis. Geophys. J. Int. 2005, 160, 840–848. [Google Scholar] [CrossRef] [Green Version]
  9. Heki, K.; Ping, J. Directivity and apparent velocity of the coseismic ionospheric disturbances were observed with a dense GPS array. Earth Planet. Sci. Lett. 2005, 236, 845–855. [Google Scholar] [CrossRef] [Green Version]
  10. Fukao, Y.; Kobayashi, N.; Nishida, K. Background Lamb waves in the Earth’s atmosphere. Geophys. J. Int. 2014, 196, 312–316. [Google Scholar] [CrossRef] [Green Version]
  11. Zhang, S.-R.; Vierinen, J.; Aa, E.; Goncharenko, L.P.; Erickson, P.J.; Rideout, W.; Coster, A.J.; Spicher, A. 2022 Tonga Volcanic Eruption Induced Global Propagation of Ionospheric Disturbances via Lamb Waves. Front. Astron. Space Sci. 2022, 9. [Google Scholar] [CrossRef]
  12. Themens, D.R.; Watson, C.; Žagar, N.; Vasylkevych, S.; Elvidge, S.; McCaffrey, A.; Prikryl, P.; Reid, B.; Wood, A.; Jayachandran, P.T. Global Propagation of Ionospheric Disturbances Associated With the 2022 Tonga Volcanic Eruption. Geophys. Res. Lett. 2022, 49. [Google Scholar] [CrossRef]
  13. Otsuka, S. Visualizing Lamb Waves From a Volcanic Eruption Using Meteorological Satellite Himawari-8. Geophys. Res. Lett. 2022, 49. [Google Scholar] [CrossRef]
  14. Yue, X.A.; Guo, Y.H.; Zeng, Z.; Wan, W.X. GNSS radio occultation technique for near-Earth space environment detection. Chin. J. Geophys.-Chin. Ed. 2016, 59, 1161–1188. [Google Scholar] [CrossRef]
  15. An, M.Z.; Yang, Z.H.; Yu, Z.R.; Zhai, Y.F.; Gao, K. Experimental study on the tensile performance of reactive powder concrete. J. China Railw. Soc. 2010, 32, 54–58. [Google Scholar] [CrossRef]
  16. Liu, J.Y.; Chen, C.Y.; Sun, Y.Y.; Lee, I.T.; Chum, J. Fluctuations on vertical profiles of the ionospheric electron density perturbed by the March 11, 2011 M9.0 Tohoku earthquake and tsunami. GPS Solut. 2019, 23, 76. [Google Scholar] [CrossRef]
  17. Shi, K.; Guo, J.; Zhang, Y.; Li, W.; Kong, Q.; Yu, T. Multi-Dimension and Multi-Channel Seismic-Ionospheric Coupling: Case Study of Mw 8.8 Concepcion Quake on 27 February 2010. Remote Sens. 2021, 13, 2724. [Google Scholar] [CrossRef]
  18. Liu, Y.; Jin, S. Ionospheric Rayleigh Wave Disturbances Following the 2018 Alaska Earthquake from GPS Observations. Remote Sens. 2019, 11, 901. [Google Scholar] [CrossRef] [Green Version]
  19. Yuan, Y.; Ou, J. Auto-covariance estimation of variable samples (ACEVS) and its application for monitoring random ionospheric disturbances using GPS. J. Geodesy 2001, 75, 438–447. [Google Scholar] [CrossRef]
  20. Yuan, Y.; Wang, N.; Li, Z.; Huo, X. The BeiDou global broadcast ionospheric delay correction model (BDGIM) and its preliminary performance evaluation results. Navigation 2019, 66, 55–69. [Google Scholar] [CrossRef] [Green Version]
  21. Themens, D.R.; Jayachandran, P.T.; Langley, R.B.; MacDougall, J.W.; Nicolls, M.J. Determining receiver biases in GPS-derived total electron content in the auroral oval and polar cap region using ionosonde measurements. GPS Solut. 2012, 17, 357–369. [Google Scholar] [CrossRef]
  22. Yuan, Y.; Ou, J. A generalized trigonometric series function model for determining ionospheric delay. Prog. Nat. Sci. 2004, 14, 1010–1014. [Google Scholar] [CrossRef]
  23. Yuan, Y.B.; Tscherning, C.C.; Knudsen, P.; Xu, G.; Ou, J.K. The ionospheric eclipse factor method (IEFM) and its application to determining the ionospheric delay for GPS. J. Geodesy 2008, 82, 1–8. [Google Scholar] [CrossRef]
  24. Shi, K.P.; Liu, X.; Guo, J.Y.; Liu, L.; You, X.Z.; Wang, F.J. Pre-Earthquake and Coseismic Ionosphere Disturbances of the Mw 6.6 Lushan Earthquake on 20 April 2013 Monitored by CMONOC. Atmosphere 2019, 10, 216. [Google Scholar] [CrossRef] [Green Version]
  25. Jin, R.; Jin, S.; Feng, G. M_DCB: Matlab code for estimating GNSS satellite and receiver differential code biases. GPS Solut. 2012, 16, 541–548. [Google Scholar] [CrossRef]
  26. Wang, N.; Yuan, Y.; Li, Z.; Montenbruck, O.; Tan, B. Determination of differential code biases with multi-GNSS observations. J. Geodesy 2016, 90, 209–228. [Google Scholar] [CrossRef]
  27. Schumann, G.P.; Muhlhausen, J.; Andreadis, K.M. Rapid Mapping of Small-Scale River-Floodplain Environments Using UAV SfM Supports Classical Theory. Remote Sens. 2019, 11, 982. [Google Scholar] [CrossRef] [Green Version]
  28. Zhang, S.R.; Erickson, P.J.; Coster, A.J.; Rideout, W.; Vierinen, J.; Jonah, O.; Goncharenko, L.P. Subauroral and Polar Traveling Ionospheric Disturbances During the 7–9 September 2017 Storms. Space Weather 2019, 17, 1748–1764. [Google Scholar] [CrossRef] [Green Version]
  29. Rudin, L.I.; Osher, S.; Fatemi, E. Nonlinear total variation based noise removal algorithms. Phys. D. 1992, 60, 259–268. [Google Scholar] [CrossRef]
  30. Guo, J.; Shi, K.; Liu, X.; Sun, Y.; Li, W.; Kong, Q. Singular spectrum analysis of ionospheric anomalies preceding great earthquakes: Case studies of Kaikoura and Fukushima earthquakes. J. Geodyn. 2019, 124, 1–13. [Google Scholar] [CrossRef]
  31. Bretherton, F.P. Lamb waves in a nearly isothermal atmosphere. Q. J. R. Meteorol. Soc. 1969, 95, 754–757. [Google Scholar] [CrossRef]
  32. Lindzen, R.S.; Blake, D. Lamb waves in the presence of realistic distributions of temperature and dissipation. J. Geophys. Res. 1972, 77, 2166–2176. [Google Scholar] [CrossRef]
  33. Lin, J.T.; Rajesh, P.K.; Lin, C.C.; Chou, M.Y.; Liu, J.Y.; Yue, J.; Hsiao, T.Y.; Tsai, H.F.; Chao, H.M.; Kung, M.M. Rapid Conjugate Appearance of the Giant Ionospheric Lamb Wave Signatures in the Northern Hemisphere After Hunga-Tonga Volcano Eruptions. Geophys. Res. Lett. 2022, 49. [Google Scholar] [CrossRef]
  34. Shinbori, A.; Otsuka, Y.; Sori, T.; Nishioka, M.; Perwitasari, S.; Tsuda, T.; Nishitani, N. Electromagnetic conjugacy of ionospheric disturbances after the 2022 Hunga Tonga-Hunga Ha’apai volcanic eruption as seen in GNSS-TEC and SuperDARN Hokkaido pair of radars observations. Earth Planets Space 2022, 74, 1–17. [Google Scholar] [CrossRef]
  35. Chou, M.Y.; Yue, J.; Lin, C.C.; Rajesh, P.K.; Pedatella, N.M. Conjugate Effect of the 2011 Tohoku Reflected Tsunami-Driven Gravity Waves in the Ionosphere. Geophys. Res. Lett. 2022, 49. [Google Scholar] [CrossRef]
  36. Hao, Y.; Li, Q.; Guo, J.; Zhang, X.; Yang, G.; Zhang, D.; Xiao, Z. Imaging of the large-scale ionospheric disturbances induced by seismic waves using GPS network in China. Chin. J. Geophys.-Chin. Ed. 2021, 64, 3925–3932. [Google Scholar] [CrossRef]
  37. Gardner, L.C.; Schunk, R.W. Generation of traveling atmospheric disturbances during pulsating geomagnetic storms. J. Geophys. Res. Space Phys. 2010, 115. [Google Scholar] [CrossRef]
  38. Lei, X.L.; Fu, Y.; Xue, Z.G.; Du, X.Y.; Yan, W.; Lu, X. Validation of global VTEC maps constructed using data derived from COSMIC constellation. Chin. J. Space Sci. 2011, 31, 754–764. [Google Scholar] [CrossRef]
  39. Heki, K.; Fujimoto, T. Atmospheric modes excited by the 2021 August eruption of the Fukutoku-Okanoba volcano, Izu–Bonin Arc, observed as harmonic TEC oscillations by QZSS. Earth Planets Space 2022, 74, 27. [Google Scholar] [CrossRef]
  40. Liu, C.H.; Klostermeyer, J.; Yeh, K.C.; Jones, T.B.; Robinson, T.; Holt, O.; Leitinger, R.; Ogawa, T.; Sinno, K.; Kato, S.; et al. Global dynamic responses of the atmosphere to the eruption of Mount St. Helens on May 18, 1980. J. Geophys. Res. 1982, 87, 6281–6290. [Google Scholar] [CrossRef]
  41. Roberts, D.H.; Klobuchar, J.A.; Fougere, P.F.; Hendrickson, D.H. A large-amplitude traveling ionospheric disturbance produced by the May 18, 1980, explosion of Mount St. Helens. J. Geophys. Res. 1982, 87, 6291–6301. [Google Scholar] [CrossRef]
  42. Hao, Y.Q.; Xiao, Z.; Zhang, D.H. Responses of the ionosphere to the Great Sumatra earthquake and volcanic eruption of Pinatubo. Chin. Phys. Lett. 2006, 23, 1955–1957. [Google Scholar] [CrossRef]
  43. Li, W.; Guo, J.; Yue, J.; Shen, Y.; Yang, Y. Total electron content anomalies associated with global VEI4+ volcanic eruptions during 2002–2015. J. Volcanol. Geotherm. Res. 2016, 325, 98–109. [Google Scholar] [CrossRef]
  44. Chen, P.; Yao, Y.; Yao, W. On the coseismic ionospheric disturbances after the Nepal Mw7.8 earthquake on April 25, 2015 using GNSS observations. Adv. Space Res. 2017, 59, 103–113. [Google Scholar] [CrossRef]
  45. Figueiredo, C.A.O.B.; Takahashi, H.; Wrasse, C.M.; Otsuka, Y.; Shiokawa, K.; Barros, D. Medium-Scale Traveling Ionospheric Disturbances Observed by Detrended Total Electron Content Maps Over Brazil. J. Geophys. Res. Space Phys. 2018, 123, 2215–2227. [Google Scholar] [CrossRef]
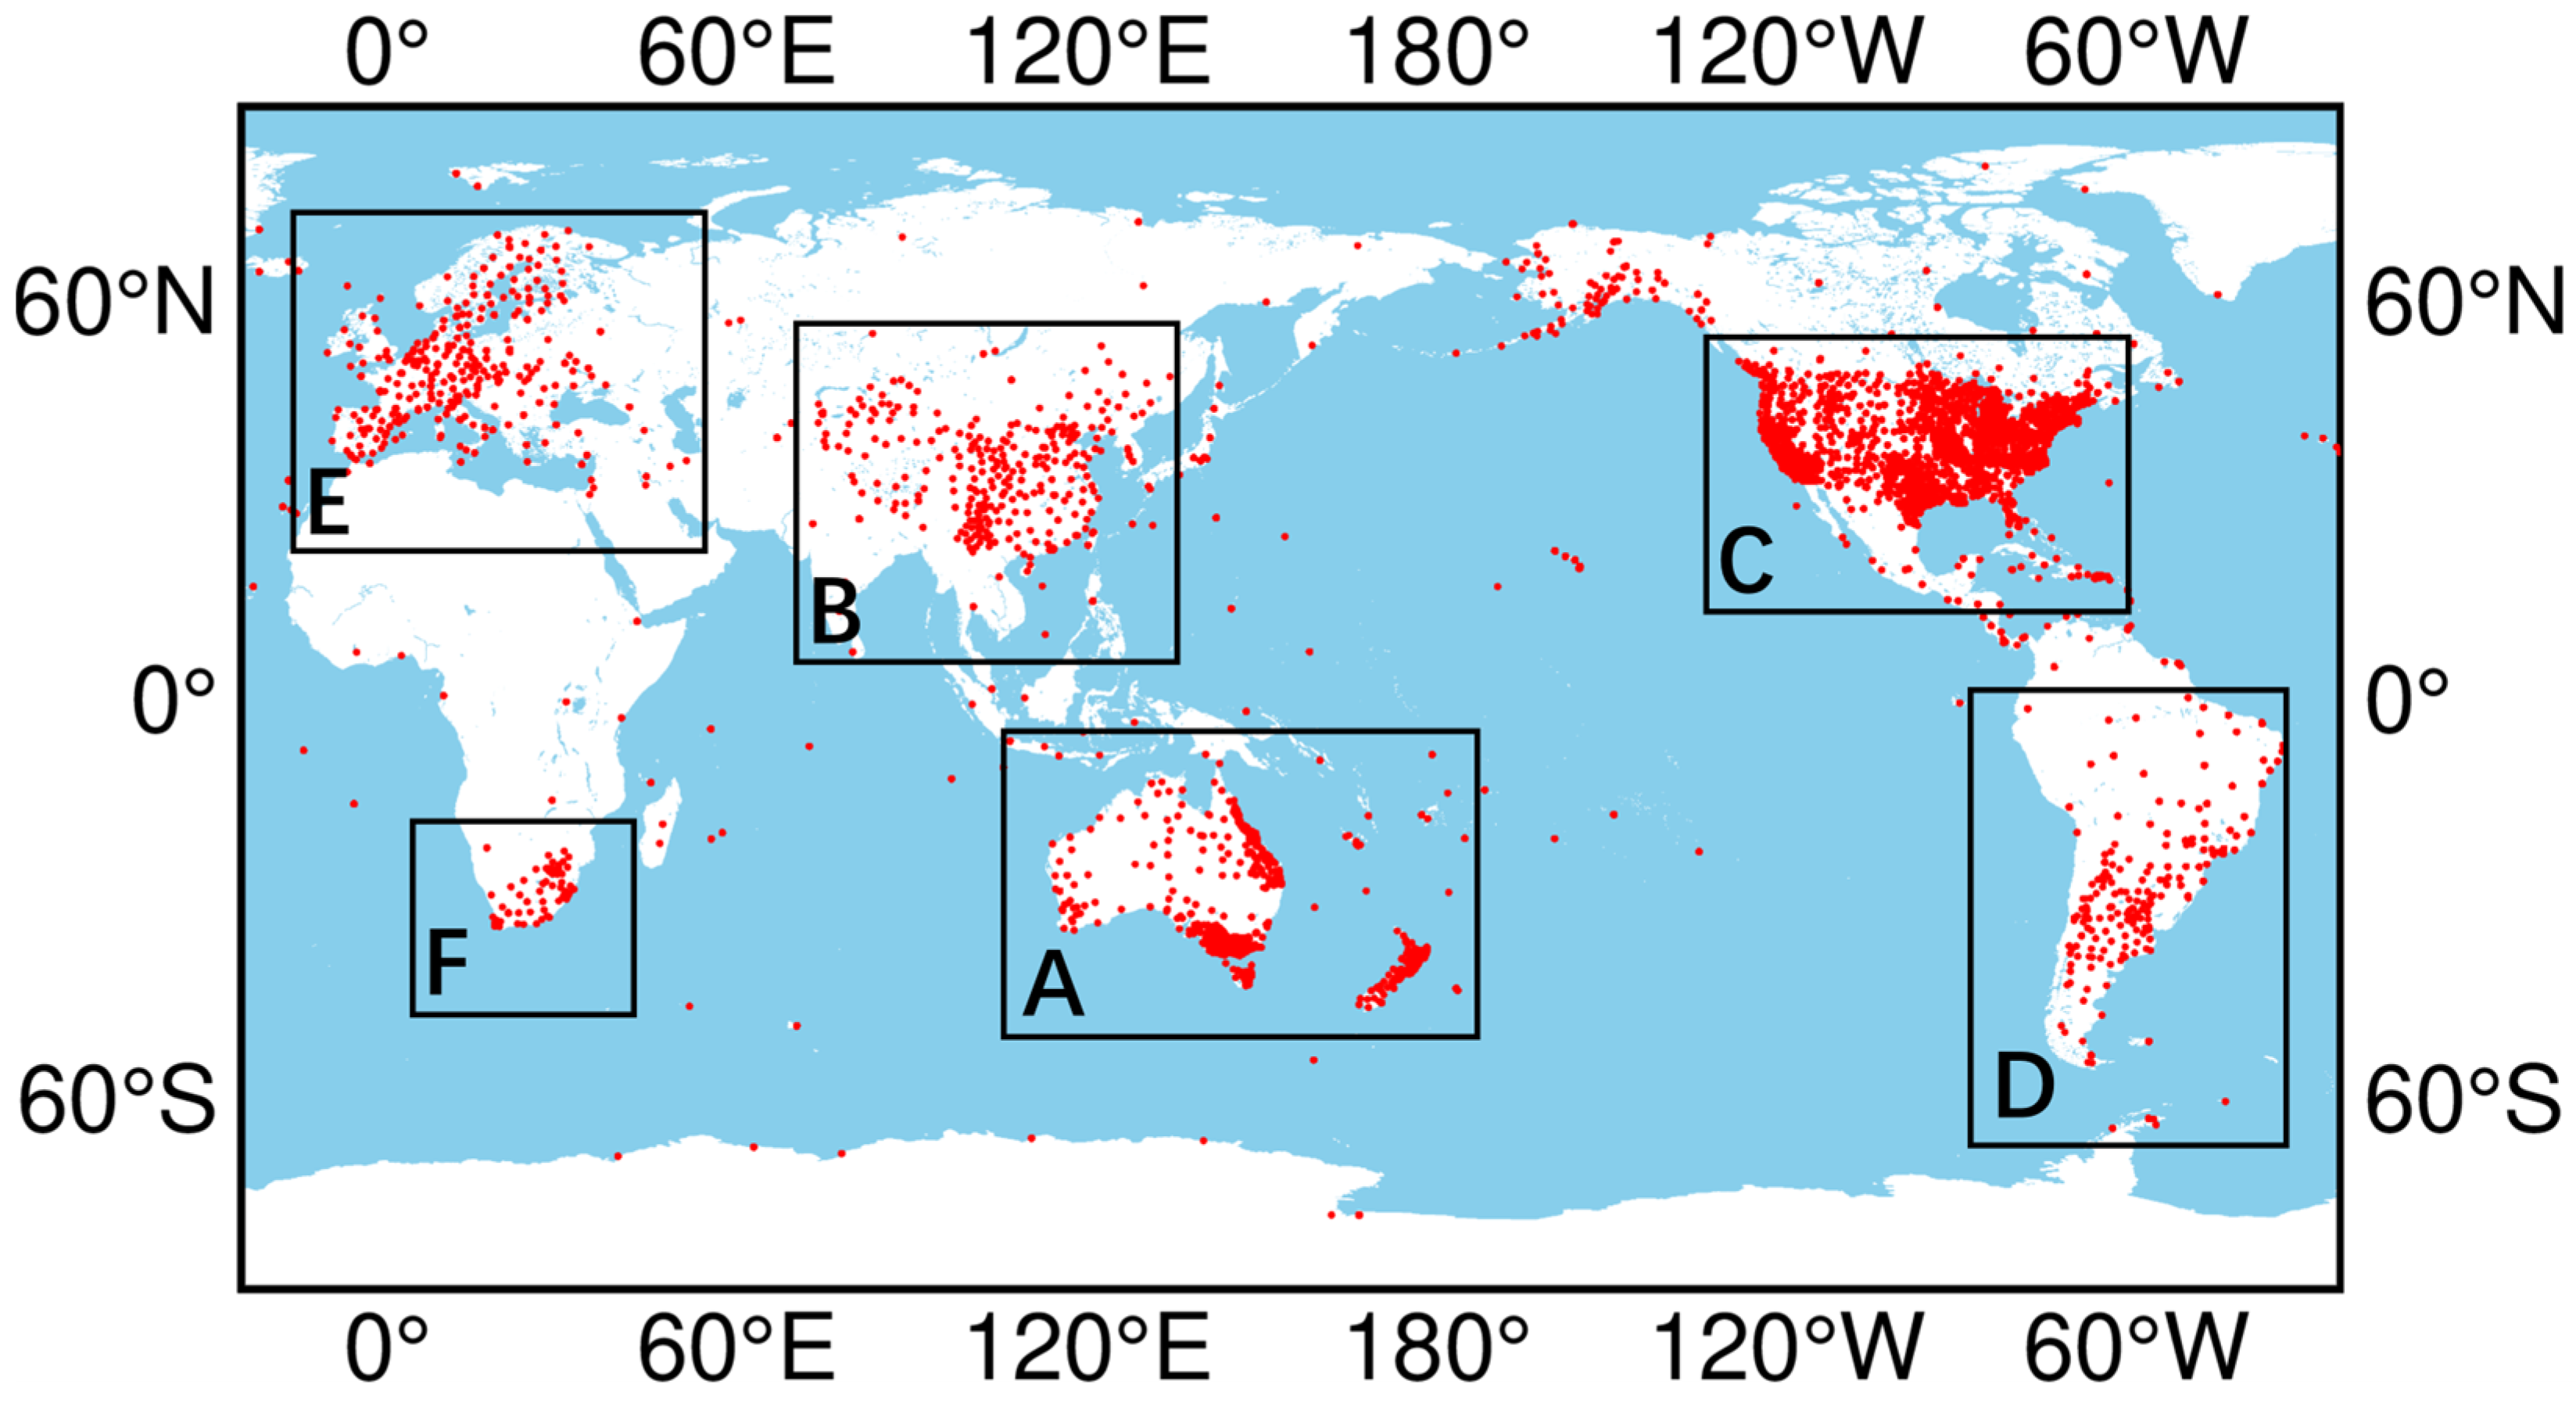
Figure 1. Over 3000 GPS stations worldwide are involved in disturbance wave analysis: New Zealand and Australia (A), China (B), US mainland (C), South America (D), Europe (E), South Africa (F).
Atmosphere 13 01697 g001
Figure 2. Distribution of 32 electron density profiles with significant disturbance anomalies within 6500 km of the volcanic eruption within 6 h of the eruption.
Atmosphere 13 01697 g002
Figure 3. Distance-time analysis of TID propagation at 450 km altitude on the day of the Tonga eruption (a) TID propagation in the near-field within 5000 km (b) TID propagation in the global 18,000 km range.
Atmosphere 13 01697 g003
Figure 4. The propagation of TID in the western Pacific Rim (a1a8) New Zealand and Australia (b1b6) China.
Atmosphere 13 01697 g004
Figure 5. The propagation of TID in the eastern Pacific Rim (a1a4) Native US (b1b4) South America.
Atmosphere 13 01697 g005
Figure 6. The propagation of TID in Europe (a1,a2) and South Africa (b1,b2).
Atmosphere 13 01697 g006
Figure 7. Comparison of the profile disturbance on 14 January and 15 January.
Atmosphere 13 01697 g007
Figure 8. 32 The electron density disturbance on 15 January (acoustic-gravity wave disturbance: Prof#1–Prof#4; Lamb wave disturbance: Prof#5–Prof#27; tsunami wave disturbance: Prof#28–Prof#32).
Atmosphere 13 01697 g008
Figure 9. Distribution of profiles and their disturbances in each area, blue indicates the profile on the day of the eruption, and purple indicates the profile on the day before the eruption. (a) In China (b) In the United States (c) In South America (d) In South Africa.
Atmosphere 13 01697 g009aAtmosphere 13 01697 g009b
Figure 10. Propagation velocity of Lamb waves in all directions caused by the eruption of Tonga volcano. (a) in the far-field. (b) in the near-field.
Atmosphere 13 01697 g010
Publisher’s Note: MDPI stays neutral with regard to jurisdictional claims in published maps and institutional affiliations.