Article

PM2.5 Pollution in Six Major Chinese Urban Agglomerations: Spatiotemporal Variations, Health Impacts, and the Relationships with Meteorological Conditions

1
Key Laboratory for Geographical Process Analysis & Simulation of Hubei Province, Central China Normal University, Wuhan 430079, China
2
Academy of Wuhan Metropolitan Area, Hubei Development and Reform Commission & Central China Normal University, Wuhan 430079, China
3
School of Geographic Sciences, Xinyang Normal University, Xinyang 464000, China
4
Henan Key Laboratory for Synergistic Prevention of Water and Soil Environmental Pollution, Xinyang Normal University, Xinyang 464000, China
*
Author to whom correspondence should be addressed.
Atmosphere 2022, 13(10), 1696; https://doi.org/10.3390/atmos13101696
Submission received: 31 August 2022 / Revised: 6 October 2022 / Accepted: 13 October 2022 / Published: 16 October 2022
(This article belongs to the Special Issue Air Quality Assessments and Management)

Abstract

:
To investigate the spatiotemporal patterns of fine particulate matter (PM2.5) under years of control measures in China, a comprehensive analysis including statistical analysis, geographical analysis, and health impact assessment was conducted on millions of hourly PM2.5 concentrations data during the period of 2017–2020 in six typical major urban agglomerations. During the period of 2017–2020, PM2.5 concentrations in the Beijing–Tianjin–Hebei urban agglomeration (BTH-UA), Central Plains urban agglomeration (CP-UA), Yangtze River Delta urban agglomeration (YRD-UA), Triangle of Central China urban agglomeration (TC-UA), Chengdu–Chongqing urban agglomeration (CY-UA), and Pearl River Delta urban agglomeration (PRD-UA) decreased at a rate of 6.69, 5.57, 5.45, 3.85, 4.66, and 4.1 µg/m3/year, respectively. PM2.5 concentration in BTH-UA decreased by 30.5% over four years, with an annual average of 44.6 µg/m3 in 2020. CP-UA showed the lowest reduction ratio (22.1%) among the six regions, making it the most polluted urban agglomeration. In southern BTH-UA, northeastern CP-UA, and northwestern TC-UA, PM2.5 concentrations with high levels formed a high–high agglomeration, indicating pollution caused by source emission in these areas was high and hard to control. Atmospheric temperature, pressure, and wind speed have important influences on PM2.5 concentrations. RH has a positive correlation with PM2.5 concentration in north China but a negative correlation in south China. We estimated that meteorological conditions can explain 16.7–63.9% of the PM2.5 changes in 129 cities, with an average of 33.4%, indicating other factors including anthropogenic emissions dominated the PM2.5 changes. Among the six urban agglomerations, PM2.5 concentrations in the CP-UA were most influenced by the meteorological change. Benefiting from the reduction in PM2.5 concentration, the total respiratory premature mortalities in six regions decreased by 73.1%, from 2017 to 2020. The CP-UA had the highest respiratory premature mortality in six urban agglomerations. We suggested that the CP-UA needs more attention and stricter pollution control measures.

1. Introduction

In the past few decades, thanks to the reform and opening-up policy, China’s economy has developed rapidly, making it the second-largest economy in the world. With the rapid social and economic progress, a lot of anthropogenic pollutants from fossil fuel combustion, vehicles, steel smelting, building construction, and so on, were emitted into the atmosphere, causing serious air pollution [1,2,3]. Regional haze cases dominated by fine particulate matter (PM2.5) were observed in several urban agglomerations in China, e.g., Beijing–Tianjin–Hebei [4,5], Yangtze River Delta [6], Pearl River Delta [7], central China [8], Sichuan Basin [9], and Fenwei Plain [10]. The heavy PM2.5 pollution threatens human health, affects visibility, and influences crop productivity [11,12,13]. It was reported that PM2.5-related premature mortality in 161 cities in China was 652 thousand, about 6.92% of total deaths in China during the year 2015 [14]. Li et al. [15] determined the total number of PM2.5-related deaths nationwide to be 1.31 million, in 2016, in China, of which lung cancer, chronic obstructive pulmonary disease, ischemic heart disease, and stroke represented 0.13, 0.13, 0.42, and 0.62 million, respectively. In provincial-level administrative divisions, high premature deaths were mainly concentrated in the North China Plain, with the highest per capita premature mortality in the Xinjiang Uygur Autonomous Region, Henan, Hebei, and Shandong [16]. According to the unchanged population scenario, Wang et al. [17] estimated about 0.83 million premature deaths related to PM2.5 exposure, in 2020. The economic loss due to PM2.5 pollution was up to about USD 86,900 million per year, which accounted for about 1.7% of China’s gross domestic product [18]. PM2.5 can significantly reduce average wheat yield through interaction with temperature and sunshine, two key elements of solar radiation [19].
To deal with serious regional PM2.5 pollution, the Chinese government has taken many anthropogenic emissions-controlling measures, such as reducing coal use, upgrading gasoline quality, encouraging public transport, and reducing straw combustion [20,21]. These measures have worked well, resulting in a significant decrease in the PM2.5 concentration across China in recent years [22,23]. Recently, some studies aimed to reveal the spatiotemporal distributions of PM2.5. In general, the PM2.5 concentration is higher in the north than in the south of China [24]. In terms of temporal variation, PM2.5 pollution mainly occurs in autumn and winter [25]. A positive spatial autocorrelation of PM2.5 concentration was found in the Beijing–Tianjin–Hebei, Central Plain, Cheng–Yu urban agglomerations, and the Huaihai Economic Region [26]. Previous studies have demonstrated that meteorological conditions have an important influence on the accumulation and diffusion of PM2.5 through multiple mechanisms [27]. Precipitation exerts the removal processes of PM2.5 [28]. Relative humidity (RH) influences the secondary formation and the hygroscopic growth of PM2.5 [29,30]. Wind determines the dilution and diffusion of fine particles [31]. Air temperature can affect atmospheric stability and chemical reaction rates [32]. Great changes in meteorological conditions across China cause notable characteristics of meteorological influences on PM2.5 concentrations [27].
Previous studies mainly focused on a city or region of China to clarify the spatiotemporal variations or health impacts of PM2.5, or meteorological conditions that influence PM2.5. Comprehensive and comparative analyses of the above issue from the point of view of urban agglomerations are lacking. Several studies have investigated the spatiotemporal variations of PM2.5 in urban agglomerations. For example, Shen et al. [26] investigated spatiotemporal characteristics of PM2.5 in nine typical urban agglomerations and one economic region in China, which found that PM2.5 decreased from 2015 to 2017, and PM2.5 showed positive spatial autocorrelation in all urban agglomerations (except the Northern Slope of Tianshan Mountain urban agglomeration). Xu et al. [33] explored the spatiotemporal heterogeneity of PM2.5 in 11 urban agglomerations in China, which found that PM2.5 concentration remains at a high level for most of the urban agglomerations, and PM2.5 displayed significant spatial heterogeneity characteristics. Several studies aimed to reveal the meteorological influences on PM2.5 pollution. For example, Yang et al. [34] revealed that RH is positively correlated with PM2.5 concentration in north China and Urumqi, but the relationship turns to negative in other areas of China, and wind speed is negatively correlated with PM2.5 everywhere except for Hainan Island. Deng et al. [35] found that precipitation and temperature mainly showed negative impacts on PM2.5 pollution, while wind speed, relative humidity and sunshine duration aggravated PM2.5 pollution in the BTH-UA. To sum up, comprehensive and comparative analyses that combine spatiotemporal variations, health impacts, and meteorological influences of PM2.5 pollution among different urban agglomerations in China are insufficient. In addition, few studies focused on the Central Plains urban agglomeration and the Triangle of Central China urban agglomeration, which suffered from serious air pollution [36,37]. To understand more about the PM2.5 concentration change and access the effect of strict pollution control measures in recent years across China, the present study focuses on six urban agglomerations in China to reveal the spatiotemporal patterns and health effects of PM2.5 and relationships between PM2.5 with meteorological conditions, by using multiple methods including statistical analysis, geographical analysis, and health impact assessment. In the present study, we (1) study the annual, seasonal, monthly, and diurnal changes in PM2.5 concentrations in six urban agglomerations, (2) illustrate the spatial distribution patterns and trends, (3) investigate the impact of meteorological conditions, and (4) estimate the health risks of PM2.5. Our findings can broaden the knowledge of the spatiotemporal characteristics of PM2.5 in China, and will be helpful for further reduction in PM2.5 concentration.

2. Data and Methods

2.1. Study Area

As displayed in Figure 1, six major regions in China were included in this study, i.e., Beijing–Tianjin–Hebei urban agglomeration (BTH-UA), Central Plains urban agglomeration (CP-UA), Yangtze River Delta urban agglomeration (YRD-UA), Triangle of Central China urban agglomeration (TC-UA), Chengdu–Chongqing urban agglomeration (CY-UA), and Pearl River Delta urban agglomeration (PRD-UA). BTH-UA is the capital economic circle of China [4], located in northern China, including two megacities, Beijing and Tianjin. BTH-UA is the region with the most serious PM2.5 pollution in China. CP-UA is the largest urban agglomeration in Central China and an important growth pole of China’s economy [37]. Due to rapid industrialization and large consumption of energy, the CP-UA is burdened by serious air pollution problems [38]. Zhengzhou is the regional central city of the CP-UA. YRD-UA is located in the lower reaches of the Yangtze River in China and is one of the most economically developed zones [6], including Shanghai, Nanjing, Hangzhou, Hefei, Wuxi, Suzhou, and other cities. The TC-UA [39], a new pillar of China’s economic development with a unique ecosystem, also suffers from severe air pollution due to intense anthropogenic emissions. The TC-UA has 31 cities, including Wuhan, Changsha, and Nanchang. CY-UA, located in western China, including two metropolises, Chengdu and Chongqing, frequently experienced serious PM2.5 episodes due to the low atmospheric environmental carrying capacity [29]. PRD-UA [40], an important economic center, is located in the coastal part of southern China, including megacities Guangzhou and Shenzhen. The regional air pollution caused by photochemical smog and haze fog has become an urgent environmental problem in the PRD-UA [40].

2.2. Data Source and Description

The four years of hourly PM2.5 concentrations in 129 cities of six urban agglomerations between January 2017 and December 2020 were obtained from the Data Center of the PRC Ministry of Ecology and Environment (https://www.mee.gov.cn/, last access: 31 August 2022). Daily, monthly, seasonal, and annual mean PM2.5 concentrations for the cities and urban agglomerations were calculated from the hourly PM2.5 concentrations.
The daily meteorological conditions in 129 cities during the period of 2017–2020, including air temperature (T), atmospheric pressure (P), RH, wind speed (WS), precipitation (Pre), and duration of sunshine (SSD), were obtained from the weather monitoring network of China Meteorological Administration (http://data.cma.cn/, accessed on 31 August 2022).

2.3. Spatiotemporal Variation Analysis Methods

2.3.1. Kernel Density Estimation

Kernel density estimation (KDE) is a nonparametric test method, which does not add any assumptions to the data distribution. KDE determines the data distribution characteristics from the data samples themselves. KDE was used to calculate the PM2.5 density function, which is defined as:
f x = 1 a b i = 1 a A x i x b
where a is the number of data points, b denotes the bandwidth, and A represents the kernel weighting function. The Gaussian kernel was used in this study.

2.3.2. Empirical Orthogonal Function Analysis

The empirical orthogonal function (EOF) is a dimensionality reduction analysis and is widely used in meteorological parameters analysis to identify patterns of simultaneous variation [41,42]. In this study, we decomposed the original time series of PM2.5 (expressed as Pmn:m represents the space point, n is observation time) into a linear combination of spatial eigenvector matrix V and the orthogonal time matrix Z:
P m n = V Z = v 11 v 1 n v m 1 v m n z 11 z 1 n z m 1 z m n
P P T = V Z Z T V T = V Λ V T
where Λ is a diagonal matrix composed of the eigenvalues of the matrix, and V represents a matrix composed of the matrix eigenvectors.
Thus, the time coefficient can be defined as:
Z = V T P
To investigate the spatial-temporal characteristics of the PM2.5 mass concentration in six urban regions, we implemented EOF analysis by programming in Python, to decompose the monthly PM2.5 concentrations.

2.3.3. Standard Deviational Ellipse

The standard deviation ellipse (SDE), or directional distribution, is a classical analytical method in geoscience research. The SDE can express the main distribution direction of a set of points and the degree of dispersion in every direction [43]. The calculated major and minor axes of the ellipse represent the direction and range of the data distribution, respectively. The mean center of the ellipse indicates the center location in a dataset. In this study, the annual moving traces of PM2.5 concentrations, from 2017 to 2020, in six regions were demonstrated by the SDE. More details about the SDE definition and calculation method can be found in the previous studies [43,44]. In this study, SDE analysis was performed by the package of ASPACE in R software.

2.3.4. Spatial Autocorrelation Analysis

PM2.5 pollutions display spatial autocorrelation in geographical space. To measure the spatial autocorrelation of PM2.5 concentrations in six urban agglomerations, the global Moran’s I was calculated. The definition and calculation formula of global Moran’s I have been introduced in previous studies [45,46]. A value of Moran’s I greater than 0 indicates a positive spatial correlation, and the greater the value, the more obvious the spatial correlation.
In contrast, a value less than 0 suggests a negative spatial correlation, and the smaller the value, the greater the spatial difference. A value of Moran’s I equal to 0 indicates no spatial autocorrelation.
To reveal the PM2.5 features of an urban spatial agglomeration within a region, the local Moran’s I was employed to identify the spatial pattern. After calculating the local Moran’s I, the Moran scatter plot was employed to discuss the local spatial agglomeration pattern of PM2.5 in each urban agglomeration. Moran scatter plot has four quadrants, namely four spatial association modes [37,45]: the first (third) quadrant is cities with high (low) PM2.5 concentrations, which suggests high–high (low–low) agglomeration. The second (fourth) quadrant indicates that the cities with low (high) PM2.5 concentrations are surrounded by cities with high (low) PM2.5 concentrations, suggesting low–high (high–low) agglomeration.

2.4. Health Effect Assessment

In this study, we used the human health impact function to estimate the short-term health impacts attributable to PM2.5. The health impact function is a classic risk assessment method [11,46], which has been recommended by the Chinese Ministry of Ecology and Environment and EPA. The premature mortality attributed to PM2.5 exposure is estimated as follows:
Δ M = y 0 N R R 1 / R R
where ΔM is the excess mortalities attributable to PM2.5 exposure, y0 denotes the baseline mortality rate for a given period, N indicates the exposed population, and RR represents the relative risk. RR is calculated by:
R R = exp β C C 0
where β is the concentration–response factor, based on epidemiology, that is, the impact of 1 µg/m3 PM2.5 concentration increment on the incidence of the health endpoint; C and C0 represent PM2.5 concentration and threshold concentration, respectively.
This study considers one health endpoint for PM2.5, i.e., respiratory disease. The population data in 129 cities in six regions are obtained from the seventh population census of China. The mortality rate for respiratory disease from 2017 to 2020 is collected from China Statistical Yearbook issues 2018, 2019, 2020, and 2021 (http://www.stats.gov.cn/tjsj/ndsj/, accessed on 24 July 2022), which is 67.20, 68.02, 65.02, and 55.36 per 100,000 population, respectively. Referring to the previous studies [18,47], for every 10 µg/m3 increase in the mean concentration of PM2.5, respiratory mortality increased by 1.43%, which is β is 1.43% in this study. The threshold concentration of C0 is 35.0 µg/m3, as suggested by the Chinese Ministry of Ecology and Environment.

3. Temporal Variations of PM2.5 in Six Urban Agglomerations

3.1. Annual Variation

The estimated kernel density of PM2.5 concentrations in six urban agglomerations from 2017 to 2020 is displayed in Figure 2. The average concentration of PM2.5 in the period of 2017–2020 in BTH-UA, CP-UA, YRD-UA, TC-UA, CY-UA, and PRD-UA was 53.5, 59.8, 42.4, 42.0, 41.4, and 28.7 µg/m3, respectively. The average decrease rate of PM2.5 concentration in six urban agglomerations was 6.69, 5.57, 5.45, 3.85, 4.66, and 4.1 µg/m3/year (Figure S1), respectively. In BTH-UA (Figure 2a), the vertices of the curve steeped and moved to the left with year, indicating a continuous reduction in PM2.5 concentrations. The annual mean PM2.5 concentration in BTH-UA from 2017 to 2020 was 64.3 ± 18.2, 55.3 ± 13.8, 50.0 ± 12.5, and 44.6 ± 10.7 µg/m3, respectively. The 30.6% reduction in PM2.5 concentration in BTH-UA over four years can be attributed to the “2 + 26” regional strategy for air quality improvement, in great measure. To promote the regional integration of air pollution control, the PRC Ministry of Ecology and Environment conducted the “2017 Air Pollution Prevention and Management Plan for the Beijing–Tianjin–Hebei region and its Surrounding Areas” [48,49]. This plan suggests that Beijing, Tianjin, eight cities in Hebei Province, four cities in Shanxi Province, seven cities in Shandong Province, and seven cities in Henan Province make joint efforts to control PM2.5 pollution [48]. Nearly half of the cities in CP-UA are included in this plan. The PM2.5 concentration in CP-UA decreased from 2017 to 2020 (Figure 2b), with yearly mean concentrations of 66.8, 61.6, 58.8, and 51.8 µg/m3, respectively. The area covered by density curves decreased with time at PM2.5 concentrations greater than 75 μg/m3 in CP-UA, suggesting that reductions in cities with high PM2.5 concentrations benefitted regional PM2.5 pollution alleviation. A significant PM2.5 concentration decrease was also observed in YRD-UA (Figure 2c), with a 29.3% reduction ratio from 2017 to 2020. In YRD-UA, the proportion of cities that meet the China National Ambient Air Quality Standards I (CAAQS grade I; 35 μg/m3) increased from 9.8%, in 2017, to 53.7%, in 2020. In TC-UA (Figure 2d), the PM2.5 concentration increased slightly in 2019, while decreasing significantly in 2020, which was related to the lockdown during the COVID-19 epidemic [50]. In CY-UA (Figure 2e), the regional PM2.5 concentration was 34.9 μg/m3, meeting the CAAQS grade I. In six regions, PRD-UA has the lowest PM2.5 concentration (Figure 2f), with 21.3 μg/m3 in 2020.

3.2. Monthly Variation

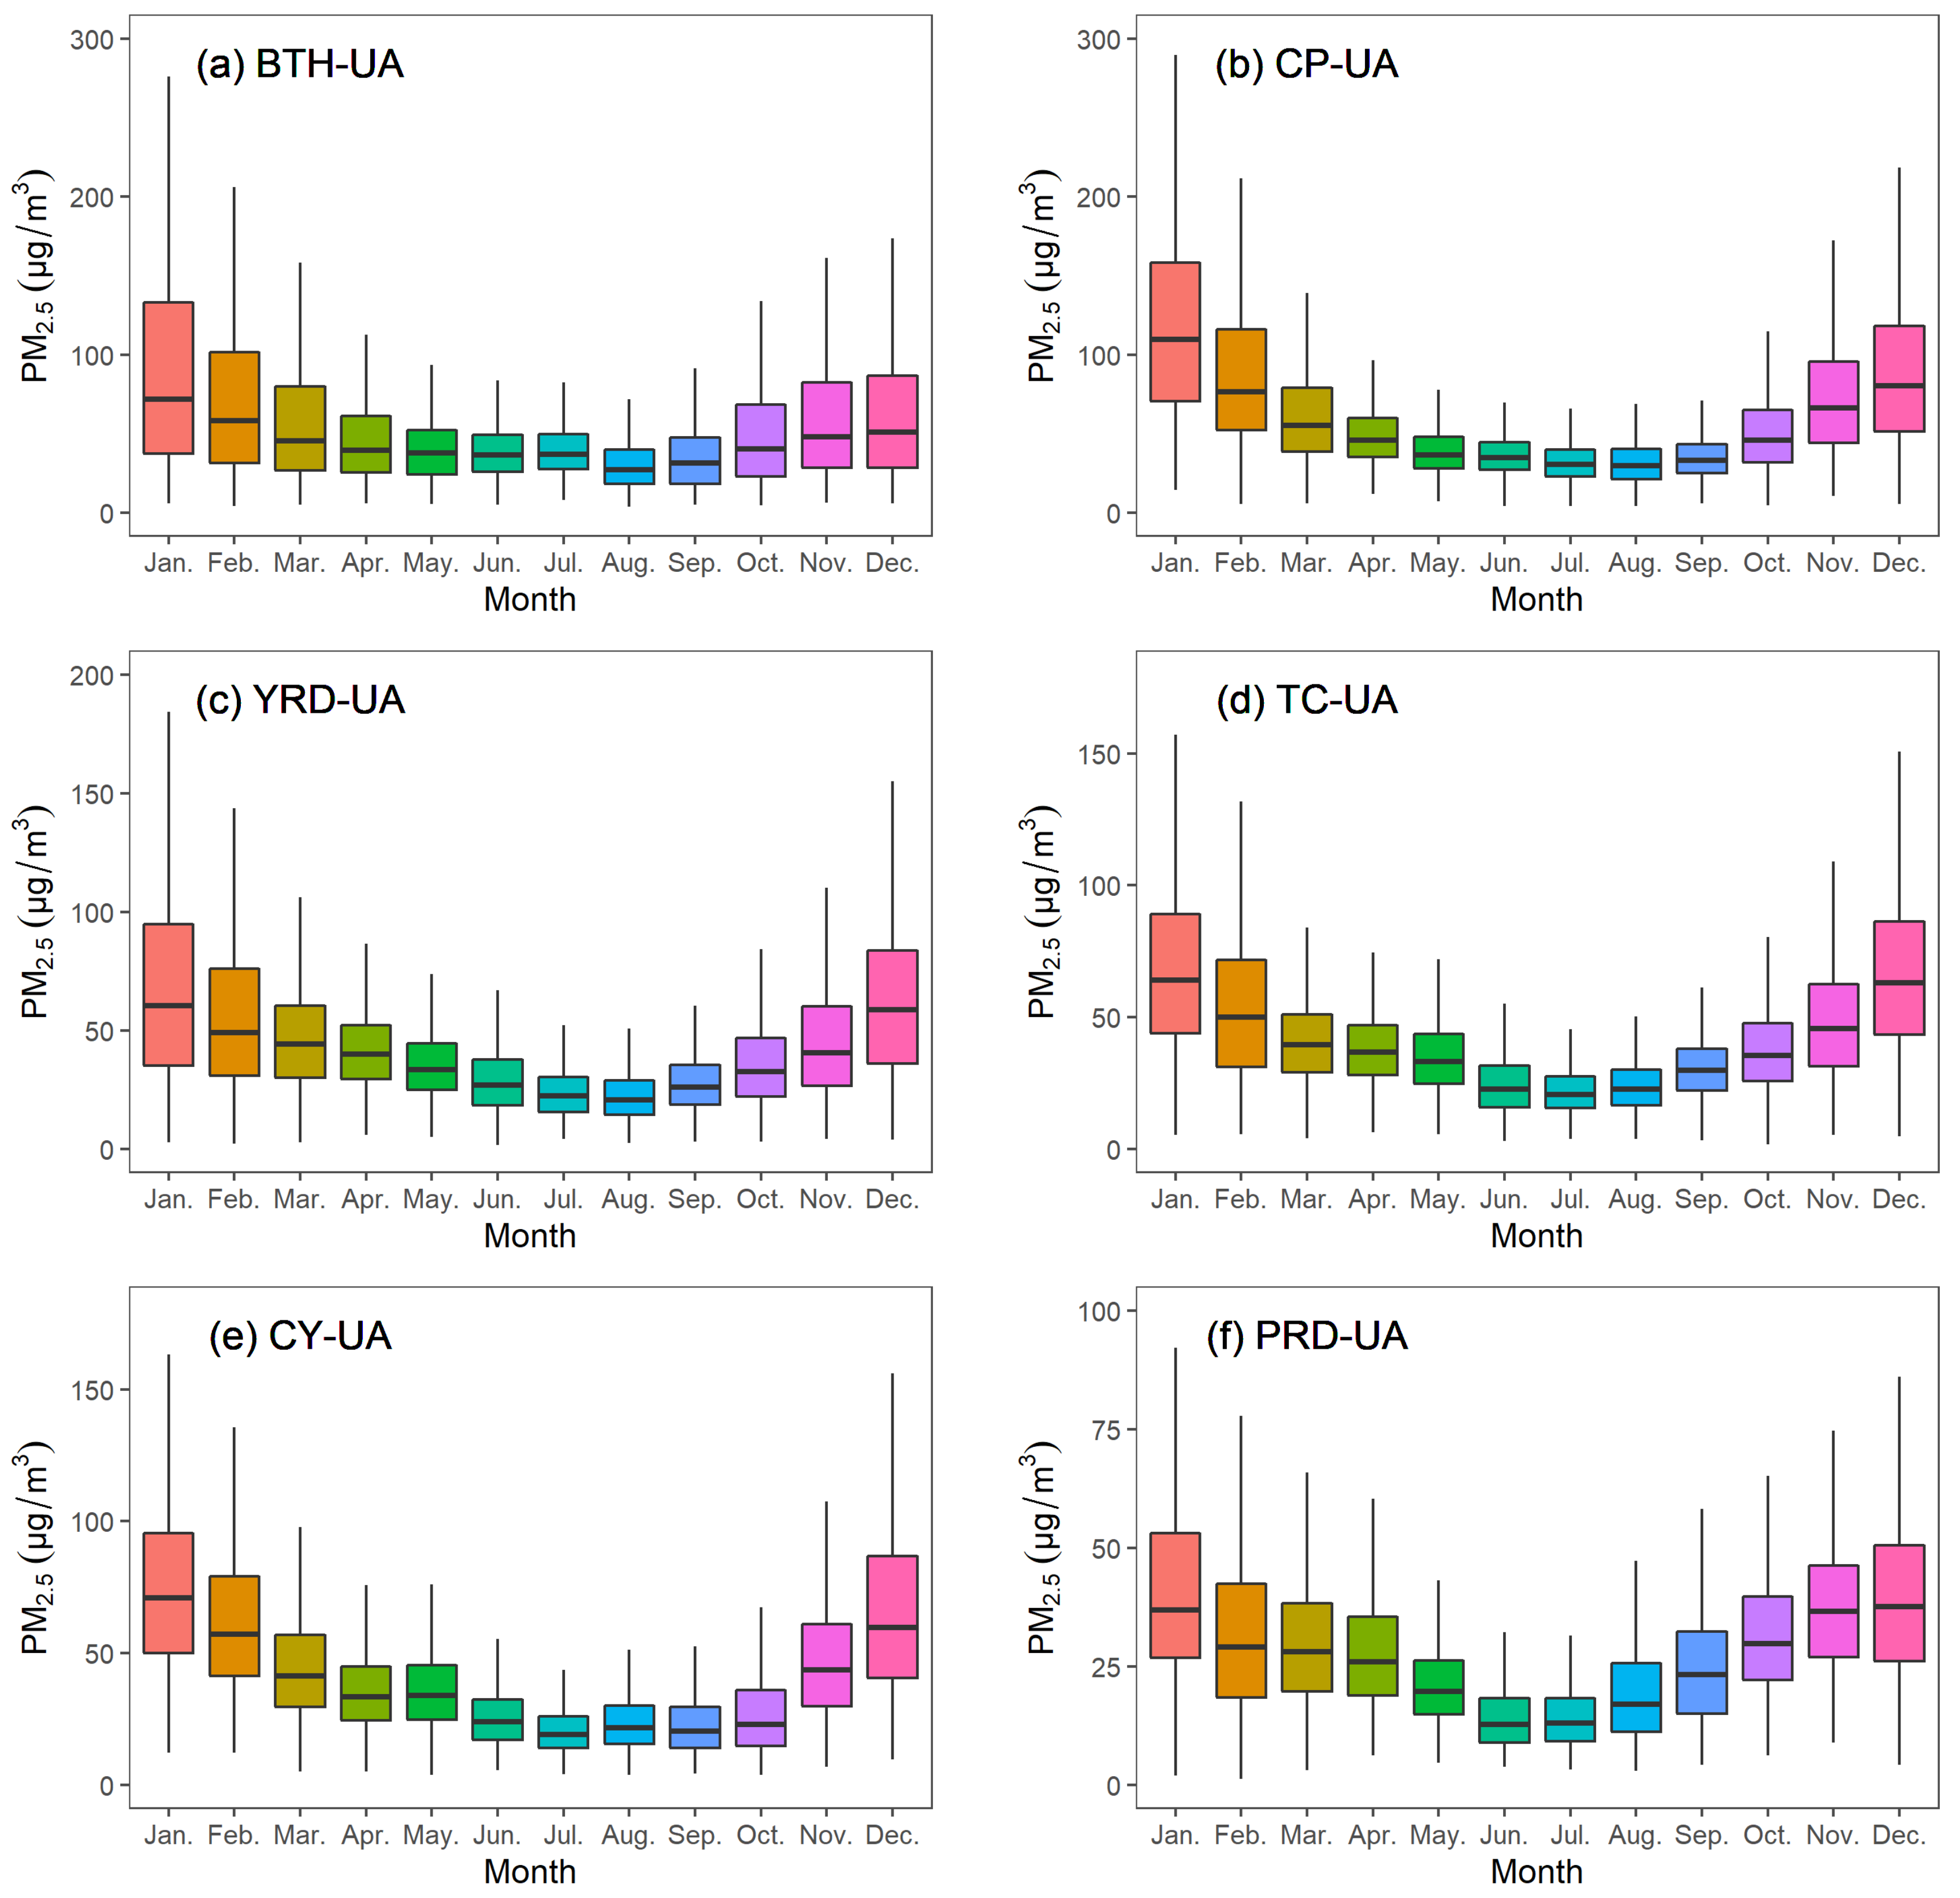
The monthly variations in PM2.5 concentrations in six urban agglomerations from 2017 to 2020 are displayed in Figure 3. The monthly mean PM2.5 concentrations exhibited a U-shaped trend in all regions, with a high concentration in winter and a low concentration in summer. In BTH-UA, CP-UA, and YRD-UA, the lowest PM2.5 concentration occurred in August. TC-UA and CY-UA have the lowest monthly PM2.5 concentrations in July, and PRD-UA has the lowest value in June. In summer, strong winds, frequent precipitation, and unstable atmosphere enhance the deposition and diffusion of PM2.5 [51], resulting in low PM2.5. The highest PM2.5 concentrations occurred in January in six regions. The highest-to-lowest ratios of PM2.5 concentrations in the regions were 3.15, 3.81, 3.15, 3.29, 3.79, and 3.11 in the BTH-UA, CP-UA, YRD-UA, TC-UA, CY-UA, and PRD-UA, respectively. From April to July, the PM2.5 concentrations variated slightly in BTH-UA (Figure 3a), with monthly mean concentrations of 46.9, 41.4, 38.5, and 39.5 μg/m3, respectively, while in the other five urban agglomerations, PM2.5 concentrations decreased remarkably. In the winter months, meteorological conditions of weak winds, high RH, and low planetary boundary layer height (PBLH) are conducive to PM2.5 accumulation. In addition, the burning of fossil fuels for heating in northern China increased anthropogenic emissions [37,52].
The EOF method was used to decompose the monthly mean PM2.5 concentrations. In six regions, the first EOF model accounted for 86.9–96.0% of the total variance, which illustrated that decomposition results were reliable. The PM2.5 time coefficients decomposed from the original time series by EOF reflect the changing trend of monthly PM2.5 concentrations. Moreover, time coefficients were standardized to have zero mean and unit variance [42]. As shown in Figure S2, values that cross the red dash lines at ±1 are considered extreme events. Overall, the six lines all displayed U-shaped changing trends, which were similar to the variations of PM2.5 concentration. In January, the cases where time coefficients were greater than 1 in six regions were much more than in other months, indicating serious PM2.5 pollution. In the summer months, time coefficients usually have low values, suggesting relatively good air quality. We observed that time coefficients in all regions displayed decreased trends in January and February, 2020, which could be attributed to the influence of COVID-19.

3.3. Diurnal Variation

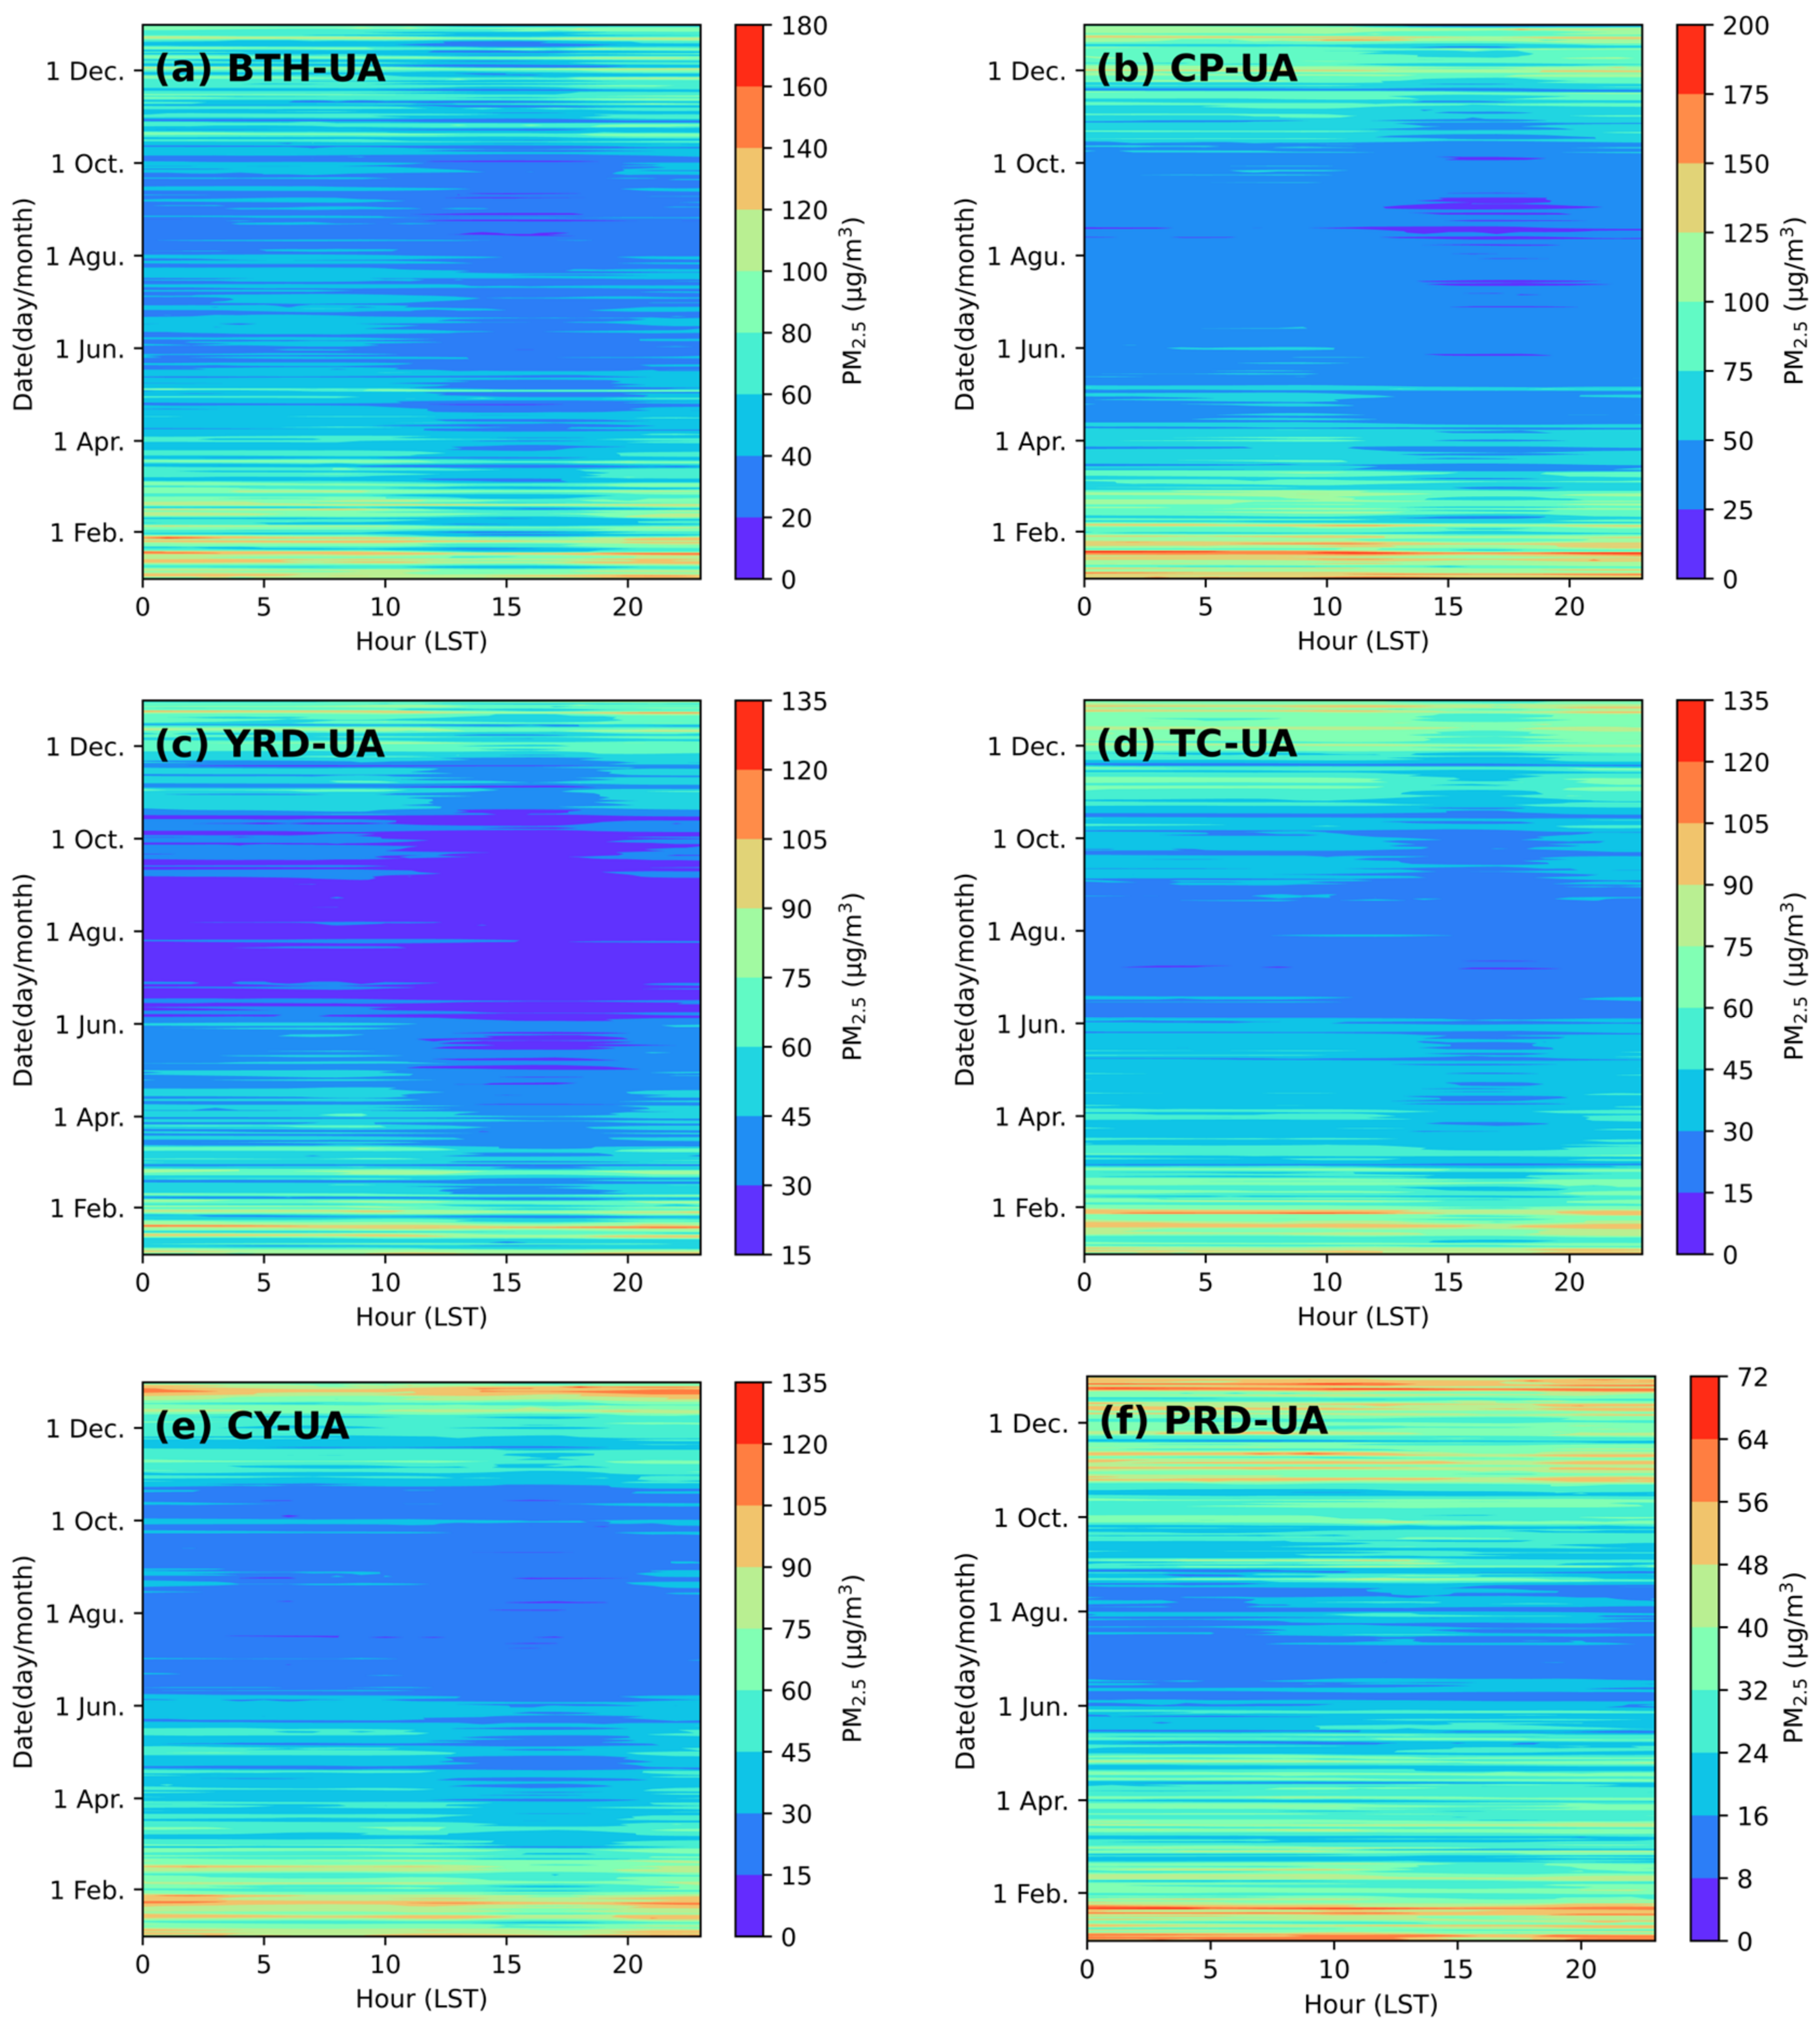
The hourly concentrations of PM2.5 were the highest in the CP-UA and the lowest in the PRD-UA, while the YRD-UA, CY-UA, and TC-UA showed minimal differences (Figure S3). As displayed in Figure 4, the diurnal variations in six regions exhibited some similar characteristics. PM2.5 had low concentrations in the daytime and high concentrations in the nighttime. Higher diurnal PM2.5 concentrations were observed in winter than that in summer. In the daytime, due to solar radiation, atmospheric instability was enhanced, resulting in increasing PBLH. The PM2.5 concentrations decreased in the period 8:00–10:00 (LST) in all regions except in PRD-UA, which decreased from 12:00 (Figure S3). The PM2.5 valley concentrations occurred at around 15:00–17:00. Then, the PM2.5 concentrations increased substantially. In the nighttime, descending PBLH, weakening winds, and enhancing atmospheric stability increased PM2.5 concentrations. On winter nights, PM2.5 pollution was more likely to occur [53,54]. From 0:00 to 06:00, PM2.5 concentrations showed increasing trends in CP-UA and YRD-UA, and showed decreasing trends in TC-UA, CY-UA, and PRD-UA. These differences suggested the complexity of the spatial distribution characteristics of PM2.5.

4. Spatial Variations of PM2.5 in Six Urban Agglomerations

4.1. Standard Deviational Ellipse Analysis

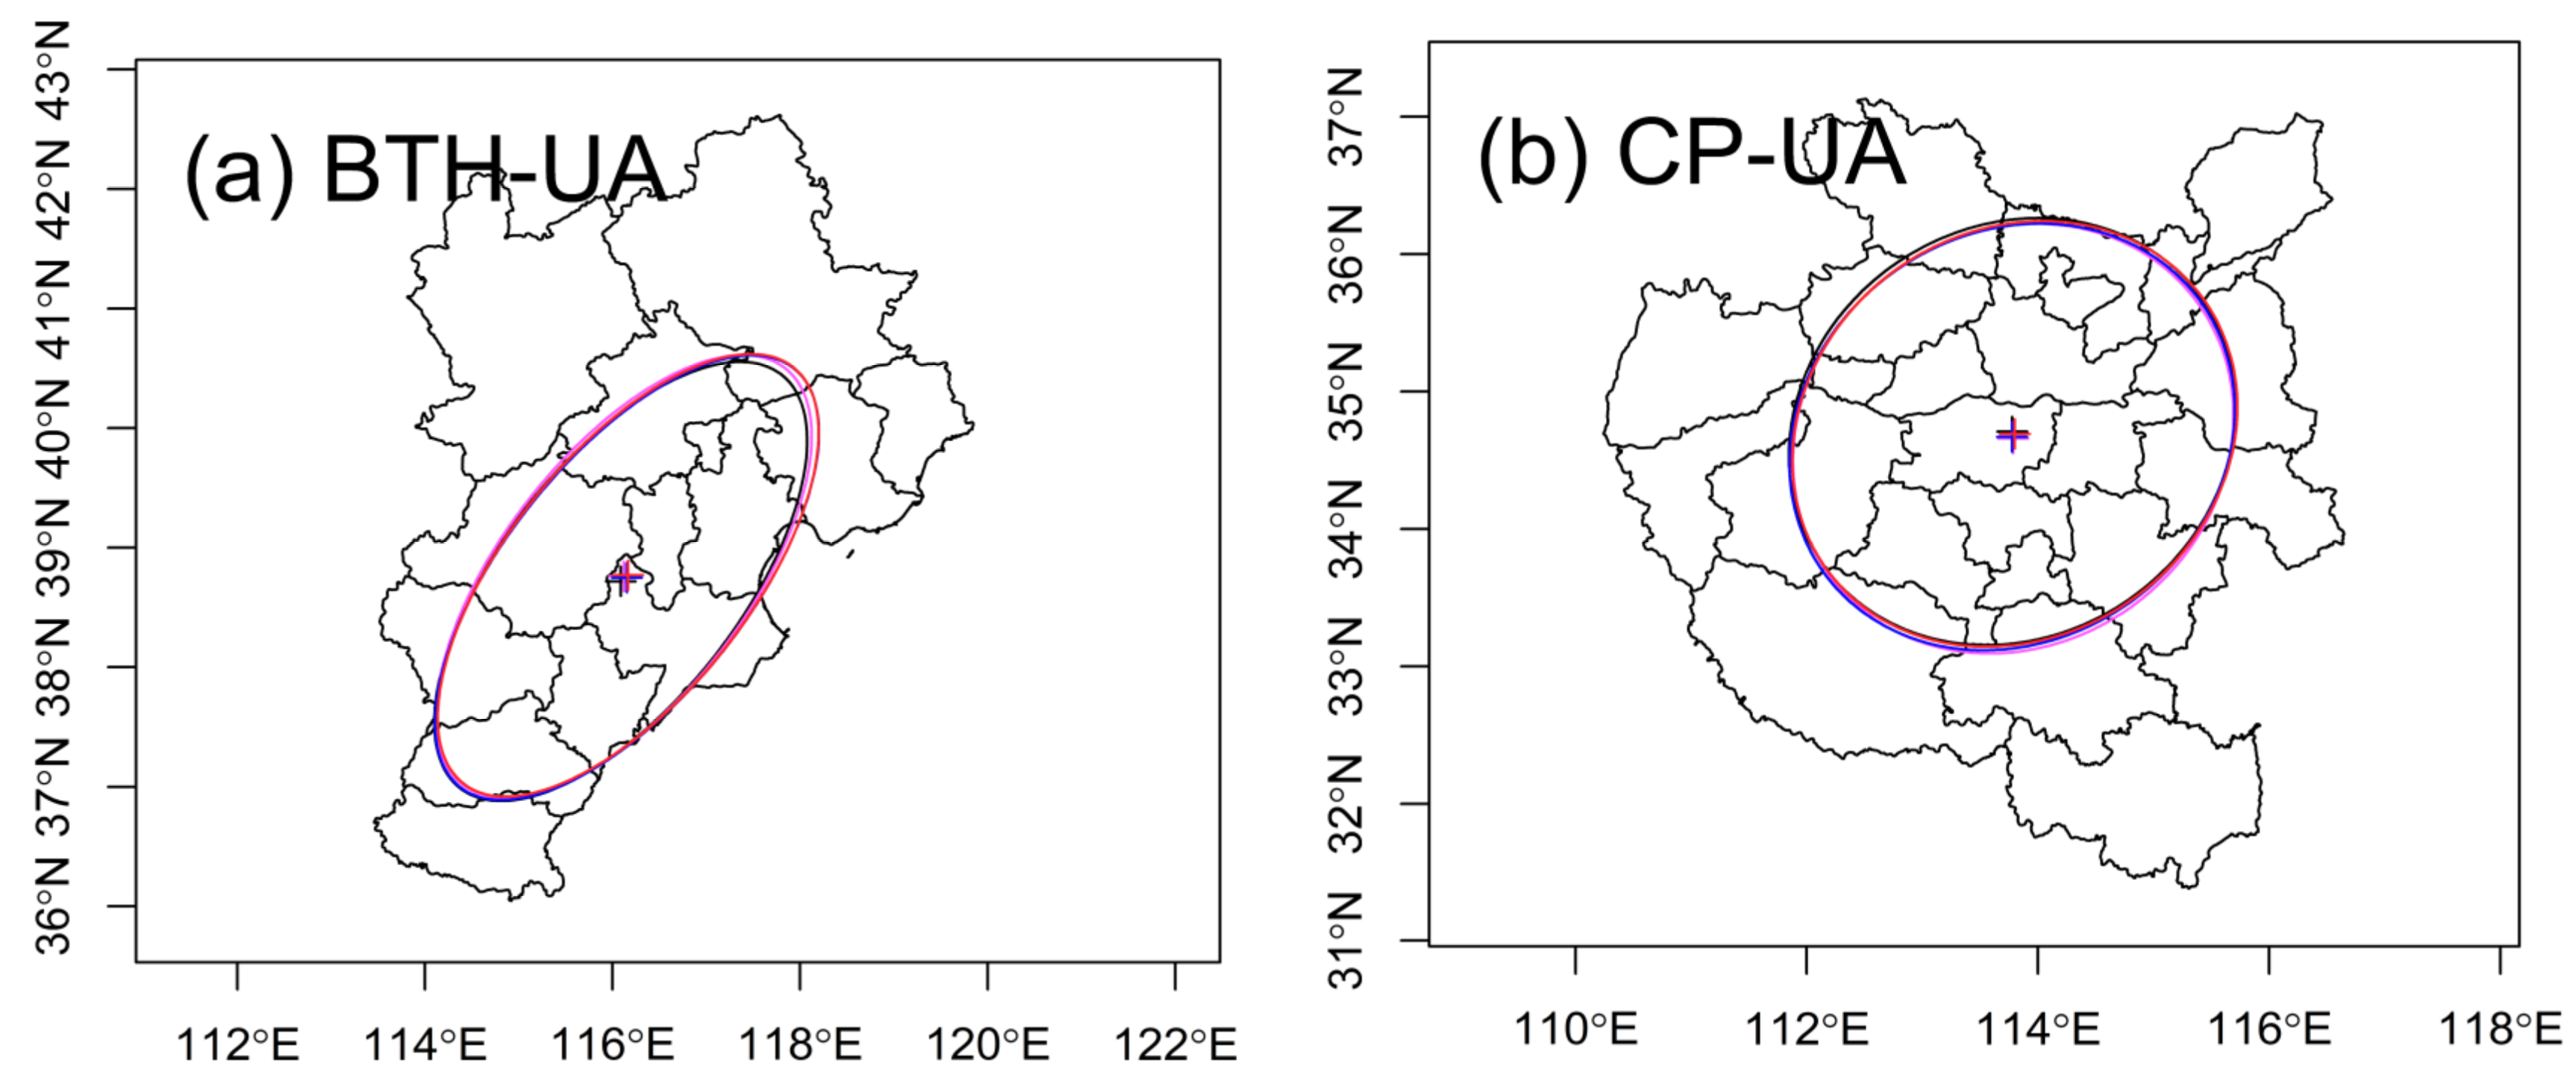
The SDE method was employed to characterize the spatial distribution characteristics of PM2.5 concentrations in six regions. As shown in Figure 5, the ellipses feature varied in different regions, indicating different spatial patterns of PM2.5. In BTH-UA (Figure 5a), the main distribution of PM2.5 was along the northeast–southwest direction. The ellipse azimuth displayed an increasing trend in general (Table S1), suggesting the spatial pattern moving eastward. SDE revealed that the mean centers of PM2.5 concentration in BTH-UA were located in Cangzhou and moved towards the northeast with the year (Table S1), which was related to the significant PM2.5 concentration reduction in cities of southern BTH-UA, such as Xingtai and Handan [37]. The ellipse area in 2020 was 2.4% higher than in 2017, indicating a decrease in spatial heterogeneity of PM2.5. In CP-UA (Figure 5b), the main distribution of PM2.5 concentration was also aligned in the northeast–southwest direction. The mean centers were located in Zhengzhou city (the regional core city, the capital city of Henan Province, as well). The ratio between the major and minor axes of the ellipses ranged from 1.11 to 1.13 during the period of 2017–2020, which suggested the directionality of PM2.5 spatial distribution was weak in CP-UA. In YRD-UA (Figure 5c), the main distribution was along the northwest–southeast direction, and the mean centers were located in Nanjing city (the capital city of Jiangsu Province). The azimuth of the ellipse decreased from 136.88°, in 2017, to 135.96°, in 2020, illustrating the spatial pattern moving north. In TC-UA (Figure 5d), the main distribution of PM2.5 concentration was aligned in the northwest–southeast direction in general, with an azimuth of 95.94–98.45°. The continuously decreasing in the azimuth indicated a northward rotation trend of the spatial distribution. The mean centers were detected in Jiujiang city. In CY-UA (Figure 5e), the main distribution of PM2.5 was along the northeast–southwest direction and the mean centers were located in Ziyang. The minor axes increased during the period of 2018–2020, which suggested that the dispersion of PM2.5 concentrations was enhanced. A decreased trend in the elliptical area was also observed during the period of 2018–2020. In PRD-UA (Figure 5f), the main distribution was almost along the western–eastern direction. The mean centers were located in Guangzhou city and showed a trend of moving eastward with the year.

4.2. Spatial Autocorrelation of PM2.5 Concentrations

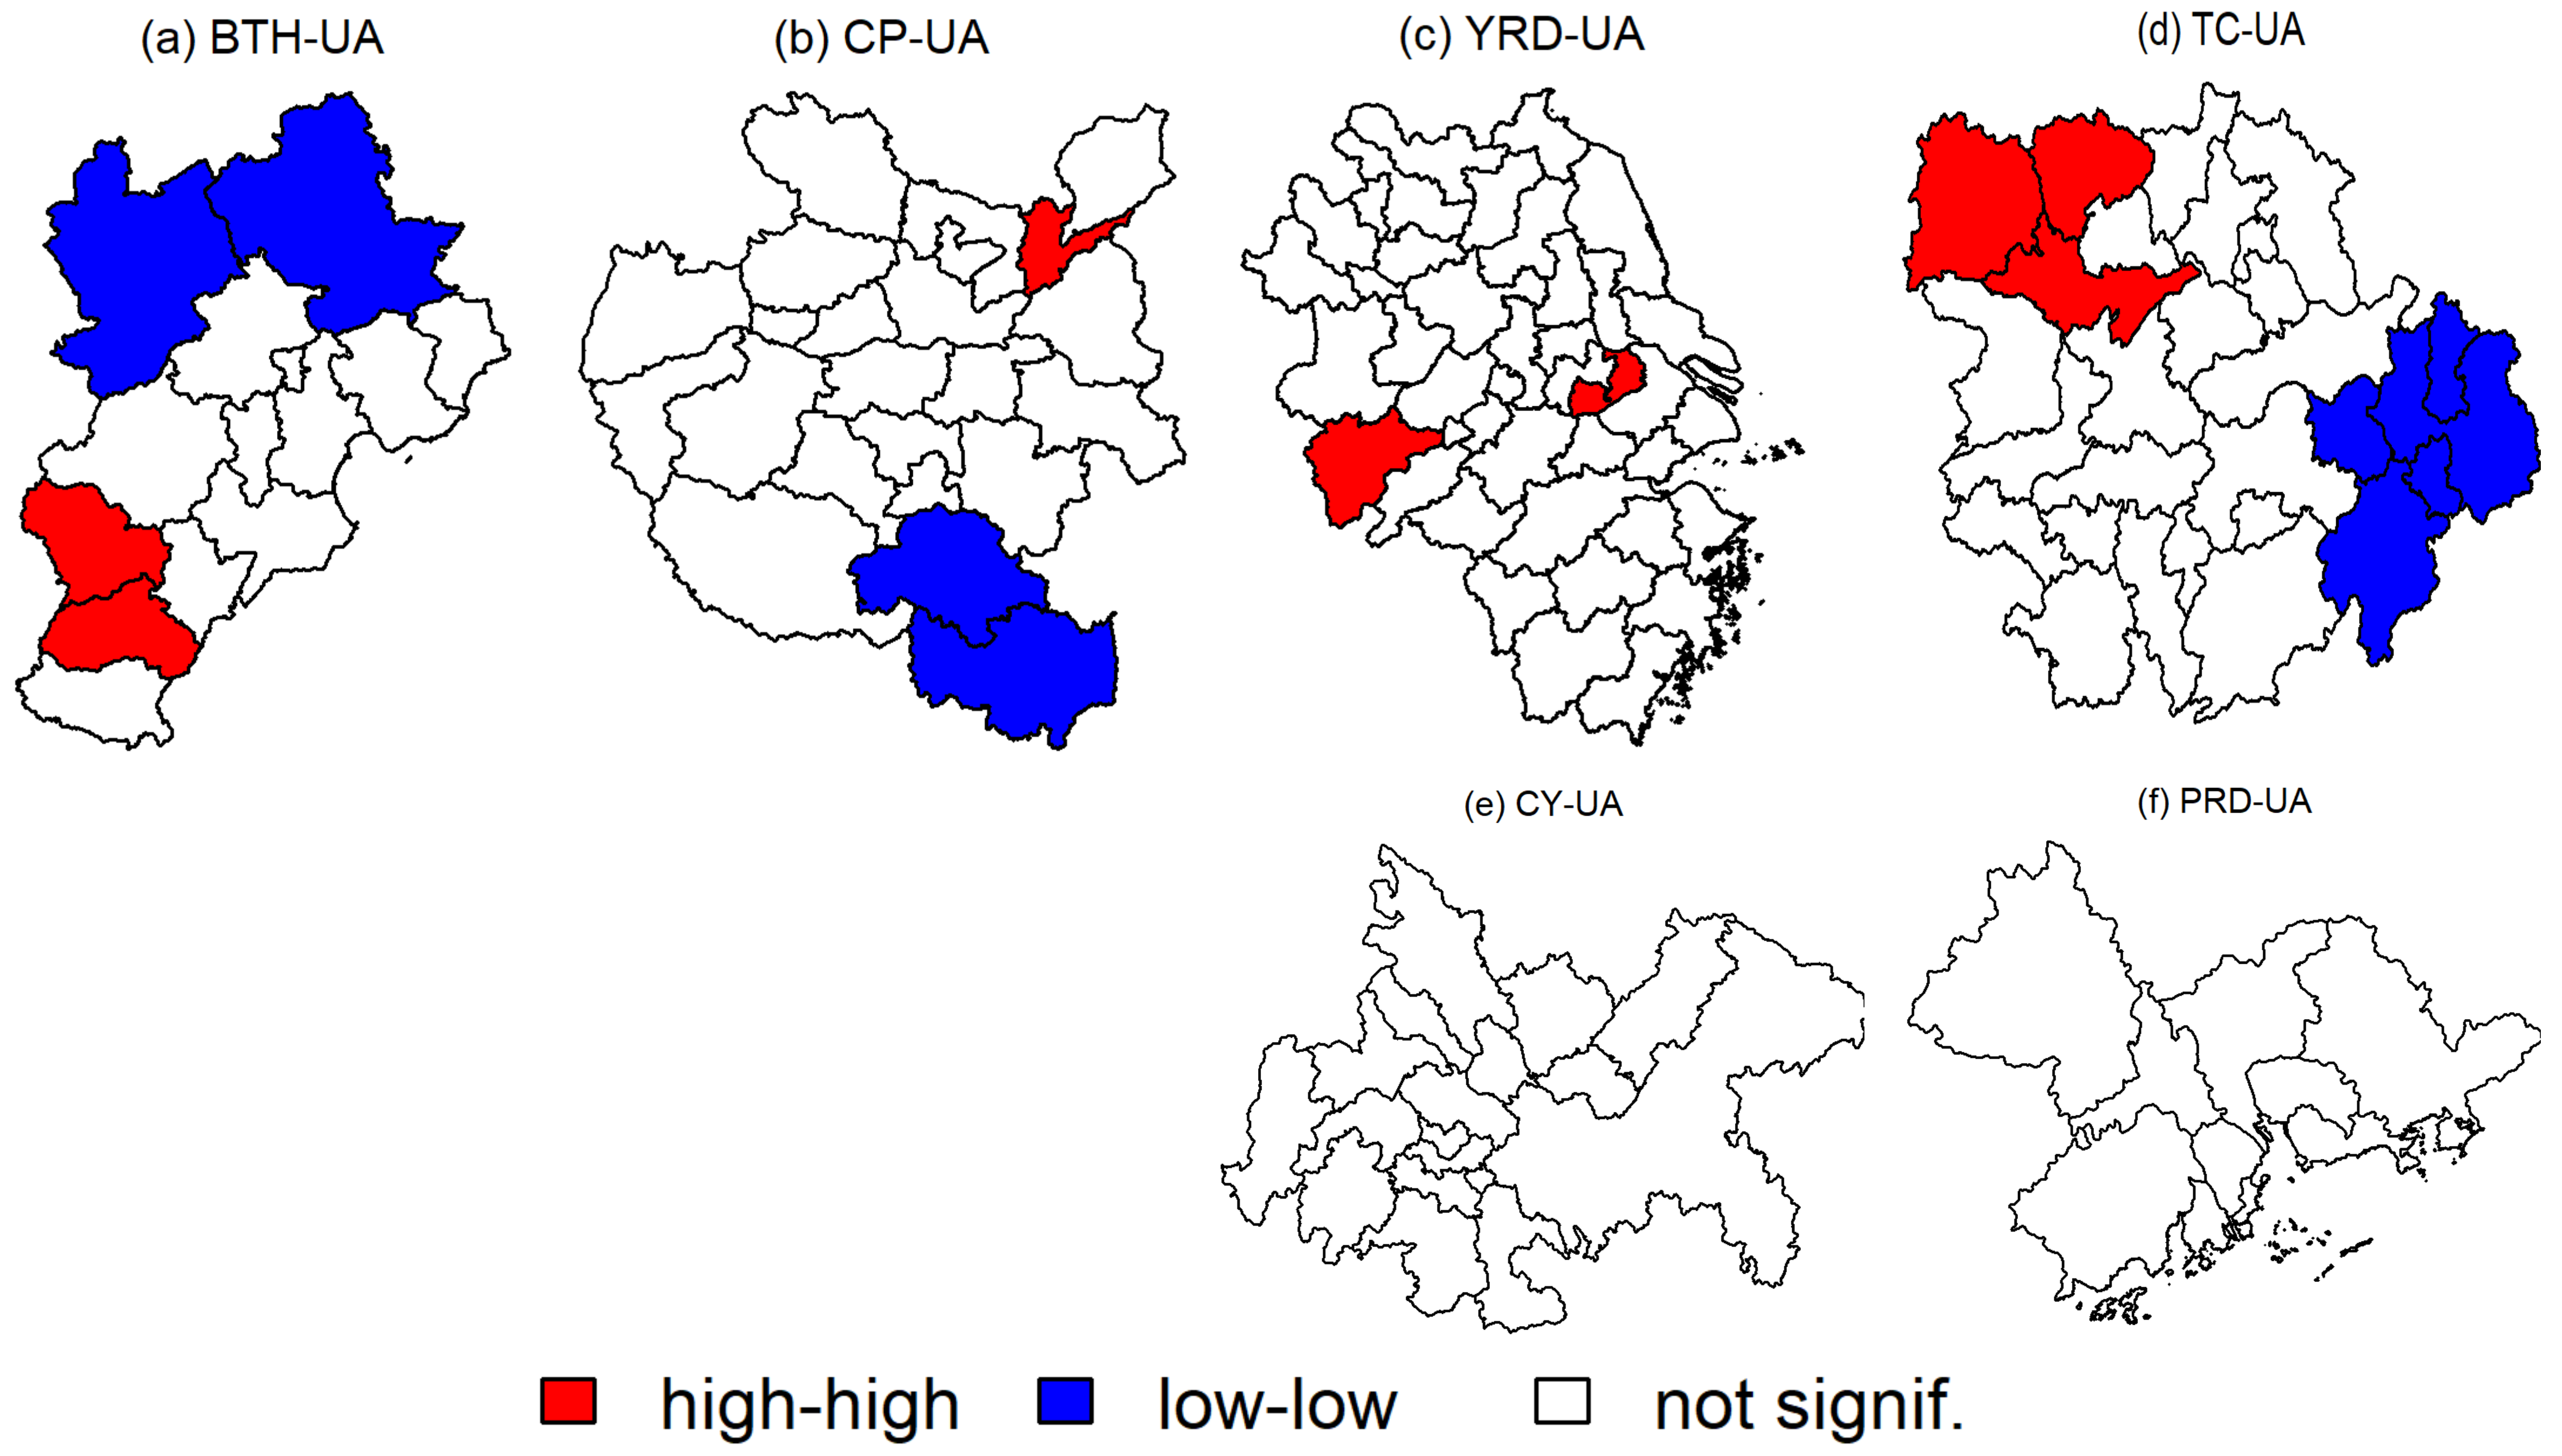
To study the PM2.5 spatial correlation in different years and seasons in six urban agglomerations, the global Moran’s I was calculated. As listed in Table 1, in BTH-UA, Moran’s I statistics from 2017 to 2020 are 1.95, 1.88, 1.99, and 1.80, respectively, all passing the significance test. This suggested that PM2.5 concentrations in BTH-UA showed significantly positive spatial autocorrelation, which was consistent with other studies [55]. This suggested that PM2.5 concentration in a site can be influenced by the surrounding areas. It reported that the contribution of outside transport to PM2.5 concentrations in Beijing was 27 and 46% in the winter and summer, respectively, and Langfang, Baoding, and Tangshan had the greatest impact on Beijing’s air pollution [56]. Therefore, it is necessary to carry out collaborative control of PM2.5 pollution among BTH-UA. The highest Moran’s I was observed in winter (2.45), and the lowest in spring (0.68), indicating that spatial aggregation was strongest in winter. In winter, stable atmosphere was conducive to the PM2.5 accumulation, resulting in frequent haze episodes. To further explore the spatial aggregation characteristics of PM2.5 concentration, local spatial autocorrelation analysis was employed in each urban agglomeration. As displayed in Figure 6a, cities with low PM2.5 concentrations in northern BTH-UA (Zhangjiakou and Chengde) formed a low–low (LL) agglomeration. The heavily polluted cities in southern BTH-UA, mainly Xingtai and Shijiazhuang, formed a high–high (HH) agglomeration. In CY-UA, a negative spatial correlation was found in 2018, and a positive spatial correlation in the other three years, illustrating a great change in the spatial distribution pattern of PM2.5 concentrations. The spatial aggregation was enhanced from 2019 to 2020. The magnitude of the Moran’s I is: summer (1.91), autumn (0.63), spring (0.44), and winter (−0.22). Intensive atmospheric activity in summer improved the transportation of PM2.5, leading to a relatively strong positive spatial correlation. The cities in northeastern CP-UA formed an HH agglomeration, and cities in southern CP-UA (mainly Xinyang and Zhumadian) formed a LL agglomeration (Figure 6b). In YRD-UA, a negative spatial autocorrelation was found during the period of 2017–2019, and a very weak positive spatial autocorrelation in 2020. From the perspective of seasonal variations, spatial autocorrelation was negative in spring but positive in other seasons. In TC-UA, the global Moran’s I was positive for four years and increased from 2017 to 2019, indicating an enhancing spatial autocorrelation of PM2.5. In summer, PM2.5 exhibited the highest spatial autocorrelation in TC-UA. The cities in northwestern TC-UA, including Jingmen, Jingzhou, and Yichang formed an HH agglomeration, and cities in eastern TC-UA, including Nanchang, Shangrao, Jingdezhen, Yingtan, and Fuzhou, formed a LL agglomeration (Figure 6d). In CY-UA, PM2.5 concentrations were spatially aggregated except in 2019. PM2.5 had negative spatial autocorrelation in summer, and positive spatial autocorrelation in the other three seasons. In PRD-UA (Table 1), the global Moran’s I decreased from 0.92 in 2017 to 0.24 in 2020, suggesting a weakening trend of spatial aggregation. Regarding season variability, the order of spatial aggregation degree by season was summer > spring > winter > autumn. To sum up, PM2.5 concentration exhibited different spatial aggregation characteristics among urban agglomerations, indicating the necessity to take various control measures for different regions. In southern BTH-UA, northeastern CP-UA, and northwestern TC-UA, PM2.5 concentrations formed a high–high agglomeration. More cooperation and efforts are needed in these regions to reduce PM2.5 concentration.

5. Relationships between Meteorological Conditions and PM2.5 Concentrations

Meteorological factors play a crucial role in PM2.5 pollution. The vast territory and complicated topography in China cause various climatic conditions. Therefore, the relationships between PM2.5 concentration and meteorological conditions are spatially heterogeneous [57]. To comprehensively investigate the variations among different urban agglomerations, the Pearson correlations between PM2.5 concentration and different meteorological factors during the period of 2017–2020 were calculated.
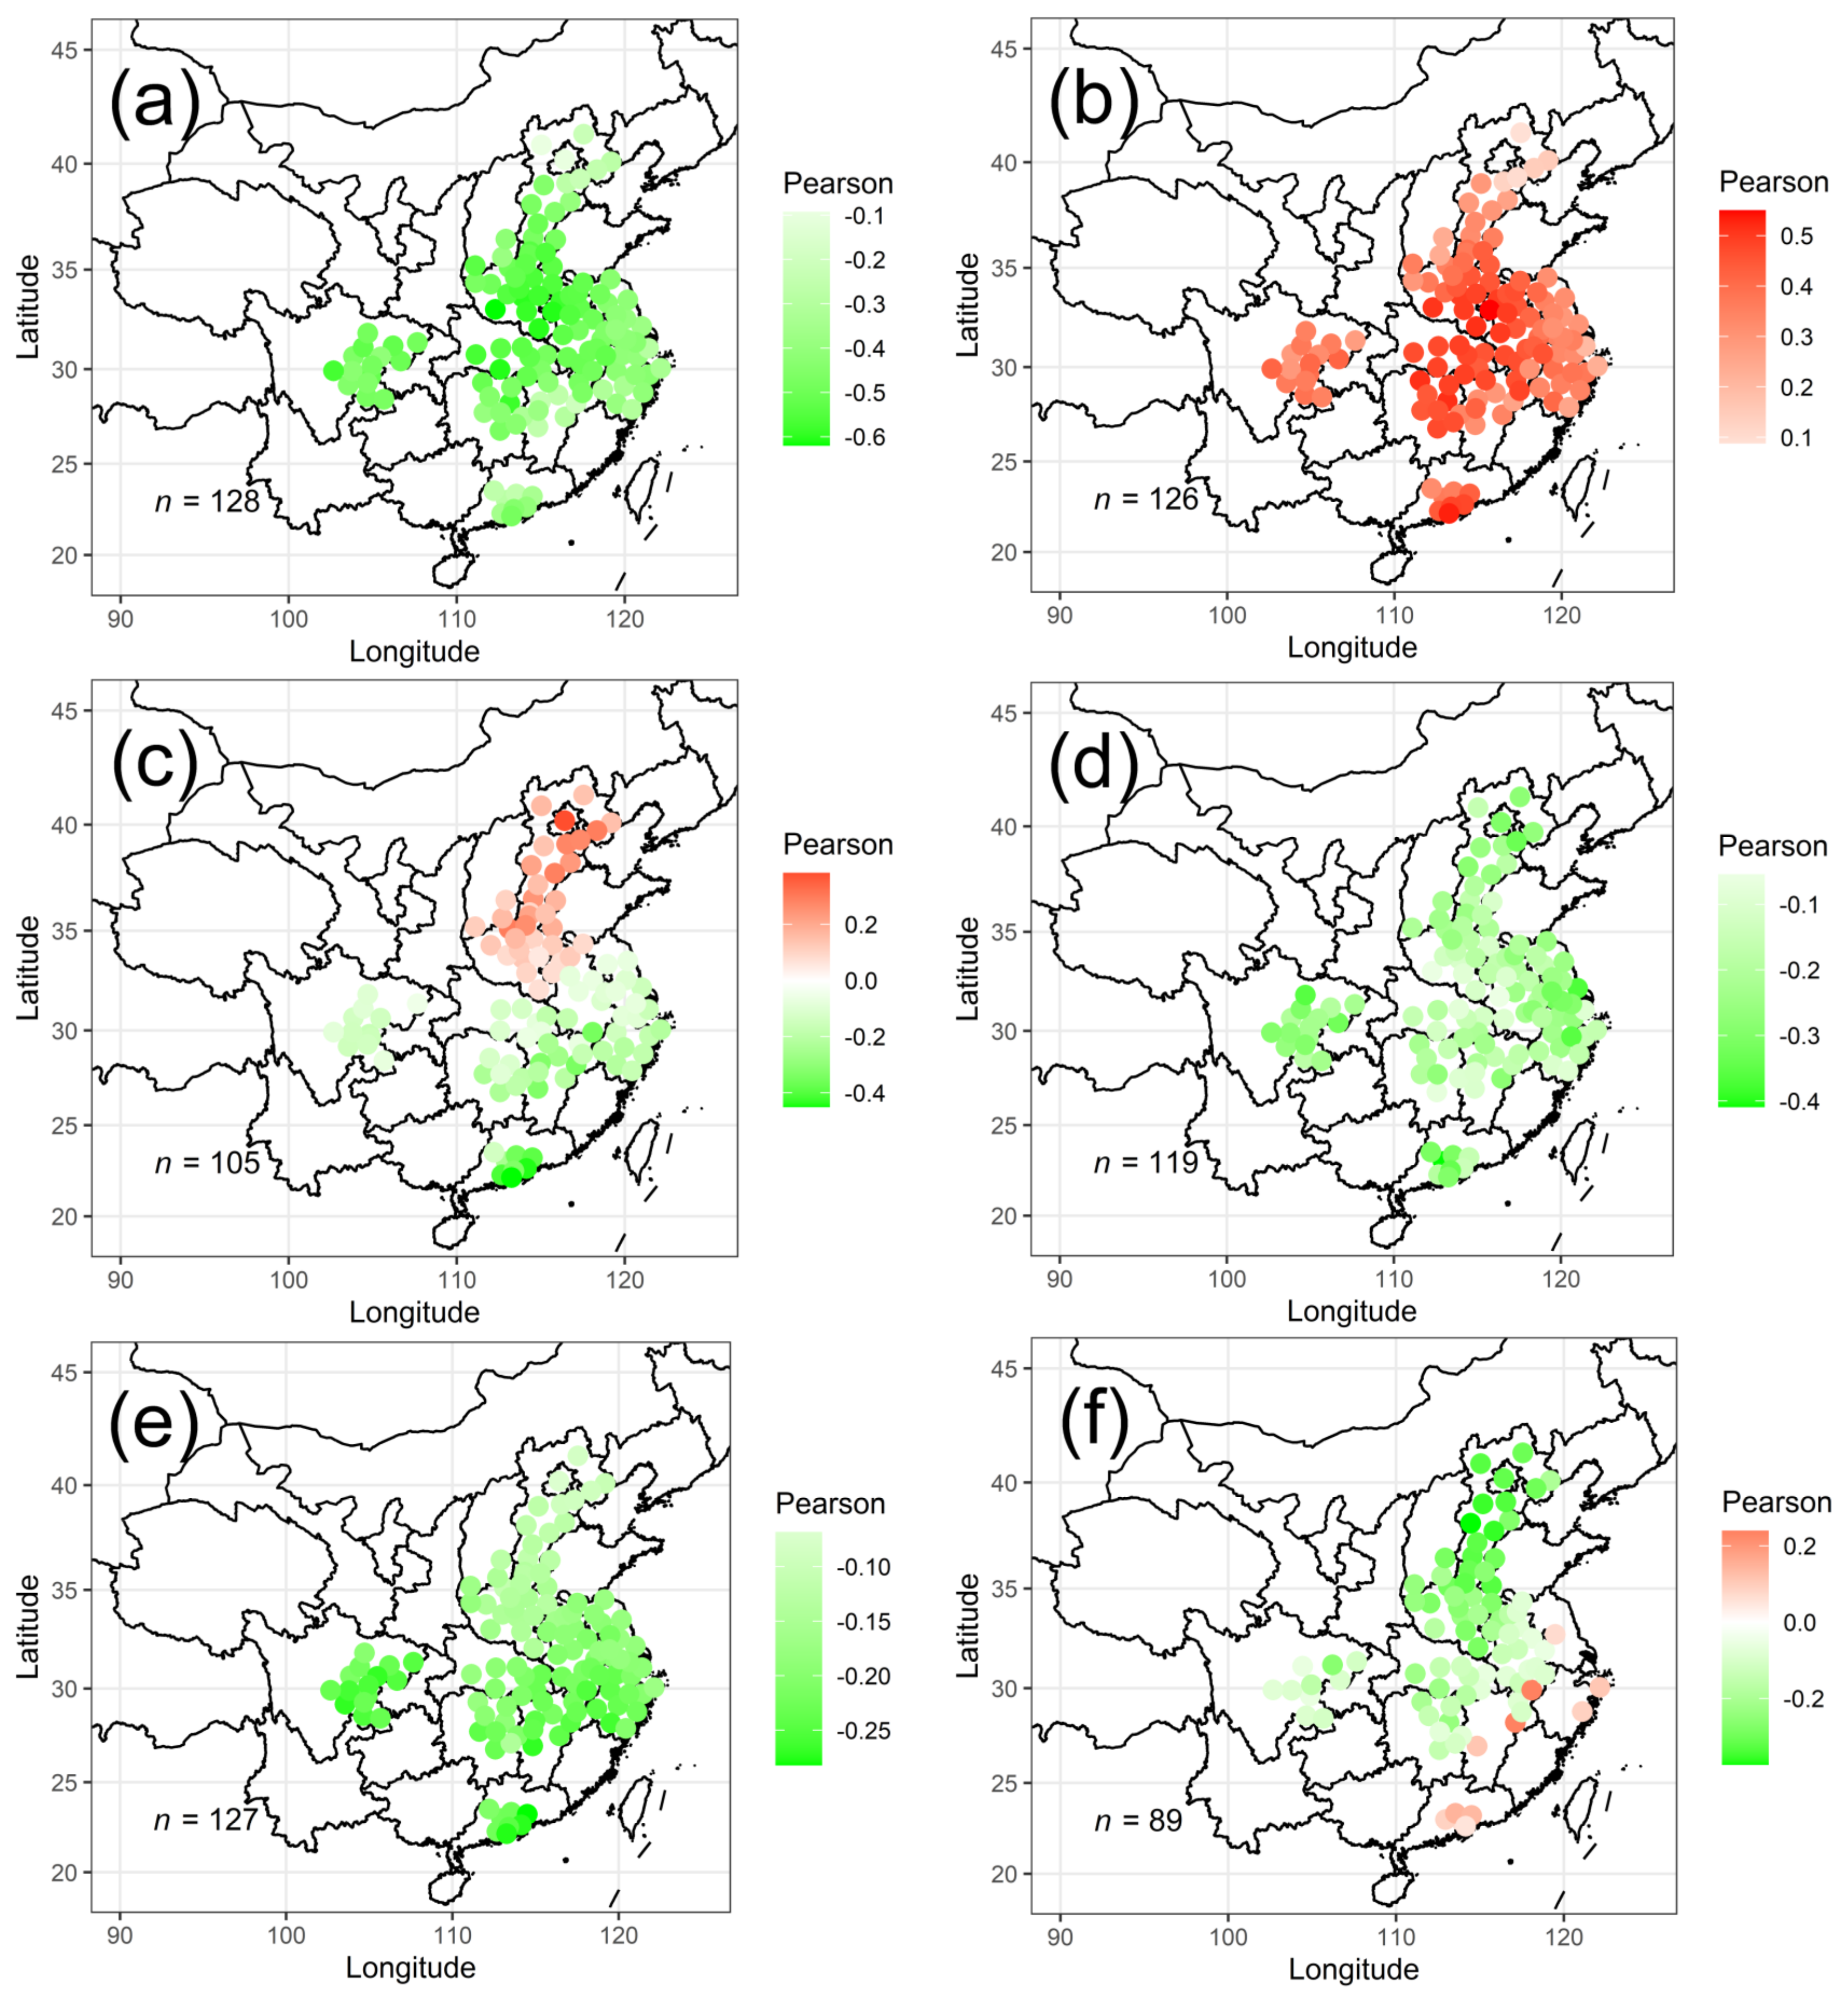
As displayed in Figure 7a, the air temperature was negatively correlated with PM2.5 concentrations in all cities in six regions, indicating a negative influence of temperature on PM2.5 concentrations. High temperature enhances atmospheric thermal activity such as turbulence and diffusion, resulting in accelerated dispersion of PM2.5 [27,58]. Besides, ammonium nitrate, an important chemical component of PM2.5, will decompose at high temperatures [59], leading to a decrease in PM2.5 mass. Conversely, low temperature mainly occurs in winter, leading to a weakening in atmospheric convection. In autumn and winter, inversion caused by temperature is one of the important reasons for PM2.5 pollution [60]. Our results showed that the correlation between PM2.5 concentration and temperature was much stronger in CP-UA and northwestern YRD-UA, namely in the latitude of 30–36° N, than in other regions. As shown in Figure 7b, atmospheric pressure has a positive correlation with PM2.5 concentrations in almost all cities. This is because high pressure is often related to stagnant environments and low PBLH, which are unfavorable for PM2.5 dispersion [61,62]. The correlations were stronger in Henan Province, Anhui Province, and Hubei Province. RH showed a different relationship with PM2.5 concentration across China (Figure 7c). It was a positive correlation in north China but a negative correlation in south China. A high correlation (r = 0.90, p < 0.01) between latitude and Pearson value (between RH and PM2.5 concentration) was found in this study, indicating the higher the latitude, the stronger the positive influences of RH on PM2.5. The strongest positive correlation between RH and PM2.5 concentration was observed in Beijing (r = 0.38, p < 0.01) among 129 cities. We believed that high RH can promote secondary formation and enhance the moisture absorption growth of PM2.5 in northern China [30]. Nevertheless, RH in south China was relatively high, which enhanced the deposition of particles, leading to a decrease in PM2.5 concentration. As displayed in Figure 7d, wind speed was negatively correlated with PM2.5 concentration in most cities. An increasing WS improves the horizontal dispersion of pollutants. In contrast, weak winds support pollution accumulation. In southwestern TC-UA, namely in Hunan Province, there was almost no correlation between WS and PM2.5 concentration. As shown in Figure 7e, a negative correlation was found between PM2.5 concentration and precipitation, and the higher the latitude, the stronger the correlation (r = 0.82, p < 0.01). Usually, precipitation enhances the removal of PM2.5, decreasing PM2.5 concentration. However, some studies found that weak precipitation will increase PM2.5 concentration [63]. The correlation between PM2.5 concentration and SSD was weak in all cities in six regions (Figure 7f). In the PRD-UA, SSD had a weak positive correlation with PM2.5 concentration.
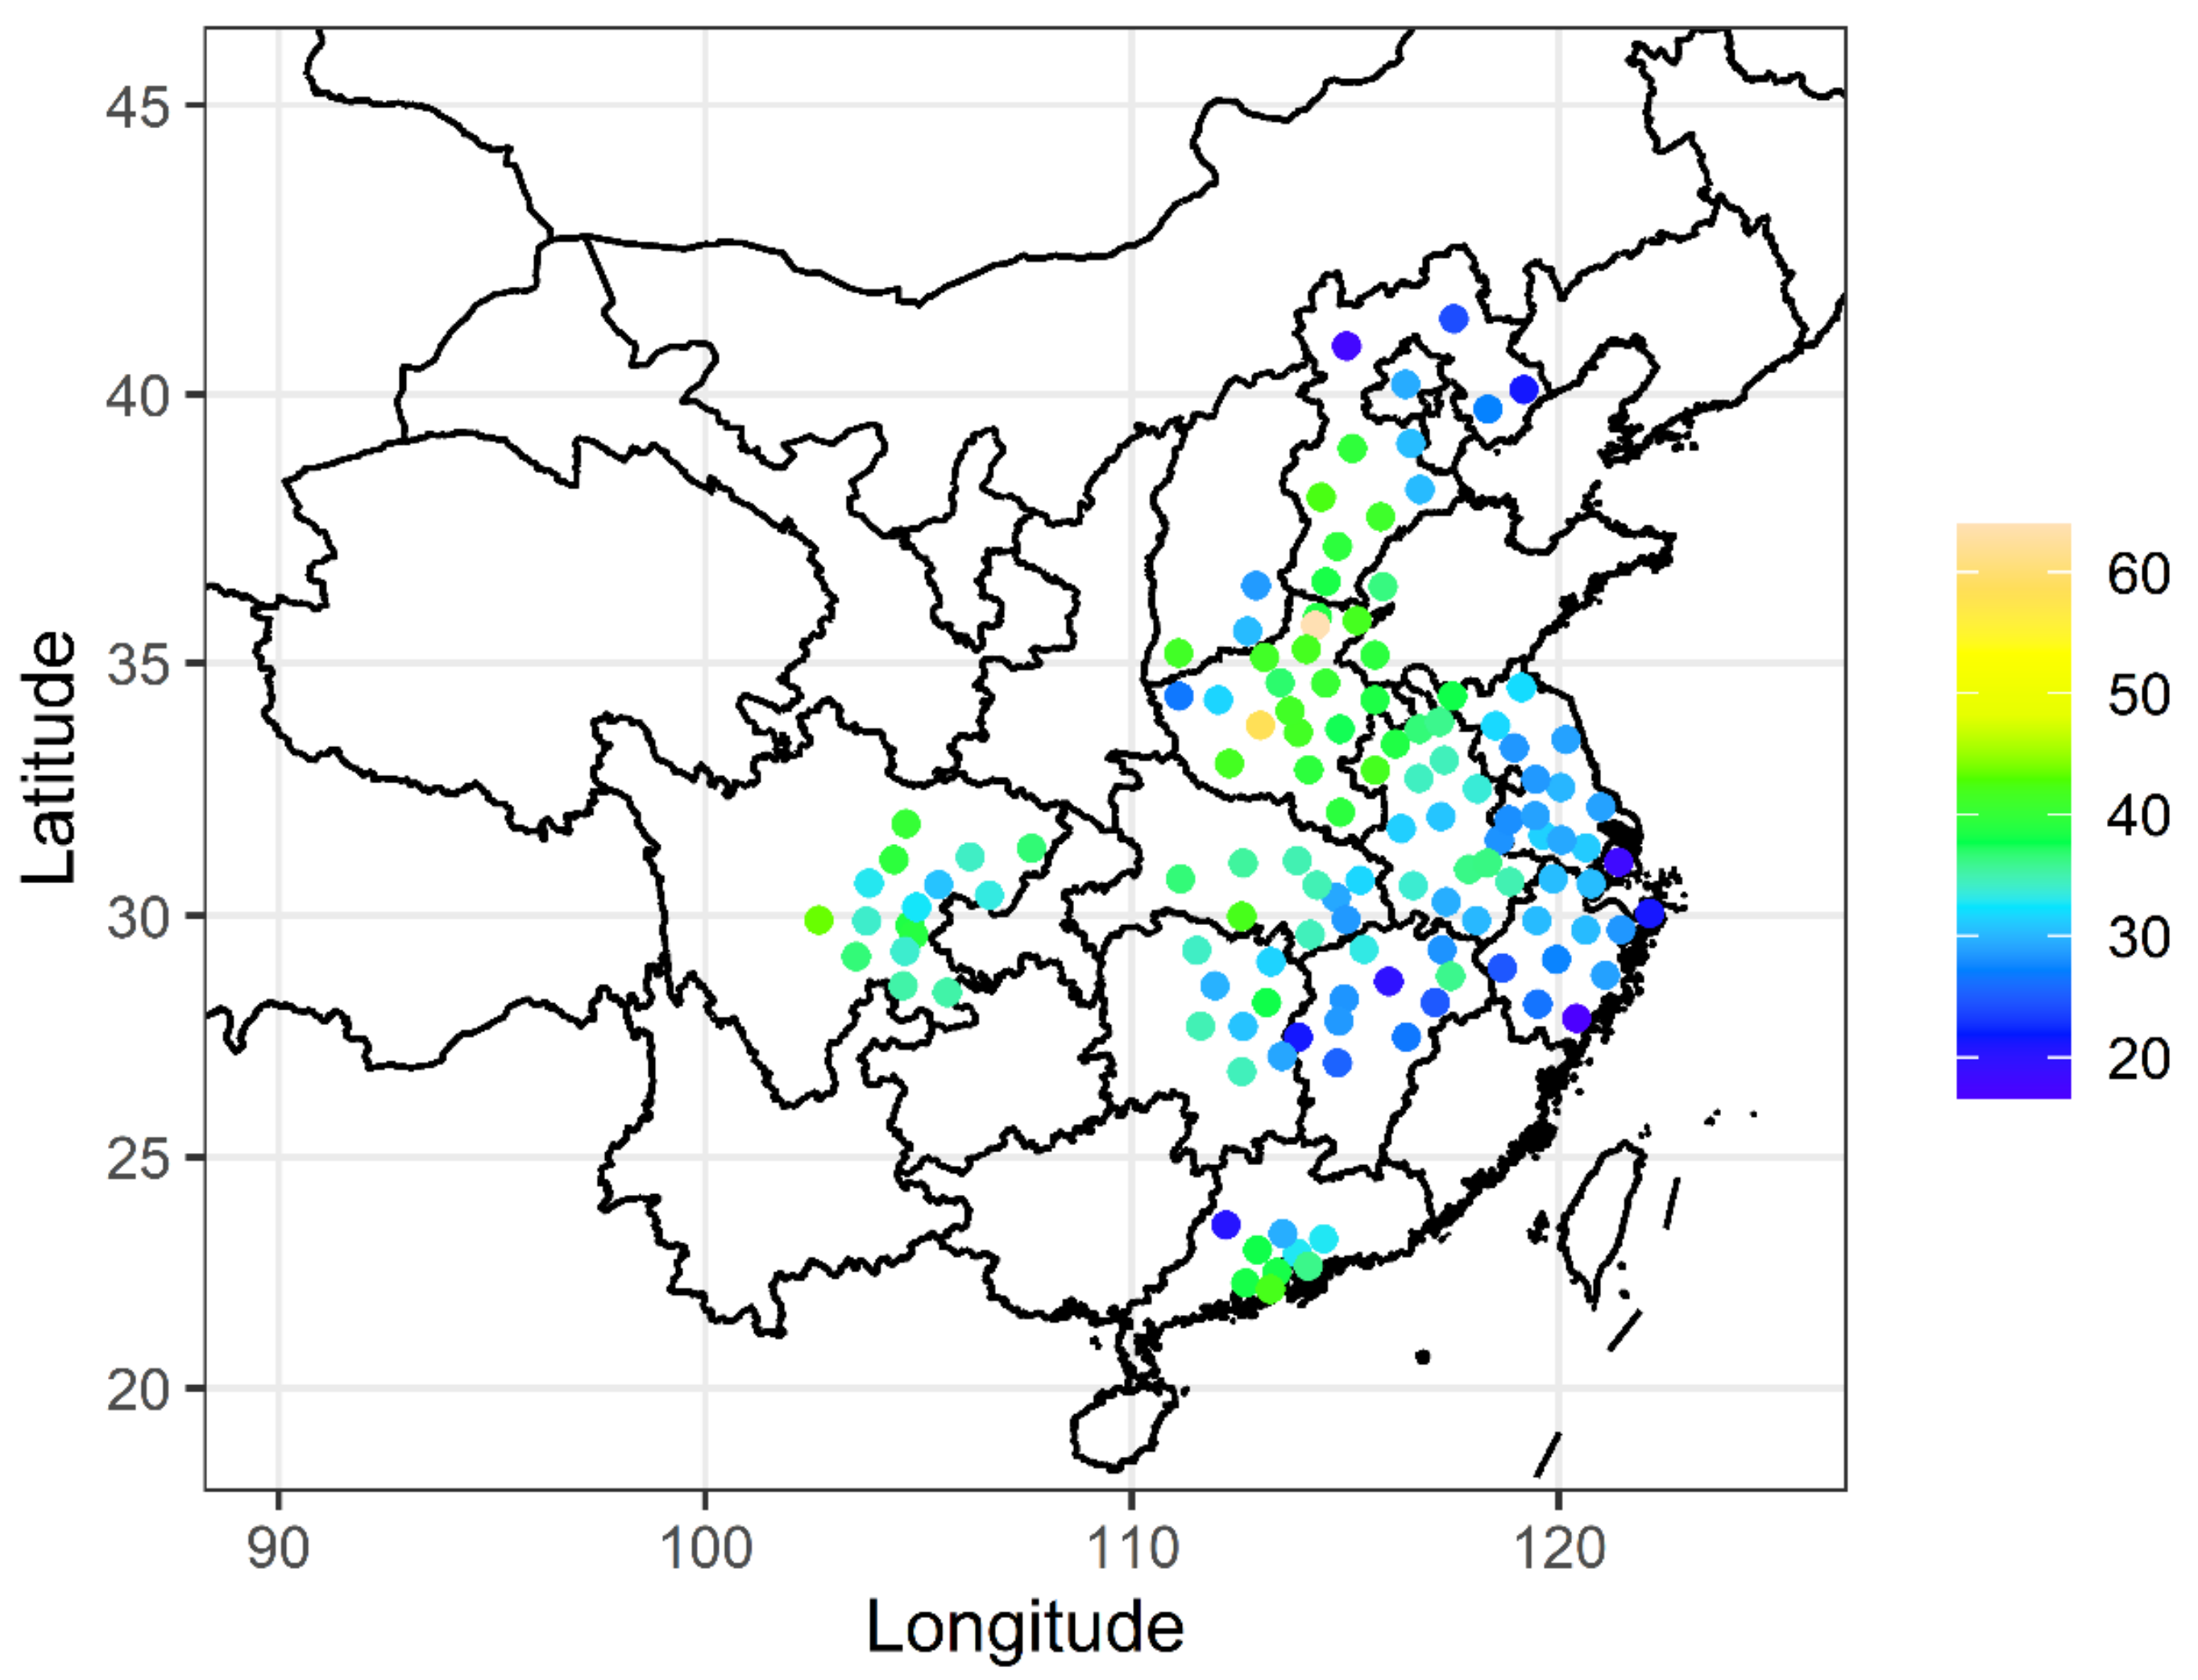
To further investigate the influence of meteorological conditions on the variation of PM2.5 concentration, multiple linear regression was employed to fit PM2.5 concentration and meteorological factors (including T, P, RH, WS, Pre, SSD) in six urban agglomerations during the period of 2017–2020. Then, the variance contribution of the fitting values from meteorological factors to the observed PM2.5 concentration was calculated in each city. As displayed in Figure 8, the variance contribution ranged from 16.7 to 63.9%, with an average of 33.4% in six regions. This suggested meteorological conditions are not the only key factor affecting PM2.5 change. Pollutant emissions also play an important role in changes in PM2.5 concentration. It reported that in Central and Eastern China 21.9% of the PM2.5 decrease was a result of favorable meteorological conditions, and 78.1% of the decrease was a result of emission reductions [64]. It also reported that the control of anthropogenic emissions accounted for around 80% of the PM2.5 reduction in Beijing from 2013 to 2017 [65]. In this study, we found that meteorological conditions can explain 31.8, 39.8, 30.6, 31.2, 36.0, and 34.3% of the PM2.5 changes in the BTH-UA, CP-UA, YRD-UA, TC-UA, CY-UA, and PRD-UA, respectively. This suggested that PM2.5 concentrations in the CP-UA were more influenced by the meteorological change.

6. Health Impacts Attributable to PM2.5 Pollution

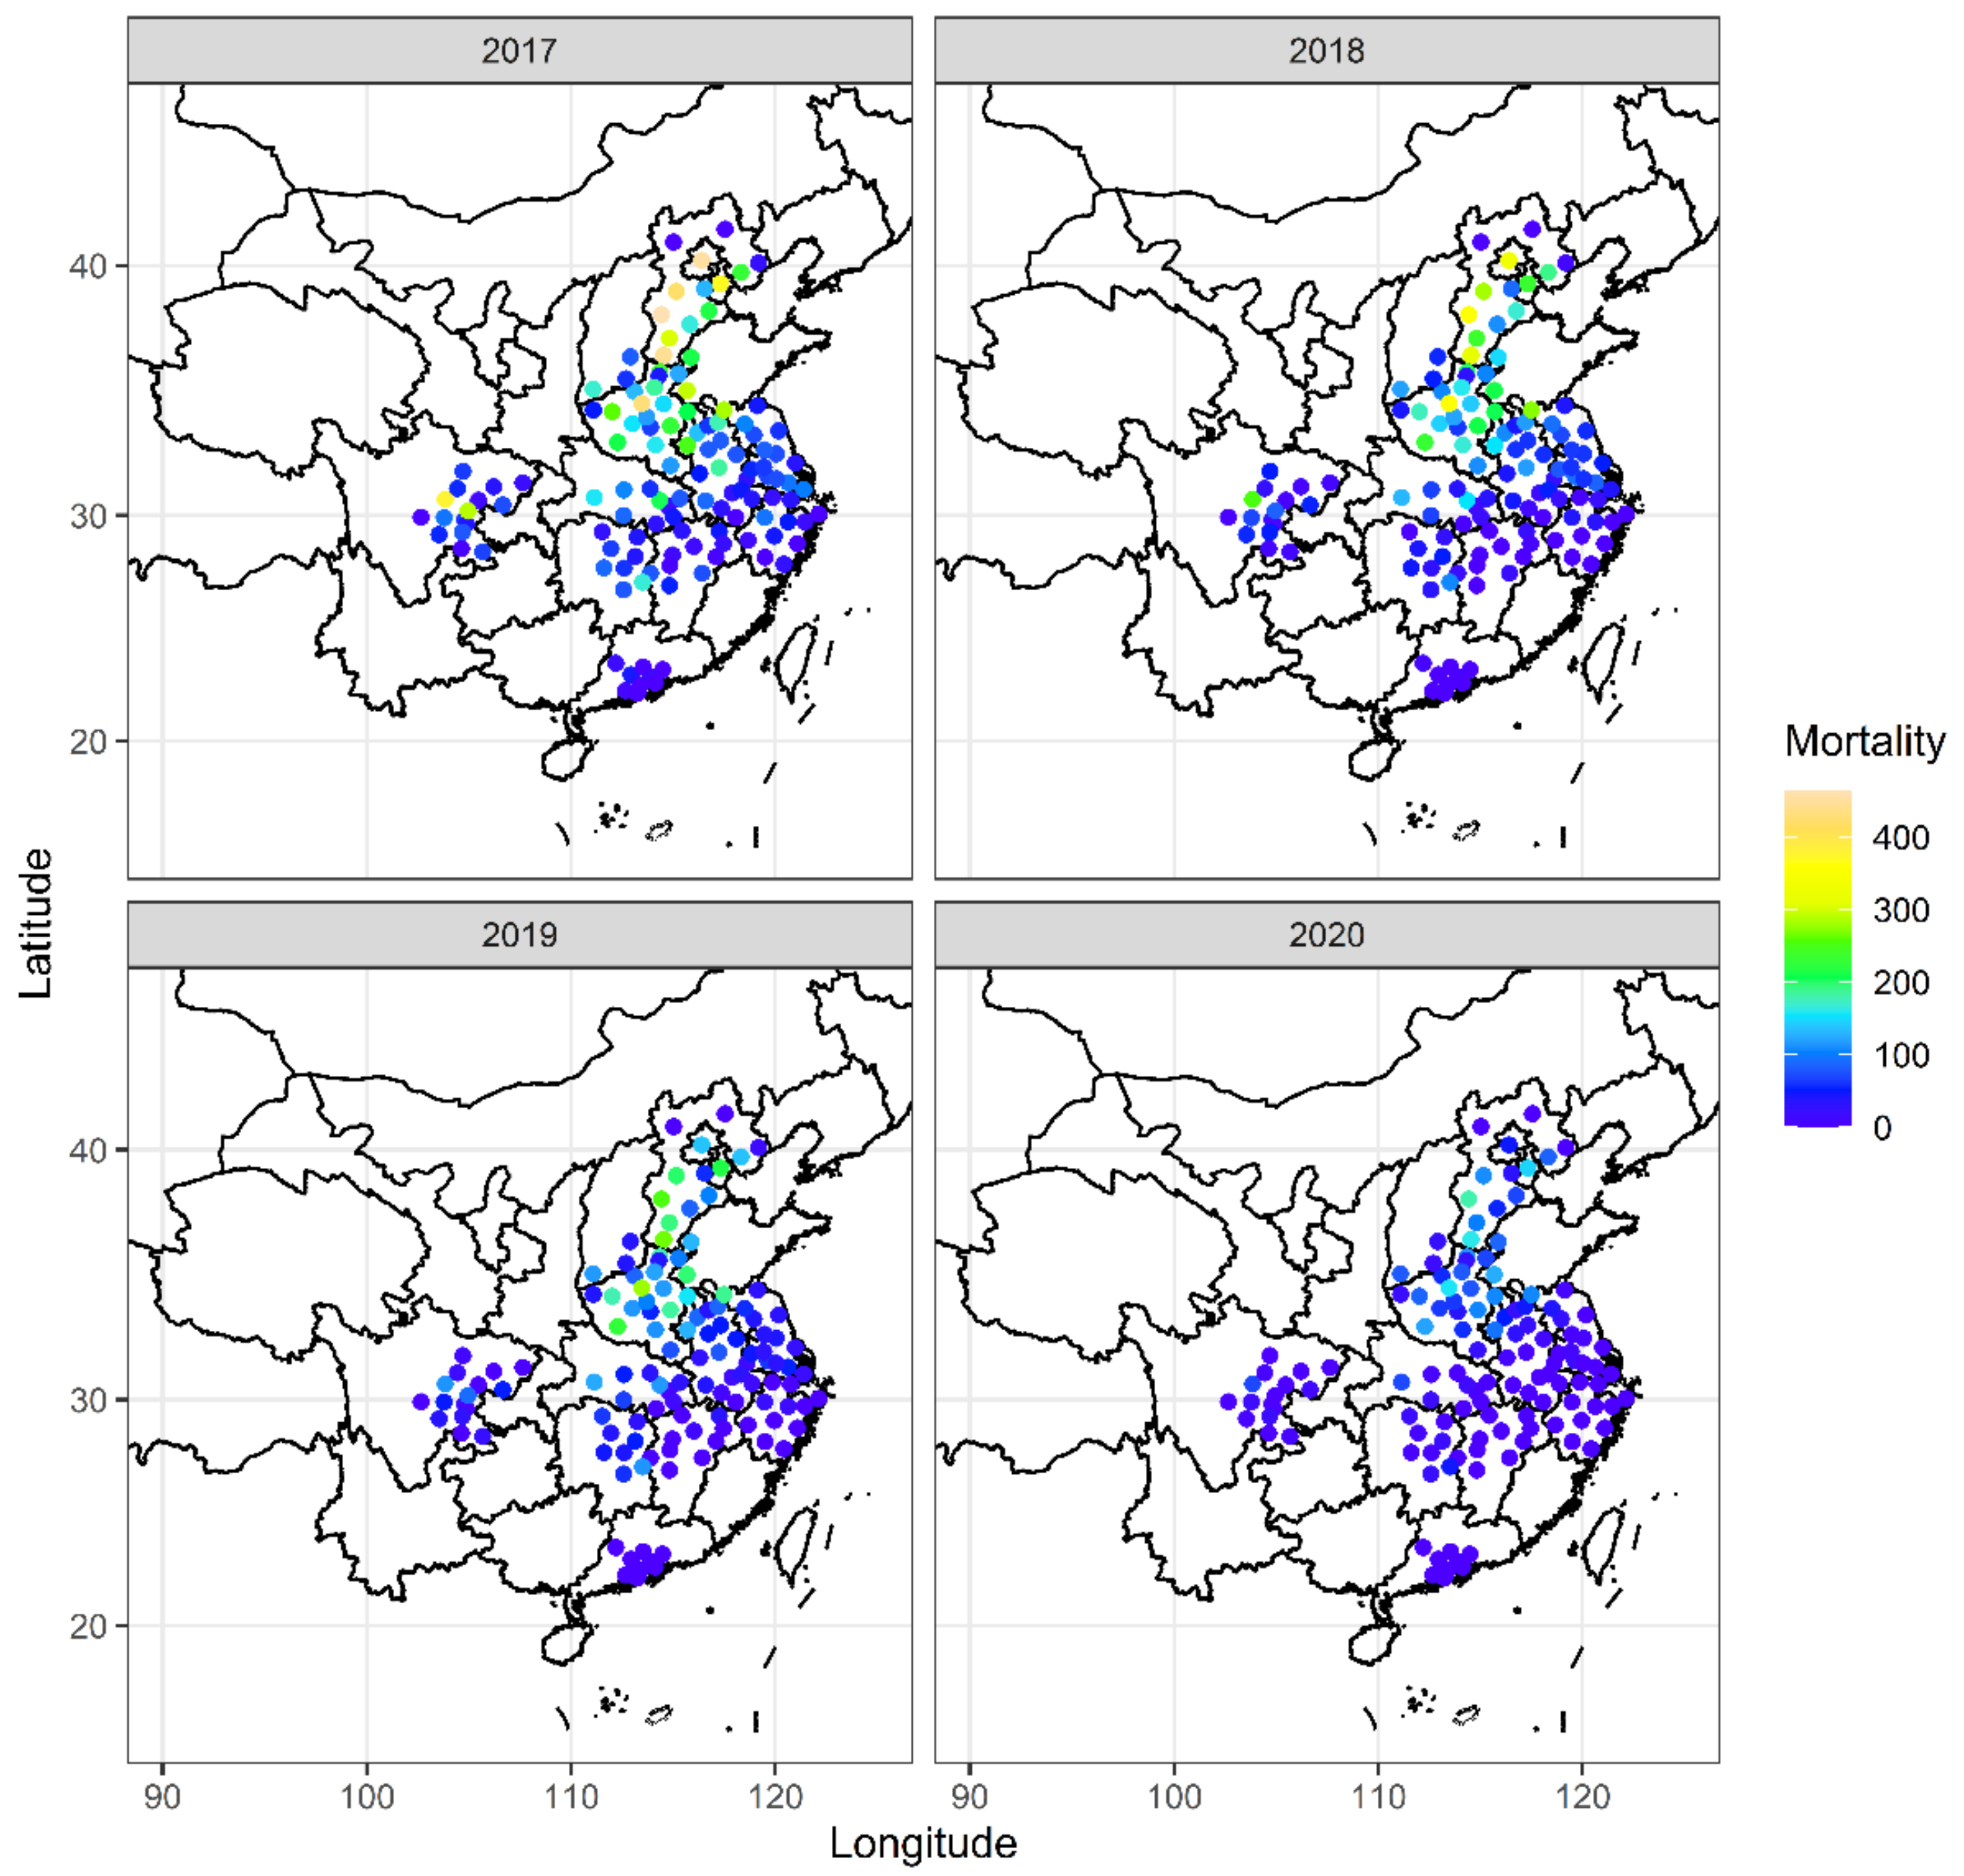
High PM2.5 concentration can cause many health risks, such as respiratory diseases, cardiovascular diseases, and lung cancer. To evaluate the health impacts of PM2.5 pollution in six regions, the respiratory premature mortalities attributed to PM2.5 from 2017 to 2020 were calculated. As displayed in Figure 9, the premature mortalities varied in region and year. The total respiratory premature mortalities in six regions from 2017 to 2020 were 13005, 9357, 7227, and 3504, respectively (Figure 10). In BTH-UA, the respiratory premature mortalities attributed to PM2.5 pollution decreased by 69.4% from 2017 (3223 deaths) to 2020 (987 deaths). Among 13 cities in BTH-UA, the top five with the average premature mortalities over four years were Shijiazhuang (314), Handan (296), Baoding (253), Beijing (243), and Tianjin (241), respectively. Li et al. [66] found that in the BTH-UA, in 2013, only 46% of the total premature deaths were attributable to local consumption, and atmospheric transport of pollutants, mainly from the surrounding areas, accounted for 29% of total deaths. Due to the huge population and high PM2.5 concentration, CP-UA has the highest respiratory premature mortalities in six urban agglomerations, with 3695, 3165, 2686, and 1600 during the period of 2017–2020, respectively. The top five cities with mean premature mortalities related to PM2.5 during the period of 2017–2020 were Zhengzhou (307), Heze (207), Nanyang (197), Anyang (184), and Zhoukou (182). In contrast, the five cities with the lowest mean premature mortalities were Hebi (35), Sanmenxia (39), Jincheng (42), Changzhi (50), and Luohe (54), respectively. The respiratory premature mortalities attributed to PM2.5 pollution in YRD-UA also decreased from 2899, in 2017, to 518, in 2020. Xuzhou, Fuyang and Suzhou were with relatively high mortality. In TC-UA, an 85.5% reduction in premature mortalities from 2017 to 2020 was observed. The most serious city was Wuhan, with an annual average of 122 cases. From 2017 to 2020, respiratory premature mortalities in TC-UA were 1333, 732, 452, and 143, respectively. In CY-UA, the reduction was 89.3% over four years, with 143 deaths in 2020. The population in some cities was almost at the same level, but the estimated premature mortalities were very different. For example, the population of Shanghai is 12.0% larger than that of Beijing, while the premature mortalities in Beijing were five times higher than that in Shanghai. This indicated that premature mortality is sensitive to PM2.5 concentration.

7. Conclusions

To investigate the spatiotemporal patterns and the health impacts of PM2.5 and the relationships with meteorological conditions in Chinese six major urban agglomerations, hourly PM2.5 concentrations and daily meteorological data in 129 cities during the period of 2017–2020 were collected and analyzed.
We found that from 2017 to 2020, PM2.5 concentrations in BTH-UA, CP-UA, YRD-UA, TC-UA, CY-UA, and PRD-UA decreased at a rate of 6.69, 5.57, 5.45, 3.85, 4.66, and 4.1 µg/m3/year, respectively. Among six urban agglomerations, CP-UA has the highest PM2.5 concentration, with 59.8 µg/m3 over four years on average. The obvious decline in PM2.5 concentration in BTH-UA and CP-UA was related to the “2 + 26” regional strategy for air quality improvement. The monthly mean PM2.5 concentrations exhibited a U-shaped trend in all regions, being high in winter and low in summer. We detected that extreme cases (polluted cases) of PM2.5 concentrations decreased in January 2020 compared to other years, owing to the influence of COVID-19. The changes in distribution directions and mean centers of PM2.5 concentrations over four years in six urban agglomerations indicated different spatial patterns of PM2.5. PM2.5 concentrations exhibited positive spatial autocorrelation in BTH-UA, TC-UA, and PRD-UA during the period of 2017–2020. In the other three regions, the spatial autocorrelation varied with the year. In southern BTH-UA, northeastern CP-UA, and northwestern TC-UA, PM2.5 concentrations formed a high–high (HH) agglomeration, respectively, which indicated stricter emissions-control measures and deeper cooperation across cities are needed in these places.
The relationships between PM2.5 concentration and meteorological factors were investigated. Air temperature, pressure, and wind speed have important influences on PM2.5 concentrations. The air temperature was negatively correlated with PM2.5 concentrations, and in the latitude of 30–36° N, the correlation was stronger. RH was a positive correlation with PM2.5 concentration in northern China but a negative correlation in southern China. We detected that meteorological conditions can explain 16.7–63.9% (33.4% on average) of the PM2.5 changes in 129 cities, suggesting that other factors including anthropogenic emissions dominated the PM2.5 changes. In the CP-UA, meteorological conditions can determine 39.8% of PM2.5 concentrations change, which was the highest in six urban agglomerations. This implied that the reduction in PM2.5 concentration in the CP-UA may be due more to meteorological conditions. Benefiting from the decrease in PM2.5 concentration, respiratory premature mortalities in six regions decreased by 69.4, 56.7, 82.1, 85.5, 89.3, and 100% in BTH-UA, CP-UA, YRD-UA, TC-UA, CY-UA, and PRD-UA, respectively, from 2017 to 2020. Among six urban agglomerations, the CP-UA has the highest (2787 deaths for a four-year average) respiratory premature mortality. We suggest stricter emission control measures should be taken in the CP-UA to further reduce PM2.5 concentration.

Supplementary Materials

The following supporting information can be downloaded at: https://www.mdpi.com/article/10.3390/atmos13101696/s1, Figure S1. The variation trend of PM2.5 in six regions by using Theil-Sen estimates from 2017 to 2020; Figure S2. PM2.5 time coefficients decomposed by empirical orthogonal function in six urban ag-glomerations from 2017 to 2020; Figure S3. Diurnal variations of PM2.5 concentrations in six urban agglomerations from 2017 to 2020; Table S1. Parameters of standard deviation ellipse of yearly mean concentrations of PM2.5 in six urban agglomerations from 2017 to 2020.

Author Contributions

Z.L.: data curation, investigation, methodology, software, supervision, writing—original draft, writing—review and editing. X.Z.: methodology. X.L.: methodology, software, supervision. B.Y.: data curation, review and editing. All authors have read and agreed to the published version of the manuscript.

Funding

This work was supported by the Program for Innovative Research Team (in Science and Technology) at the University of Henan Province (Grant No. 22IRTSTHN010) and the Key Science and Technology Research Project of Henan Province of China (Grant No. 18A170013).

Institutional Review Board Statement

Not applicable.

Informed Consent Statement

Not applicable.

Data Availability Statement

The datasets generated during and/or analyzed during the current study are available from the corresponding author on reasonable request.

Acknowledgments

The authors gratefully acknowledge the anonymous reviewers for their excellent comments and efforts. The authors would like to thank the China National Environmental Monitoring Center for providing the data used in our analysis.

Conflicts of Interest

The authors declare no conflict of interest.

References

  1. Huang, R.J.; Zhang, Y.L.; Bozzetti, C.; Ho, K.F.; Cao, J.J.; Han, Y.M.; Daellenbach, K.R.; Slowik, J.G.; Platt, S.M.; Canonaco, F.; et al. High secondary aerosol contribution to particulate pollution during haze events in China. Nature 2014, 514, 218–222. [Google Scholar] [CrossRef] [PubMed] [Green Version]
  2. Zheng, B.; Tong, D.; Li, M.; Liu, F.; Hong, C.P.; Geng, G.N.; Li, H.Y.; Li, X.; Peng, L.Q.; Qi, J.; et al. Trends in China’s anthropogenic emissions since 2010 as the consequence of clean air actions. Atmos. Chem. Phys. 2018, 18, 14095–14111. [Google Scholar] [CrossRef] [Green Version]
  3. Zhang, Q.; Zheng, Y.X.; Tong, D.; Shao, M.; Wang, S.X.; Zhang, Y.H.; Xu, X.D.; Wang, J.N.; He, H.; Liu, W.Q.; et al. Drivers of improved PM2.5 air quality in China from 2013 to 2017. Proc. Natl. Acad. Sci. USA 2019, 116, 24463–24469. [Google Scholar] [CrossRef] [PubMed] [Green Version]
  4. Li, Q.Y.; Li, X.C.; Li, H.T. Factors Influencing PM2.5 concentrations in the Beijing-Tianjin-Hebei urban agglomeration using a geographical and temporal weighted regression model. Atmosphere 2022, 13, 407. [Google Scholar] [CrossRef]
  5. Cao, J.Y.; Qiu, X.H.; Peng, L.; Gao, J.; Wang, F.Y.; Yan, X. Impacts of the differences in PM2.5 air quality improvement on regional transport and health risk in Beijing-Tianjin-Hebei region during 2013–2017. Chemosphere 2022, 297, 134179. [Google Scholar] [CrossRef]
  6. Ming, L.L.; Jin, L.; Li, J.; Fu, P.Q.; Yang, W.Y.; Liu, D.; Zhang, G.; Wang, Z.F.; Li, X.D. PM2.5 in the Yangtze River Delta, China: Chemical compositions, seasonal variations, and regional pollution events. Environ. Pollut. 2017, 223, 200–212. [Google Scholar] [CrossRef]
  7. Huang, J.J.; Zhang, Z.S.; Tao, J.; Zhang, L.M.; Nie, F.L.; Fei, L.L. Source apportionment of carbonaceous aerosols using hourly data and implications for reducing PM2.5 in the Pearl River Delta region of South China. Environ. Res. 2022, 210, 112960. [Google Scholar] [CrossRef]
  8. Hu, W.Y.; Zhao, T.L.; Bai, Y.Q.; Kong, S.F.; Shen, L.J.; Xiong, J.; Zhou, Y.; Gu, Y.; Shi, J.N.; Zheng, H.; et al. Regulation of synoptic circulation in regional PM2.5 transport for heavy air pollution: Study of 5-year observation over central China. J. Geophys. Res.-Atmos. 2022, 127, e2021JD035937. [Google Scholar] [CrossRef]
  9. Chen, L.Y.; Zhang, J.K.; Huang, X.J.; Li, H.; Dong, G.M.; Wei, S.Y. Characteristics and pollution formation mechanism of atmospheric fine particles in the megacity of Chengdu, China. Atmos. Res. 2022, 273, 106172. [Google Scholar] [CrossRef]
  10. Dong, Z.Y.; Li, L.; Lei, Y.L.; Wu, S.M.; Yan, D.; Chen, H. The economic loss of public health from PM2.5 pollution in the Fenwei Plain. Environ. Sci. Pollut. Res. 2021, 28, 2415–2425. [Google Scholar] [CrossRef]
  11. Guan, Y.; Xiao, Y.; Wang, F.Y.; Qiu, X.H.; Zhang, N.N. Health impacts attributable to ambient PM2.5 and ozone pollution in major Chinese cities at seasonal-level. J. Clean. Prod. 2021, 311, 127510. [Google Scholar] [CrossRef]
  12. Wu, X.R.; Xin, J.Y.; Zhang, X.L.; Klaus, S.; Wang, Y.S.; Wang, L.L.; Wen, T.X.; Liu, Z.R.; Si, R.R.; Liu, G.J.; et al. A new approach of the normalization relationship between PM2.5 and visibility and the theoretical threshold, a case in north China. Atmos. Res. 2020, 245, 105054. [Google Scholar] [CrossRef]
  13. Wolffe, M.C.; Wild, O.; Long, S.P.; Ashworth, K. Temporal variability in the impacts of particulate matter on crop yields on the North China Plain. Sci. Total Environ. 2021, 776, 145135. [Google Scholar] [CrossRef]
  14. Maji, K.J.; Dikshit, A.K.; Arora, M.; Deshpande, A. Estimating premature mortality attributable to PM2.5 exposure and benefit of air pollution control policies in China for 2020. Sci. Total Environ. 2018, 612, 683–693. [Google Scholar] [CrossRef]
  15. Li, Y.; Zhao, X.G.; Liao, Q.; Tao, Y.; Bai, Y. Specific differences and responses to reductions for premature mortality attributable to ambient PM2.5 in China. Sci. Total Environ. 2020, 742, 140643. [Google Scholar] [CrossRef]
  16. Zheng, S.; Wu, X.; Lichtfouse, E.; Wang, J. High-resolution mapping of premature mortality induced by atmospheric particulate matter in China. Environ. Chem. Lett. 2022, 20, 2735–2743. [Google Scholar] [CrossRef]
  17. Wang, Q.; Wang, J.N.; Zhou, J.H.; Ban, J.; Li, T.T. Estimation of PM2.5-associated disease burden in China in 2020 and 2030 using population and air quality scenarios: A modelling study. Lancet Planet. Health 2019, 3, E71–E80. [Google Scholar] [CrossRef] [Green Version]
  18. Sun, X.L.; Zhang, R.; Wang, G.Y. Spatial-Temporal Evolution of Health Impact and Economic Loss upon Exposure to PM2.5 in China. Int. J. Environ. Res. Public Health 2022, 19, 1922. [Google Scholar] [CrossRef]
  19. Zhou, L.; Chen, X.H.; Tian, X. The impact of fine particulate matter (PM2.5) on China’s agricultural production from 2001 to 2010. J. Clean. Prod. 2018, 178, 133–141. [Google Scholar] [CrossRef]
  20. Wang, S.W.; Su, H.; Chen, C.C.; Tao, W.; Streets, D.G.; Lu, Z.F.; Zheng, B.; Carmichael, G.R.; Lelieveld, J.; Poschl, U.; et al. Natural gas shortages during the “coal-to-gas” transition in China have caused a large redistribution of air pollution in winter 2017. Proc. Natl. Acad. Sci. USA 2020, 117, 31018–31025. [Google Scholar] [CrossRef]
  21. Zhang, Q.R.; Tong, P.F.; Liu, M.D.; Lin, H.M.; Yun, X.; Zhang, H.R.; Tao, W.; Liu, J.F.; Wang, S.X.; Tao, S.; et al. A WRF-Chem model-based future vehicle emission control policy simulation and assessment for the Beijing-Tianjin-Hebei region, China. J. Environ. Manag. 2020, 253, 109751. [Google Scholar] [CrossRef]
  22. Li, K.; Jacob, D.J.; Liao, H.; Zhu, J.; Shah, V.; Shen, L.; Bates, K.H.; Zhang, Q.; Zhai, S.X. A two-pollutant strategy for improving ozone and particulate air quality in China. Nat. Geosci. 2019, 12, 906. [Google Scholar] [CrossRef]
  23. Chu, B.W.; Ma, Q.X.; Liu, J.; Ma, J.Z.; Zhang, P.; Chen, T.Z.; Feng, Q.C.; Wang, C.Y.; Yang, N.; Ma, H.N.; et al. Air pollutant correlations in China: Secondary air pollutant responses to NOx and SO2 control. Environ. Sci. Technol. Lett. 2020, 7, 695–700. [Google Scholar] [CrossRef]
  24. Qi, G.Z.; Wang, Z.B.; Wei, L.J.; Wang, Z.X. Multidimensional effects of urbanization on PM2.5 concentration in China. Environ. Sci. Pollut. Res. 2022, 1, 1–16. [Google Scholar] [CrossRef]
  25. Zhao, X.L.; Zhou, W.Q.; Han, L.J.; Locke, D. Spatiotemporal variation in PM2.5 concentrations and their relationship with socioeconomic factors in China’s major cities. Environ. Int. 2019, 133, 105145. [Google Scholar] [CrossRef]
  26. Shen, Y.; Zhang, L.P.; Fang, X.; Ji, H.Y.; Li, X.; Zhao, Z.W. Spatiotemporal patterns of recent PM2.5 concentrations over typical urban agglomerations in China. Sci. Total Environ. 2019, 655, 13–26. [Google Scholar] [CrossRef]
  27. Chen, Z.; Chen, D.; Zhao, C.; Kwan, M.P.; Cai, J.; Zhuang, Y.; Zhao, B.; Wang, X.; Chen, B.; Yang, J.; et al. Influence of meteorological conditions on PM2.5 concentrations across China: A review of methodology and mechanism. Environ. Int. 2020, 139, 105558. [Google Scholar] [CrossRef]
  28. Chen, Z.Y.; Xie, X.M.; Cai, J.; Chen, D.L.; Gao, B.B.; He, B.; Cheng, N.L.; Xu, B. Understanding meteorological influences on PM2.5 concentrations across China: A temporal and spatial perspective. Atmos. Chem. Phys. 2018, 18, 5343–5358. [Google Scholar] [CrossRef] [Green Version]
  29. Liao, T.T.; Wang, S.; Ai, J.; Gui, K.; Duan, B.L.; Zhao, Q.; Zhang, X.; Jiang, W.T.; Sun, Y. Heavy pollution episodes, transport pathways and potential sources of PM2.5 during the winter of 2013 in Chengdu (China). Sci. Total Environ. 2017, 584, 1056–1065. [Google Scholar] [CrossRef]
  30. Liu, X.Y.; Wang, M.S.; Pan, X.L.; Wang, X.Y.; Yue, X.L.; Zhang, D.H.; Ma, Z.G.; Tian, Y.; Liu, H.; Lei, S.D.; et al. Chemical formation and source apportionment of PM2.5 at an urban site at the southern foot of the Taihang mountains. J. Environ. Sci. 2021, 103, 20–32. [Google Scholar] [CrossRef]
  31. Tian, Y.L.; Zhang, L.N.; Wang, Y.; Song, J.X.; Sun, H.T. Temporal and spatial trends in particulate matter and the responses to meteorological conditions and environmental management in Xi’an, China. Atmosphere 2021, 12, 1112. [Google Scholar] [CrossRef]
  32. Yang, W.L.; Wang, G.C.; Bi, C.J. Analysis of Long-range transport effects on PM2.5 during a short severe haze in Beijing, China. Aerosol Air Qual. Res. 2017, 17, 1610–1622. [Google Scholar] [CrossRef]
  33. Xu, W.T.; Wang, Y.X.; Sun, S.; Yao, L.; Li, T.; Fu, X.C. Spatiotemporal heterogeneity of PM2.5 and its driving difference comparison associated with urbanization in China’s multiple urban agglomerations. Environ. Sci. Pollut. Res. 2022, 29, 29689–29703. [Google Scholar] [CrossRef] [PubMed]
  34. Yang, Q.Q.; Yuan, Q.Q.; Li, T.W.; Shen, H.F.; Zhang, L.P. The relationships between PM2.5 and meteorological factors in China: Seasonal and regional variations. Int. J. Environ. Res. Public Health 2017, 14, 1510. [Google Scholar] [CrossRef] [PubMed] [Green Version]
  35. Deng, C.X.; Qin, C.Y.; Li, Z.W.; Li, K. Spatiotemporal variations of PM2.5 pollution and its dynamic relationships with meteorological conditions in Beijing-Tianjin-Hebei region. Chemosphere 2022, 301, 134640. [Google Scholar] [CrossRef]
  36. Chen, D.; Liu, Z.Q.; Ban, J.M.; Zhao, P.S.; Chen, M. Retrospective analysis of 2015-2017 wintertime PM2.5 in China: Response to emission regulations and the role of meteorology. Atmos. Chem. Phys. 2019, 19, 7409–7427. [Google Scholar] [CrossRef] [Green Version]
  37. Liu, X.; Zhao, C.; Shen, X.; Jin, T. Spatiotemporal variations and sources of PM2.5 in the Central Plains Urban Agglomeration, China. Air Qual. Atmos. Health 2022, 15, 1507–1521. [Google Scholar] [CrossRef]
  38. Fu, X.S.; Li, L.; Lei, Y.L.; Wu, S.M.; Yan, D.; Luo, X.M.; Luo, H. The economic loss of health effect damages from PM2.5 pollution in the Central Plains Urban Agglomeration. Environ. Sci. Pollut. Res. 2020, 27, 25434–25449. [Google Scholar] [CrossRef]
  39. Sun, X.W.; Cheng, S.Y.; Lang, J.L.; Ren, Z.H.; Sun, C. Development of emissions inventory and identification of sources for priority control in the middle reaches of Yangtze River urban agglomerations. Sci. Total Environ. 2018, 625, 155–167. [Google Scholar] [CrossRef]
  40. Liao, Z.H.; Xie, J.L.; Fang, X.Q.; Wang, Y.; Zhang, Y.; Xu, X.Q.; Fan, S.J. Modulation of synoptic circulation to dry season PM2.5 pollution over the Pearl River Delta region: An investigation based on self-organizing maps. Atmos. Environ. 2020, 230, 117482. [Google Scholar] [CrossRef]
  41. Shi, X.Q.; Zhao, C.F.; Jiang, J.H.; Wang, C.Y.; Yang, X.; Yung, Y.L. Spatial representativeness of PM2.5 concentrations obtained using observations from network stations. J. Geophys. Res.-Atmos. 2018, 123, 3145–3158. [Google Scholar] [CrossRef] [Green Version]
  42. Jiang, L.; He, S.X.; Zhou, H.F. Spatio-temporal characteristics and convergence trends of PM2.5 pollution: A case study of cities of air pollution transmission channel in Beijing-Tianjin-Hebei region, China. J. Clean. Prod. 2020, 256, 120631. [Google Scholar] [CrossRef]
  43. Peng, J.; Chen, S.; Lü, H.; Liu, Y.; Wu, J. Spatiotemporal patterns of remotely sensed PM2.5 concentration in China from 1999 to 2011. Remote Sens. Environ. 2016, 174, 109–121. [Google Scholar] [CrossRef]
  44. Cao, Z.; Wu, Z.F.; Li, S.Y.; Ma, W.J.; Deng, Y.J.; Sun, H.; Guan, W.C. Exploring spatiotemporal variation characteristics of exceedance air pollution risk using social media big data. Environ. Res. Lett. 2020, 15, 114049. [Google Scholar] [CrossRef]
  45. Ding, Y.T.; Zhang, M.; Qian, X.Y.; Li, C.R.; Chen, S.; Wang, W.W. Using the geographical detector technique to explore the impact of socioeconomic factors on PM2.5 concentrations in China. J. Clean. Prod. 2019, 211, 1480–1490. [Google Scholar] [CrossRef]
  46. Xue, T.; Liu, J.; Zhang, Q.; Geng, G.N.; Zheng, Y.X.; Tong, D.; Liu, Z.; Guan, D.B.; Bo, Y.; Zhu, T.; et al. Rapid improvement of PM2.5 pollution and associated health benefits in China during 2013–2017. Sci. China-Earth Sci. 2019, 62, 1847–1856. [Google Scholar] [CrossRef]
  47. Xu, X.M.; Zhang, W.; Zhu, C.; Li, J.R.; Wang, J.; Li, P.C.; Zhao, P.Y. Health risk and external costs assessment of PM2.5 in Beijing during the “Five-year Clean Air Action Plan”. Atmos. Pollut. Res. 2021, 12, 101089. [Google Scholar] [CrossRef]
  48. Chen, Z.Y.; Chen, D.L.; Wen, W.; Zhuang, Y.; Kwan, M.P.; Chen, B.; Zhao, B.; Yang, L.; Gao, B.B.; Li, R.Y.; et al. Evaluating the “2+26” regional strategy for air quality improvement during two air pollution alerts in Beijing: Variations in PM2.5 concentrations, source apportionment, and the relative contribution of local emission and regional transport. Atmos. Chem. Phys. 2019, 19, 6879–6891. [Google Scholar] [CrossRef] [Green Version]
  49. Qu, L.L.; Liu, S.J.; Ma, L.L.; Zhang, Z.Z.; Du, J.H.; Zhou, Y.H.; Meng, F. Evaluating the meteorological normalized PM2.5 trend (2014–2019) in the “2+26” region of China using an ensemble learning technique. Environ. Pollut. 2020, 266, 115346. [Google Scholar] [CrossRef]
  50. Chu, B.W.; Zhang, S.P.; Liu, J.; Ma, Q.X.; He, H. Significant concurrent decrease in PM2.5 and NO2 concentrations in China during COVID-19 epidemic. J. Environ. Sci. 2021, 99, 346–353. [Google Scholar] [CrossRef]
  51. Sen, A.; Abdelmaksoud, A.S.; Ahammed, Y.N.; Alghamdi, M.A.; Banerjee, T.; Bhat, M.A.; Chatterjee, A.; Choudhuri, A.K.; Das, T.; Dhir, A.; et al. Variations in particulate matter over Indo-Gangetic Plains and Indo-Himalayan Range during four field campaigns in winter monsoon and summer monsoon: Role of pollution pathways. Atmos. Environ. 2017, 154, 200–224. [Google Scholar] [CrossRef]
  52. Liu, L.; Duan, Y.; Li, L.; Xu, L.; Yang, Y.; Cu, X. Spatiotemporal trends of PM2.5 concentrations and typical regional pollutant transport during 2015–2018 in China. Urban Clim. 2020, 34, 100710. [Google Scholar] [CrossRef]
  53. Zhao, D.T.; Chen, H.; Sun, X.K.; Shi, Z.Z. Spatio-temporal variation of PM2.5 pollution and its relationship with meteorology among five megacities in China. Aerosol Air Qual. Res. 2018, 18, 2318–2331. [Google Scholar] [CrossRef]
  54. Li, Q.H.; Wu, B.G.; Liu, J.L.; Zhang, H.S.; Cai, X.H.; Song, Y. Characteristics of the atmospheric boundary layer and its relation with PM2.5 during haze episodes in winter in the North China Plain. Atmos. Environ. 2020, 223, 117265. [Google Scholar] [CrossRef]
  55. Wang, L.L.; Xiong, Q.L.; Wu, G.F.; Gautam, A.; Jiang, J.F.; Liu, S.; Zhao, W.J.; Guan, H.L. Spatio-temporal variation characteristics of PM2.5 in the Beijing-Tianjin-Hebei Region, China, from 2013 to 2018. Int. J. Environ. Res. Public Health 2019, 16, 4276. [Google Scholar] [CrossRef] [Green Version]
  56. Wen, W.; Shen, S.; Liu, L.; Ma, X.; Wei, Y.; Wang, J.K.; Xing, Y.; Su, W. Comparative analysis of PM2.5 and O3 source in Beijing using a chemical transport model. Remote Sens. 2021, 13, 3457. [Google Scholar] [CrossRef]
  57. Xu, Y.L.; Xue, W.B.; Lei, Y.; Huang, Q.; Zhao, Y.; Cheng, S.Y.; Ren, Z.H.; Wang, J.N. Spatiotemporal variation in the impact of meteorological conditions on PM2.5 pollution in China from 2000 to 2017. Atmos. Environ. 2020, 223, 117215. [Google Scholar] [CrossRef]
  58. Yang, Y.; Liao, H.; Lou, S. Increase in winter haze over eastern China in recent decades: Roles of variations in meteorological parameters and anthropogenic emissions. J. Geophys. Res.-Atmos. 2016, 121, 13050–13065. [Google Scholar] [CrossRef] [Green Version]
  59. Wei, L.F.; Duan, J.C.; Tan, J.H.; Ma, Y.L.; He, K.B.; Wang, S.X.; Huang, X.F.; Zhang, Y.X. Gas-to-particle conversion of atmospheric ammonia and sampling artifacts of ammonium in spring of Beijing. Sci. China-Earth Sci. 2015, 58, 345–355. [Google Scholar] [CrossRef]
  60. Qi, L.; Zheng, H.T.; Ding, D.; Ye, D.C.; Wang, S.X. Effects of meteorology changes on inter-annual variations of aerosol optical depth and surface PM2.5 in China-implications for PM2.5 remote sensing. Remote Sens. 2022, 14, 2762. [Google Scholar] [CrossRef]
  61. Hsu, C.H.; Cheng, F.Y. Classification of weather patterns to study the influence of meteorological characteristics on PM2.5 concentrations in Yunlin County, Taiwan. Atmos. Environ. 2016, 144, 397–408. [Google Scholar] [CrossRef]
  62. Guo, J.P.; Miao, Y.C.; Zhang, Y.; Liu, H.; Li, Z.Q.; Zhang, W.C.; He, J.; Lou, M.Y.; Yan, Y.; Bian, L.G.; et al. The climatology of planetary boundary layer height in China derived from radiosonde and reanalysis data. Atmos. Chem. Phys. 2016, 16, 13309–13319. [Google Scholar] [CrossRef] [Green Version]
  63. Sun, Y.; Zhao, C.F.; Su, Y.F.; Ma, Z.S.; Li, J.M.; Letu, H.; Yang, Y.K.; Fan, H. Distinct impacts of light and heavy precipitation on PM2.5 mass concentration in Beijing. Earth Space Sci. 2019, 6, 1915–1925. [Google Scholar] [CrossRef] [Green Version]
  64. Zhang, W.J.; Wang, H.; Zhang, X.Y.; Peng, Y.; Zhong, J.T.; Zhao, Y.F. Evaluating the contributions of changed meteorological conditions and emission to substantial reductions of PM2.5 concentration from winter 2016 to 2017 in Central and Eastern China. Sci. Total Environ. 2020, 716, 136892. [Google Scholar] [CrossRef] [PubMed]
  65. Chen, Z.Y.; Chen, D.L.; Kwan, M.P.; Chen, B.; Gao, B.B.; Zhuang, Y.; Li, R.Y.; Xu, B. The control of anthropogenic emissions contributed to 80% of the decrease in PM2.5 concentrations in Beijing from 2013 to 2017. Atmos. Chem. Phys. 2019, 19, 13519–13533. [Google Scholar] [CrossRef] [Green Version]
  66. Li, X.; Zhao, H.Y.; Xue, T.; Geng, G.N.; Zheng, Y.X.; Li, M.; Zheng, B.; Li, H.Y.; Zhang, Q. Consumption-based PM2.5-related premature mortality in the Beijing-Tianjin-Hebei region. Sci. Total Environ. 2021, 800, 149575. [Google Scholar] [CrossRef]
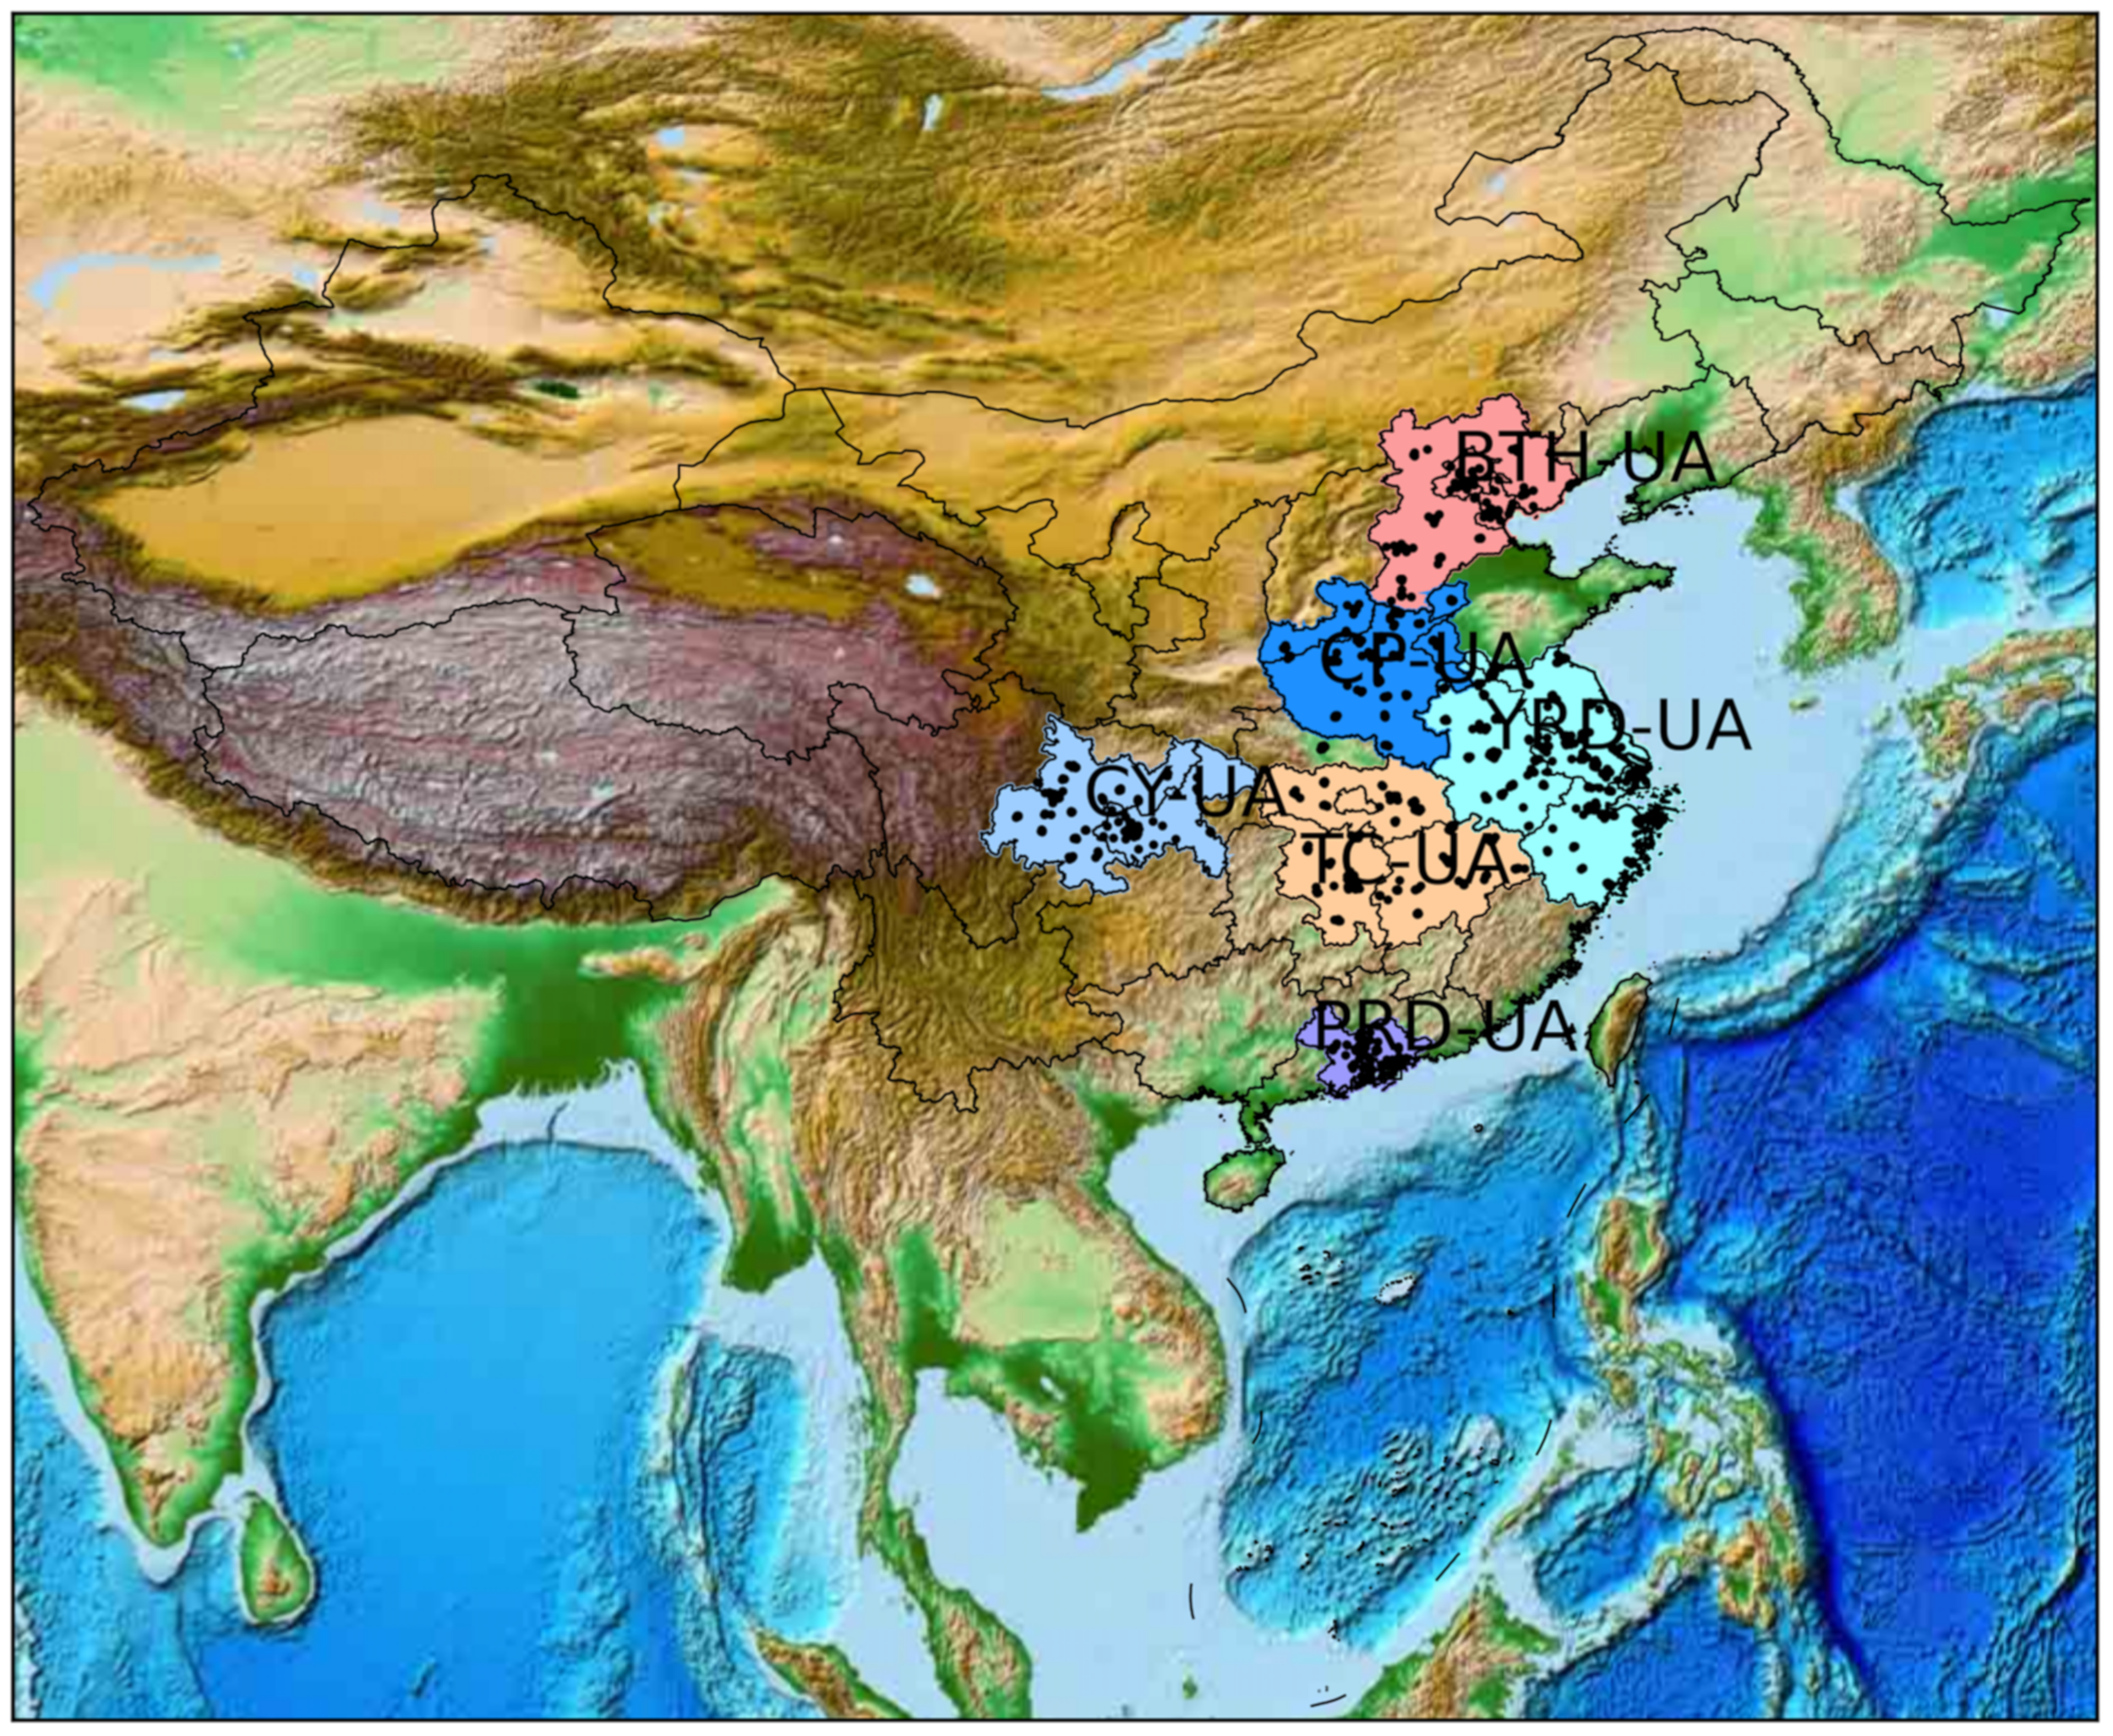
Figure 1. The locations of six major urban agglomerations in China: Beijing–Tianjin–Hebei urban agglomeration (BTH-UA), Central Plains urban agglomeration (CP-UA), Yangtze River Delta urban agglomeration (YRD-UA), Triangle of Central China urban agglomeration (TC-UA), Chengdu–Chongqing urban agglomeration (CY-UA), and Pearl River Delta urban agglomeration (PRD-UA). The black dots represent air-quality monitoring stations.
Atmosphere 13 01696 g001
Figure 2. Kernel density estimates of yearly average PM2.5 concentrations in six urban agglomerations of China. (a) BTH-UA, (b) CP-UA, (c) YRD-UA, (d) TC-UA, (e) CY-UA and (f) PRD-UA.
Atmosphere 13 01696 g002
Figure 3. Monthly average mass concentration of PM2.5 in six urban agglomerations of China over the period of 2017–2020. Shown are the median (central horizontal bar within the boxes), 25th and 75th percentiles (lower and upper bars of the boxes, respectively), and minimum and maximum (lower and upper whiskers, respectively). (a) BTH-UA, (b) CP-UA, (c) YRD-UA, (d) TC-UA, (e) CY-UA and (f) PRD-UA.
Atmosphere 13 01696 g003
Figure 4. Diurnal changes in PM2.5 concentrations on different days over the period of 2017–2020 in six urban agglomerations of China. (a) BTH-UA, (b) CP-UA, (c) YRD-UA, (d) TC-UA, (e) CY-UA and (f) PRD-UA.
Atmosphere 13 01696 g004
Figure 5. Spatial changes in the mean center and standard deviation ellipse (directional distributions) of PM2.5 concentrations in six urban agglomerations of China, from 2017 to 2020. (a) BTH-UA, (b) CP-UA, (c) YRD-UA, (d) TC-UA, (e) CY-UA and (f) PRD-UA.
Atmosphere 13 01696 g005aAtmosphere 13 01696 g005b
Figure 6. Spatial patterns of PM2.5 in the (a) BTH-UA, (b) CP-UA, (c) YRD-UA, (d) TC-UA, (e) CY-UA and (f) PRD-UA over the period of 2017–2020.
Atmosphere 13 01696 g006
Figure 7. The Pearson coefficient values in six urban agglomerations during the period of 2017–2020: (a) correlation between PM2.5 concentration and T; (b) correlation between PM2.5 concentration and P; (c) correlation between PM2.5 concentration and RH; (d) correlation between PM2.5 concentration and WS; (e) correlation between PM2.5 concentration and Pre; and (f) correlation between PM2.5 concentration and SSD. n refers to the number of sites that pass the significance test at a 95% confidence level.
Atmosphere 13 01696 g007
Figure 8. The variance contribution of the fitting values from meteorological factors to the observed PM2.5 concentrations in six urban agglomerations during the period of 2017–2020.
Atmosphere 13 01696 g008
Figure 9. The spatial distributions of premature mortality for respiratory disease attributed to PM2.5 exposure in six urban agglomerations, from 2017 to 2020.
Atmosphere 13 01696 g009
Figure 10. Bar chart of premature mortality for respiratory disease attributed to PM2.5 exposure in six urban agglomerations, from 2017 to 2020.
Atmosphere 13 01696 g010
Table 1. Global Moran’s I index of PM2.5 concentrations in different years and seasons.
RegionYearSeason
2017201820192020SpringSummerAutumnWinter
BTH-UA1.951.881.991.800.680.801.742.45
CP-UA0.88−0.470.130.670.441.910.63−0.22
YRD-UA−0.44−0.06−0.230.03−0.442.581.792.78
TC-UA1.261.692.262.021.261.780.080.72
CY-UA0.110.20−0.060.170.17−0.190.150.21
PRD-UA0.920.400.140.240.600.830.030.43
Publisher’s Note: MDPI stays neutral with regard to jurisdictional claims in published maps and institutional affiliations.