Abstract
This manuscript presents a study of the possibility of applying metallic fibre filter media made of stainless steel for the filtration process of liquid aerosols. To perform the experiment, three types of filters were used: single layer and symmetric or non-symmetric multi-layered filters. Filters have been loaded with DEHS (Di-Ethyl-Hexyl-Sebacate) aerosol while the pressure drop and the collection efficiency were monitored. The impact of the filtration velocity on the saturation pressure drop has been quantified for monolayer filters. The building of a draining film on the free surface of the multi-layered filters has been studied and the impact of this phenomenon on the filtration performances and saturation ratio of the medium are discussed. For multilayer filters, the clogging dynamic, occurring by a successive loading of the draining layers, is highlighted in this work. Finally, propositions are made to evaluate the behaviour of metallic multi-layered filters for liquid aerosol filtration applications.
1. Introduction
In many industries dealing with potentially contaminating hazardous materials, the purification of the air from any airborne pollution is ensured by HEPA (high-efficiency particulate air) filters. Those filters, often made of glass fibres, are used for their very high efficiency and the relatively good value for money. Their main drawback lies in their pressure drop increase and their relatively low mechanical resistance, especially for the accidental scenario where liquid aerosol could be released. This scenario needs to be considered, especially for nuclear application where the use of overheated vapour or heated solutions might lead to a release of liquid particles in a confined room in the event of an accident.
To overcome the difficulties induced by this kind of unexpected failure, the use of a metallic prefiltration stage is one of the reliable solutions considered. This kind of filter presents a very high mechanical resistance and could, due to their clogging, reduce the ventilation flow, and thereby, prevent any excessive loading of the HEPA filters present downstream. Metallic filter media are classically made of a superposition of fibrous layers presenting different structural properties (fibre size, thickness and packing density). This design is not only made to ensure the filtration performances (which is mainly driven by the internal layers with a smaller fibre diameter), but also to ensure the cohesion of the fibres during the fabrication of the filter, especially the pleating process.
Filtration of liquid aerosol by fibrous media has been studied by different authors [1,2,3]. They have shown the typical behaviour of such filters when exposed to liquid particles. However, few of them have focused on metallic media. Moreover, study related to multi-layered metallic filters is almost inexistent.
The present work aims to characterise the pressure drop increase and, more specifically, its relationship with the accumulated quantity of liquid accumulated in the media.
In the literature, many studies have been proposed concerning the clogging of non-metallic fibrous media by a liquid aerosol (Table 1). Contal et al. [2] describe the loading of a glass fibre filter by a liquid in terms of the pressure drop. The pressure drop increases following different steps (Figure 1) [3]:
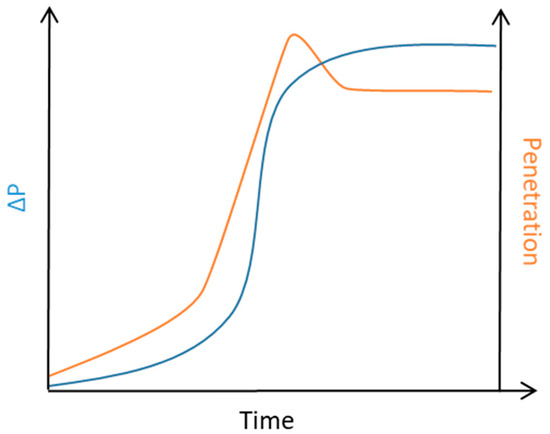
Figure 1.
Pressure drop evolution and penetration (for particles < 10 µm) as a function of time.
- In the beginning of the loading process, for low accumulated mass, the pressure drop and the filtration efficiency increase slightly and linearly since the droplets collected on fibres have a low influence on the overall structure of the filter;
- When the amount of droplets present in the medium increases, they coalesce, forming liquid bridges between the fibres. This induces an exponential increase of the pressure drop. During this step, the increase of the interstitial velocity of the air within the medium increases the collection efficiency for thicker droplets (collected by inertial mechanism) while the thinnest ones (collected by Brownian diffusion) will be less efficiently collected;
- From a certain volume of liquid within the medium, a steady state occurs: a balance is reached between the quantity of liquid collected and the quantity drained downstream. The pressure drop and the collection efficiency no longer evolve. The fibrous structure is saturated with liquid; this is the final stationary step.
During this last step, some authors [4,5] reported a bubbling phenomenon on the downstream surface of the filter. This phenomenon is due to the explosion of bubbles present in a liquid film drained out of the fibrous structure. The fragmentation of those bubbles leads to a resuspension of droplets downstream of the filter [4,5,6].
Charvet et al. [4] studied the influence of the filtration velocity on the airflow resistance. They have shown that a high filtration velocity leads to a lower airflow resistance of the filter. This is due to the fact that liquid transport within the medium is only driven by capillary forces. Those forces, independent of the filtration velocity, impose a balance with the force induced by the pressure drop. This leads, up to a certain point, to a pressure drop almost independent of the filtration velocity.
The overlaying of different media made of glass fibres has been studied in the past in order to enhance the collection efficiency by adding a coarse draining layer [7,8]. Chang et al. [7] have concluded that the filtration performances (pressure drop reached at the saturation and collection efficiency) of all filters tested have been significantly enhanced through the addition of a thick layer downstream of the filter. They explained this by the reorganisation of the liquid within the medium, and consequently, by the reduction of the thickness of the liquid draining film formed at the free outer surface of the medium. Their conclusion about the impact of the presence of a coarse medium have been extended by Penner et al. [9] who showed the impact of the position of a draining layer (on a free surface or between other fibrous layers) and the wettability of the medium considered. According to them, the impact of the properties and organisation of the various layers on saturation pressure drop and efficiency mainly lies on the distribution of the liquid within the fibres.

Table 1.
Summary of some works on the clogging of filters by liquid aerosol: nature and properties of filters, filtration rate and aerosol size.
Table 1.
Summary of some works on the clogging of filters by liquid aerosol: nature and properties of filters, filtration rate and aerosol size.
| Articles | Material Filter | Fibre Mean Diameter (µm) | Thickness (mm) | Packing Density | Filtration Velocity (cm/s) | Particle Size Aerosol (µm) |
|---|---|---|---|---|---|---|
| Bredin et al. [10] | Stainless steel | 4.2, 2.3 and 7.8 | 8 and 9 | 0.019 and 0.024 | 6.8 | - |
| Charvet et al. [4] | Cellulose | - | 0.68 | 0.05 | 5 to 42 | 0.3 and 20 |
| Charvet et al. [11] | Cellulose | - | 0.34 | 0.28 | 11 to 42 | - |
| Chang et al. [7] | Glassdraining layer: polyester, polypropylene andpolyamid (non-wettable and wettable) | - | Filter: 0.58Draining layer: 1.60 to 2.20 | - | 10 | 0.3–0.6 |
| Contal et al. [2] | Glass | 0.36 to 3.19 | 0.410 to 0.460 | 0.061 to 0.078 | 2.5 to 19 | 0.6 |
| Frising et al. [12] | Glass | 1.21 | 0.409 | 0.078 | 5.8, 15.4 and 25 | 0.18 |
| Kampa et al. [13] | Glass | ≈ 1 | 0.5 | 0.05 | 25 | 0.3 |
| Liew et al. [14] | Stainlees steel | 4 to 22 | 3 to 10 | 0.004 to 0.012 | 5 | 0.2 and 8 |
| Manzo et al. [15] | Stainless steel or glass | Glass fibres: 2 and 6Stainless steel fibres: 2 and 6.5 | 1 | - | 10 | - |
| Mead-Hunter et al. [16] | Stainless steel or glass | Glass fibres: 0.62 to 1.24Stainless steel fibres: 4 to 6.4 | Glass fibres: 0.39 to 0.65Stainless steel fibres: 5.08 to 6.90 | Glass fibres: 0.54 to 0.074Stainless steel fibres: 0.016 to 0.022 | 3.3 to 92.8 | - |
| Penner et al. [9] | Glass (wettable and non-wettable) | - | 0.4 to 0.7 | 0.06 to 0.07 | 25 | - |
| Wurster et al. [5] | Glass (wettable and non-wettable) | 1.5 | 0.5 | 0.05 | 15–65 | 0.3 |
Most of the studies concerning the loading of filters with liquid aerosol have been made for glass fibres (Table 1). It is, therefore, justified to carry on a specific study concerning metallic filters. Indeed, the wettability of the fibres seems to be an influent parameter regarding the results obtained with other fibrous materials. Moreover, existing studies are focused on the study of filters made of different layers with various wettability whereas metallic filters are made of layers composed by the same material.
Many models have been developed to predict the clogging of filters by a liquid aerosol [3,11,13,16]. In these models two approaches have been used, a fibre growth approach with the liquid, and a capillary approach. The model using the growth of a fibre with the liquid is a dynamic one, allowing to determine the evolution of the pressure drop and the efficiency [11]. Another dynamic approach was conducted by Kampa et al. [13] who modelled the differential pressure (ΔP) of a filter loaded with a liquid aerosol by dissociating the regions where the liquid is in the form of a thin film and the regions where the liquid is organised in parallel channels (named ΔPjump and ΔPchannel, respectively) [13]. While the capillary approach is used to predict the pressure drop at saturation. Mead-Hunter et al. [16] determined the saturation pressure drop of single- and multi-layer glass fibre and stainless steel filters using a capillary model. In this model, Mead-Hunter et al. [16] compared filter clogging to that of a capillary filling with liquid. Most of these models have been developed on the basis of experiments, so one has to be in the same operating condition to use them (empirical model).
2. Materials and Methods
2.1. Description of the Test Bench
The test bench (detailed Figure 2) used to load the filters is composed of two parallel ways separated by a remote valve. The two ways are similar. The measurement way contains the filter holder and the pressure drop transductor, while the reference way is a by-pass allowing the characterisation of the upstream aerosol. The flowrate is controlled using a Brooks mass air flow controller (flow rate varying from 0.4 nL/min to 8 nL/min); filtration velocities between 0.8 and 16 cm/s have been tested. Thus, the mass concentrations vary between 6 and 110 mg/min. During the experiment, the pressure upstream of the filter remains at the atmospheric pressure. The measurement of the aerosol distribution and concentration is ensured by sampling the air in a dilution loop and using a TSI SMPS and a Palas Welas. The instrument exhausts are connected to the downstream part of the test bench to equilibrate the pressure, and thereby, to avoid any overpressure inducing an instrumental bias in the measurement. This configuration also presents the advantage of ensuring a constant flowrate inside the filter independently of the sampling flowrate.
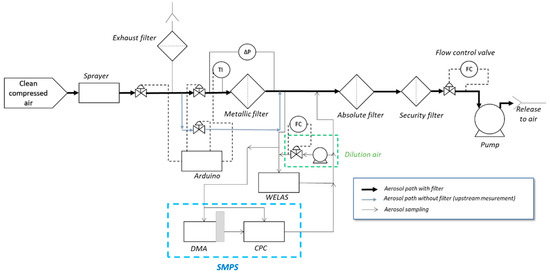
Figure 2.
Experimental set-up.
The test aerosol is produced using a Pallas AGF 2.0 nebuliser from a DEHS (di(ethylhexyl) sebacate) in order to avoid the evaporation of liquid droplet during the experiment. The number mean diameter measured is around 250 nm. According to the SMPS measurement (CPC 3752 and DMA 3082), the aerosol follows a log-normal distribution with a geometric standard deviation of 1.7 and a number median diameter of 354 nm. A log normal fitting has been applied on the measured distribution to compute the mass concentration upstream and downstream of the tested filter. From those computed mass, the filtration efficiency and the cumulated mass in the filter at each time step have been computed (Cf. Appendix A).
2.2. Filter Media Structural Properties
The metallic filters used in this study are no-pleated disc with a diameter of 32 mm (the filtration area is 80 mm2) and they are made of different layers presenting various characteristics in terms of fibre diameters, packing density or thickness (Figure 3). This figure shows a cross-section view of a metal filter frozen in resin (according to the method described in [17]) using a scanning electron microscope. Once the filter is set in the resin, the sample is polished to a finer and finer grit until it reaches the filter. In this study, the mean fibre diameter is between 1 and 13 µm, the thickness of the fibre mat is between 30 and 300 µm and the packing density is between 0.3 and 0.5 (the detailed characteristics are summarised in Table 2 and Table 3). The different layers composing the whole media are sintered. This process enhances the mechanical resistance during pleating operations, and also has an impact on the filtration performances.
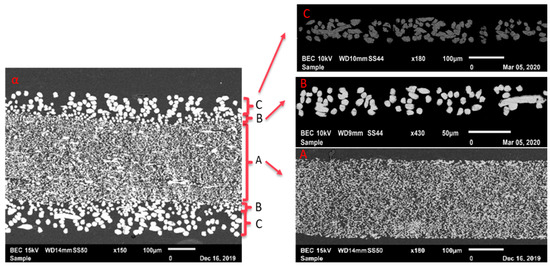
Figure 3.
Scanning electron microscopy (SEM) image of a cross-section through the thickness of a multilayer media and its component monolayer media (A, B and C).

Table 2.
Characteristics of different monolayer metallic media.

Table 3.
Characteristics of different multilayer metallic media.
The multilayer filters are divided into two main categories illustrated by Figure 4:
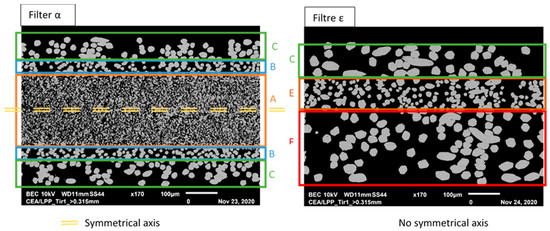
Figure 4.
Cross-section of a slice of a symmetrical and an asymmetrical filter (by scanning electron microscope) (A, B, C, E and F A, B correspond to the different monolayers of the multilayer media).
- -
- Symmetric filters: which are made of different layers added equally on each side of a main central layer;
- -
- Asymmetric filters: where the superposition of the various layers does not follow a central symmetric axis.
All the tested filters in this study have been characterised by their pressure drop and initial efficiency regarding the particle size distribution used in this study and for a filtration velocity of 6 cm/s. A bubble point standard test according to ISO 2942-2018 has also been performed. This measure consists of an impregnation of the medium with isopropanol and measurement of the air pressure necessary for bubbles to form through the medium. This value is correlated to the maximal equivalent pore size of the media according to Jurin’s relationship.
One must notice that layer Z, present in multilayer γ, has not been individually characterised since it was not available as a single layer. Media F and C are used as an external layer for multilayers media for mechanical resistance purpose. B- and E-layers are the intermediate layers between the core layer (the most efficient layer) and the external layers to ensure the cohesion of the whole multilayer media.
A linear correlation can be seen between the bubble point and the measured pressure drop at saturation for all the filters considered (Figure 5). This test could provide a simple way of estimating the maximum pressure drop achieved by a filter clogged with liquid aerosols.
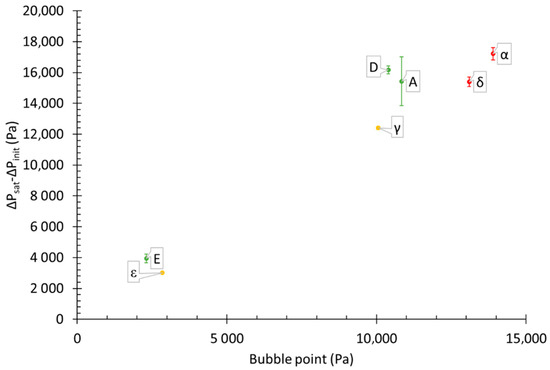
Figure 5.
Pressure drop as a function of the bubble point.
2.3. Testing Protocol
For each media, two kinds of tests have been performed:
- -
- During the first test, the filter is loaded up to the saturation (when pressure drop (∆PS) reaches a steady state). Directly after the loading, the filter is weighed in order to determine the liquid saturating mass (mS);
- -
- For the second test, the aerosol production is stopped after the filter reaches a steady state pressure drop. The measurement is then finished once a new steady state is reached (∆PR). After the experiment, the filter is weighed to measure the amount of liquid remaining after the test (mR).
For those two tests, the aerosol online measurement allows the computation of the instantaneous mass collected (each 60 s) as detailed below and in Appendix A. The comparison of the mass weighed in those two tests allows to distinguish the amount of liquid effectively trapped inside the fibre mats. Each experiment has been reproduced several times, and for both directions for non-symmetric filters.
3. Results and Discussion
3.1. Monolayer Filters
The different monolayer filters (A, D and E) have been loaded up to a constant pressure drop regime at different filtration velocities (0.8 to 16 cm/s). One must notice that filters B, F and C have not been individually loaded due to their very low efficiency (Table 2) leading to the impossibility to reach or to measure the steady state with our experimental setup.
Figure 6 presents an example of pressure drop evolution as a function of time. This evolution is expected for a wettable media as described by Contal et al. [2], Frising et al. [12] and Penner et al. [18].
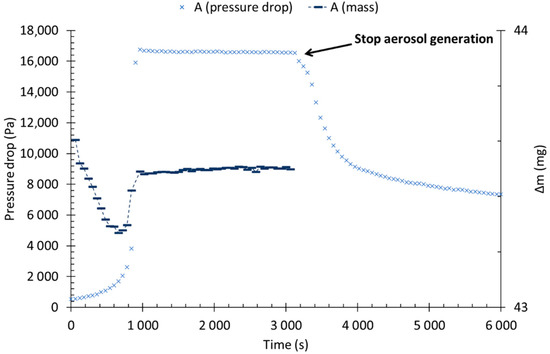
Figure 6.
Pressure drop and collected mass, before and after the liquid aerosol stop, as a function of time at a filtration velocity of 6 cm/s (Filter A).
The steady state phase is characterised by:
- A pressure drop which no longer increases when the filter is saturated (∆PSat);
- A constant mass accumulated in the filter, since during this phase, the amount of liquid collected is equivalent to the released mass of particles and the liquid drained downstream.
Figure 6 also shows the evolution of the collected mass (Δm) for each time step (the mass flow rate is approximately 44 mg/min). At the beginning of the clogging process, Δm decreases due to the decrease in filtration efficiency of the medium. As described in previous studies, this decrease in efficiency is due to an acceleration of the airflow velocity in the filter media leading to a less efficient collection for submicron particles (mainly collected by Brownian motion).
After this step, the redistribution of the liquid in the filter induces a quick increase of the overall efficiency. When the pressure drop reaches a constant value, air forces push the liquid out of the media, interstitial velocity is then stabilised and collected liquid, drained liquid, non-collected and resuspended droplet reach an equilibrium. This is the saturation.
After 3000 s, the liquid aerosol feeding is stopped while airflow is maintained. One could notice a reduction of the pressure drop from 16,000 to 6800 Pa (i.e., a loss of about 58% of the pressure drop at saturation). It seems that this reduction might be imputed to the reduction of the liquid film on the free surface of the filter downstream. Nevertheless, a certain fraction of the liquid remains inside the media and is not pushed out by the air forces.
The liquid mass collected in the filter without any breaking of the aerosol production has been weighed for different single layer media and for different filtration velocities. Figure 7 presents the mass accumulated at the saturation for three different fibrous structures and various filtration velocities. For each of the filters considered, the collected mass is not significantly affected by the filtration velocity. At saturation, the accumulated mass for filters A, D and E are, respectively, about 422 mg/m2, 369 mg/m2 and 78 mg/m2. This suggest that this mass is mainly driven by the fibrous structure itself and the interactions between fibres and liquid. At the same time, the airflow resistance (expressed by ΔP/Uf) decreases with the filtration velocity, as presented in Figure 8, up to a certain threshold where filtration velocity has little effect on the airflow resistance. The airflow resistance follows a law of Uf−1.
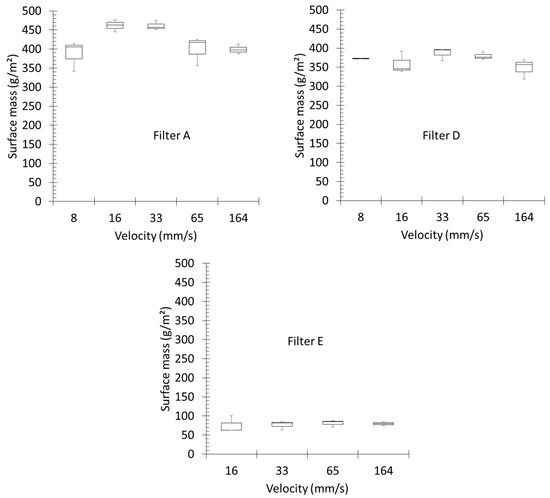
Figure 7.
Evolution of the liquid surface mass at saturation as a function of the face velocity.
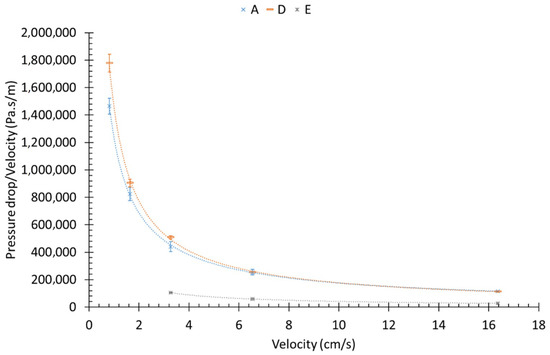
Figure 8.
Aeraulic resistance, at the saturation, as a function of filtration velocity.
Those results are in good agreement with the works of Contal et al. [2] and Charvet et al. [4]. They have shown that a higher filtration velocity leads to an optimised energetic efficiency of fibrous media when they collect liquid droplets. Moreover, since media A and D are structurally similar (Table 1), they are expected to measure a very close behaviour in terms of liquid mass and airflow resistance (Figure 7 and Figure 8).
Regarding the relation between the saturation mass and the airflow resistance as a function of the filtration velocity, it seems that the increase of the filtration velocity induces an organisation of the liquid toward the dead zones/inactive areas, in the thickness (toward the free surface downstream), decreasing the packing density of the most saturated layer and therefore the airflow resistance.
3.2. Multilayer Filters
The properties of the multilayer filters are summarised in Table 3. The clogging has been performed for a velocity of 6 cm/s, because up to this velocity, airflow resistance tends to a limit, and it is near to the nominal velocity. The aim of this part is to study the impact of the structure of the media and the presence of draining layers on their performances especially during the saturation phase. Two kinds of media have been considered: symmetrical and asymmetrical.
3.2.1. Symmetrical Filters
For multilayer filters with a symmetrical structure, the pressure drop evolution during the loading is comparable to monolayer ones, and occurs in three main steps as described previously. The main difference lies in the progressivity of the saturation phase which does not occur suddenly after the exponential increase as is for monolayer ones (Figure 9 and Figure 10). Kampa et al. [13] and Penner et al. [19] described this evolution as typical for a filter made of a succession of wettable and non-wettable filter media. However, in the present case, all filters are made from the same material. One could also notice that the pressure drop at the saturation is close to the pressure drop of the monolayer A (composing this filter) in the same operating conditions (for monolayer filters: A (∆Psat = 16,000 Pa) and D (∆Psat = 16,500 Pa) and for the multilayer ones: α (∆Psat = 18,400 Pa) and δ (∆Psat = 16,000 Pa)).
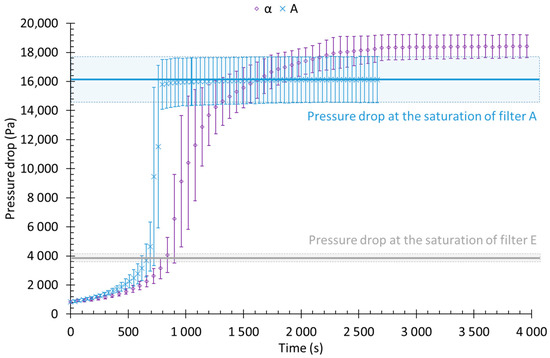
Figure 9.
Pressure drop evolution as a function a surface mass, for a multilayer filter and the associated layers at a filtration velocity of 6 cm/s.
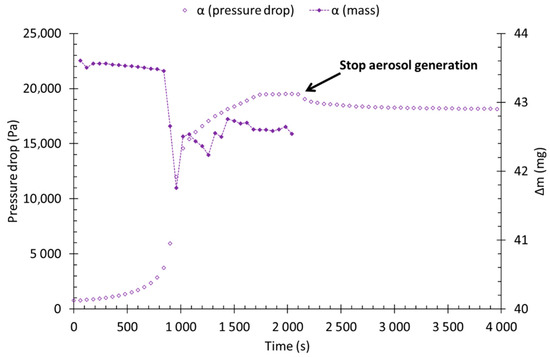
Figure 10.
Pressure drop and mass evolution, before and after the aerosol stop, as a function of time, for filter α (at 6 cm/s).
Figure 10 shows the evolution of the liquid mass collected by the filter each minute (computed from the SMPS data) and the pressure drop as a function of time at 6 cm/s. The instantaneous collected mass decreases slightly at the beginning of the loading as it has been noticed for monolayer filters. However, a significant difference must be noticed concerning the amplitude of the variation: multilayer filters show an important decrease of the efficiency (collected mass) and, even after stabilisation, the initial performances are far from being regenerated.
The shape of this evolution suggests that at the beginning of the filtration process, droplets are mainly collected by the most efficient layer, inducing an increase of the packing density. This leads to an increase of the interstitial velocity, and thereby a decrease of the diffusion contribution on the overall efficiency. This naturally reduces the collected mass for each time step since, in the present case, the droplet size distribution is mainly submicronic.
At the beginning of the exponential increase of the pressure drop, the coalescence of the collected droplets leads to the building of a liquid film. Consequently, the interstitial velocity continues to increase, and the pressure drop accelerates rapidly.
When the pressure drop reaches a certain threshold, the liquid collected on the most efficient layer is partially pushed out by the air forces toward the less efficient layers. The repartition of the liquid within the less efficient layers (which present a more important void volume) reduces the local packing density, and therefore, the acceleration of the pressure drop decreases as the efficiency increases slightly. The saturation point is postponed and is reached once the airflow forces and capillary forces are equilibrated.
When the aerosol feeding is stopped, the stabilised pressure drop is reduced from 19,500 to 18,000 Pa (i.e., a loss of about 8% of the pressure drop at saturation). This reduction might be caused by the elimination of the liquid film on the free surface downstream of the filter as it has been observed for monolayer filters. One could notice that this decrease is significantly lower as it has been measured for monolayer filters; this can be explained by a thinner liquid film. Indeed, most of the liquid accumulated within the filter is distributed between the layers downstream of the most efficient one.
To summarise, the pressure drop increase can be divided into two phases:
- -
- In the first step, the pressure drop evolution is similar to the case of monolayers, a linear phase followed by an exponential increase. This is the classical evolution measured for monolayer filters;
- -
- The second step is due to the redistribution of the liquid in the downstream layers (once the airflow forces and capillary forces reach an equilibrium), which delays the beginning of the saturation phase because the liquid must be distributed in the less efficient layers with a larger void volume (pressure drop increases slowly).
3.2.2. Non-Symmetrical Filters
For non-symmetrical filters, the shape of the pressure drop evolution is similar to the measurements conducted for symmetrical ones. The difference lies in the lower saturation pressure, and seems to not be driven by the most efficient layer anymore, as presented by Figure 11 for filter γ. Moreover, the direction of filtration significantly impacts the shape of the pressure drop evolution. γ filter has been loaded in two directions, direction 1 corresponds (from the upstream to the downstream side) to the superposition of F E Z D E F layers while direction 2 corresponds to layers F E D Z E F.
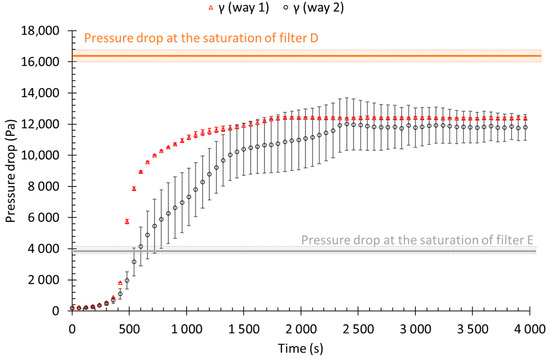
Figure 11.
Pressure drop evolution as a function of the surface mass, for a multilayer filter and the associated layers at a filtration velocity of 6 cm/s.
The filter γ exposed in the direction 2 (with the Z layer placed downstream the layer D) layer shows a lower pressure drop evolution as well as a lower pressure drop during the saturation as for direction 1 (with the Z layer placed upstream the layer D). Additionally, for both directions, the pressure drop at the saturation is lower than for single layer D.
The saturation pressure drop of asymmetric filters is lower than the pressure drop of the most efficient media, unlike symmetric filters. However, the direction of clogging does not influence the saturation pressure drop. The saturation pressure drop of the single-layer filter D is approximately 16,500 Pa, while the saturation pressure drop of the filter is approximately 11,900 Pa and 11,700 Pa in directions 1 and 2, respectively. The evolution of the pressure drop for filter γ in direction 1 is similar to the evolution of the pressure drop of symmetrical filters: with a first phase identical to single-layer filters, and a second phase where the pressure drop evolves less abruptly before reaching saturation. This evolution reflects a clogging of the successive media layers: with phase 1 corresponding to the clogging and saturation of the most efficient layer, and phase 2, where the liquid migrates from the most efficient layer to the downstream layers, freeing space in the most efficient layer. However, the evolution of the pressure drop for filter γ in direction 2 is different from direction 1 and symmetrical filters because there is an extra inflection before reaching saturation. This is because in direction 2 the Z layer is downstream of the most efficient layer (D layer). This Z layer has characteristics, such as fibre diameter and packing density, which lie between the most efficient layer D and the first least efficient layer E. Thus, once the most efficient layer is saturated, the liquid is distributed in this Z layer and saturates it, before reaching the least efficient layers.
Z layer then acts as a draining layer, loaded by the liquid drained from layer D. It links the layer D and layer E and allows a progressive adaptation of the draining channels between those layers. This phenomenon has been described by Penner et al. [9,19]. They have shown that the adaptation of smaller liquid channels to thicker ones impacts the shape of the pressure drop evolution. This can be seen on the multilayer media studied in the present case.
The masses collected are almost identical whatever the direction of the flow (Figure 12), which indicates a better efficiency and induces a lower pressure drop. This can be explained by a better distribution of the liquid within the filter. In addition, it can be seen that the instantaneous mass of liquid collected in the filters stabilises before the pressure drop. The γ filter (direction 1) has a liquid mass that stabilises at around 960 s, while the pressure drop stabilises at 1800 s. The γ filter (direction 2), on the other hand, has a mass and a pressure drop that stabilises, respectively, at 840 s and 2400 s. This suggests that the most efficient layer reaches saturation before the rest of the filter. Since this layer drives the collection efficiency, the instantaneous collected mass remains constant and the collected liquid is drained to the downstream layers, causing the progressive increase of the pressure drop until all layers are saturated.
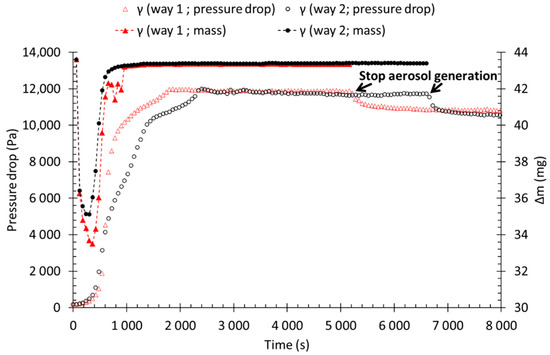
Figure 12.
Pressure drop and collected mass as a function of time, for filter γ (6 cm/s).
When the aerosol feeding is stopped, the pressure drop decreases in the same way as for symmetrical filters due to the loss of the liquid film downstream. For filter γ in the direction 1, stabilised pressure drop is reduced from 11,900 to 10,700 Pa (i.e., a loss of about 10% of the pressure drop at saturation). Additionally, for filter γ in the direction 2, stabilised pressure drop is reduced from 11,700 to 10,500 Pa (i.e., a loss of about 10% of the pressure drop at saturation).
To summarise, the evolution of the pressure drop for filter γ in direction 1 is similar to the evolution of the pressure drop of symmetrical filters: with a first phase similar to single-layer filters, and a second phase where the pressure drop evolves smoothly before reaching saturation. On the other hand, the addition of a layer with characteristics between the most efficient layer and the first least efficient layer, downstream of the filter, there is a new inflection corresponding to the saturation of this layer. Thus, the clogging occurring by layer succession is a hypothesis that has just been confirmed by this observation.
3.3. Liquid Accumulation in the Filter
Table 4 summarises the remaining mass in the medium after stabilisation of the pressure drop without aerosol feeding (mR), the saturating mass (mS) and the ratio mR/mS. For multilayer filters, this ratio is close to 1, whereas it is close to 0,5 for monolayers. The saturating mass also includes the liquid film formed on the downstream free side of the medium, the difference of the ratio measured for the two types of filters considered might be explained by the thicker liquid film formed on monolayer filters. Indeed, for multilayer filters, the less efficient layers present downstream enhance the draining of liquid and consequently reduce the thickness of this liquid film. When the aerosol feeding stops, the liquid remains trapped by capillarity within those layers. Hence, the difference between the saturating mass and the remaining mass is low. This explains the low pressure drop difference when the aerosol production is stopped.

Table 4.
Summary of main results.
Another aspect of those measurement is the energetic yield, expressed through the ratio (ΔPsat − ΔPinit)/mS, where ΔPsat and ΔPinit are, respectively, the pressure drops at the saturation and before the clogging. One could notice that for each gram of liquid collected, the amount of energy necessary is significantly higher for symmetrical than for the most efficient monolayer filters. Whereas this ratio decreases for non-symmetrical filters.
4. Conclusions
This study focuses on industrial metal filter media consisting of different layers (with different characteristics in terms of thickness, fibre diameter and packing density). Those filters are clogged by a liquid aerosol of DEHS, and they only concern an aerosol of DEHS. Bubble tests have been performed, showing a linear relationship with the pressure drop measured at media saturation. This test could provide a simple way to estimate the maximum pressure drop reached by a filter clogged by liquid aerosols.
The different layers composing the industrial media were tested independently for different filtration rates. It was shown that the evolution of the pressure drop corresponds to the one described in the literature: slight linear evolution of the pressure drop as a function of time, followed by an exponential increase until a threshold characteristic of the saturation of the fibrous structure. At this point, the equilibrium between the incident droplet mass and the amount of drained liquid is reached. Moreover, it has been observed that the filtration velocity does not significantly influence the mass of liquid accumulated at saturation, due to a different organisation of the liquid in the media. On the other hand, an increase of the filtration velocity decreases the flow resistance.
During the filtration process, when the aerosol supply is stopped, the pressure drop decreases and reaches a second equilibrium state (higher than the initial pressure drop), where the liquid film formed downstream of the filter is eliminated, but where a fraction of the liquid inside the filter is no longer drained out of the media.
Overall, multilayer filters, after an initial linear and exponential evolution of the pressure drop, follow different regimes corresponding to the successive loading of the draining layers downstream of the most effective layer of the media. The progressive loading of the draining layers can be distinguished on the evolution of the pressure drop. Thus, non-symmetrical filters show a different evolution of the pressure drop depending on the loading direction. The number of layers downstream of the most effective layer can be distinguished on the pressure drop evolutions through the different inflection points.
The reversibility of the airflow resistance was also measured by stopping the aerosol supply without stopping the airflow. From these experiments, the amount of liquid present on the free outer layer removed by the airflow can be deduced. These experiments showed that for single-layer filters, the liquid film is thicker than for multilayer filters, which leads to better regeneration of the airflow resistance of the filters, while multilayer filters have a lower regeneration capacity due to a thinner liquid film and a higher amount of liquid trapped in the drainage layers and therefore difficult to remove. From an operational standpoint, this work has highlighted that for liquid aerosol filtration, performance is improved by adding coarse layers downstream in the filter media. Therefore, the performance of non-symmetric filters (in the direction of filtration where thicker coarse layers are placed downstream) are, in this study, the most energy efficient for liquid aerosol collection.
Author Contributions
Conceptualization, M.L. and S.B.; Data curation, M.L. and M.B.; Formal analysis, M.L.; Funding acquisition, M.B.; Methodology, M.L., S.B. and D.T.; Supervision, S.B. and D.T.; Validation, S.B. and D.T.; Visualization, M.L.; Writing—original draft, M.L.; Writing—review & editing, M.L., S.B., D.T., J.-C.A.-C. and F.F. All authors have read and agreed to the published version of the manuscript.
Funding
This research received no external funding.
Informed Consent Statement
Informed consent was obtained from all subjects involved in the study.
Data Availability Statement
The data presented in this study are available on request from the corresponding author.
Conflicts of Interest
The authors declare no conflict of interest.
Appendix A. Determination of Droplet Mass Collected in the Filter
The aim is to determine the droplet mass collected by the filter media. The particle size distribution measured by a SMPS, is fitted by a log-normal relation (Figure A1). The relation used to fit the measurements is:
with dp, the droplet diameter, σg, the geometrical standard deviation, and CMD, the count mean diameter.
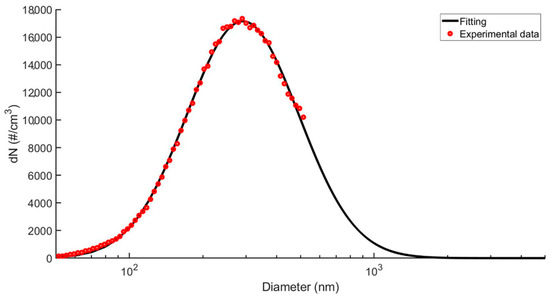
Figure A1.
Particle size distribution of the liquid aerosol.
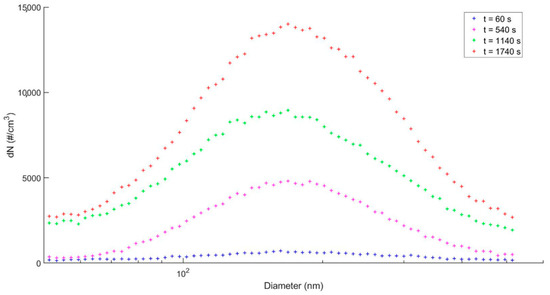
Figure A2.
Particle size distribution at downstream filter α, for a velocity filtration of 6 cm/s, as different clogging times.
Over time, the particle size distribution changes downstream, as shown in Figure A2. The distribution is actualised for each time step, since the downstream distribution continuously evolves during the loading. The diameter of average mass (DAM) is computed using the Hatch–Choate relation, expressed by:
From the computed diameter of average mass, the downstream and upstream mass of liquid is deduced by summing the whole distribution as expressed by:
with m, the liquid mass up or downstream (kg), DAM, the diameter of average mass (m), ρ, the density of the liquid (kg/m3), Qvol the volumic air flowrate (m3/s), fdilution, the dilution factor and t, the time step of each distribution recorded (s). The dilution factor is computed according to:
with Qsampling, the sampling flowrate, and Qdilution, the air dilution flowrate.
The aerosol mass measured downstream includes the non-collected and re-suspended particles. The difference between the mass measured up and downstream allows the computation of the liquid mass drained and accumulated in the filter. This is expressed by:
At the end of each test, the mass accumulated in the filter is measured by weighing; and is used to estimate the saturation mass of the filter while the mass of liquid collected also includes the drained part.
References
- Raynor, P.C.; Leith, D. The influence of accumulated liquid on fibrous filter performance. J. Aerosol. Sci. 2000, 31, 19–34. [Google Scholar] [CrossRef]
- Contal, P.; Simao, J.; Thomas, D.; Frising, T.; Callé, S.; Appert-Collin, J.-C.; Bémer, D. Clogging of fibre filters by submicron droplets. Phenomena and influence of operating conditions. J. Aerosol. Sci. 2004, 35, 263–278. [Google Scholar] [CrossRef]
- Mead-Hunter, R.; King, A.J.; Mullins, B.J. Aerosol-mist coalescing filters—A review. Sep. Purif. Technol. 2014, 133, 484–506. [Google Scholar] [CrossRef]
- Charvet, A.; Gonthier, Y.; Bernis, A.; Gonze, E. Filtration of liquid aerosols with a horizontal fibrous filter. Chem. Eng. Res. Des. 2008, 86, 569–576. [Google Scholar] [CrossRef]
- Wurster, S.; Meyer, J.; Kolb, H.; Kasper, G. Bubbling vs. blow-off—On the relevant mechanism(s) of drop entrainment from oil mist filter media. Sep. Purif. Technol. 2015, 152, 70–79. [Google Scholar] [CrossRef]
- Wurster, S.; Meyer, J.; Kasper, G. On the relationship of drop entrainment with bubble formation rates in oil mist filters. Sep. Purif. Technol. 2017, 179, 542–549. [Google Scholar] [CrossRef]
- Chang, C.; Ji, Z.; Zeng, F. The effect of a drainage layer on filtration performance of coalescing filters. Sep. Purif. Technol. 2016, 170, 370–376. [Google Scholar] [CrossRef]
- Patel, S.U.; Chase, G.G. Gravity orientation and woven drainage structures in coalescing filters. Sep. Purif. Technol. 2010, 75, 392–401. [Google Scholar] [CrossRef]
- Penner, T.; Meyer, J.; Dittler, A. Oleophilic and oleophobic media combinations—Influence on oil mist filter operating performance. Sep. Purif. Technol. 2021, 261, 118255. [Google Scholar] [CrossRef]
- Bredin, A.; Mullins, B.J. Influence of flow-interruption on filter performance during the filtration of liquid aerosols by fibrous filters. Sep. Purif. Technol. 2012, 90, 53–63. [Google Scholar] [CrossRef][Green Version]
- Charvet, A.; Gonthier, Y.; Gonze, E.; Bernis, A. Experimental and modelled efficiencies during the filtration of a liquid aerosol with a fibrous medium. Chem. Eng. Sci. 2010, 65, 1875–1886. [Google Scholar] [CrossRef]
- Frising, T.; Thomas, D.; Bémer, D.; Contal, P. Clogging of fibrous filters by liquid aerosol particles: Experimental and phenomenological modelling study. Chem. Eng. Sci. 2005, 60, 2751–2762. [Google Scholar] [CrossRef]
- Kampa, D.; Wurster, S.; Buzengeiger, J.; Meyer, J.; Kasper, G. Pressure drop and liquid transport through coalescence filter media used for oil mist filtration. Int. J. Multiph. Flow 2014, 58, 313–324. [Google Scholar] [CrossRef]
- Liew, T.; Conder, J. Fine mist filtration by wet filters—I. Liquid saturation and flow resistance of fibrous filters. J. Aerosol. Sci. 1985, 16, 497–509. [Google Scholar] [CrossRef]
- Manzo, G.M.; Wu, Y.; Chase, G.G.; Goux, A. Comparison of nonwoven glass and stainless steel microfiber media in aerosol coalescence filtration. Sep. Purif. Technol. 2016, 162, 14–19. [Google Scholar] [CrossRef]
- Mead-Hunter, R.; Braddock, R.D.; Kampa, D.; Merkel, N.; Kasper, G.; Mullins, B. The relationship between pressure drop and liquid saturation in oil-mist filters—Predicting filter saturation using a capillary based model. Sep. Purif. Technol. 2013, 104, 121–129. [Google Scholar] [CrossRef]
- Bourrous, S.; Bouilloux, L.; Ouf, F.-X.; Appert-Collin, J.-C.; Thomas, D.; Tampère, L.; Morele, Y. Measurement of the Nanoparticles Distribution in Flat and Pleated Filters During Clogging. Aerosol. Sci. Technol. 2014, 48, 392–400. [Google Scholar] [CrossRef]
- Penner, T.; Meyer, J.; Dittler, A. Relevance of downstream support structure design for oleophilic and oleophobic oil mist filter operating performance. Sep. Purif. Technol. 2020, 248, 117074. [Google Scholar] [CrossRef]
- Penner, T.; Meyer, J.; Dittler, A. Characterization of mesoscale inhomogeneity in nonwovens and its relevance in the filtration of fine mists. J. Aerosol. Sci. 2020, 151, 105674. [Google Scholar] [CrossRef]
Publisher’s Note: MDPI stays neutral with regard to jurisdictional claims in published maps and institutional affiliations. |
© 2022 by the authors. Licensee MDPI, Basel, Switzerland. This article is an open access article distributed under the terms and conditions of the Creative Commons Attribution (CC BY) license (https://creativecommons.org/licenses/by/4.0/).