


Nutrient Accumulation in Cover Crops under Contrasting Water Regimes in the Brazilian Cerrado

 , and
, and
Abstract
1. Introduction
2. Materials and Methods
2.1. Production of Dry Biomass and Structural Components (Lignin, Cellulose, Hemicellulose and Lignin/N)
Accumulation of Macro and Micronutrients in the Shoot
2.2. Grain Productivity
2.3. Statistical Analysis
3. Results
3.1. Production of Dry Biomass and Structural Components (Lignin, Cellulose, Hemicellulose and Lignin/N)
3.2. Accumulation of Macro and Micronutrients in the Shoot
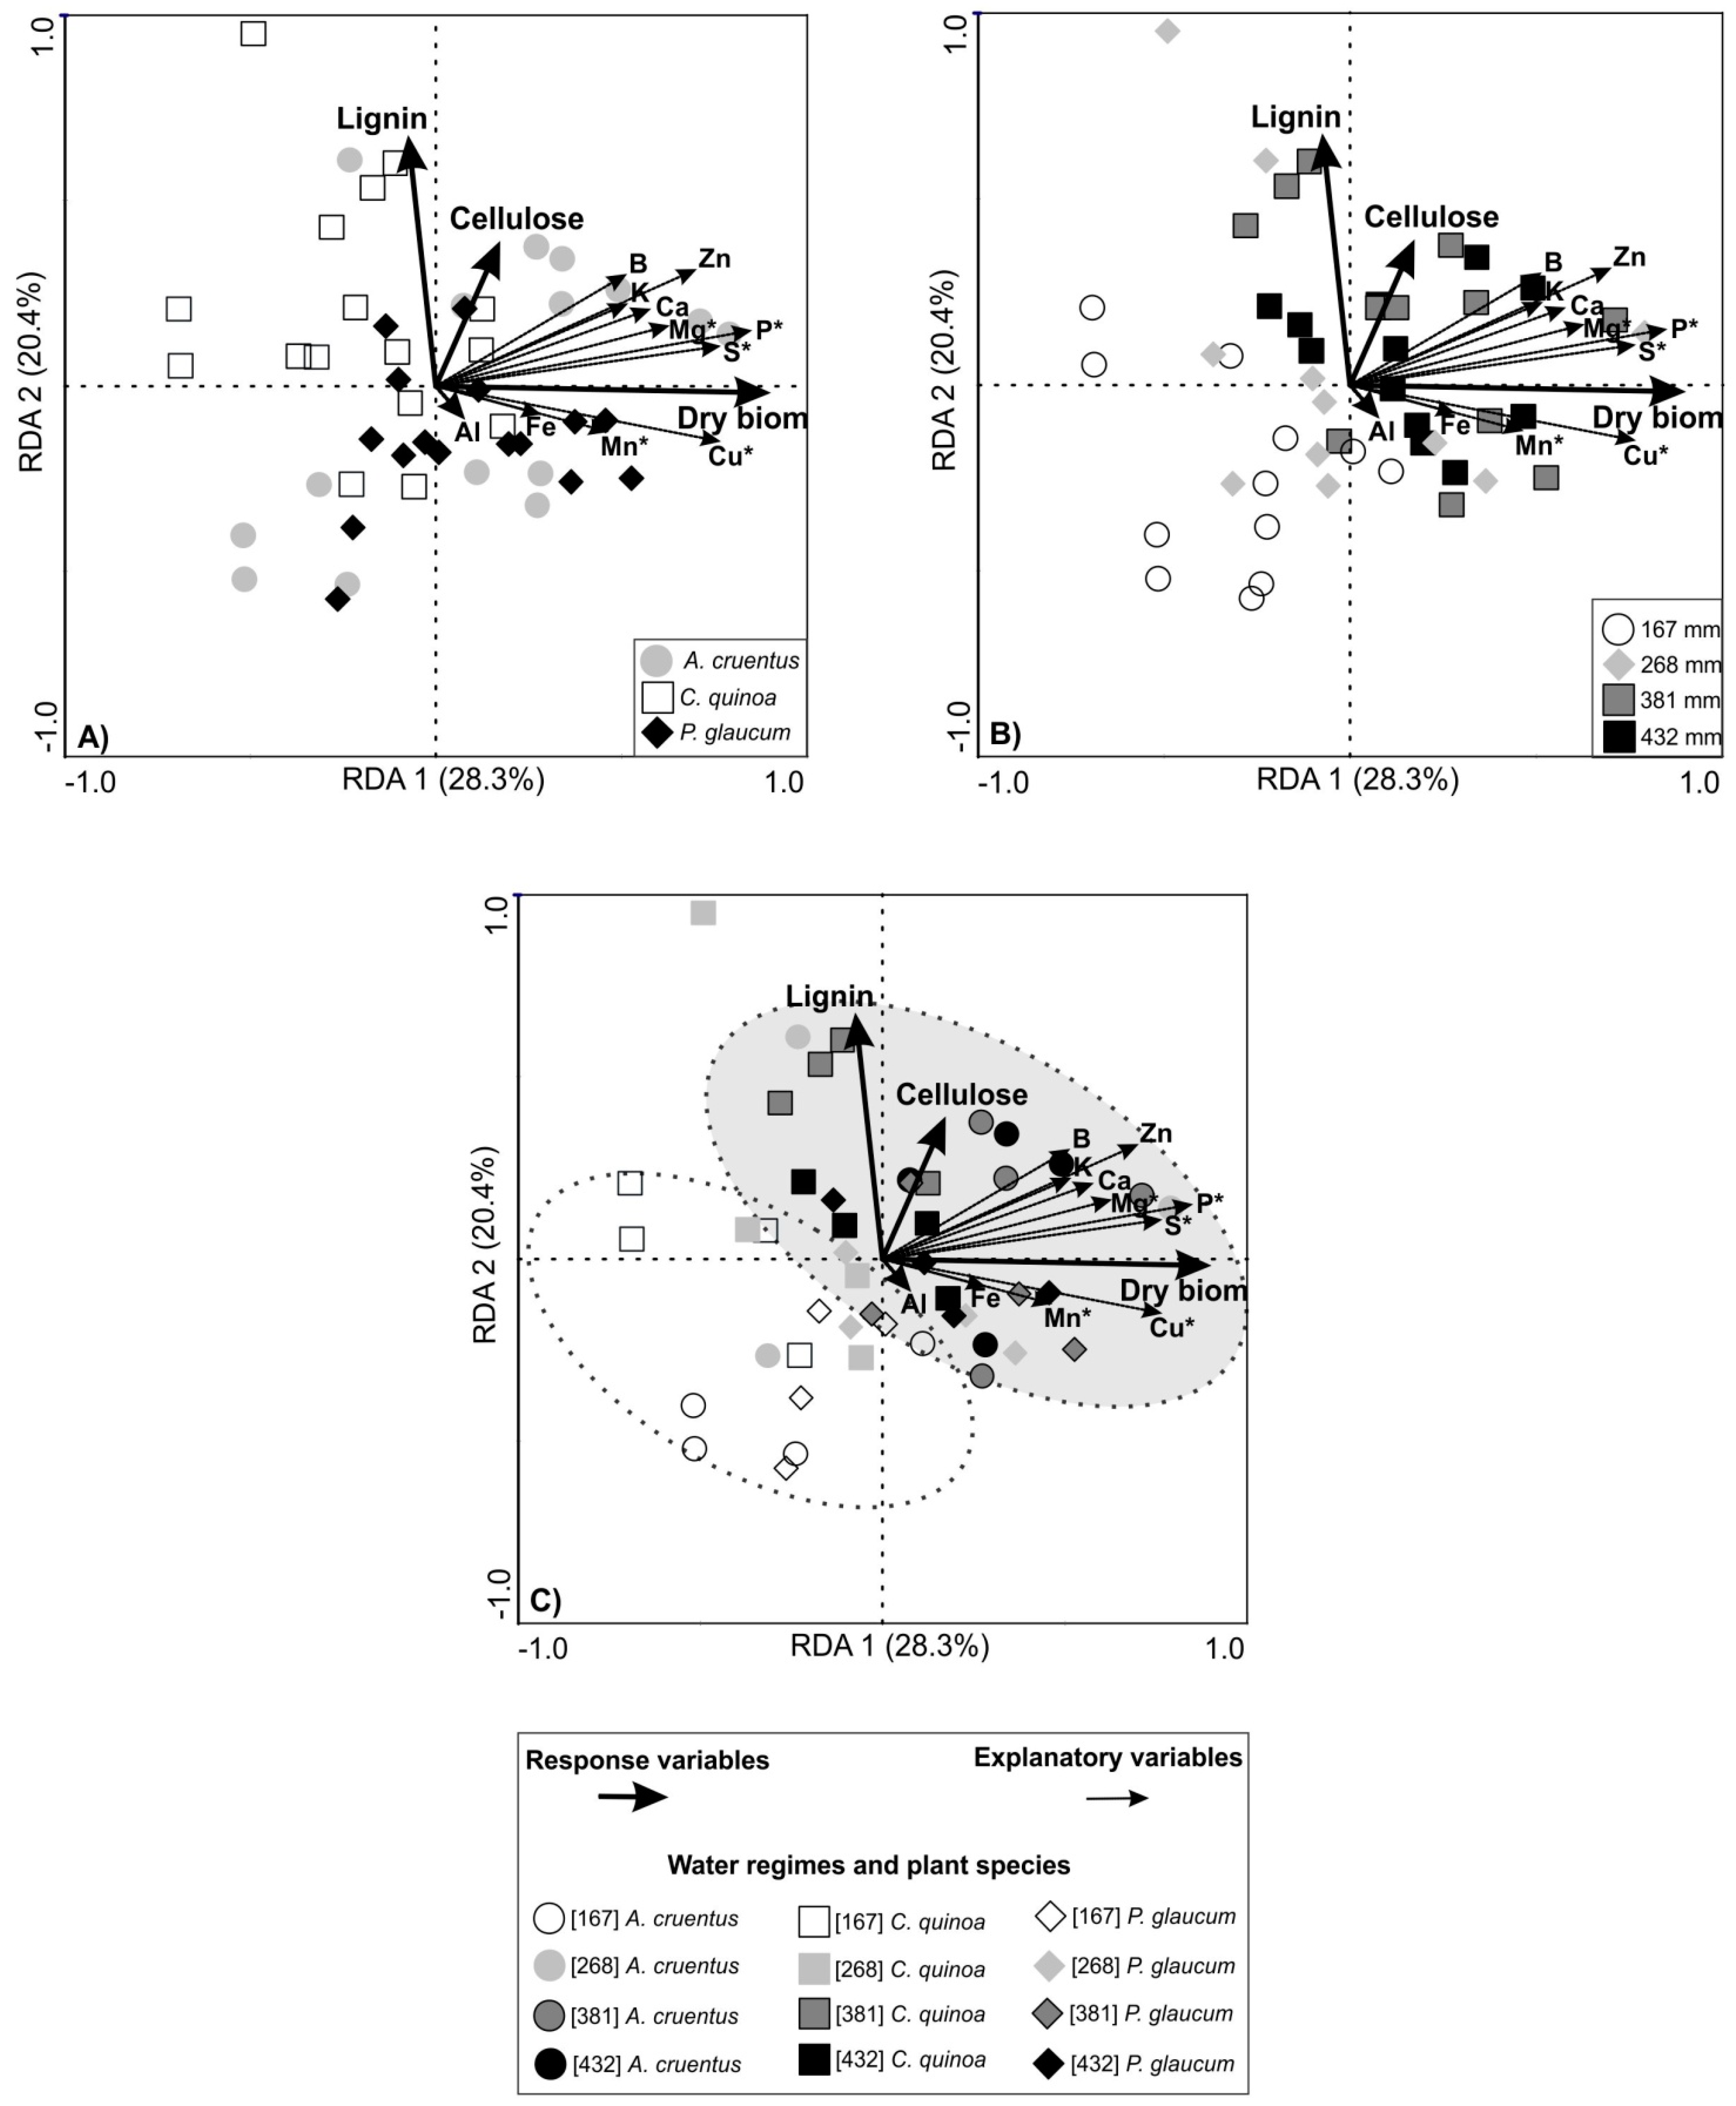
3.3. Grain Productivity and Redundancy Analysis (RDA)
4. Discussion
4.1. Dry Biomass Production and Structural Components (Lignin, Cellulose and Hemicelluloses)
4.2. Accumulation of Macro and Micronutrients in the Shoot
4.3. Grain Productivity and Redundancy Analysis (RDA)
5. Conclusions
Author Contributions
Funding
Institutional Review Board Statement
Informed Consent Statement
Acknowledgments
Conflicts of Interest
References
- Ratter, J.A.; Ribeiro, J.F.; Bridgewate, S. The Brazilian Cerrado vegetation and threats to its biodiversity. Ann. Bot. 1977, 80, 223–230. [Google Scholar] [CrossRef]
- Small, F.A.A.; Raizada, M.N. Mitigating dry season food insecurity in the subtropics by prospecting drought-tolerant, nitrogen-fixing weeds. Agric. Food Secur. 2017, 6, 23. [Google Scholar] [CrossRef]
- Pacheco, L.P.; de Sousa Monteiro, M.M.; da Silva, R.F.; dos Santos Soares, L.; Fonseca, W.L.; Petter, F.A.; de Alcântara Neto, F.; de Almeida, F.A.; Santos, G.G. Biomass and Nutrient Accumulation of Cover Crops in the Crop Off-season in Cerrado, in Goiás State, Brazil. J. Agric. Sci. 2012, 4, 209. [Google Scholar] [CrossRef]
- Baligar, V.C.; Fageria, N.K. Agronomy and physiology of tropical cover crops. J. Plant Nutrit. 2007, 30, 1287–1339. [Google Scholar] [CrossRef]
- Sharma, B.S.; Dodla, S.; Gaston, L.A.; Darapuneni, M.; Wang, J.J.; Sepat, S.; Bonara, H. Winter cover crops effect on soil moisture and soybean growth and yield under different tillage systems. Soil Till. Res. 2019, 195, 104430. [Google Scholar]
- Hunter, M.C.; Kemanian, A.R.; Mortensen, D.A. Cover crop effects on maize drought stress and yield. Agric. Ecosyst. Environ. 2021, 311, 107294. [Google Scholar] [CrossRef]
- Rengel, Z. The role of crop residues in improving soil fertility. In Nutrient Cycling in Terrestrial Ecosystems; Marschner, P., Rengel, Z., Eds.; Springer: Berlin/Heidelberg, Germany, 2017; pp. 183–214. [Google Scholar]
- Carvalho, A.M.D.; Souza, L.L.P.D.; Guimarães Júnior, R.; Alves, P.C.A.C.; Vivaldi, L.J. Cover plants with potential use for crop-livestock integrated systems in the Cerrado region. Pesq. Agropec. Bras. 2011, 46, 1200–1205. [Google Scholar] [CrossRef]
- Xavier, F.A.S.; Oliveira, J.I.A.; Silva, M.R. Decomposition and nutrient release dynamics of shoot phytomass of cover crops in the recôncavo baiano. Rev. Bras. Ciênc. Solo 2017, 41, e0160103. [Google Scholar] [CrossRef]
- Shahbaz, M.; Kuzyakov, Y.; Sanaullah, M.; Heitkamp, F.; Zelenev, V.; Kumar, A.; Blagodatskaya, E. Microbial decomposition of soil organic matter is mediated by quality and quantity of crop residues: Mechanisms and thresholds. Biol. Fert. Soils 2017, 53, 287–301. [Google Scholar] [CrossRef]
- Gao, H.; Chen, X.; Wei, J.; Zhang, Y.; Zhang, L.; Chang, J.; Thompson, M.L.; Mao, J. Decomposition dynamics and changes in chemical composition of wheat straw residue under anaerobic and aerobic conditions. PLoS ONE 2016, 11, e0158172. [Google Scholar] [CrossRef]
- Castellano, M.J.; Mueller, K.E.; Olk, D.C.; Sawyer, J.E.; Six, J. Integrating plant litter quality, soil organic matter stabilization, and the carbon saturation concept. Glob. Chang. Biol. 2015, 21, 3200–3209. [Google Scholar] [CrossRef] [PubMed]
- FAO. The World Sorghum and Millet Economies; Facts, Trends and Outlook; FAO: Québec City, QC, Canada, 2013.
- Jayme-Oliveira, A.; Ribeiro Junior, W.Q.; Ramos, M.L.G.; Ziviani, A.C.; Jakelaitis, A. Amaranth, quinoa, and millet growth and development under different water regimes in the Brazilian Cerrado. Pesq. Agropec. Bras. 2017, 52, 561–571. [Google Scholar] [CrossRef]
- Pacheco, L.P.; Monteiro, M.M.S.; Petter, F.A.; Nóbrega, J.C.A.; Santos, A.S. Biomass and nutrient cycling by cover crops in Brazilian Cerrado in the State of Piaui. Rev. Caatinga 2017, 30, 13–23. [Google Scholar] [CrossRef]
- Oliveira, L.B.; Barros, R.L.N.; Magalhaes, W.B.; Medici, L.O.; Pimentel, C. Cowpea growth and yield in sole crop and intercropped with millet. Rev. Caatinga 2017, 30, 53–58. [Google Scholar] [CrossRef]
- Olofintoye, J.A.T.; Abayomi, Y.A.; Olugbemi, O. Yeld responses of grain Amaranth (Amaranthus Cruentus L.) varieties to varying planting density and soil amendment. Academic J. 2015, 10, 2218–2225. [Google Scholar]
- Liu, F.; Stutze, H. Biomass partitioning, specific leaf area, and water use efficiency of vegetable amaranth (Amaranthus spp.) in response to drought stress. Sci. Hortic. 2003, 102, 15–27. [Google Scholar] [CrossRef]
- Reguera, M.; Conesa, C.; Gil-Gomez, A.; Haros, C.M.; Perez-Casas, M.A.; Briones-Labarca, V.; Bolanos, L.; Bonilla, L.; Alvarez, R.; Pinto, K.; et al. The impact of different agroecological conditions on the nutritional composition of C. quinoa seeds. Peer J. 2018, 6, e4442. [Google Scholar] [CrossRef] [PubMed]
- Adolf, V.I.; Jacobsen, S.E.; Shabala, S. Salt tolerance mechanisms in C. quinoa (Chenopodium C. quinoa Willd.). Environm. Exp. Bot. 2013, 92, 43–54. [Google Scholar] [CrossRef]
- Ruiz, K.B.; Biondi, S.; Oses, R.; Acuña-Rodriguez, I.S.; Antognoni, F.; Martinez-Mosqueira, E.A.; Coulibaly., A.; Canahua-Murillo., A.; Pinto, M.; Zurita-Silva, A.; et al. Quinoa biodiversity and sustainability for food security under climate change: A review. Agron. Sustain. Dev. 2014, 34, 349–359. [Google Scholar] [CrossRef]
- Spehar, C.R.; Rocha, J.E.S.; Ribeiro Junior, W.Q.; Santos, R.L.B.; Ascheri, J.L.R.; Souza, F.F.J. Avances y desafíos de la producción y utilización de la quinua en Brasil. In Estado del Arte de la Quinua en el Mundo en 2013; Bazile, D., Ed.; FAO: Santiago, Chile, 2014; pp. 681–706. [Google Scholar]
- Pospsil, A.; Pospisil, M.; Varga, B.; Svecnjak, Z. Grain Yield and protein concentration of two amaranth species as influenced by the nitrogen fertilization. Eur. J. Agron 2006, 25, 250–253. [Google Scholar] [CrossRef]
- Ferreira, C.C.; Ribeiro Junior, W.Q.; Ramos, M.L.G.; Spehar, C.R.; Farias, T.R.R. Efeito da densidade de semeadura e doses de nitrogênio sobre a produtividade e biometria de amaranto, no Cerrado do Planalto Central. Biosc. J. 2014, 30, 534–546. [Google Scholar]
- da Silva, P.C.; Ribeiro Junior, W.Q.; Ramos, M.L.G.; Celestino, S.M.C.; Silva, A.D.N.; Casari, R.A.D.C.N.; Santana, C.C.; de Lima, C.A.; Williams, T.C.R.; Vinson, C.C. Quinoa for the brazilian cerrado: Agronomic characteristics of elite genotypes under different water regimes. Plants 2021, 10, 1591. [Google Scholar] [CrossRef] [PubMed]
- Tang, Y.; Tsao, R. Phytochemicals in quinoa and amaranth grains and their antioxidant, anti-inflammatory, and potential health beneficial effects: A review. Mol. Nutr. Food Res. 2017, 61, 1600767. [Google Scholar] [CrossRef] [PubMed]
- Alvares, C.A.; Stape, J.L.; Sentelhas, P.C.; Gonçalves, J.L.M. Modeling monthly mean air temperature for Brazil. Theor. Appl. Climatol. 2013, 113, 407–427. [Google Scholar] [CrossRef]
- Soil Survey Staff. Soil Survey Field and Laboratory Methods Manual; Soil Survey Investigations Report No. 51, Version 2.0; Burt, R., Soil Survey Staff, Eds.; U.S. Department of Agriculture, Natural Resources Conservation Service: Washington, DC, USA, 2014.
- Hanks, R.J.; Keller, J.; Rasmusse, V.P.; Wilson, G.D. Line source sprinkler for continuous variable irrigation crop production studies. Soil Sci. Soc. Am. J. 1976, 40, 426–429. [Google Scholar] [CrossRef]
- EMBRAPA–Empresa Brasileira de Pesquisa Agropecuária. Monitoramento de Irrigação no Cerrado. 2015. Available online: http://hidro.cpac.embrapa.br (accessed on 15 May 2015).
- Roberston, J.B.; Van Soest, P.J. The detergent system of analysis and its application to human foods. In The Analysis of Dietary Fiber in Food; James, W.P.T., Theander, O., Eds.; Marcel Dekker: New York, NY, USA, 1981; pp. 123–158. [Google Scholar]
- Komarek, A.R. An improved filtering technique for the analysis of neutral detergent fiber andacid detergent fiber utilizing the filter bag technique. J. An. Sci. 1993, 71, 824–829. [Google Scholar]
- SAS/STAT Guide for Personal Computers; Version 8.2; SAS Institute: Cary, NC, USA, 2001.
- Ter Braak, C.J.F. CANOCO Reference Manual and CanoDraw for Windows User’s Guide: Software for Canonical Community Ordination; Version 4.5; Microcomputer Power: Ithaca, NY, USA, 2002; p. 500. [Google Scholar]
- Ramette, A. Multivariate analyses in microbial ecology. FEMS Microbiol. Ecol. 2007, 62, 142–160. [Google Scholar] [CrossRef]
- Soares, D.S.; Ramos, M.L.G.; Marchão, R.L.; Maciel, G.A.; Oliveira, A.D.; Malaquias, J.V.; Carvalho, A.M. How diversity of crop residues in long-term no-tillage systems affect chemical and microbiological soil properties. Soil Till. Res. 2019, 194, 104316. [Google Scholar] [CrossRef]
- Creamer, N.G.; Baldwin, K.R. Na evaluation of summer cover crops for use in vegetable production systems in North Carolina. Hortsci. 2000, 35, 600–603. [Google Scholar] [CrossRef]
- Torres, I.F.; Bastida, F.; Hernandez, T.; Bombach, P.; Richnow, H.H.; Garcia, C. The role of lignin and cellulose in the carbon-cycling of degraded soils under semiarid climate and their relation to microbial biomass. Soil Biol. Biochem. 2014, 75, 152–160. [Google Scholar] [CrossRef]
- Chen, X.; Hu, Y.; Feng, S.; Rui, Y.; Zhang, Z.; He, H.; He, X.; Ge, T.; Wu, J.; Su, Y. Lignin and cellulose dynamics with straw incorporation in two contrasting cropping soils. Sci. Rep. 2018, 8, 1633. [Google Scholar] [CrossRef] [PubMed]
- Fageria, N.K. The Use of Nutrients in Crop Plants; Earth Sciences, Environment & Agriculture; CRC: Boca Raton, FL, USA, 2009. [Google Scholar]
- Grant, C.A. Soil fertility and management. In International Encyclopedia of Geography: People, the Earth, Environment and Technology; John Wiley & Sons, Ltd.: Hoboken, NJ, USA, 2016. [Google Scholar]
- Cramer, M.D.; Hawkins, H.J.; Verboom, G.A. The importance of nutritional regulation of plant water flux. Oecologia 2009, 161, 15–24. [Google Scholar] [CrossRef] [PubMed]
- Ahmad, M.; Sik, Y.; Kim, B.Y.; Ahn, J.H.; Lee, Y.H.; Zhang, M.; Moon, D.H.; Wabel, M.I.; Lee, S.S. Impact of soybean stover- and pine needle-derived biochars on Pb and As mobility, microbial community, and carbon stability in a contaminated agricultural soil. J. Environ. Manag. 2016, 166, 131–139. [Google Scholar] [CrossRef] [PubMed]
- Waraich, E.A.; Ahmad, R.; Ashraf, M.Y.; Armad, M. Improving agricultural water use efficiency by nutrient management in crop plants. Soil Plant Sci. 2011, 61, 291–304. [Google Scholar] [CrossRef]
- Kang, S.M.; Radhakrishnan, R.; You, Y.H.; Joo, J.G.; Lee, I.J.; Lee, K.E.; Kim, J.H. Phosphate Solubilizing Bacillus megaterium mj1212 Regulates Endogenous Plant Carbohydrates and Amino Acids Contents to Promote Mustard Plant Growth. Indian J. Microbiol. 2014, 54, 427–433. [Google Scholar] [CrossRef] [PubMed]
- Zhao, W.; Liu, L.; Shen, Q.; Uang, J.; Han, X.; Tian, F.; Wu, J. Effects of water stress on photosynthesis, yield, and water use efficiency in winter wheat. Water 2020, 12, 2127. [Google Scholar] [CrossRef]
- Wang, M.; Zheng, Q.; Guo, S. The critical role of Potassium in plant stress response. Int. J. Mol. Sci. 2013, 14, 7370–7390. [Google Scholar] [CrossRef]
- Thivierge, M.N. Root traits and carbon input in field-grown sweet pearl millet, sweet sorghum, and grain corn. Agronomy J. 2016, 108, 459–471. [Google Scholar] [CrossRef]
- Ensinas, S.C.; Serra, A.P.; Marchetti, M.E.; Silva, E.F.; Prado, E.A.F.; Lourente, E.R.P.; Altomar, P.H.; Potrich, D.C.; Martinez, M.A.; Conrad, V.A.; et al. Cover crops effect on soil organic matter fractions under no till system. Aust. J. Crop Sci. 2016, 10, 503–512. [Google Scholar] [CrossRef]
- Qu, L.; Huang, Y.; Ma, K.; Zhang, Y.; Biere, A. Effects of plant cover on properties of rhizosphere and inter-plant soil in a semiarid valley, SW China. Soil Biol. Biochem. 2016, 94, 1–9. [Google Scholar] [CrossRef]
- Da Silva, J.G.; Bianchini, A.; Costa, P.M.C.; de Almeida Lobo, F.; De Almeida, J.P.M.; De Moraes, M.F. Amaranth response to water stress. J. Exp. Agric. Intern. 2019, 40, 1–9. [Google Scholar] [CrossRef]
- Sun, Y.; Wang, C.; Chen, H.Y.; Ruan, H. Response of plants to water stress: A meta-analysis. Front. Plant Sci. 2020, 11, 978. [Google Scholar] [CrossRef] [PubMed]


| Crop Season | Period | |
|---|---|---|
| Winter | Summer | |
| 2005/2006 | Fallow | Soybean |
| 2006/2007 | Fallow | Soybean |
| 2007/2008 | Fallow | Soybean |
| 2008/2009 | Fallow | Soybean |
| 2009/2010 | Fallow | Soybean |
| 2010/2011 | Fallow | Soybean |
| 2011/2012 | Soybean under different water regimes | Fallow |
| 2012/2013 | Wheat under different water regimes | Soybean |
| 2013/2014 | A. cruenthus, P. glaucum e C. C. quinoa under different water regimes | Crotalaria juncea |
| 2014/2015 | A. cruenthus, P. glaucum e C. C. quinoa under different water regimes | Zea mays |
| Treatment | Dry Biomass (Mg ha−1) | Cellulose (%) | Hemicellulose (%) | Lignin (%) | Lignin/N |
|---|---|---|---|---|---|
| Cover crop | |||||
| C. quinoa | 7.31 b | 26.75 b | 13.22 b | 4.28 a | 0.22 a |
| P. glaucum | 9.75 a | 30.41 a | 24.39 a | 3.64 b | 0.22 a |
| A. cruenthus | 10.16 a | 27.36 b | 13.56 b | 4.35 a | 0.24 a |
| Water regime (mm) | |||||
| 167 | 6.84 b | 26.20 b | 18.19 a | 3.68 a | 0.20 a |
| 268 | 9.47 a | 28.43 a | 17.03 ab | 4.40 a | 0.26 a |
| 381 | 9.94 a | 29.43 a | 17.28 ab | 4.44 a | 0.24 a |
| 432 | 10.04 a | 28.63 a | 15.74 b | 3.85 a | 0.21 a |
| Water Regime (mm) | Cover Crop | ||
|---|---|---|---|
| A. cruenthus | P. glaucum | C. quinoa | |
| P (kg ha−1) | |||
| 167 | 14.40 Ac | 10.32 Bc | 7.11 Cc |
| 268 | 31.04 Ab | 20.60 Ab | 15.36 Bb |
| 381 | 38.81 Aa | 30.88 Ba | 21.46 Cab |
| 432 | 37.42 Aab | 26.39 Bab | 24.29 Ba |
| Ca (kg ha−1) | |||
| 167 | 79.24 Ac | 23.94 Ba | 28.47 Bb |
| 268 | 141.09 Ab | 36.05 Ba | 51.18 Bab |
| 381 | 141.03 Ab | 40.65 Ba | 60.81 Ba |
| 432 | 162.36 Aa | 33.48 Ca | 75.99 Ba |
| B (kg ha−1) | |||
| 167 | 0.042 Ac | 0.016 Ba | 0.028 Ab |
| 268 | 0.088 Ab | 0.020 Ca | 0.042 Bb |
| 381 | 0.110 Aa | 0.026 Ca | 0.065 Ba |
| 432 | 0.124 Aa | 0.021 Ca | 0.069 Ba |
| Zn (kg ha−1) | |||
| 167 | 0.064 Ac | 0.067 Ab | 0.070 Ab |
| 268 | 0.150 Ab | 0.102 Aab | 0.128 Aa |
| 381 | 0.179 Ab | 0.125 Aa | 0.157 Aa |
| 432 | 0.240 Aa | 0.121 Ca | 0.162 Ba |
| Treatment | N | K | Mg | S | Fe | Cu | Mn |
|---|---|---|---|---|---|---|---|
| Cover crop | |||||||
| kg ha−1 | |||||||
| A. cruenthus | 182.68 a | 416.92 a | 30.88 a | 43.53 a | 2.22 a | 0.03 ab | 0.17 a |
| P. glaucum | 165.51 a | 200.37 c | 12.87 c | 21.02 b | 1.46 b | 0.04 a | 0.10 b |
| C. quinoa | 144.88 a | 367.89 b | 18.63 b | 23.22 b | 1.65 b | 0.02 b | 0.13 ab |
| Water regime (mm) | |||||||
| 167 | 141.91 b | 222.84 b | 13.69 b | 18.03 c | 1.82 a | 0.02 c | 0.11 b |
| 268 | 168.19 a | 345.30 a | 21.49 a | 27.69 b | 1.85 a | 0.03 b | 0.14 ab |
| 381 | 166.52 a | 380.11 a | 23.42 a | 34.28 a | 1.67 a | 0.03 b | 0.13 ab |
| 432 | 180.80 a | 365.32 a | 24.56 a | 37.02 a | 1.78 a | 0.04 a | 0.16 a |
| Water Regime (mm) | Cover Crop | |
|---|---|---|
| C. quinoa | A. cruenthus | |
| kg ha−1 | ||
| 167 | 691.58 Ac | 1018.43 Ac |
| 268 | 1904.31 Bb | 2875.02 Ab |
| 381 | 2882.90 Ba | 3866.89 Aa |
| 432 | 3488.86 Aa | 3549.45 Aa |
| Chemical Attribute | Lambda (λ) | Contribution (%) | F-Test | p-Value | |
|---|---|---|---|---|---|
| P | 0.22 | 37 | 12.63 | 0.0020 | *** |
| Cu | 0.08 | 13 | 4.41 | 0.0080 | *** |
| Mn | 0.07 | 12 | 5.68 | 0.0040 | *** |
| S | 0.04 | 7 | 3.49 | 0.0320 | ** |
| Mg | 0.04 | 7 | 3.67 | 0.0320 | ** |
| Al | 0.04 | 7 | 2.81 | 0.0760 | ns |
| Zn | 0.02 | 5 | 1.57 | 0.2060 | ns |
| K | 0.02 | 3 | 1.56 | 0.2120 | ns |
| Fe | 0.02 | 3 | 1.60 | 0.2160 | ns |
| Ca | 0.02 | 3 | 1.43 | 0.2360 | ns |
| B | 0.01 | 3 | 1.26 | 0.3040 | ns |
Publisher’s Note: MDPI stays neutral with regard to jurisdictional claims in published maps and institutional affiliations. |
© 2022 by the authors. Licensee MDPI, Basel, Switzerland. This article is an open access article distributed under the terms and conditions of the Creative Commons Attribution (CC BY) license (https://creativecommons.org/licenses/by/4.0/).
Share and Cite
Silva, A.d.N.; Ribeiro Junior, W.Q.; Ramos, M.L.G.; de Lima, C.A.; Jayme-Oliveira, A.; Silva, A.M.M.; de Carvalho, A.M. Nutrient Accumulation in Cover Crops under Contrasting Water Regimes in the Brazilian Cerrado. Atmosphere 2022, 13, 1617. https://doi.org/10.3390/atmos13101617
Silva AdN, Ribeiro Junior WQ, Ramos MLG, de Lima CA, Jayme-Oliveira A, Silva AMM, de Carvalho AM. Nutrient Accumulation in Cover Crops under Contrasting Water Regimes in the Brazilian Cerrado. Atmosphere. 2022; 13(10):1617. https://doi.org/10.3390/atmos13101617
Chicago/Turabian StyleSilva, Alberto do Nascimento, Walter Quadros Ribeiro Junior, Maria Lucrecia Gerosa Ramos, Cristiane Andrea de Lima, Adilson Jayme-Oliveira, Antonio Marcos Miranda Silva, and Arminda Moreira de Carvalho. 2022. "Nutrient Accumulation in Cover Crops under Contrasting Water Regimes in the Brazilian Cerrado" Atmosphere 13, no. 10: 1617. https://doi.org/10.3390/atmos13101617
APA StyleSilva, A. d. N., Ribeiro Junior, W. Q., Ramos, M. L. G., de Lima, C. A., Jayme-Oliveira, A., Silva, A. M. M., & de Carvalho, A. M. (2022). Nutrient Accumulation in Cover Crops under Contrasting Water Regimes in the Brazilian Cerrado. Atmosphere, 13(10), 1617. https://doi.org/10.3390/atmos13101617