Article

Relationships between Mass Level of Allergenic Platanus acerifolia Protein 3 (Pla a3) and Redox Trace Elements in the Size-Resolved Particles in Shanghai Atmosphere

1
School of Environmental and Chemical Engineering, Shanghai University, Shanghai 200444, China
2
School of Life Sciences, Shanghai University, Shanghai 200444, China
3
Centers for Environmental Science in Saitama, Saitama 374-0115, Japan
4
Institute of Desert Meteorology, China Meteorological Administration, Urumqi 830002, China
5
School of Science and Engineering, Saitama University, Saitama 338-8570, Japan
*
Author to whom correspondence should be addressed.
These authors contributed equally to this work.
Atmosphere 2022, 13(10), 1541; https://doi.org/10.3390/atmos13101541
Submission received: 8 September 2022 / Revised: 13 September 2022 / Accepted: 14 September 2022 / Published: 21 September 2022
(This article belongs to the Section Air Quality)

Abstract

:
Allergenic pollen protein can be released from pollen grains and suspended in the air to cause allergenic reactions. However, the allergenic protein and its relationship with redox trace elements in ambient size-resolved particles has not been reported. Ambient size-resolved particles in Shanghai’s atmosphere were sampled during the Platanus pollen season in the spring season of 2017. Planatus pollen protein 3 (Pla a3) and redox trace elements in the ambient particles were investigated and their relationship was analyzed. Our data demonstrated that the mass level of the Pla a3 in the size-resolved particles ranged from 0.41 ± 0.28 to 7.46 ± 2.23 pg/m3, and decreased with the size range. Mass concentrations (ppb) of crustal elements (Fe, Al, Ca, Mg, Na) in the size-resolved particles ranged from 20.11 ± 9.87 to 1126.22 ± 659.51, while trace elements (V, Cr, Mn, Co, Ni, Cu, Zn, Ga, As, Se, Rb, Sr, Cd, Cs, Ba, Pb) varied from 0.05 ± 0.03 to 57.53 ± 19.7. Mass levels of these trace elements decreased according to particle size. The Abundance of redox trace elements, including Fe (R2 = 0.82), Mn (R2 = 0.54), Cu (R2 = 0.61), Ba (R2 = 0.82), and Pb (R2 = 0.82) in the size-resolved particles was significantly related to that of Pla a3, and our data implied redox trace elements might take syngenetic effects on the allergenicity induced by Pla a3 protein.

1. Introduction

Ambient particulate matters (PMs) have been regarded as carcinogenic matters by the International Agency for Research on Cancer [1]. According to the aerodynamic diameters, the PMs can be divided into coarse (D ≤ 10 mm), fine (D ≤ 2.5 mm), and ultrafine particles (D ≤ 1 mm). Many works claimed that ambient particles had the capability to absorb significant quantities of trace chemicals such as Mn, Fe, Pb, Cu, Cd, Cr, Ni, etc., and polycyclic aromatic hydrocarbons (PHAs). Therefore, toxicity of these chemicals was widely reported [2,3]. Recently, biological PM components related to human health were reported [4,5]. Major components of biological particles in atmosphere include: bacteria, fungal spores and fragments, pollen, viruses, algae and cyanobacteria, biological soil crust, lichens, and others (e.g., plant or animal debris) [4,6]. Pollen has been identified as a predictor of the inverse seasonality of flulike epidemics and was involved in changes in lung functions [7]. Pollen grains emitted by urban vegetation are the main primary biological airborne particles (PBAPs) that alter the biological quality of urban air and have a significant impact on human health. When the pollen grains are hydrated and ruptured [8], subpollen particles (SPPs), a small vesicle wrapped by lipid membrane with a diameter of 0.1–1.0 μm inside the pollen grains, could be released [9,10]. The SPPs could be transported through the respiratory tract to the lung tissue [11,12]. The airborne SPPs contained allergen protein and nucleic acid [12], which could be absorbed on ambient particles and cause health problems such as asthma or pollinosis.
As one of the most common roadside trees in cities, Platanus acerifolia can spread a large number of pollen grains into the air in spring [13,14,15]. Pollen emission during the flowering period was recognized as the main causative agents of allergic rhinitis in 30% of the world population [16]. Additionally, exposure to Platanus pollen allergens has been shown to elicit allergic responses in numerous cities in eastern China [5,13,14,17], which are responsible for allergenic reactions. Metal elements in the atmosphere are important constituents of ambient particles and play a critical role in the observed health risks [18,19]. Most trace metal elements (such as Pb, Cu, Cd, Cr, Ni etc.) have oxidative abilities (referred as redox trace elements) [20,21] and have potential carcinogenic effects; those elements could be enriched in fine particles and enter into the human body and be deposited in various ways, which can result in functional dysfunction and irreversible damage to the human body [5,18]. Until now, only a limited number of studies considered the health effects of irritants, allergenic protein, and redox elements jointly for the general population. Therefore, the purpose of this study was to investigate relationships between allergenic pollen protein and main redox trace metals in ambient particles. We hoped to provide essential information to explain the mechanism of pollinosis and inhalable diseases, and also to enable health authorities to make efficient measurements to improve air quality.

2. Materials and Methods

2.1. Sample Collection

Fresh pollen grains were collected from the mature inflorescence of Planatus trees planted along Shangda road, Shanghai (Figure 1). The pollen grains were scattered onto the tray for 3 days at room temperature until they were naturally dry, then the grains were sieved with 40 μm mesh and stored at 4 °C until use. Size-resolved PMs were collected using an Andersen high-volume air sampler (HV-1000R, Shibata Co., Tokyo, Japan) equipped with five stages of an Andersen impactor (Shibata Co., Japan), which can sample particles with different sizes, i.e., >7, 3.3–7.0, 2.0–3.3, 1.1–2.0, and <1.1 µm. Air flow of the sampler was 566 L/h. The quartz filter membrane (8–10 inch2, Pallflex, 2500QATUP, Pall Corporation, Port Washington, NY, USA) was weighed before and after each collection and stored at 4 °C. The sampling site and sampling information are described in our previous study [15].

2.2. Total Protein Detection in the Ambient Particles

Total protein from the sampled filter was extracted through the method described by other researchers [22]. Briefly, a quarter of the collected filter was immersed in PBS solution (pH 7.0) and gently rocked for 2 h. PMs were then removed from the suspension by centrifugation at 1600× g for 5 min to obtain the supernatant fraction containing protein. Mass concentration of the total protein was determined by BCA kit (Thermo scientfic pierce BCA protein assay Kit, Thermo scientfic, Rockford, IL, USA).

2.3. Specific Antibody Preparation for the Pla a3 Detection

Generally, Platanus pollen has three different types of allergens, Pla a1, Pla a2, and Pla a3, which are responsible for allergenic reactions. However, there are numerous types of proteins in pollen and it is difficult to isolate sufficient amounts of highly pure allergen directly from the natural extract of pollens. In this study, Pla a3 protein was selected to prepare specific antibody production. Detail protocol was noted in our previous work [15]. Briefly, a recombinant Pla a3 (rPla a3) and the tandem six-histidine fusion protein was expressed in a prokaryotic system (Escherichia coli Top10 strain for plasmid proliferation and Rosita strain for Pla a3 expression) and purified by affinity chromatography. Then, the rPla a3 protein was used to establish an allergenic rat model, in which a specific antibody was produced by the rats allergic to the Pla a3 allergen [15]. To test the specificity and sensitivity of the antibody produced by the rats, western blot assay was employed. (a) The protein lysates (from SPPs, Pollen, Arabidopsis anther) and the purified protein were separated by 15% SDSPAGE and blotted onto a nitrocellulose membrane by electrical transfer; (b) 1% bovine serum albumin was added to block the membrane for 1 h. The blocked membranes were incubated with anti-rPla a3 IgG antiserum from sensitized rats (1:500 dilution) at 37 °C for 1 h; (c) After washing the membrane with phosphate-buffered saline containing Tween 20 (PBST) (pH 7.4) three times, primary antibody binding was detected with mouse horseradish peroxidase (HRP)-conjugated anti-rat IgG polyclonal antibody (1:5000 dilution, Yusen Biotechnology Co., Ltd., Taichung, China) incubated at 37 °C for 1 h; (d) the membranes were washed with PBST (pH 7.4) and incubated with tetramethyl benzidine substrate at 37 °C for 30 min for color development. There appeared to be a pure positive band with molecular weights of 11 kD (rPla a3) on the blotting membrane (supplementary material Figure S1), which indicates that the specific antibody from the rat serum is effective.

2.4. Detection of Pla a3 Distribution in the Ambient Particles

This protocol was been described in our previous study [15]. Firstly, the standard curve of mass level of Pla a3 was prepared to measure Pla a3 protein in the size-resolved particles (supplementary material Figure S2). Then, the filter samples with collected size-resolved particles were dissolved in an embedding buffer, which was added to the wells of polystyrene plates and incubated overnight at 4 °C, avoiding light. Samples were washed with PBS (pH 7.4) three times, then anti-rPla a3 IgG antiserum from sensitized rats (1:1000 dilution) was added and incubated at 37 °C for 30 min. The plates were repeatedly washed with PBS, and mouse HRP-conjugated anti-rat IgG polyclonal secondary antibody (1:10,000 dilution, YESEN Biotechnology Co., Ltd. YESEN Biotechnology Co., Ltd, Shanghai, China) was added to incubate for 1 h at 37 °C, and then washed with PBS three times. Finally, 50 μL 2 M sulfate was added to terminate the reaction, and absorbance at OD450 was detected with a microplate reader (Bio-Tek Instruments, Winooski, VT, USA).

2.5. Chemical Elements in the Size-Resolved Particles Were Measured by ICP-MS

The principal experimental approach could be found in our previous studies [18]. Briefly, a suitable quartz filter was punched and digested using concentrated nitric acid, hydrofluoric acid, and hydrogen peroxide (volume ratio- 3:1:1, 3 mL HNO3, 61%; 1 mL HF, 50%; and 1 mL H2O2, 30%) in a microwave for 40 min. Then, the samples in the vessel were enriched for 15 min and the digested solution was filtered through a membrane filter with 0.45 μm pore size (47 mm) and collected into the 10 mL acid-washed volumetric flask. Next, 200 ppb indium was added into the digestion solution as an internal standard element and the final volume of the solution was fixed to 10 mL by adding a 2% dilute HNO3 solution for analysis. A total of 21 elements of the sample solutions, including Na, Mg, Al, K, Ca, V, Cr, Mn, Fe, Co, Ni, Cu, Zn, Ga, As, Se, Rb, Sr, Cd, Cs, Ba, and Pb, were analyzed by an inductively coupled plasma-mass spectrometry (ICP-MS, Agilent770, Santa Clara, CA, USA). One blank filter was used for the correction of multi-element concentrations.

2.6. Statistical Analysis

Data were obtained from three independent experiments and expressed as the mean ± standard error (SE). Statistical analysis for the paired Student’s t-test and analysis of variance was performed with Graphpad Instat software (Adriano G Rossi Rayne Laboratories, GTA-30540-430, GraphPad Software, Dr. Harvey Motulsky, Version 3.0, San Diego, CA, USA). Differences were considered statistically significant when p < 0.05.

3. Results and Discussion

3.1. Daily Mass Level of Pla a3 in the Size-Resolved Particles

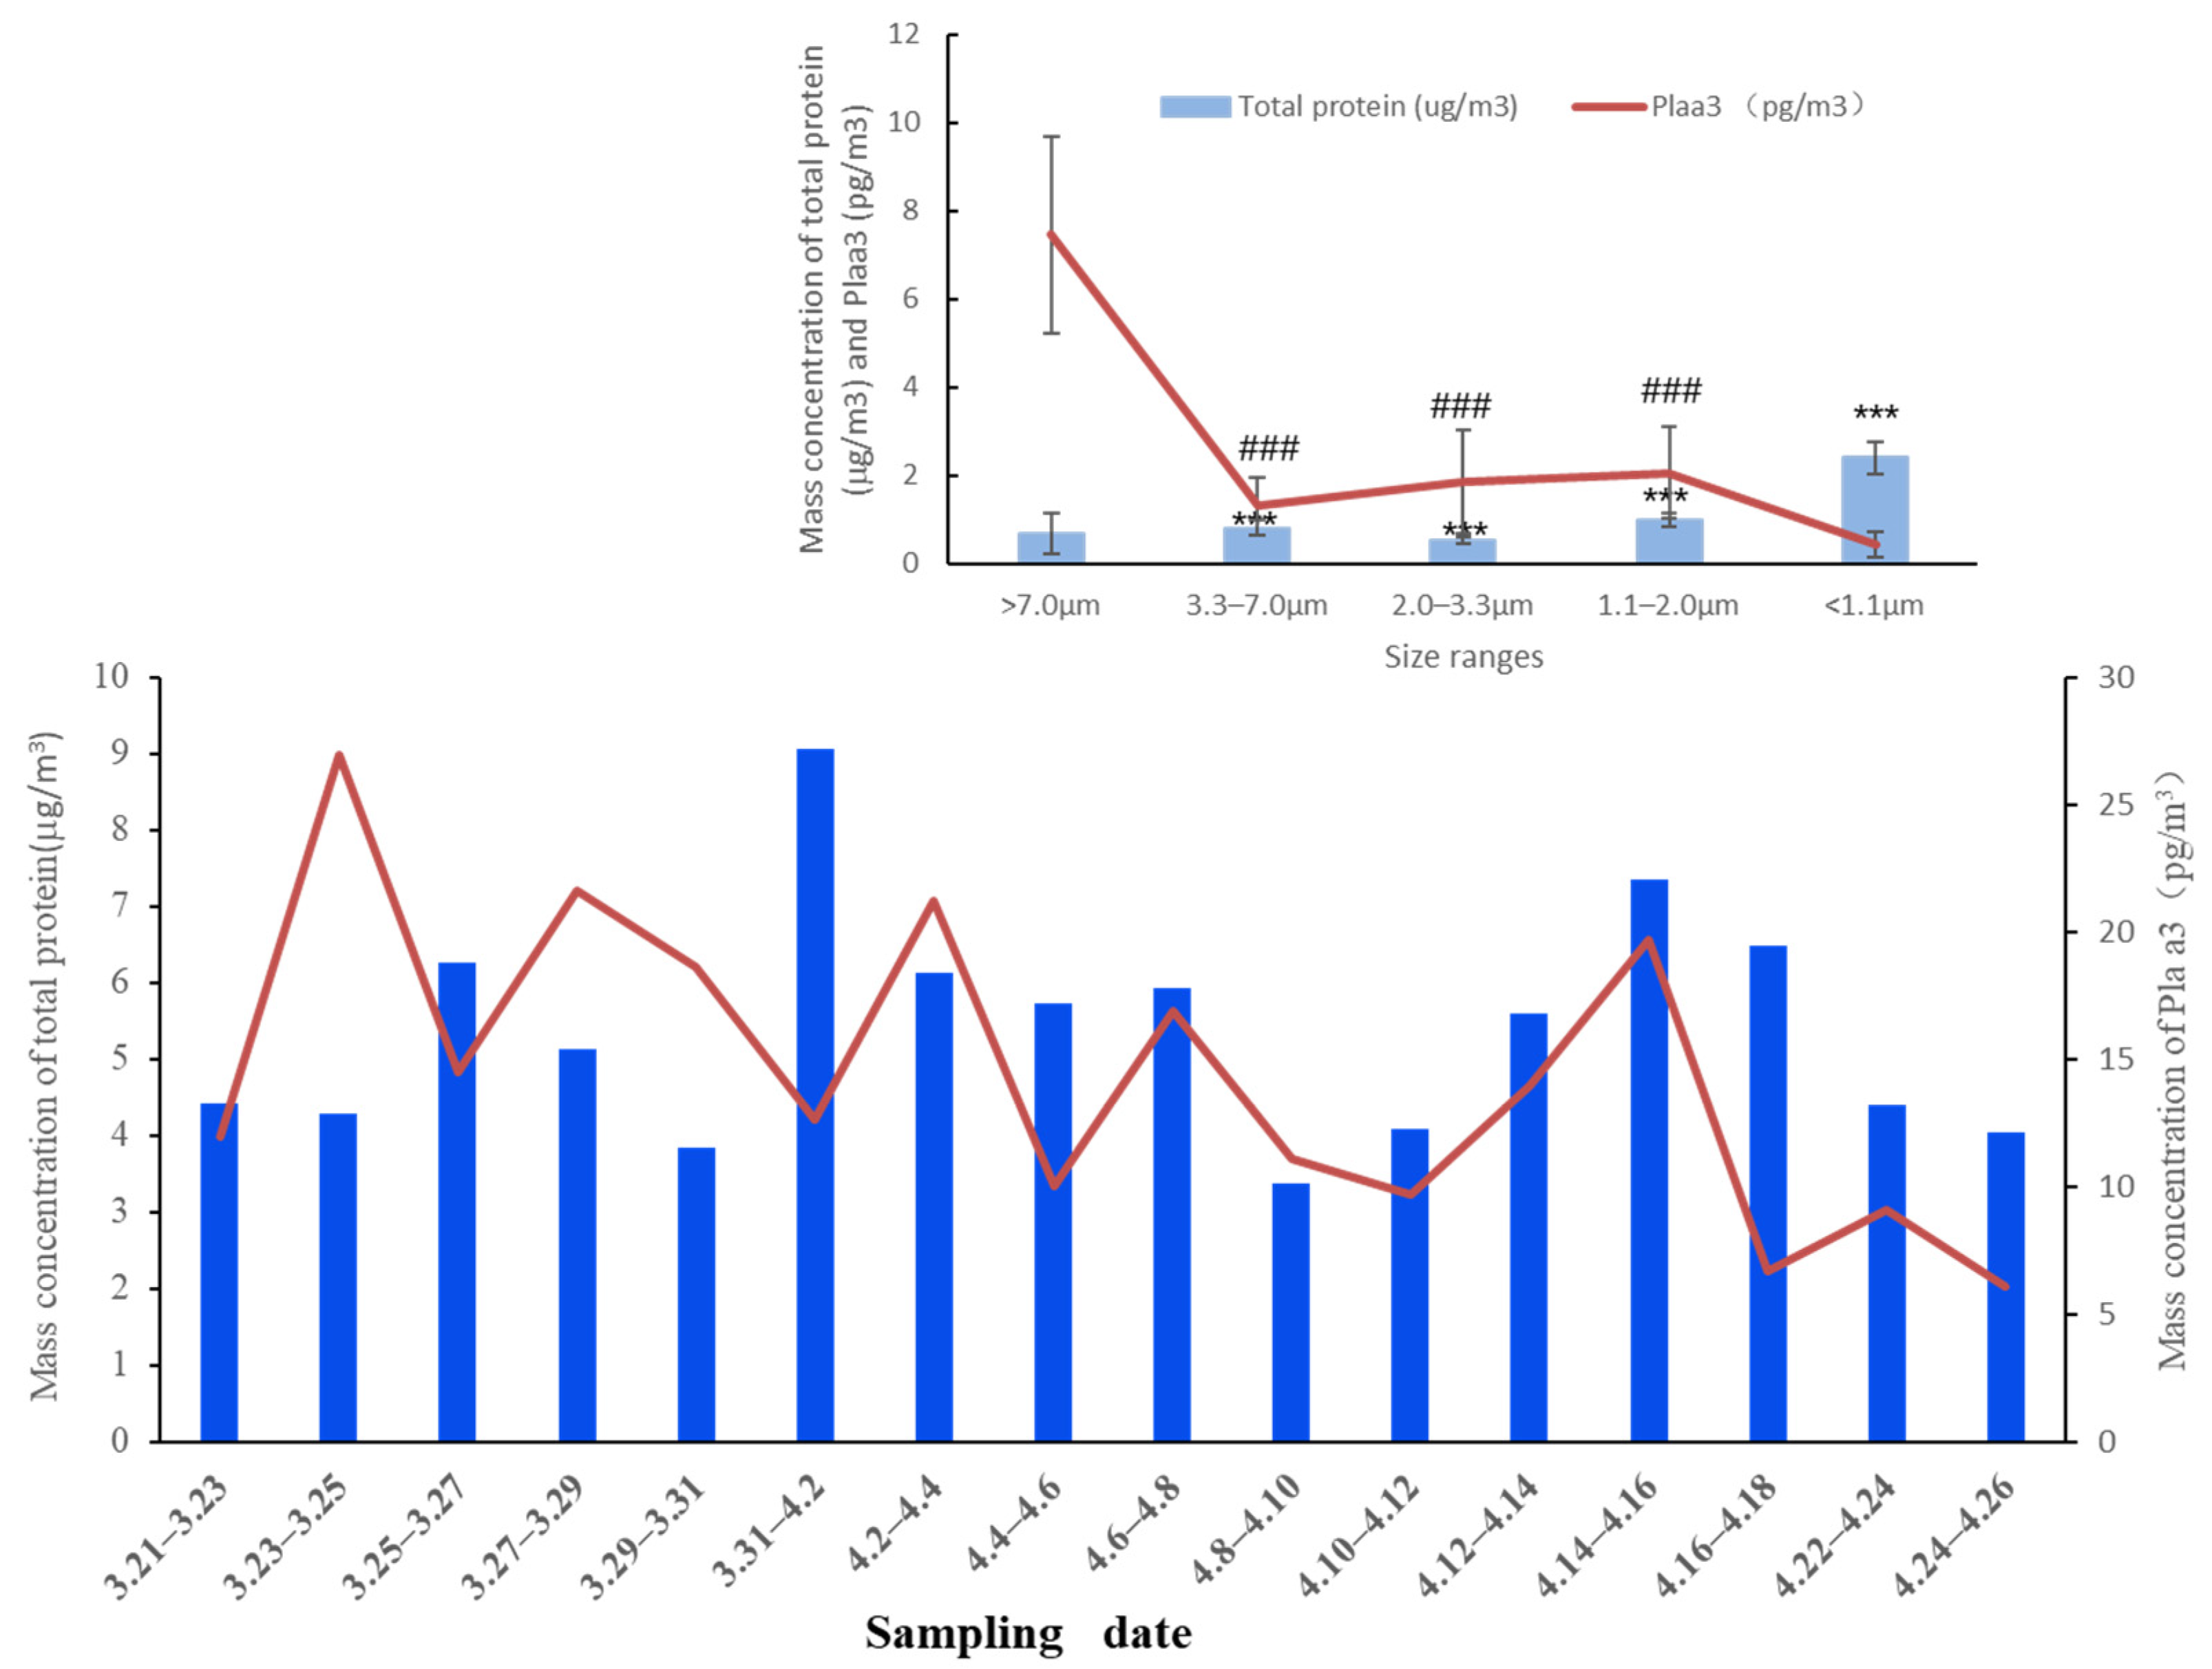
Mass concentration of the Pla a3 ranged from 0.41 ± 0.28 to 7.46 ± 2.23 pg/m3 in the size-resolved particles during the sampling period. There was a close relationship between mass concentrations of Pla a3 in the PM1.1, PM1.1–2.0, PM2.0–3.3, and PM3.3–7.0 and in the PM > 7.0 µm (p < 0.001). It was noted that mass level of the Pla a3 in the size-resolved particles decreased with the size range, while mass concentration of the total protein increased with the size range, which suggests that the total protein could be enriched in the fine particles (Figure 2). The highest mass level of the total protein in PMs (9 µg/m3) was on the days of 31 March to the 2 April, but the highest mass level of the Pla a3 (25 pg/m3) was on the days of the 23rd to the 25th of March (Figure 2). This phenomenon might indicate the total proteins in the airborne particles that contributed by fungal spores, pollens, etc. The highest mass level of the Pla a3 (7.46 ± 2.23 pg/m3) was found in the PM > 7 μm, which indicates that most pollen allergens remained in the intact Platanus pollen grains during the Planatus fluorescence season [15]. Pla a3 protein could be found in the PM1.1, which implies that this allergenic protein is widely distributed in the size-resolved particles.

3.2. Mass Concentration of Redox Trace Metals in the Size-Resolved Particles

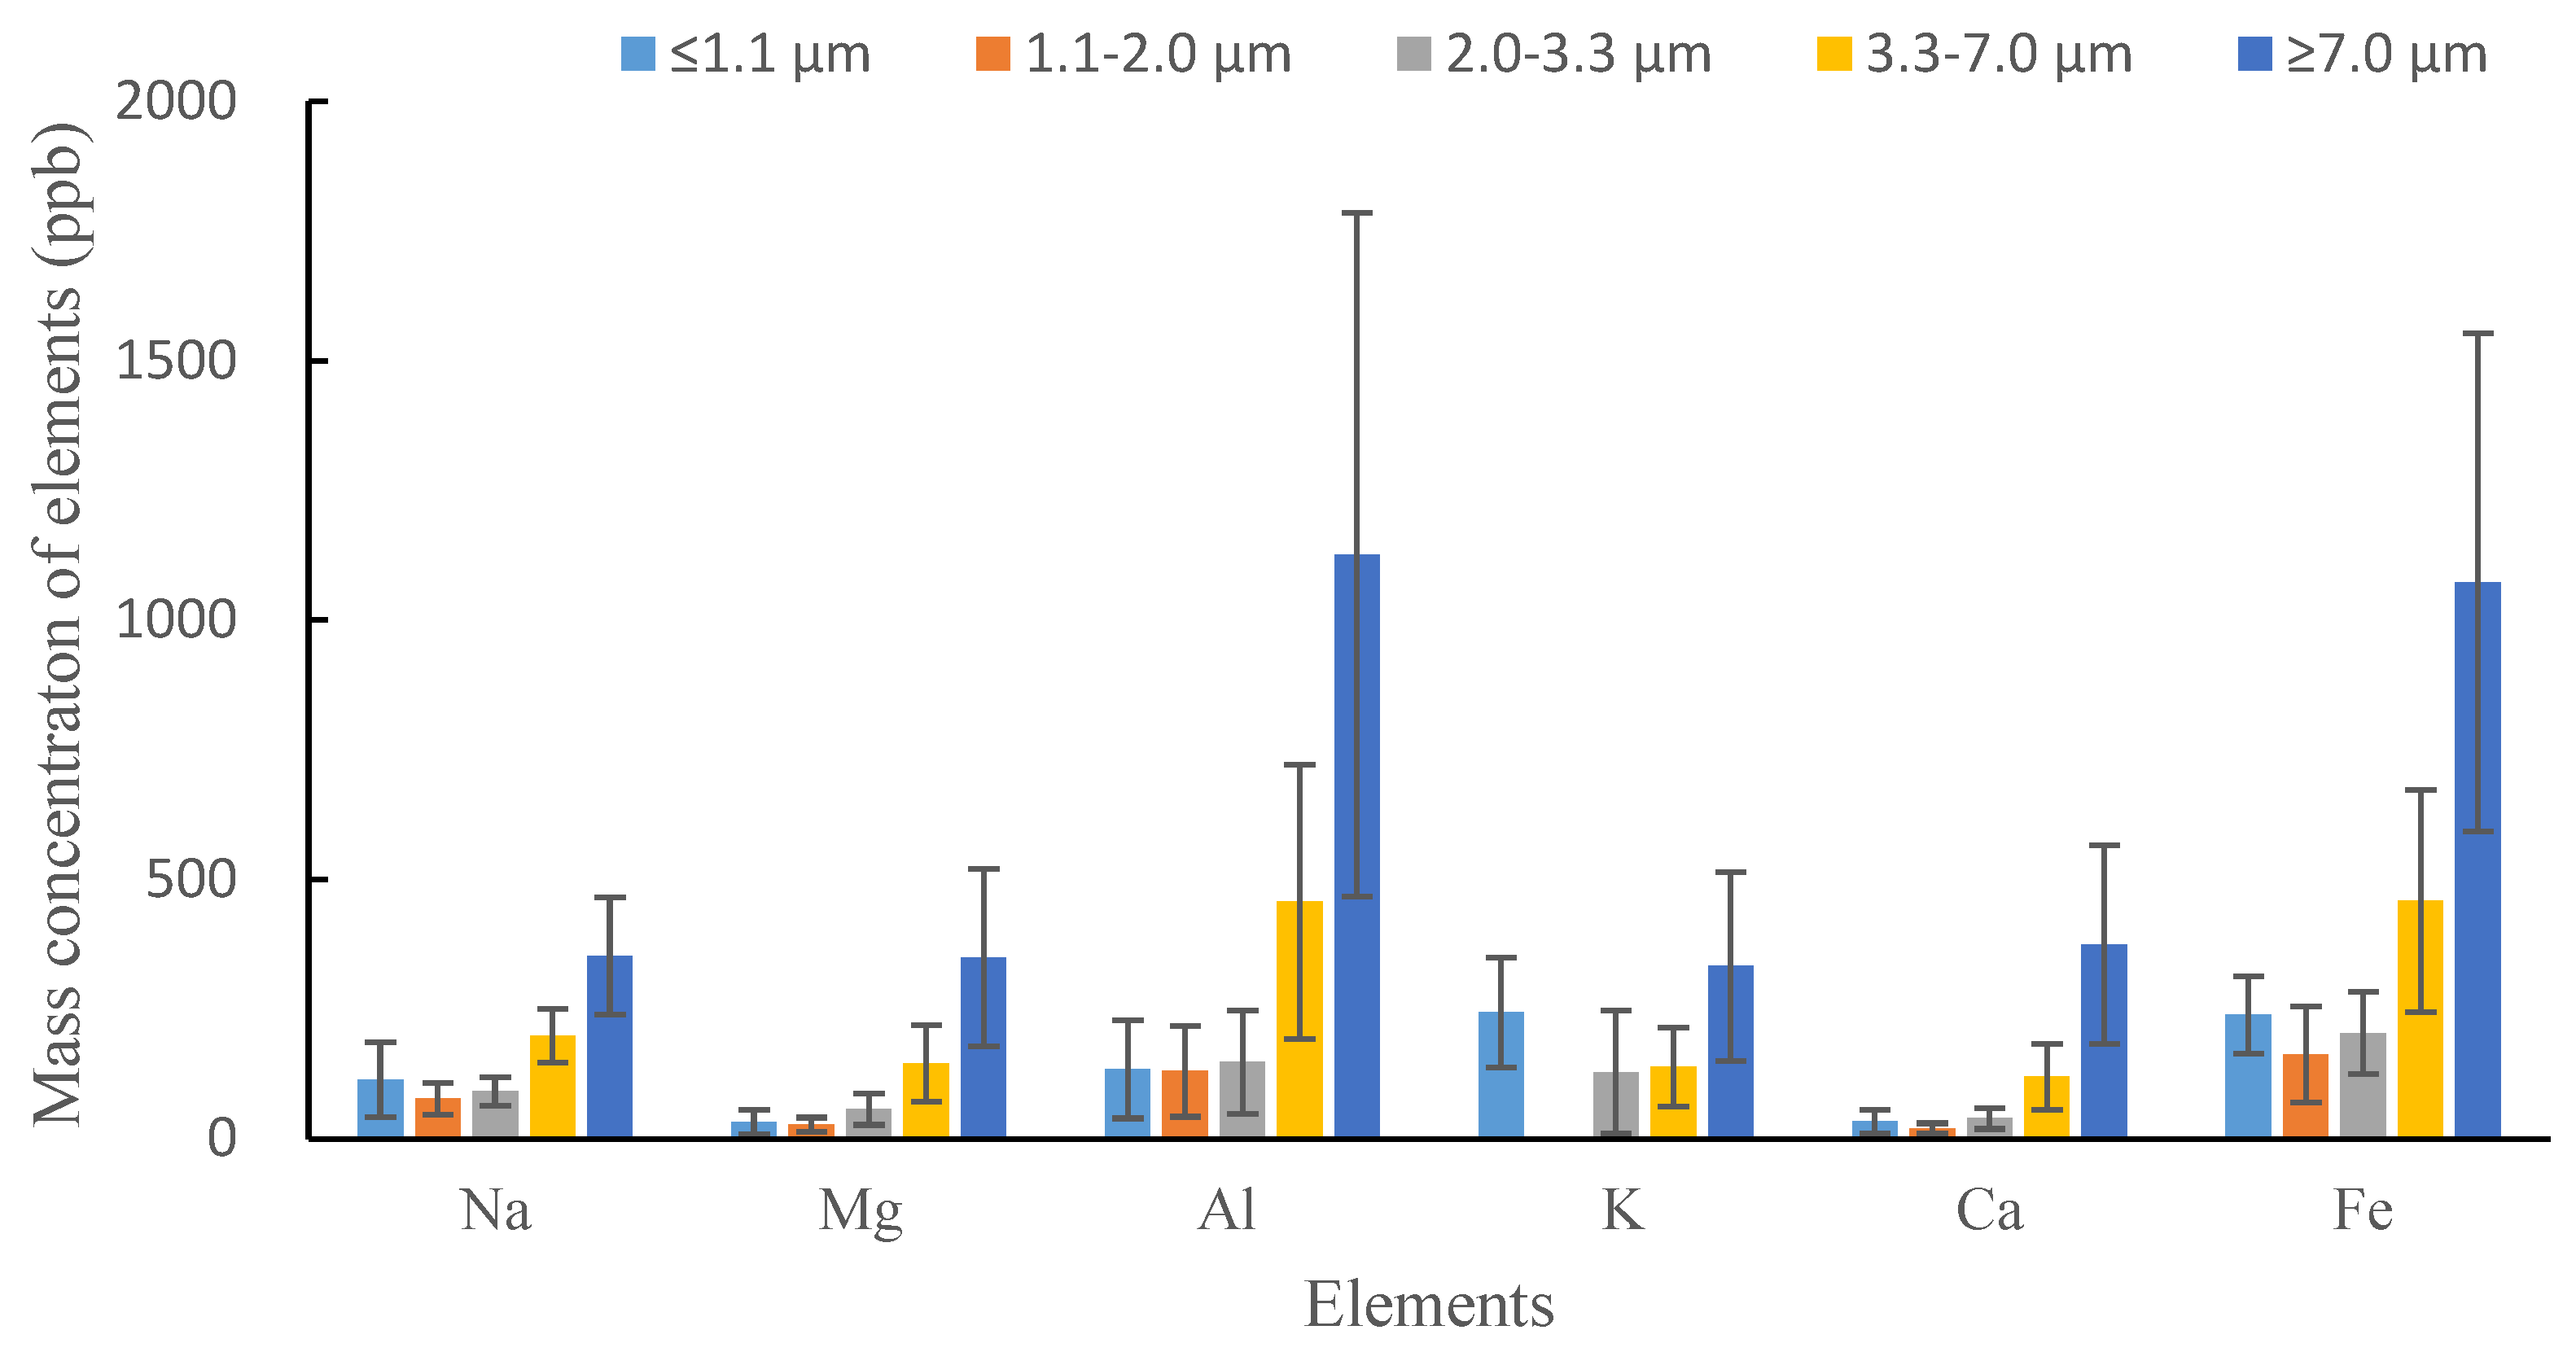
Mass concentration of chemical metals in the size-resolved particles were different. Crustal elements (Al, Ca, Mg, Na) in the ambient particles were much more abundant than those of the anthropogenic elements. Mass level of aluminum (ppb) in the particles was the highest and was distributed in the particles with size >7 mm range (1126.22 ± 659.52), followed by Ca (374.67 ± 191.16), Na (352.47 ± 113.71), Mg (349.77 ± 170.82), and K (332.59 ± 181.87). It should be noted that a high mass concentration of Potassium also could be found in the PM1.1 (243.73 ± 105.77) (Figure 3).
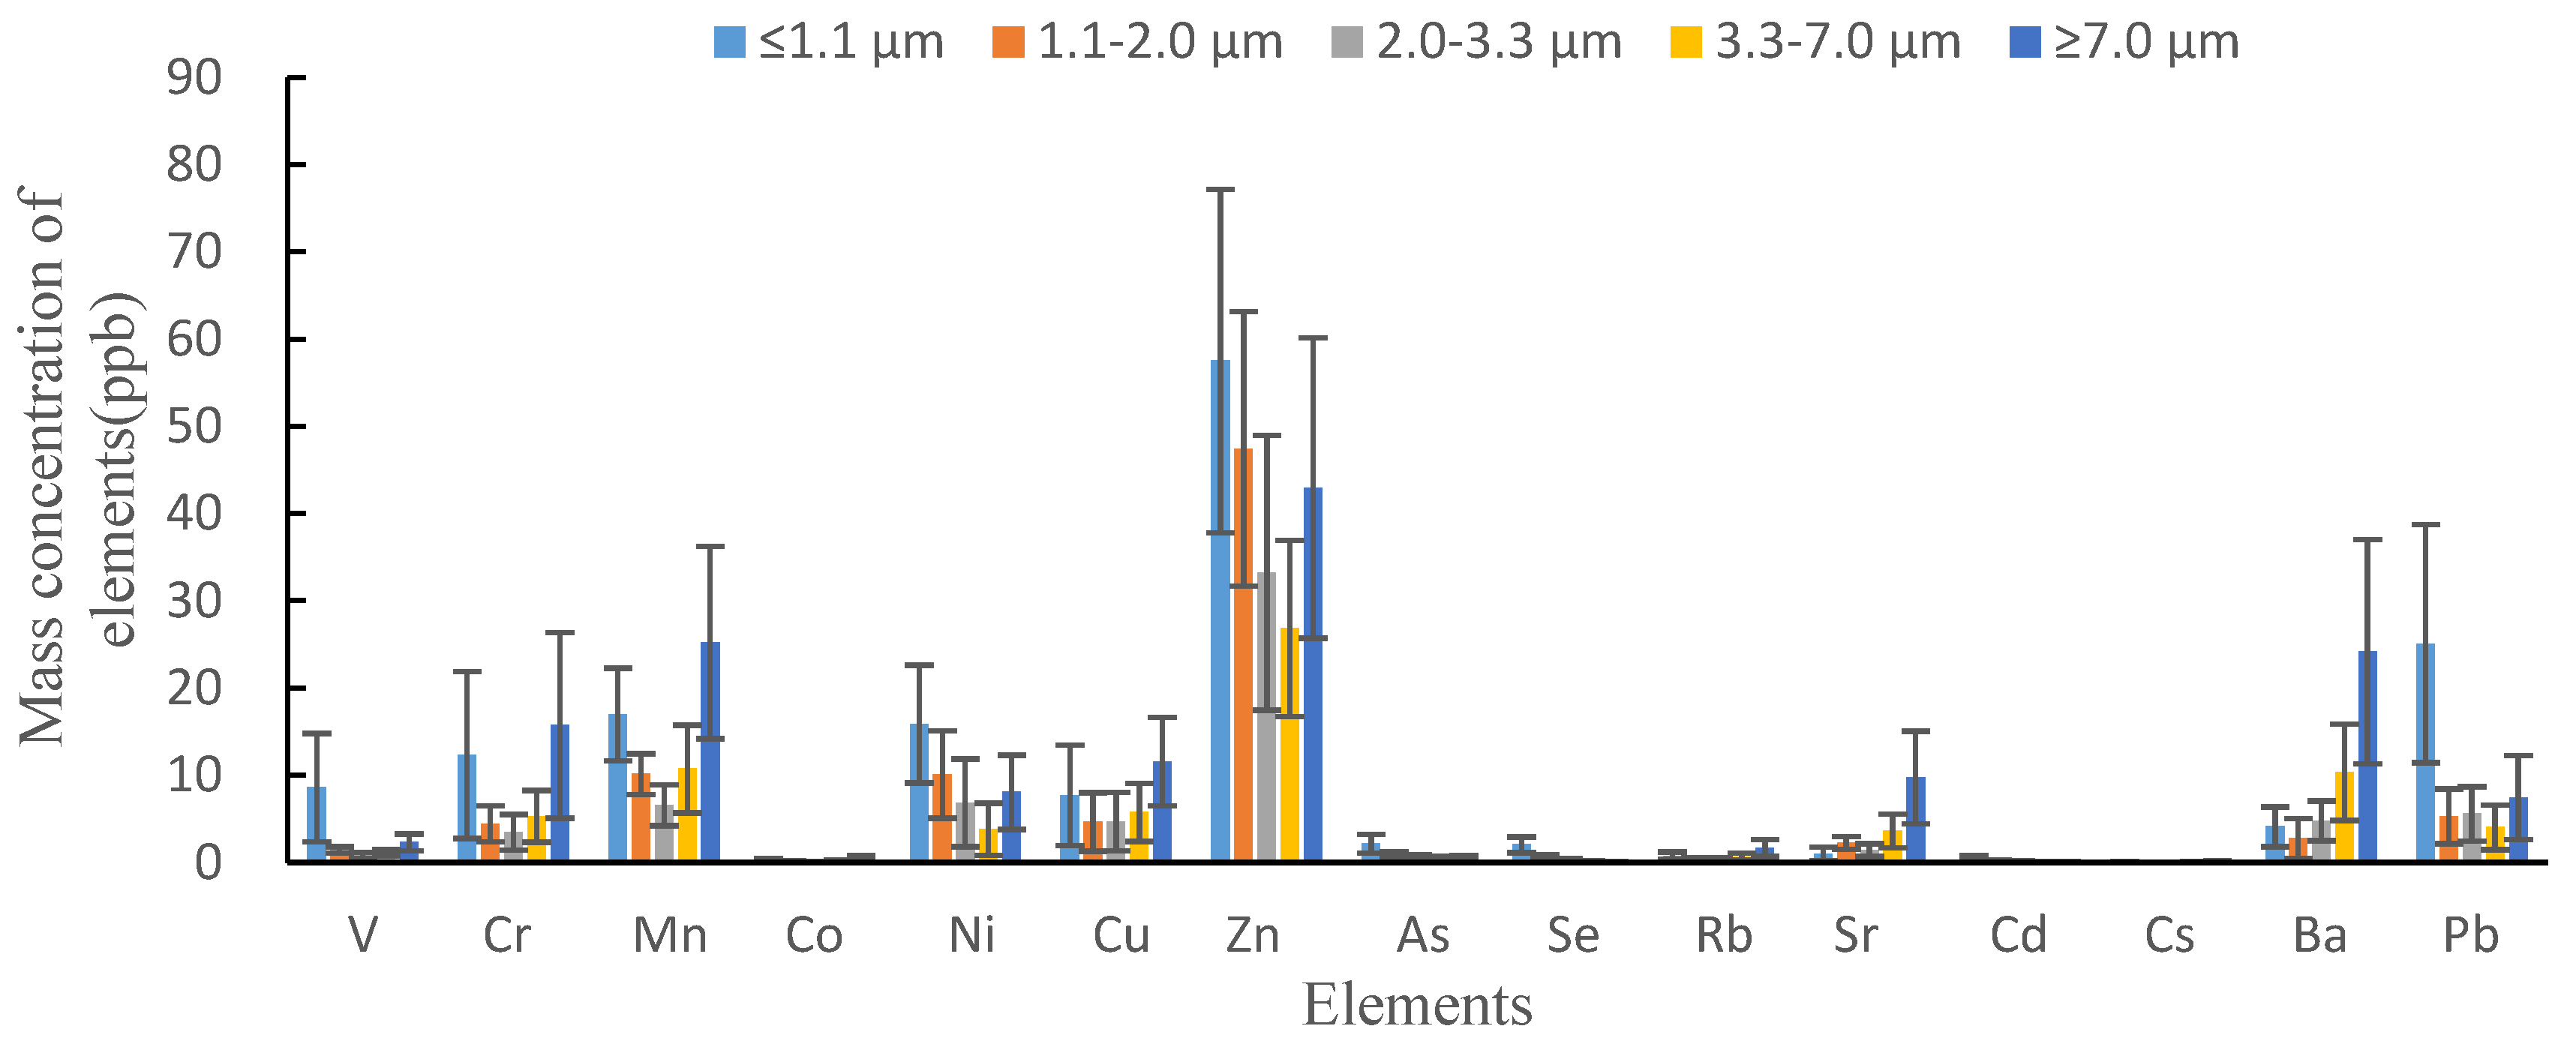
Fe, a typical redox sensitive element in airborne particles, was regarded both from crustal sources and anthropogenic sources. Considering that this element has strong redox abilities, a higher mass concentration of the Fe in the particles would play an essential role in allergenicity induced by the ambient particles. Mass levels of the Fe in the size-resolved particles were 238.83 ± 74.72, 162.59 ± 92.10, 203.79 ± 79.62, and 458.20 ± 213.90 ppb, respectively (except for PM > 7, which was 1073.32 ± 480.32 ppb). We reported that the mass concentration of Fe in Shanghai PM2.5 was 1403.18 ppb (ng/mL) in the spring season [23] and mass concentration of iron in ambient fine particles was less than 500 ppb, which suggests that the Fe mass level in Shanghai’s air decreased significantly (Figure 3). The highest mass level of trace metal was Zn, followed by Mn, Pb, Ni, Cr, Cu, V, Ba, Sr, As, Se, Cd, and Cs (Figure 4). It was necessary to point out that, of these, Zn (57.53 ± 19.7), Pb (25.07 ± 13.63), Ni (15.88 ± 6.74), Cr (12.33 ± 9.55), and Cu (7.71 ± 5.76) have higher mass levels in the PM1.1 compared to those in the other size particles. It was noted that the total mass concentration of Fe, Cr, Mn, Ni, Cu, Zn, Ba, and Pb were more than 20 ppb, while other trace elements, such as V, Co, Ni, Cu, Zn, Ga, As, Se, Rb, Sr, Cd, and Cs, were lower than 20 ppb. The relationships of elements with mass concentrations less than 20 ppb with the Pla a3 are not discussed in this study.

3.3. Relationship of Mass Concentration of Redox Trace Metals and Pla a3 in the Size-Resolved Particles

Our data showed that the mass level of Pla a3 in the size-resolved particles had close relationships with the crustal elements (Na, Mg, Al, Ca), except for potassium, and main trace elements, including Fe (R2 = 0.82, p < 0.01) (Table 1, Table S1), Mn (R2 = 0.54), Cu (R2 = 0.61), Ba (R2 = 0.82), and Pb (R2 = 0.82) (Table 1). It was noted that there was a poor relationship between mass level of Pla a3 and Cr (R2 = 0.37), Ni (R2 = 0.06), and Zn (R2 = 0.01) (Table 1).
We reported that Ca2+, NH4+, and SO42− could cause Platanus pollen grains to break and release allergenic proteins [15]. In this study, we found that the mass concentration of crustal elements and several trace elements had significant relationships with the mass level of Pla a3, which demonstrates that the crustal elements could promote the Platanus pollen grains to break and lead to the release of allergenic proteins from the pollen grains. In addition, the close relationship between the Pla a3 and redox trace elements could have synergic effects on allergenic diseases, but this needs to be further investigated.

4. Discussion

As one of the airborne allergens, pollen allergenic protein is regard as one of the primary causes of pollinosis [24]. Platanus pollen allergen a3 (Pla a3) was found to be responsible for allergic responses [25]. Toxicological studies demonstrated that redox trace metals, such as Cu, Fe, and Mn, in airborne particles were toxic for human health because these redox elements have oxidative potential [20]. Considering redox metals and allergenic proteins can be absorbed into ambient particles, they can also be inhaled into the human body. Therefore, understanding the relationships between the two pollutants can help to investigate health effects induced by airborne particles. In this study, we found that iron, one of the typical redox elements, had a high mass concentration compared to those of other redox trace metals, and was widely distributed in the size-resolved particles (Figure 3). Mass levels of Fe in PM < 1.1, PM1.1–2.0, PM2.0–3.3, and PM 3.3–7.0 were 238.83 ± 74.72, 162.59 ± 92.10, 203.79 ± 79.62, and 458.20 ± 213.90 ppb, respectively. We showed that there was a positive relationship between the average mass concentration of Fe with the mass level of Pla a3 (R2 = 0.82, p < 0.01; the p value was calculated from daily mass concentration of iron and Pla a3) (in supplementary material, Table S1). Iron exists in the redox states of Fe2+ or Fe3+ in ambient particles, and free radicals could be formed by a Fenton reaction (Fe2+ + H2O2 + H+→Fe3+ + H2O + OH). Besides Fe, other redox trace elements, including Mn, Cu, Ba, and Pb, in the size-resolved particles also had oxidative potential. Free radicals could initiate oxidative stress [20], which was considered to be associated with diseases such as lung cancer. Our previous study showed that when ambient particles were inhaled together with pollen allergens into the human body, these particles could strengthen intracellular autophagy and have negative effects on health [5]. Therefore, due to the close relationship between the Pla a3 and redox trace elements, synergic effects on allergenic diseases induced by the two kinds pollutants should be further investigated.

5. Conclusions

(1) Our data demonstrated that mass level of the Pla a3 in the size-resolved particles ranged from 0.41 ± 0.28 to 7.46 ± 2.23 pg/m3 and was mainly distributed in particles with sizes >7 mm. (2) Mass level of the Pla a3 in the size-resolved particles decreased with the size range, while the mass concentration of the total protein increased with the size range. (3) Mass level of redox trace elements had a significant relationship with Pla a3, which implies that these redox chemical elements could play a role in the assessment of allergenicity induced by allergenic pollen protein.

Supplementary Materials

The following supporting information can be downloaded at: https://www.mdpi.com/article/10.3390/atmos13101541/s1, Figure S1. Antibody specificity was verified by Western blot assay. The protein extracted from Platanus subpollen particles (SPPs), Platanus pollen grains, Arabidopsis anther, and the recombina-tion protein were detected using anti-Pla a3 antibody (IgG ). SPPs: subpollen particles, PE: pollen extract, rPla a3: recombination Pla a3 protein; Figure S2. Standard curve of the mass concentration of Plaa3 by using ELISA assay; Table S1. Correlation coefficients between daily mass level of chemical elements and mass concentration of Pla a3.

Author Contributions

S.L. and S.Z. designed the study, instructed all experiments. S.L. drafted the manuscript. S.Z. carried out animal experiment, T.M. and L.Z. were responsible for exposure experiment. L.Z. and Y.F. analyzed the data of Pla a3 protein. W.Z. and S.L. provided instruction on allergenic reaction. S.Y. and X.L. gave instruction on chemical analysis. W.W., E.C.E. and Q.W. revised the manuscript. All authors have read and agreed to the published version of the manuscript.

Funding

This research was funded by the Science and Technology Committee of Shanghai (20ZR1419500; 21DZ1202300); Natural Science Foundation of China (NSFC Grant No. 21477073).

Institutional Review Board Statement

The animal study protocol was approved by Ethics by Ethics Committee of Shanghai University (Approval No. ECSHU 2021-001, date of approval, 3 March 2021).

Informed Consent Statement

Not applicable.

Data Availability Statement

All the data was present in the text and in the supplementary materials.

Conflicts of Interest

All authors confirm there are no potential conflict of interest should be disclosed.

References

  1. Fajersztajn, L.; Mariana, V.; Ligia, V.B.; Paulo, S. Air pollution: A potentially modifiable risk factor for lung cancer. Nat. Rev. Cancer 2013, 13, 674–678. [Google Scholar] [CrossRef] [PubMed]
  2. Lu, S.; Hao, X.; Liu, D.; Wang, Q.; Zhang, W.; Liu, P.; Zhang, R.; Yu, S.; Pan, R.; Wu, M.; et al. Mineralogical characterization of ambient fine/ultrafine particles emitted from Xuanwei C1 coal combustion. Atmos. Res. 2015, 169, 17–23. [Google Scholar] [CrossRef]
  3. Daher, N.; Saliba, N.; Shihadeh, A.; Jaafar, M.; Baalbaki, R.; Shafer, M.; Schauer, J.; Sioutas, C. Oxidative potential and chemical speciation of size-resolved particulate matter (PM) at near-freeway and urban background sites in the greater Beirut area. Sci. Total Environ. 2014, 470, 417–426. [Google Scholar] [CrossRef]
  4. Reinmuth-Selzle, K.; Kampf, C.J.; Lucas, K.; Lang-Yona, N.; Frohlich-Nowoisky, J.; Shiraiwa, M.; Lakey, P.S.J.; Lai, S.; Liu, F.; Kunert, A.T.; et al. Air pollution and climate change effects on allergeies in the anthropocene: Abundance interaction and modification of allergens and adjuvants.Environ. Sci. Technol. 2017, 51, 4119–4141. [Google Scholar] [CrossRef] [PubMed]
  5. Shumin, Z.; Luying, Z.; Senlin, L.; Jiaxian, P.; Yang, L.; Lanfang, R.; Tingting, X.; Wei, Z.; Shuijun, L.; Weqian, W.; et al. Ambient particulate matter-associated autophagy alleviates pulmonary inflammation induced by Platanus pollen protein 3 (Pla3). Sci. Total Environ. 2020, 758, 143696. [Google Scholar] [CrossRef] [PubMed]
  6. Poschl, U. Atmospheric aerosol: Composition, Transformation, Climate and Health Effects. Angew. Chem. Int. Ed. 2005, 44, 7520–7540. [Google Scholar] [CrossRef]
  7. Lancia, A.; Capone, P.; Vonesch, N.; Pelliccioni, A.; Grandi, C.; Magri, D.; D’Ovidio, M.C. Research Progress on Aerobiology in the Last 30 Years: A Focus on Methodology and Occupational Health. Sustainability 2021, 13, 4337. [Google Scholar] [CrossRef]
  8. Smiljanic, K.; Apostolovic, D.; Trifunovic, S.; Ognjenovic, J.; Perusko, M.; Mihajlovic, L.; Burazer, L.; van Hage, M.; Velickovic, T.C. Subpollen particles are rich carriers of major short ragweed allergens and NADH dehydrogenases: Quantitative proteomic and allergomic study. Clin. Exp. Allergy 2017, 47, 815–828. [Google Scholar] [CrossRef]
  9. Bacsi, A.; Choudhury, B.K.; Dharajiya, N.; Sur, S.; Boldogh, I. Subpollen particles: Carriers of allergenic proteins and oxidases. J. Allergy Clin. Immunol. 2006, 118, 844–850. [Google Scholar] [CrossRef]
  10. Wang, Q.; Gong, X.; Suzuki, M.; Lu, S.; Sekiguchi, K.; Nakajima, D.; Miwa, M. Size-segregated Allergenic Particles Released from Airborne Cryptomeria japonica Pollen Grains during the Yellow Sand Events within the Pollen Scattering Seasons. Asian J. Atmospheric Environ. 2013, 7, 191–198. [Google Scholar] [CrossRef] [Green Version]
  11. Albert, C.; Luque, G.M.; Courchamp, F. The twenty most charismatic species. PLoS ONE 2018, 13, e0199149. [Google Scholar] [CrossRef] [PubMed]
  12. Fucheng, Y.; Zheng, Z.; Yichun, L.; Yang, L.; Luying, Z.; Jiaxian, P.; Wei, Z.; Shumin, Z.; Senlin, L. Subpollens delivery of Platanus acerifolia pollen allergen Pla a3 and nucleic acid into lungs and cells. Biochem. Biophys. Res. Commun. 2019, 513, 767–774. [Google Scholar] [CrossRef] [PubMed]
  13. Chen, Z.; Yang, Y.; Chen, X.; Wu, Z.; Li, S. Characterization of two pollen allergens of the London plane tree in Shanghai. Iran. J. Allergy Asthma Immunol. 2015, 14, 139–148. [Google Scholar] [PubMed]
  14. Ni, W.W.; Huang, W.; Wu, D.Q.; Zhou, Y.J.; Ji, C.M.; Cao, M.D.; Guo, M.; Sun, J.L.; Wei, J.F. Expression and purification of a major allergen, Pla a1, from Platanus acerifolia pollen and the preparation of its monoclonal antibody. Mol. Med. Rep. 2017, 16, 2887–2892. [Google Scholar] [CrossRef]
  15. Zhou, S.; Zhao, H.; Peng, J.; Hong, Q.; Xiao, K.; Shang, Y.; Lu, S.; Zhang, W.; Wu, M.; Li, S.; et al. Size distribution of Platanus acerifolia allergen 3 (Pla a3) in Shanghai ambient size-resolved particles and its allergenic effects. Atmos. Environ. 2018, 198, 324–334. [Google Scholar] [CrossRef]
  16. Buter, J.; Thibaudon, M.; Smith Mm Kennedy, R.; Rantio, A.; Albertini, R.; Reese, G.; Weber, B.; Galan, C.; Brandao, R.; Antunes, C.; et al. Release of Bet v 1 from birch pollen from 5 European countries. Results from the HIALINE study. Atmos. Environ. 2012, 55, 496–505. [Google Scholar] [CrossRef]
  17. Liu, Y.; Sun, X.; Tao, A.; Wang, G.; Wu, Y.; Li, M.; Shi, H.; Xie, M. Expression, purification and identification of Pla a1 in a codon-optimized Platanus pollen allergen. Mol. Med. Rep. 2015, 12, 2197–2202. [Google Scholar] [CrossRef]
  18. Lu, S.; Yi, F.; Hao, X.; Yu, S. Physicochemical properties and ability to generate free radicals of ambient coarse, fine, and ultrafine particles in the atmosphere of Xuanwei, China, an area of high lung cancer incidence. Atmos. Environ. 2014, 97, 519–528. [Google Scholar] [CrossRef]
  19. Lu, S.; Ren, J.; Hao, X.; Liu, D.; Zhang, R.; Wu, M.; Yi, F.; Lin, J.; Shinich, Y.; Wang, Q. Characterization of protein expression of Platanus pollen following exposure to gaseous pollutants and vehicle exhaust particles. Aerobiologia 2014, 30, 281–291. [Google Scholar] [CrossRef]
  20. Lee, S.; Roh, Y.; Koh, D. Oxidation and reduction of redox-sensitive elements in the presence of humic substances in subsurface environments: A review. Chemosphere 2019, 220, 86–97. [Google Scholar] [CrossRef]
  21. Lu, S.; Win, M.S.; Zeng, J.; Yao, C.; Zhao, M.; Xiu, G.; Lin, Y.; Xie, T.; Dai, Y.; Rao, L.; et al. A characterization of HULIS-C and the oxidative potential of HULIS and HULIS-Fe(II) mixture in PM2.5 during hazy and non-hazy days in Shanghai. Atmos. Environ. 2019, 219, 117058. [Google Scholar] [CrossRef]
  22. Kang, H.; Xie, Z.; Hu, Q. Ambient protein concentration in PM10 in Hefei, central China. Atmos. Environ. 2012, 54, 73–79. [Google Scholar] [CrossRef]
  23. Lu, S.; Feng, M.; Yao, Z.; An, J.; Zhong, Y.; Wu, M.; Sheng, G.; Fu, J.; Yonemochi, S.; Zhang, J.; et al. Physicochemical characterization and cytotoxicity of ambient coarse, fine, and ultrafine particulate matters in Shanghai atmosphere. Atmos. Environ. 2011, 45, 736–744. [Google Scholar] [CrossRef]
  24. Hong, Q.; Zhou, S.; Zhao, H.; Peng, J.; Li, Y.; Shang, Y.; Wu, M.; Zhang, W.; Lu, S.; Li, S.; et al. Allergenicity of recombinant Humulus j aponicus pollen allergen 1 after combined exposure to ozone and nitrogen dioxide. Environ. Pollut. 2018, 234, 707–715. [Google Scholar] [CrossRef] [PubMed]
  25. Fernandez-Gonzalez, D.; Gonzalez-Parrado, Z.; Vega-Maray, A.M.; Valencia-Barrera, R.M.; Camazon-Izquierdo, B.; De Nuntiis, P.; Mandrioli, P. Platanus pollen allergen, Pla a1: Quantification in the atmosphere and influence on a sensitizing population. Clin. Exp. Allergy 2010, 40, 1701–1708. [Google Scholar] [CrossRef]
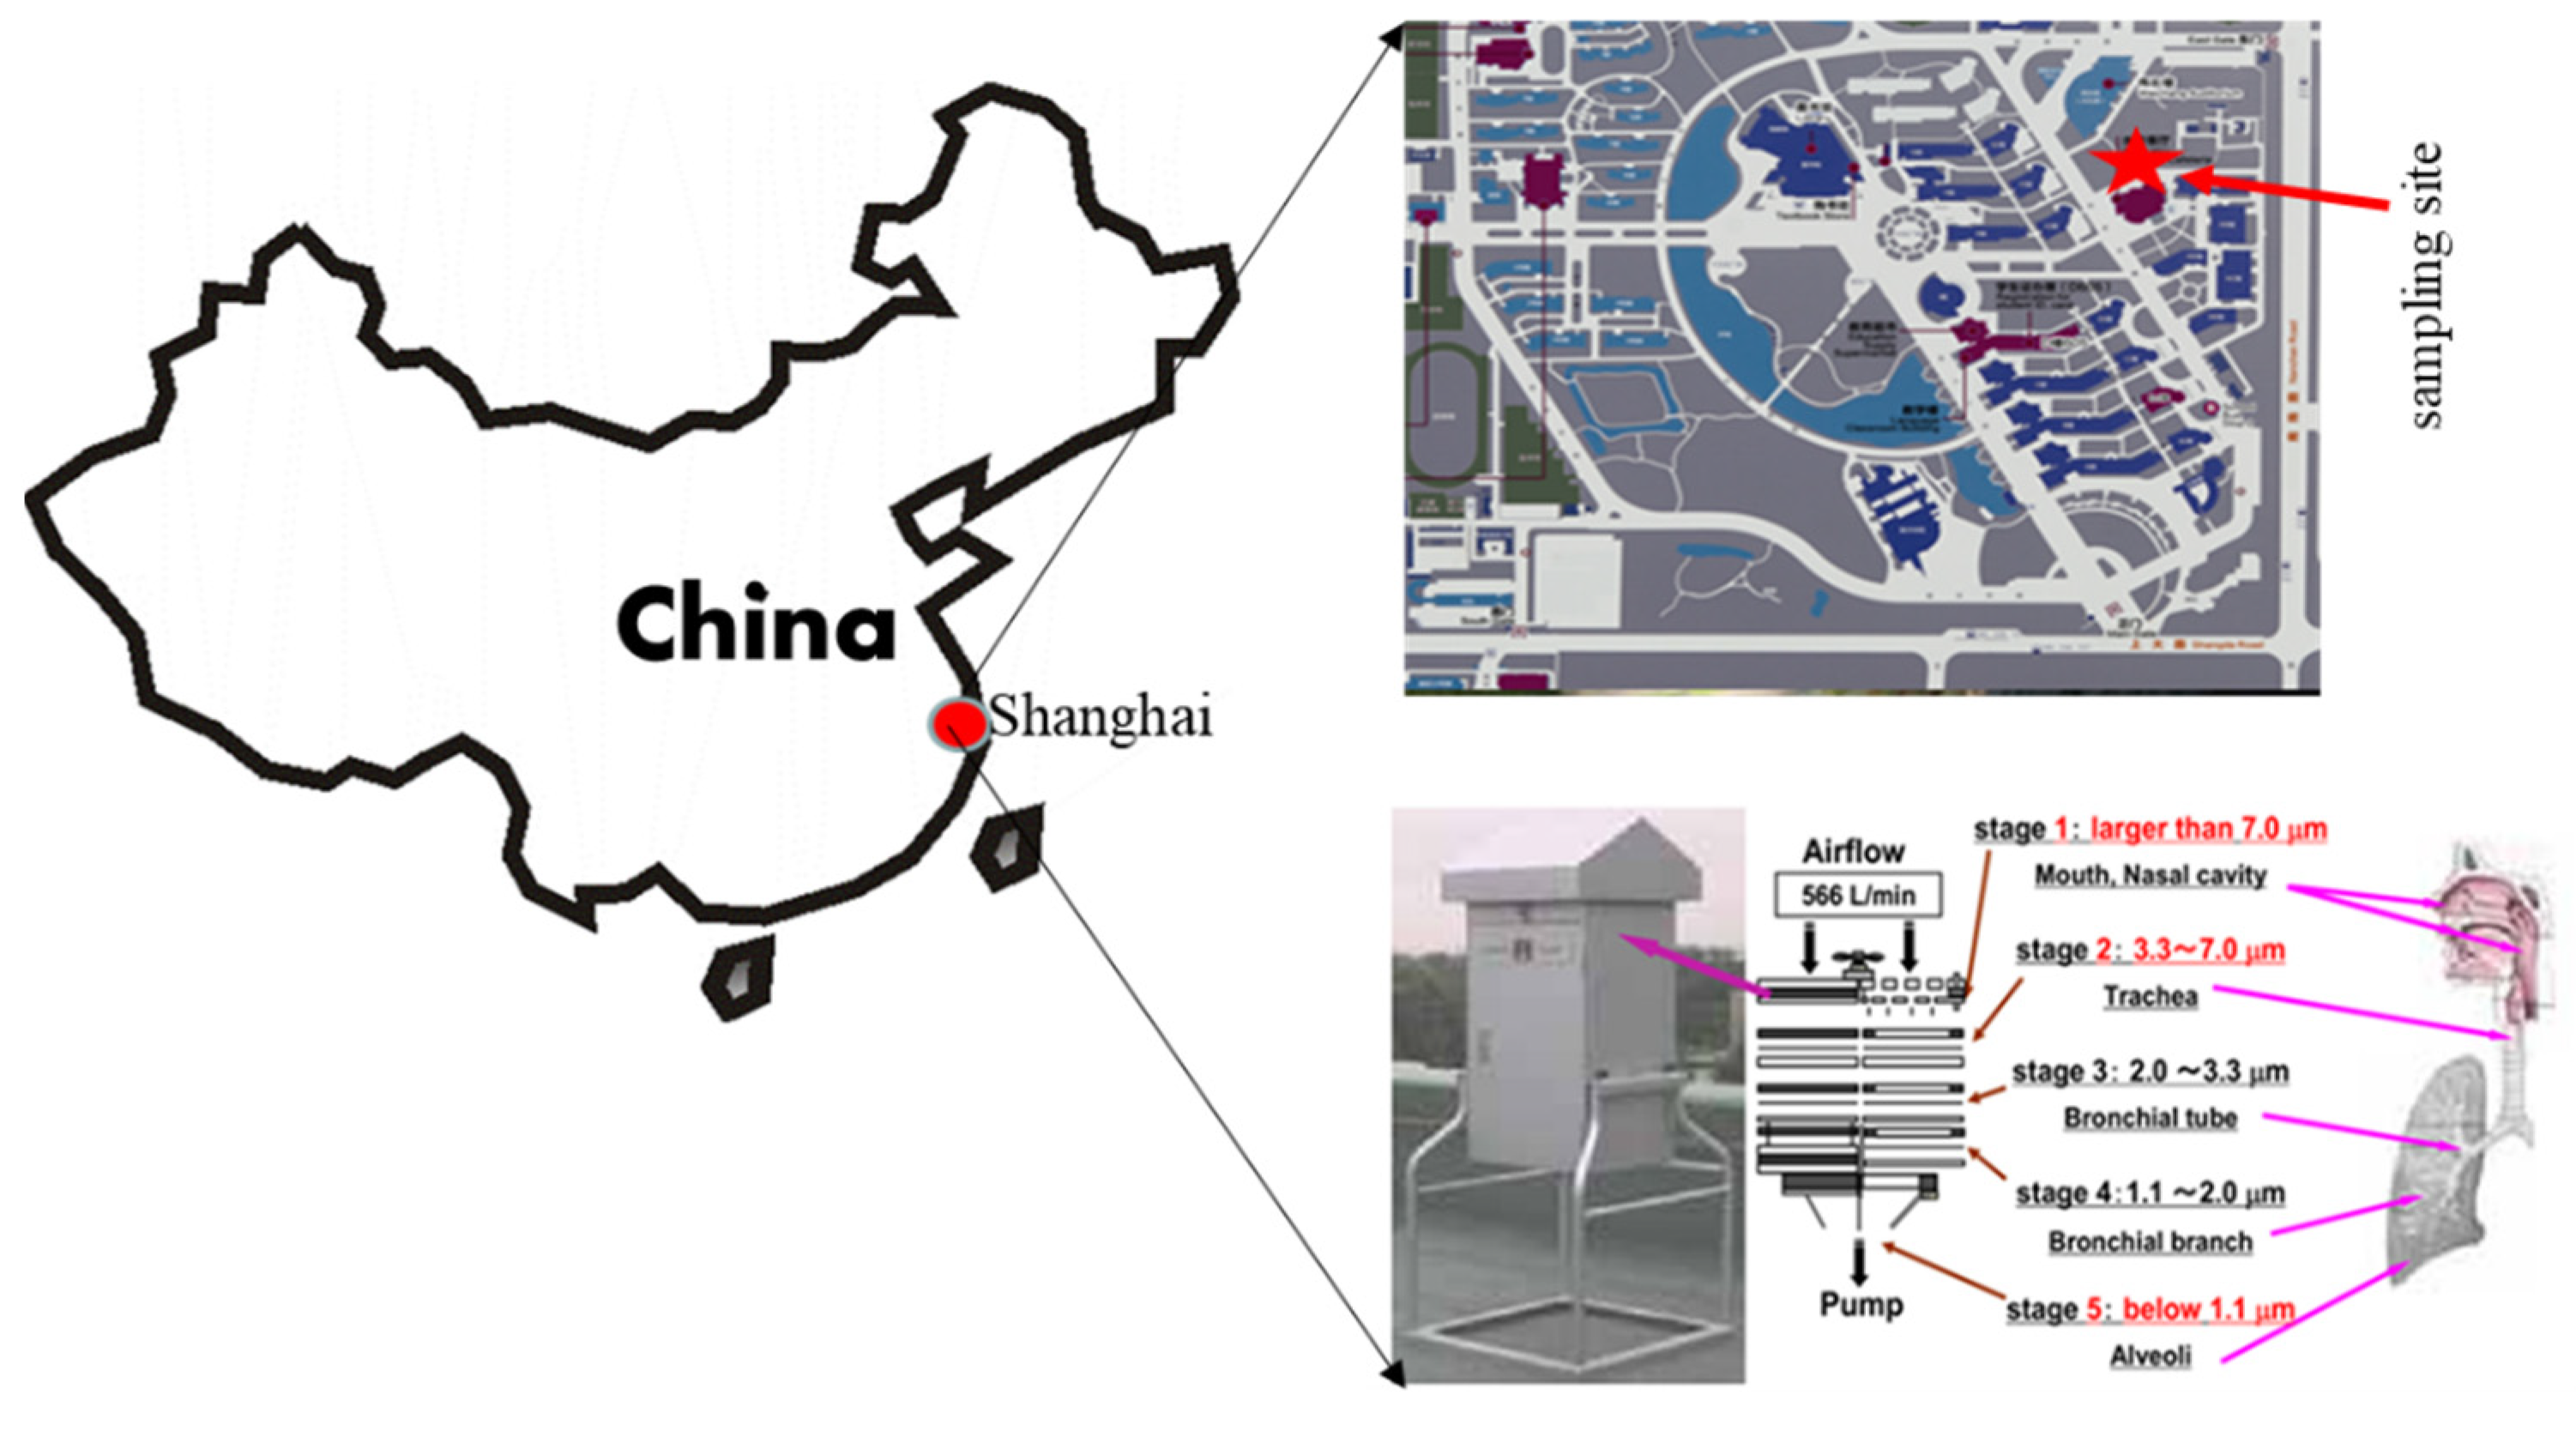
Figure 1. Sampling site.
Atmosphere 13 01541 g001
Figure 2. Mass concentration of total protein and Pla a3 from 21 March to 26 April 2017. (Total protein in the PM with size range 3.3–7.0 μm vs. <1.1 μm, 2.0–3.3 μm vs. <1.1 μm, and 1.1–2.0 μm vs. <1.1 μm; n = 5, ### p < 0.001; Pla a3 in the PM with size range >7 μm vs. 3.3–7.0 μm; >7 μm vs. 2.0–3.3 μm; >7 μm vs. 1.1–2.0 μm; >7 μm vs. <1.1 μm, n = 5, *** p < 0.001).
Atmosphere 13 01541 g002
Figure 3. Mass concentration of crustal elements in the size-resolved particles.
Atmosphere 13 01541 g003
Figure 4. Mass concentration of anthropogenic elements in the size-resolved particles.
Atmosphere 13 01541 g004
Table 1. Correlation coefficients between average mass level of chemical elements and mass concentration of Pla a3.
≤1.1 μm1.1–2.0 μm2.0–3.3 μm3.3–7.0 μm≥7.0 μmR2
Na114.19 ± 71.9377.73 ± 30.6390.83 ± 27.31198.25 ± 51.87352.47 ± 113.710.73
Mg31.93 ± 23.5327.64 ± 13.9556.74 ± 29.73145.30 ± 73.33349.77 ± 170.820.83
Al134.51 ± 94.57130.26 ± 87.44147.77 ± 99.71456.99 ± 264.231126.22 ± 659.510.84
K243.73 ± 105.770.11 ± 0.33128.38 ± 188.83138.20 ± 75.96332.59 ± 181.870.32
Ca33.07 ± 22.6120.11 ± 9.8739.46 ± 20.25119.78 ± 63.72374.67 ± 191.160.87
Fe238.83 ± 74.72162.59 ± 92.10203.79 ± 79.62458.20 ± 213.901073.32 ± 480.320.82
V8.60 ± 6.211.44 ± 0.990.82 ± 0.371.14 ± 0.342.31 ± 0.980.09
Cr12.33 ± 9.554.44 ± 3.173.47 ± 2.065.29 ± 2.9815.73 ± 10.630.37
Mn16.99 ± 5.3210.14 ± 3.546.58 ± 2.3610.73 ± 5.0425.23 ± 11.030.54
Co0.31 ± 0.190.19 ± 0.280.09 ± 0.050.21 ± 0.110.53 ± 0.250.60
Ni15.88 ± 6.7410.10 ± 13.436.85 ± 9.023.81 ± 2.998.06 ± 4.270.06
Cu7.71 ± 5.764.66 ± 3.014.69 ± 3.365.76 ± 3.3211.58 ± 5.090.61
Zn57.53 ± 19.747.41 ± 16.8233.21 ± 15.7326.86 ± 10.1042.97 ± 17.220.01
As2.15 ± 1.080.90 ± 0.540.59 ± 0.330.47 ± 0.240.57 ± 0.270.21
Se2.04 ± 0.890.75 ± 0.370.34 ± 0.160.17 ± 0.070.10 ± 0.050.30
Rb0.77 ± 0.440.33 ± 0.190.34 ± 0.190.69 ± 0.411.67 ± 0.970.69
Sr0.99 ± 0.772.25 ± 4.741.43 ± 0.743.62 ± 1.939.75 ± 5.300.91
Cd0.51 ± 0.280.17 ± 0.120.14 ± 0.100.07 ± 0.060.07 ± 0.050.92
Cs0.10 ± 0.060.05 ± 0.030.04 ± 0.020.06 ± 0.040.13 ± 0.070.25
Ba4.12 ± 2.282.77 ± 1.504.78 ± 2.2710.36 ± 5.5224.16 ± 12.850.82
Pb25.07 ± 13.635.30 ± 3.085.57 ± 3.134.04 ± 2.577.44 ± 4.820.11
Pla a30.41 ± 0.282.06 ± 1.041.84 ± 1.171.30 ± 0.667.46 ± 2.23
Publisher’s Note: MDPI stays neutral with regard to jurisdictional claims in published maps and institutional affiliations.