Abstract
Ground-based microwave radiometers (MWRPS) can provide continuous atmospheric temperature and relative humidity profiles for a weather prediction model. We investigated the impact of assimilation of ground-based microwave radiometers based on the rapid-refresh multiscale analysis and prediction system-short term (RMAPS-ST). In this study, five MWRP-retrieved profiles were assimilated for the precipitation enhancement that occurred in Beijing on 21 May 2020. To evaluate the influence of their assimilation, two experiments with and without the MWRPS assimilation were set. Compared to the control experiment, which only assimilated conventional observations and radar data, the MWRPS experiment, which assimilated conventional observations, the ground-based microwave radiometer profiles and the radar data, had a positive impact on the forecasts of the RMAPS-ST. The results show that in comparison with the control test, the MWRPS experiment reproduced the heat island phenomenon in the observation better. The MWRPS assimilation reduced the bias and RMSE of two-meter temperature and two-meter specific humidity forecasting in the 0–12 h of the forecast range. Furthermore, assimilating the MWRPS improved both the distribution and the intensity of the hourly rainfall forecast, as compared with that of the control experiment, with observations that predicted the process of the precipitation enhancement in the urban area of Beijing.
1. Introduction
The temporal variation and spatial distribution of meteorological elements represent the state of the atmosphere in the troposphere, and the vertical distribution and variation of meteorological elements are very important for simulating and predicting atmospheric movement in numerical weather prediction models, as the World Meteorological Organization guidance for numerical weather prediction applications has highlighted. Although satellites can provide data in the upper troposphere, it is particularly difficult to observe the lower few kilometers of the atmosphere due to poor sampling [1]. Compared to satellites, radiosondes have a better vertical resolution on atmospheric profiles [2,3]. However, they cannot provide continuous monitoring data since their data are usually available at an interval of 12 h [4]. A ground-based microwave radiometer is a meteorological observation instrument using remote sensing technology. Its secondary products can detect temperature profile, humidity profile, and other elements [5,6,7,8], and can conduct continuous observation of vertical changes of meteorological elements within a certain precision range. It can provide high time resolution information of the atmospheric motion state, close the observational gap in the lower troposphere, and help to improve the ability and accuracy of weather forecasts. The profiling capability of the ground-based microwave radiometer has proven to be valuable in the lower troposphere.
Researchers have paid great attention to the performance of the microwave radiometer and how to widely use it in operational systems. Its products have been widely used in many fields such as air pollution monitoring, site climate analysis, and water vapor analysis [9,10,11,12]. At the same time, the ground-based microwave radiometer can provide a continuous, high-resolution, and stable observation of temperature and humidity profiles, which can effectively make up for the shortage of atmospheric information obtained by conventional sounding due to the long observation interval, and it can better meet the observation requirements of high-resolution NWP systems [12]. However, unlike radar and GPSZTD data, which have even become operational at some national weather centers, the assimilation of ground-based microwave radiometers to numerical models is still in its infancy [13,14,15,16,17].
For example, assimilating the temperature and humidity profile from a single MWR station showed better a forecast of winter fog using the Fifth-Generation Pennsylvania State University/National Center for Atmospheric Research Mesoscale Model [18,19]. A winter storm case was simulated by an observing system simulation experiment assimilating simulated MWRs, which demonstrated that the impact was positive on the temperature and humidity forecast [20,21]. The mesoscale prediction system Arome-WMed was used to assimilate the profiles retrieved by multiple ground-based microwave radiometers, and the results showed that the skill of the precipitation forecast was improved slightly [12]. The Weather Research and Forecasting (WRF) model was used to assimilate MWR temperature and humidity profiles for simulating a rainstorm event that occurred in Beijing, China, and the results showed that the assimilation of MWR data had a positive impact on the distribution and intensity of rainfall [16]. The rapid-refresh multiscale analysis and prediction system-short term (RMAPS-ST) was used to assimilate MWRPS temperature and relative humidity profiles in Beijing for a precipitation bifurcation case, the results showed that the assimilation of MWRPS improved the precipitation forecast in terms of distribution and the intensity [17].
Previous studies have all shown the promising impacts of assimilating ground-based microwave radiometers into the numerical model, though the results show different impacts on forecasts. However, the assimilating of ground-based microwave radiometer data to the regional operational forecast over North China is rare. In particular, the urban heat island effect, coupled with other factors, increases the difficulty and uncertainty of precipitation forecast accuracy in Beijing. Reproducing observed urban effects can help increase precipitation forecast accuracy in Beijing. Therefore, weather forecasting can provide better information to meet the public demand, especially in the urban area of Beijing [22,23].
In this study, five temperature and humidity profiles, retrieved by ground-based microwave radiometers, were assimilated into the rapid-refresh multi-scale analysis and prediction system-short term (RMAPS-ST). We evaluated the impact of the ground-based microwave radiometer data on the analyses and forecasts of a case of heavy rainfall in Beijing. Two assimilation experiments were carried out in this study. Combined with comparative analysis, we explored the impact of ground-based microwave radiometer data on the precipitation forecast in Beijing. In this study, we aimed to improve urban weather forecast in North China, while providing better information to help the public with their daily activities.
The outline of this article is as follows. Section 2 presents the data and methods used in the study, including the characteristics of ground-based microwave radiometer data and the experimental setting. In Section 3, the impact of assimilated ground-based microwave radiometer data on both the prediction of radar composite reflectivity and hourly rainfall evolution are compared for the control and MWRPS experiments. Section 4 discusses the diagnosis for this heavy rainfall event with and without the data assimilation of the ground-based microwave radiometers. Finally, Section 5 summarizes the conclusions.
2. Data and Methods
2.1. The Heavy Precipitation Case
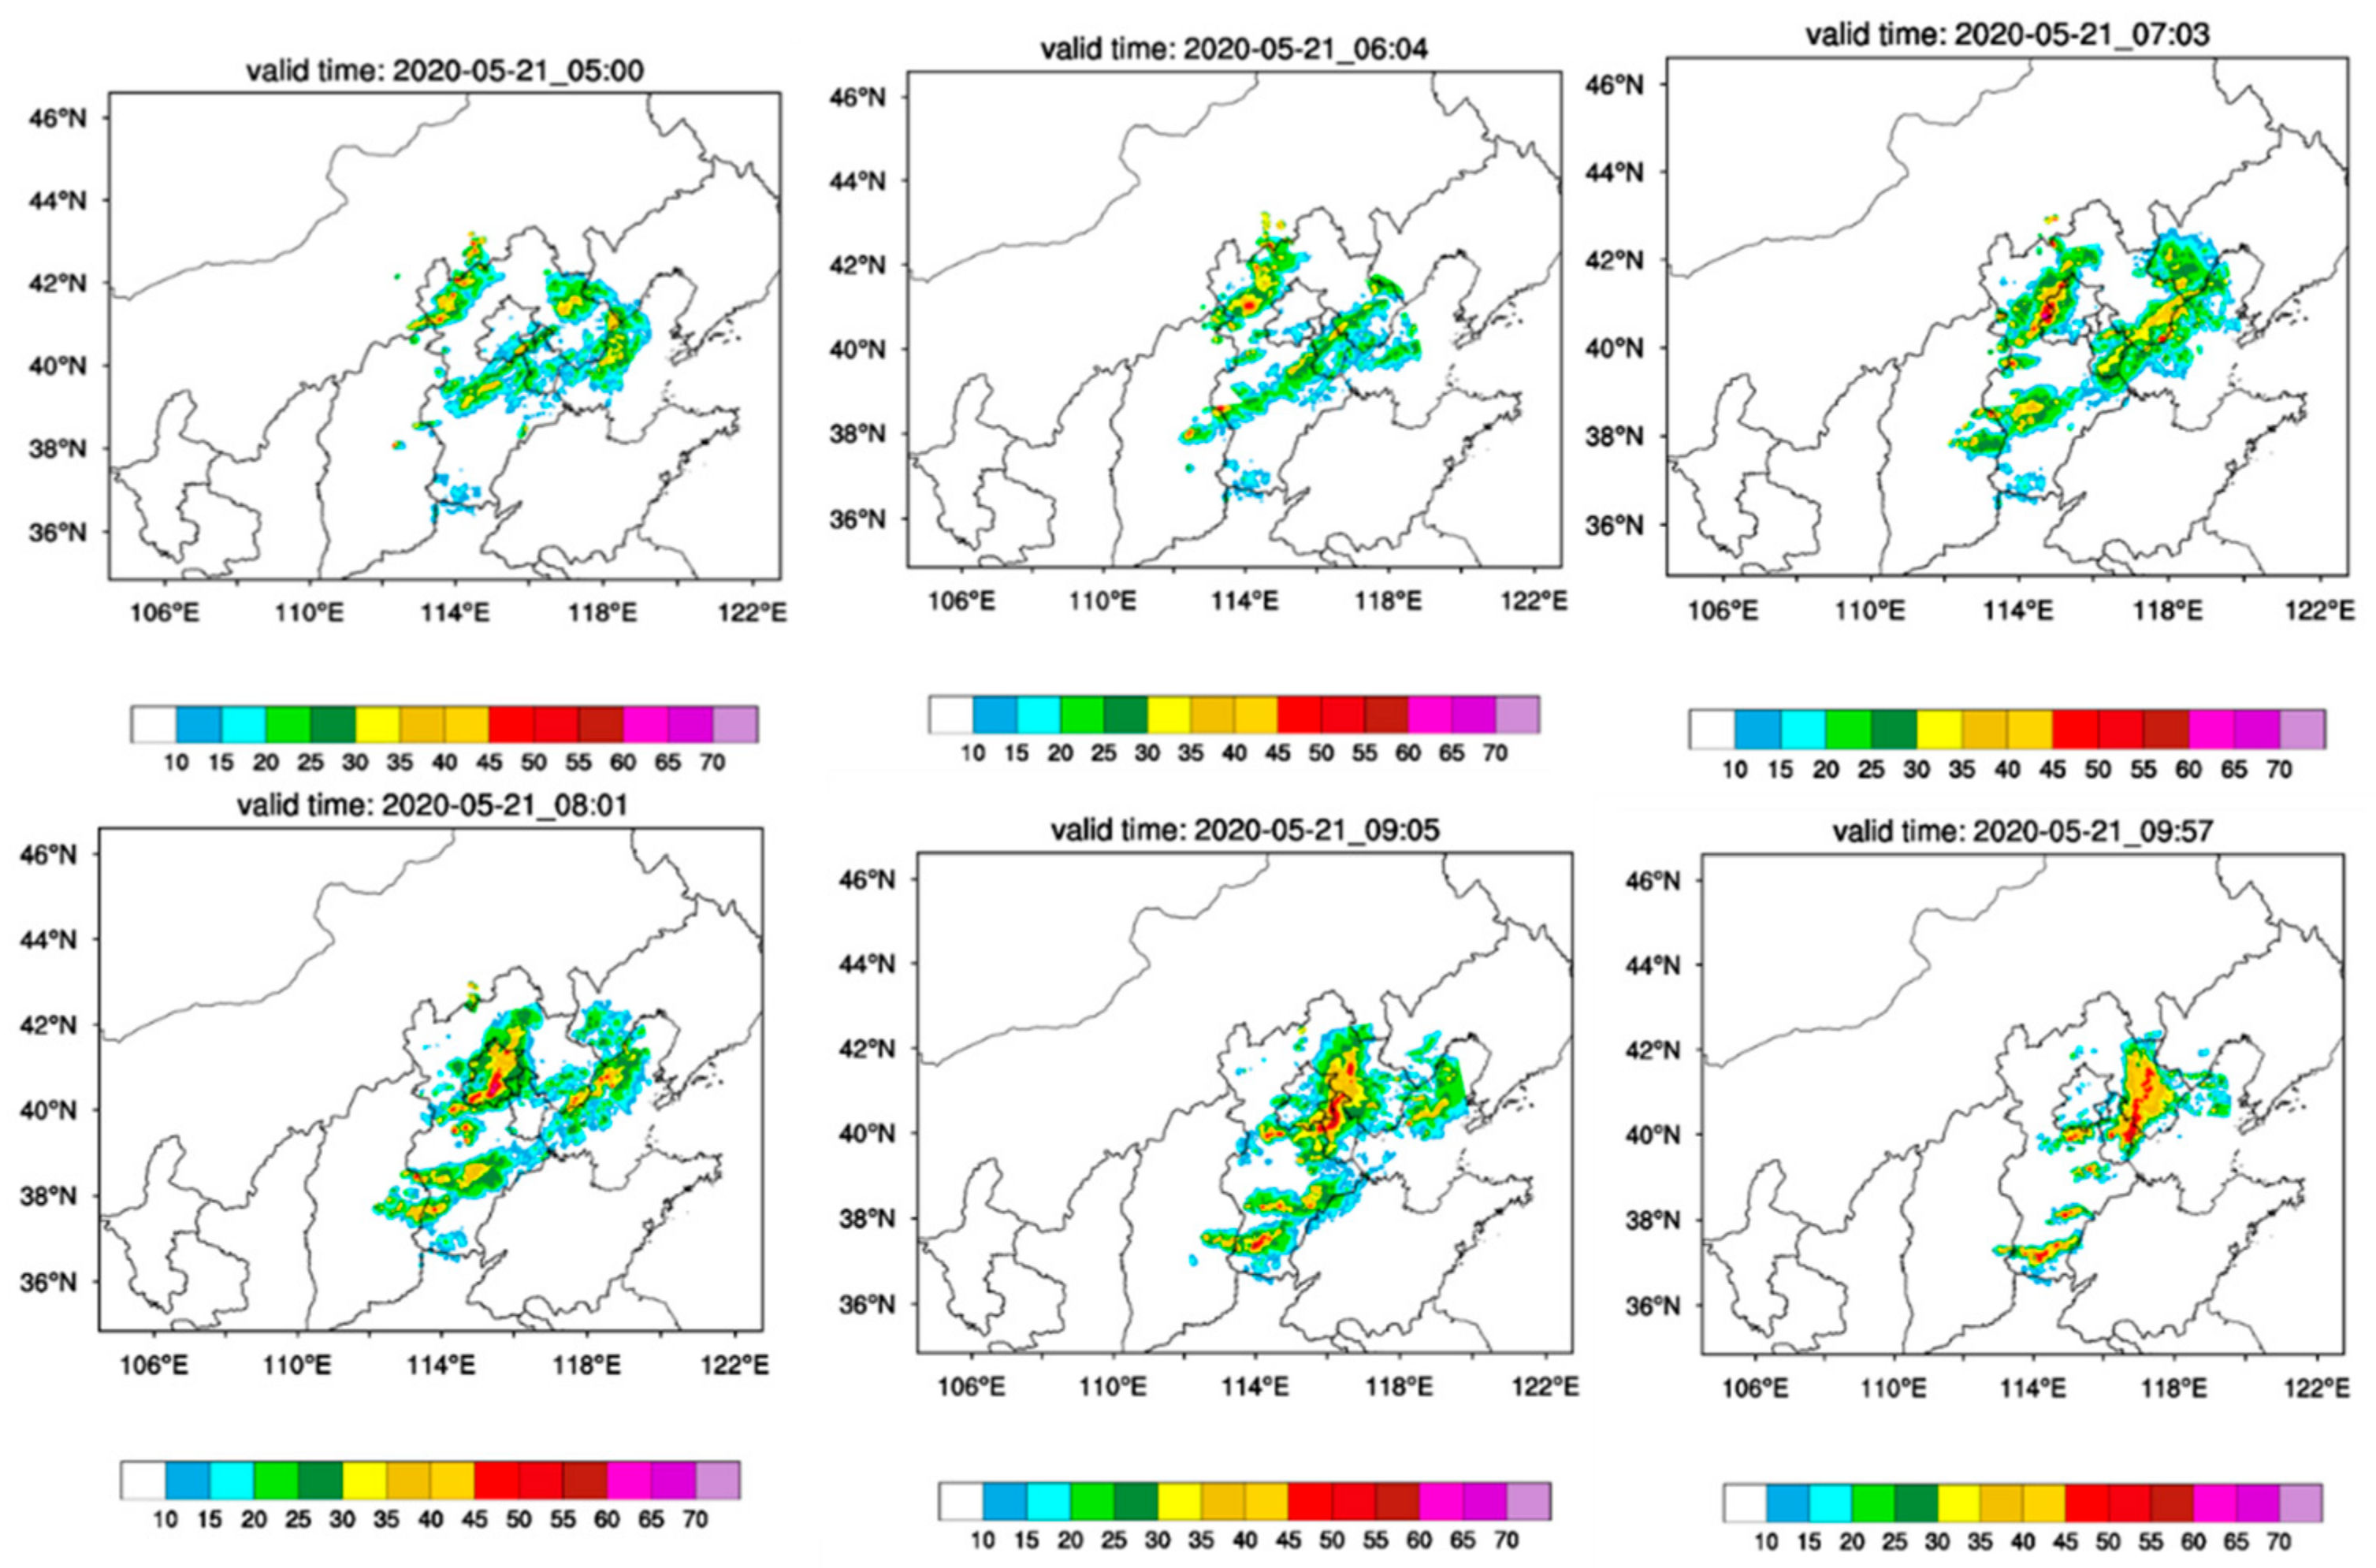
In the present study, we took the heavy rainfall process in Beijing on 21 May 2020 as an example to investigate whether the assimilation of ground-based microwave radiometer data could improve the precipitation forecast. The evolution of the radar echo in this process is shown in Figure 1. The observation shows that there are two echo bands and that the echo that affected this precipitation process in Beijing moved from the northwest to the southeast at 0500 UTC (Coordinated Universal Time) on 21 May 2020; the belt-shaped echo emerged in Inner Mongolia, followed by convection. The strong echo belt moved rapidly to the southeast, reaching Beijing at 0700 UTC, and strengthening at 0800 UTC when it approached the urban area of Beijing. Within the urban area, the echo strengthened. The echo continued to move outside of Beijing at 1000 UTC.
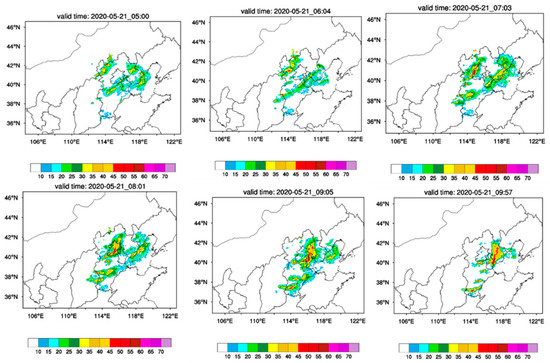
Figure 1.
Radar composite reflectivity (CREF) evolution for 05 UTC–10 UTC on 21 May 2020.
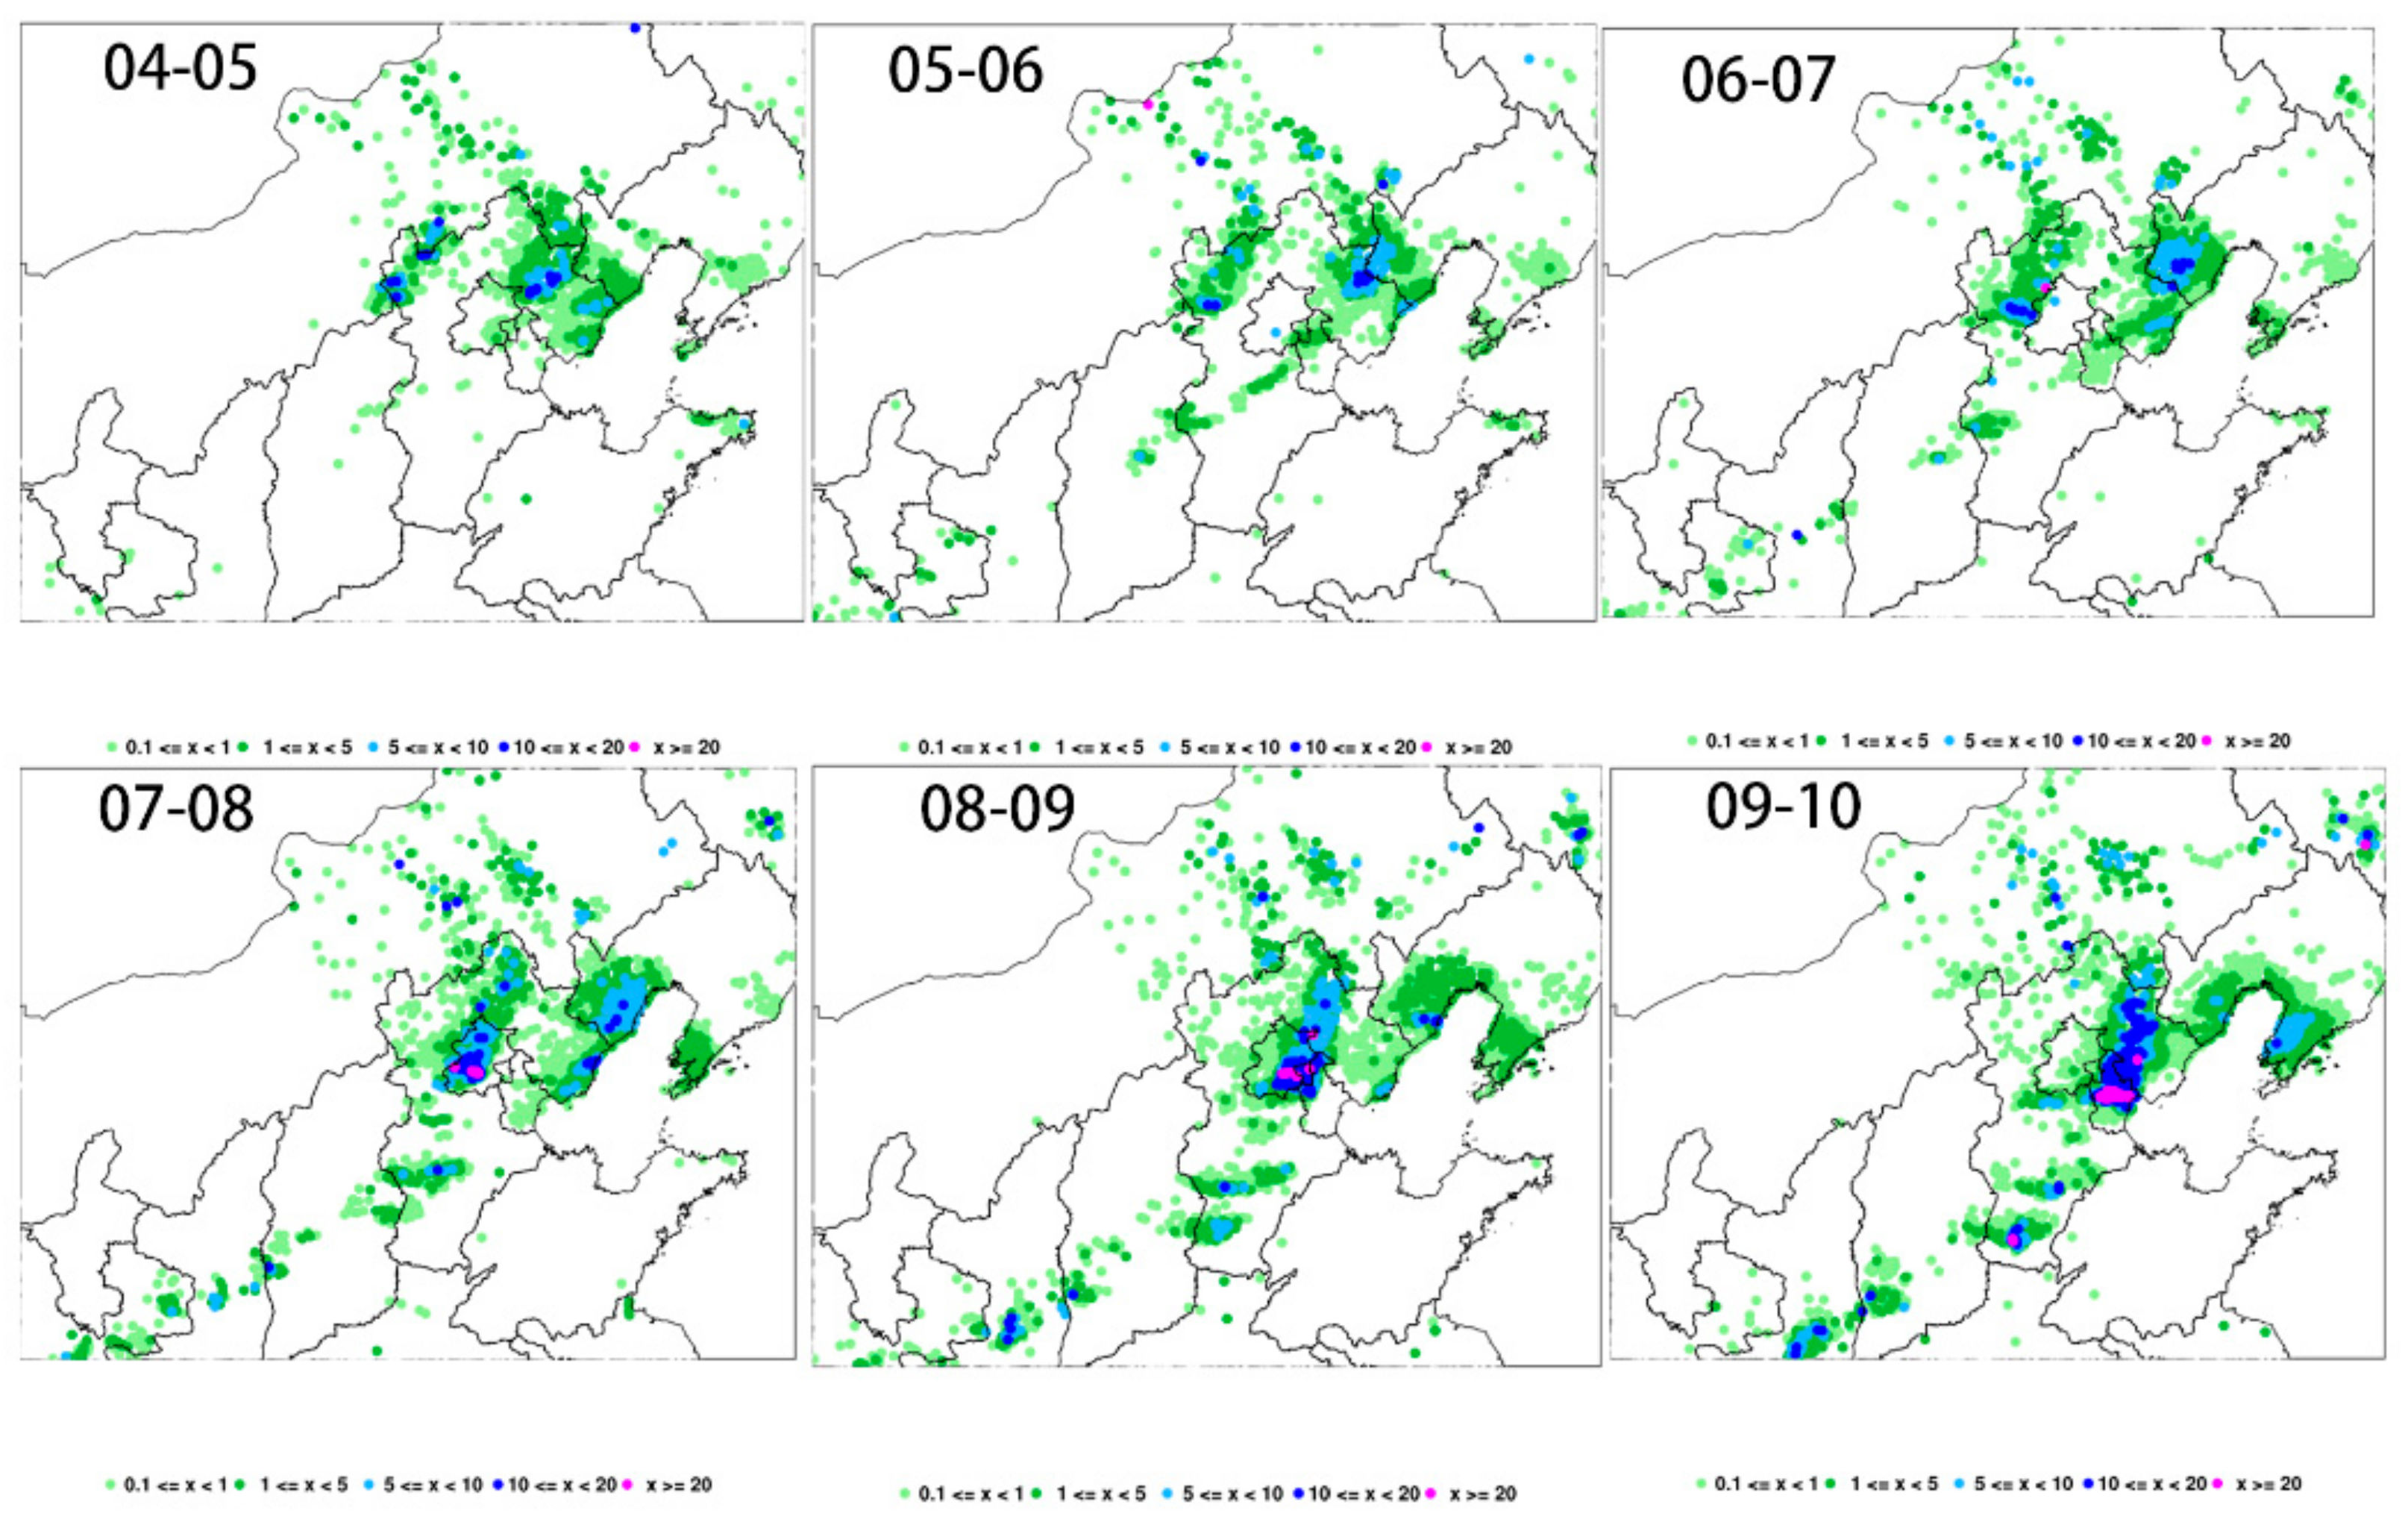
For the echo band that affected this precipitation process in Beijing, a northeast and southwest belt-shaped rainfall emerged in Inner Mongolia at 0400 UTC on 21 May 2020. It is shown that the observed precipitation first occurred in the western mountainous area of Beijing at 0700 UTC with the echo moving from northwest to southeast, and then expanding eastward. By 0800 UTC, the precipitation system had reached the urban area of Beijing, and the rainfall intensity exceeded 20 mm/1 h (Figure 2). The heavy rainfall center moved eastward to Tianjin after 0900 UTC, when the echo moved outside of Beijing. The weather process was characterized by the strengthened radar echo in the urban area of Beijing, during which heavy precipitation occurred in the urban area of Beijing as it moved from the northwest to the southeast (Figure 1 and Figure 2).
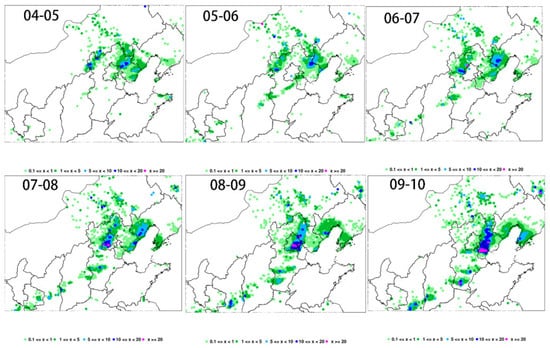
Figure 2.
The evolution of hourly accumulated precipitation from AWS observation from 0500 UTC to 1000 UTC on 21 May 2020 in North China.
2.2. Microwave Radiometer Observations
In the metropolitan observation experiments, seven microwave radiometers were deployed in Beijing. Two microwave radiometers in the southern suburbs and in Shangdianzi Village were lost due to equipment problems, while the remaining five microwave radiometers deployed in Xiayunling Village, Yanqing District, Haidian District, Huairou District, and Pinggu District were available. The level-2 products from the five ground-based microwave radiometers in Beijing were obtained using inversion software from the microwave radiometer manufacturers, including the temperature and relative humidity profiles. The continuous observations of the temperature and humidity profiles used a high temporal resolution, at a high frequency rate up to two minutes.
Figure 3 shows the vertical distribution of retrieved temperature and humidity profiles at five stations, as well as their evolutions over time. It reveals that microwave radiometers overcome the spatial and temporal shortcomings of conventional observation in temporal resolution. Prior to the three-dimension variation assimilation, the temperature profile and relative humidity profile retrieved by microwave radiometers at heights of 0–10 km are processed. Since precipitation has a great impact on the temperature and relative humidity retrieved by the microwave radiometer, the observed data from the radiometer during precipitation should be prudently dealt with. In this study, we set the data at the corresponding time of precipitation as a missing value. In addition, since the temperature and humidity profiles retrieved by microwave radiometers have high vertical resolutions at heights of 0–10 km, the reference atmospheric pressure at each height layer from 0 to 10 km is calculated according to Zhang et al. (2006) [24].
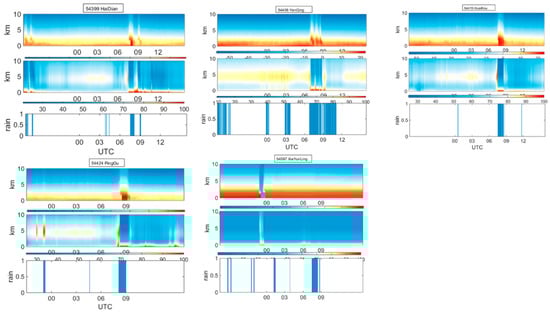
Figure 3.
Time series of temperature and humidity profiles retrieved from five ground-based microwave radiometers and the prediction of rain at corresponding times on 21 May 2020. The blue bar indicates the time of precipitation in the MWRPS observations. Altitudes are given in kilometers above ground level.
2.3. Experiment Design
In this study, the experiment was carried out using the RMAPS-ST numerical forecast model, which is a short-term forecasting subsystem of a new generation of RMAPS developed by the Institute of Urban Meteorology, CMA, Beijing. It is based on the previous generation of the North China rapid-refresh cyclic assimilation and forecast system and has been in operation since May 2017 [17,25,26,27,28]. The RMAPS-ST features double nesting, a nine-kilometer-resolution outermost D01 area with 649 × 500 grid points covering the whole of China, and a three-kilometer-resolution inner D02 area with the innermost 550 × 424 grid points in the simulated area covering North China. The parameterized schemes of the main physical process of the experiment included a new Thompson cloud microphysics scheme, a Noah land surface scheme, a Yonsei University (YSU) boundary layer scheme [29], the global parameterization of the Rapid Radiative Transfer Model (RRTMG) scheme, and short wave and long wave radiation schemes [30,31]. In this paper, ECMWF medium-range forecast (0.25° × 0.25°) was selected to provide the initial field and side boundary conditions for the model. The observed data, including the conventional data and radar data, underwent quality control before inputting into the assimilation system. The radar data assimilation was performed, including radial velocity and reflectivity. The Weather Research and Forecasting model system and the three-dimensional variational data assimilation system (3DVar) were used to assimilate observations due to low calculation cost, small resource occupation, and high efficiency. The solution of 3DVar can be interpreted as obtaining the minimization of the objective function. Based on the optimization theory, the optimal solution was obtained using an iterative descent algorithm. Specifically, the optimal state of the atmosphere was estimated by using both the background field and observed values, thus the statistical optimal analysis was obtained. When U and V are used as dynamic control variables, the correlation between variables is smaller than that when traditional flow function and potential function control variables are used, which satisfies the assumption of variational data assimilation. Such an algorithm is more conducive to the description of medium and small-scale systems [32]. Background error covariance was calculated by the National Meteorological Center (NMC) method [33].
The control experiment assimilated conventional observation data and Beijing–Tianjin–Hebei weather radar data. Data assimilated by the RMAPS-ST data assimilation system included observations from different types of conventional observations to improve the analysis. In Figure 4, the aircraft meteorological data relay, synoptic, sounding, oceanographic buoys, ship-based observations, and wind profile radar observations are shown. Radar data, including radial velocity and reflectivity, were mainly assimilated into Domain 2 of the RMAPS system. Based on the control experiment, the MWRPS experiment adds the data of five microwave radiometers in Beijing. The data distribution is shown in Figure 3. In the next section, we compare the forecast differences between the control experiment and the MWRPS experiment to verify the impact of MWRPS assimilation.
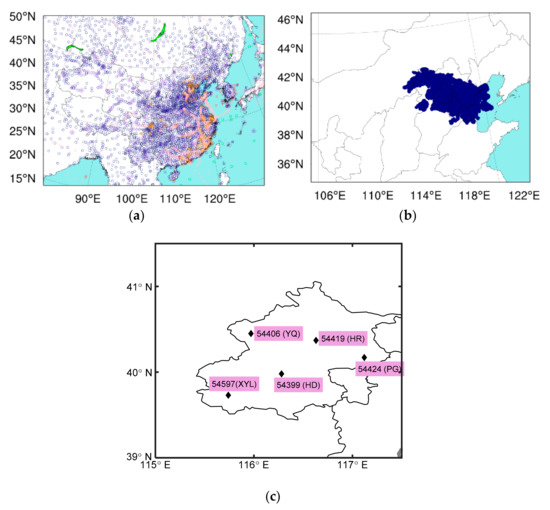
Figure 4.
(a) The distribution of radiosonde launch sites are shown as purple solid circles; oceanographic buoys, wind profile radar observations, and ship-based observations are shown as red circles, orange circles, and green circles; synoptic and aircraft meteorological data relay are shown as dark blue circles and pink circles in Domain 1 of RMAPS-ST. (b) The radar locations are represented as dark blue solid circles in Domain 2 of RMAPS-ST. (c) Locations of MWRPS sites are represented as black diamonds in Beijing.
3. Results
3.1. Impact of Ground-Based Microwave Radiometer Data Assimilation on the Rainfall Prediction
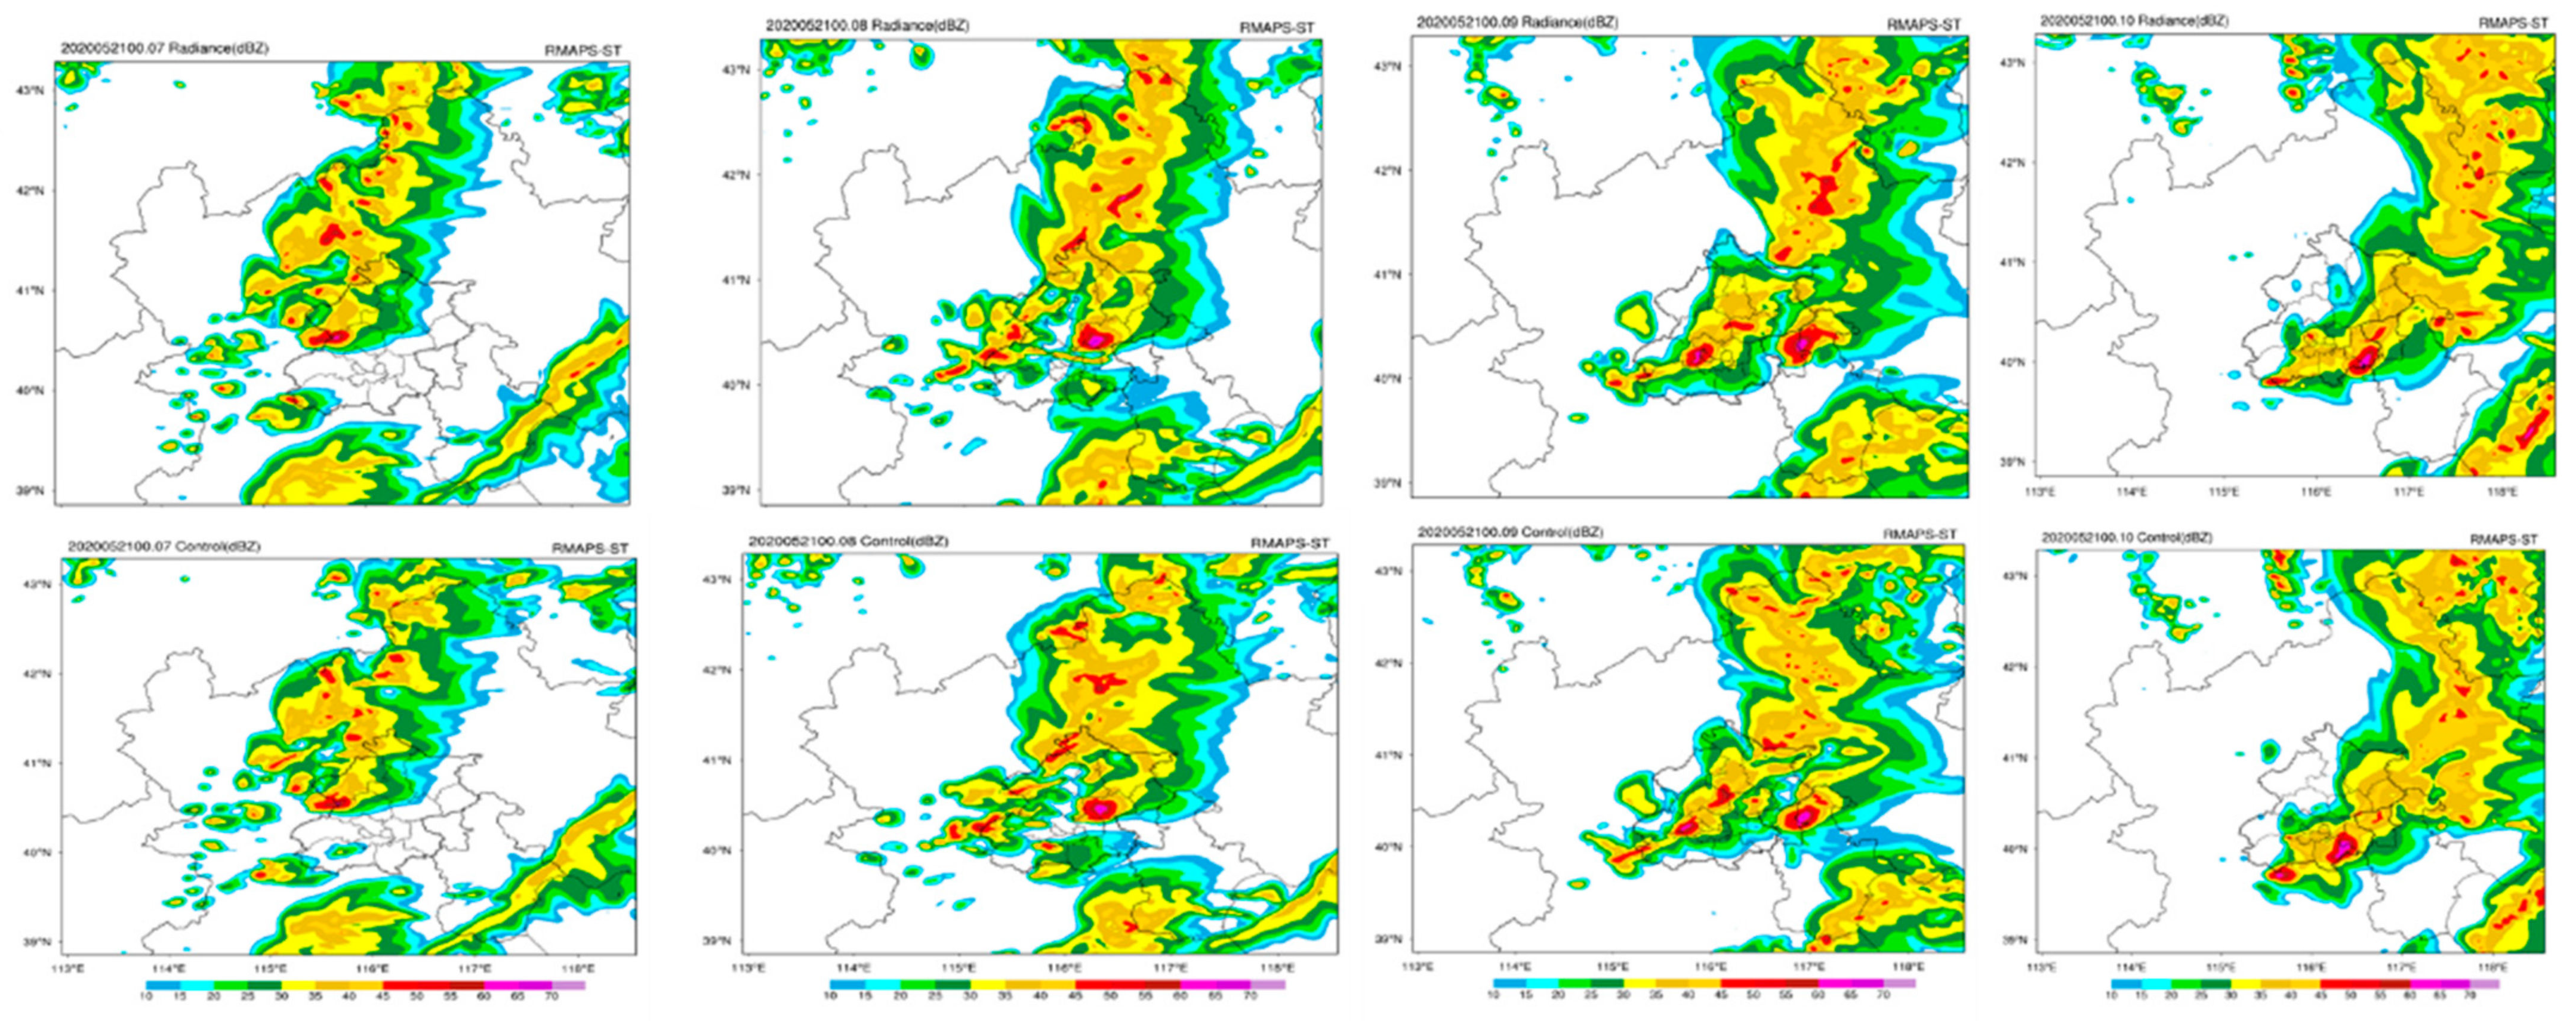
In this section, we compare the forecast results after assimilation. For the enhancement of the belt-shaped echo in the urban area of Beijing, the radar reflectivity simulations from the two experiments are compared during the period from 0700 UTC to 1000 UTC on 21 May 2020. Figure 5 shows the composite radar reflectivity simulated by the MWRPS and control experiments. The top side shows the MWRPS simulations, whereas the bottom side shows the control simulations.
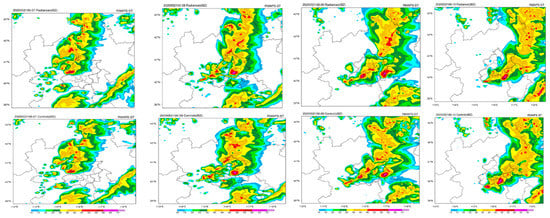
Figure 5.
Composite reflectivity during the period from 0700 UTC to 1000 UTC on 21 May 2020 simulated by MWRPS test and control test from top to bottom (Beijing-Tianjin-Hebei region shown).
The zone of the radar echo usually corresponds to the distribution of a convection cell, and the intensity of radar reflectivity corresponds to the intensity of a convection cell. Compared with the control experiment, the MWRPS experiment had better prediction ability for simulating the observed belt-shaped convection enhancement at 0800 UTC: the MWRPS experiment was able to produce better simulations in both the location and intensity of the convection cells when the system impacted on the urban area of Beijing. The MWRPS experiment was also better able to simulate the dissipation process of the band echo during eastward movement. It reproduced the location of the observed band echo better when it moved outside of Beijing at 1000 UTC, while the simulated band echo in the control experiment was still in Beijing at 1000 UTC (Figure 5).
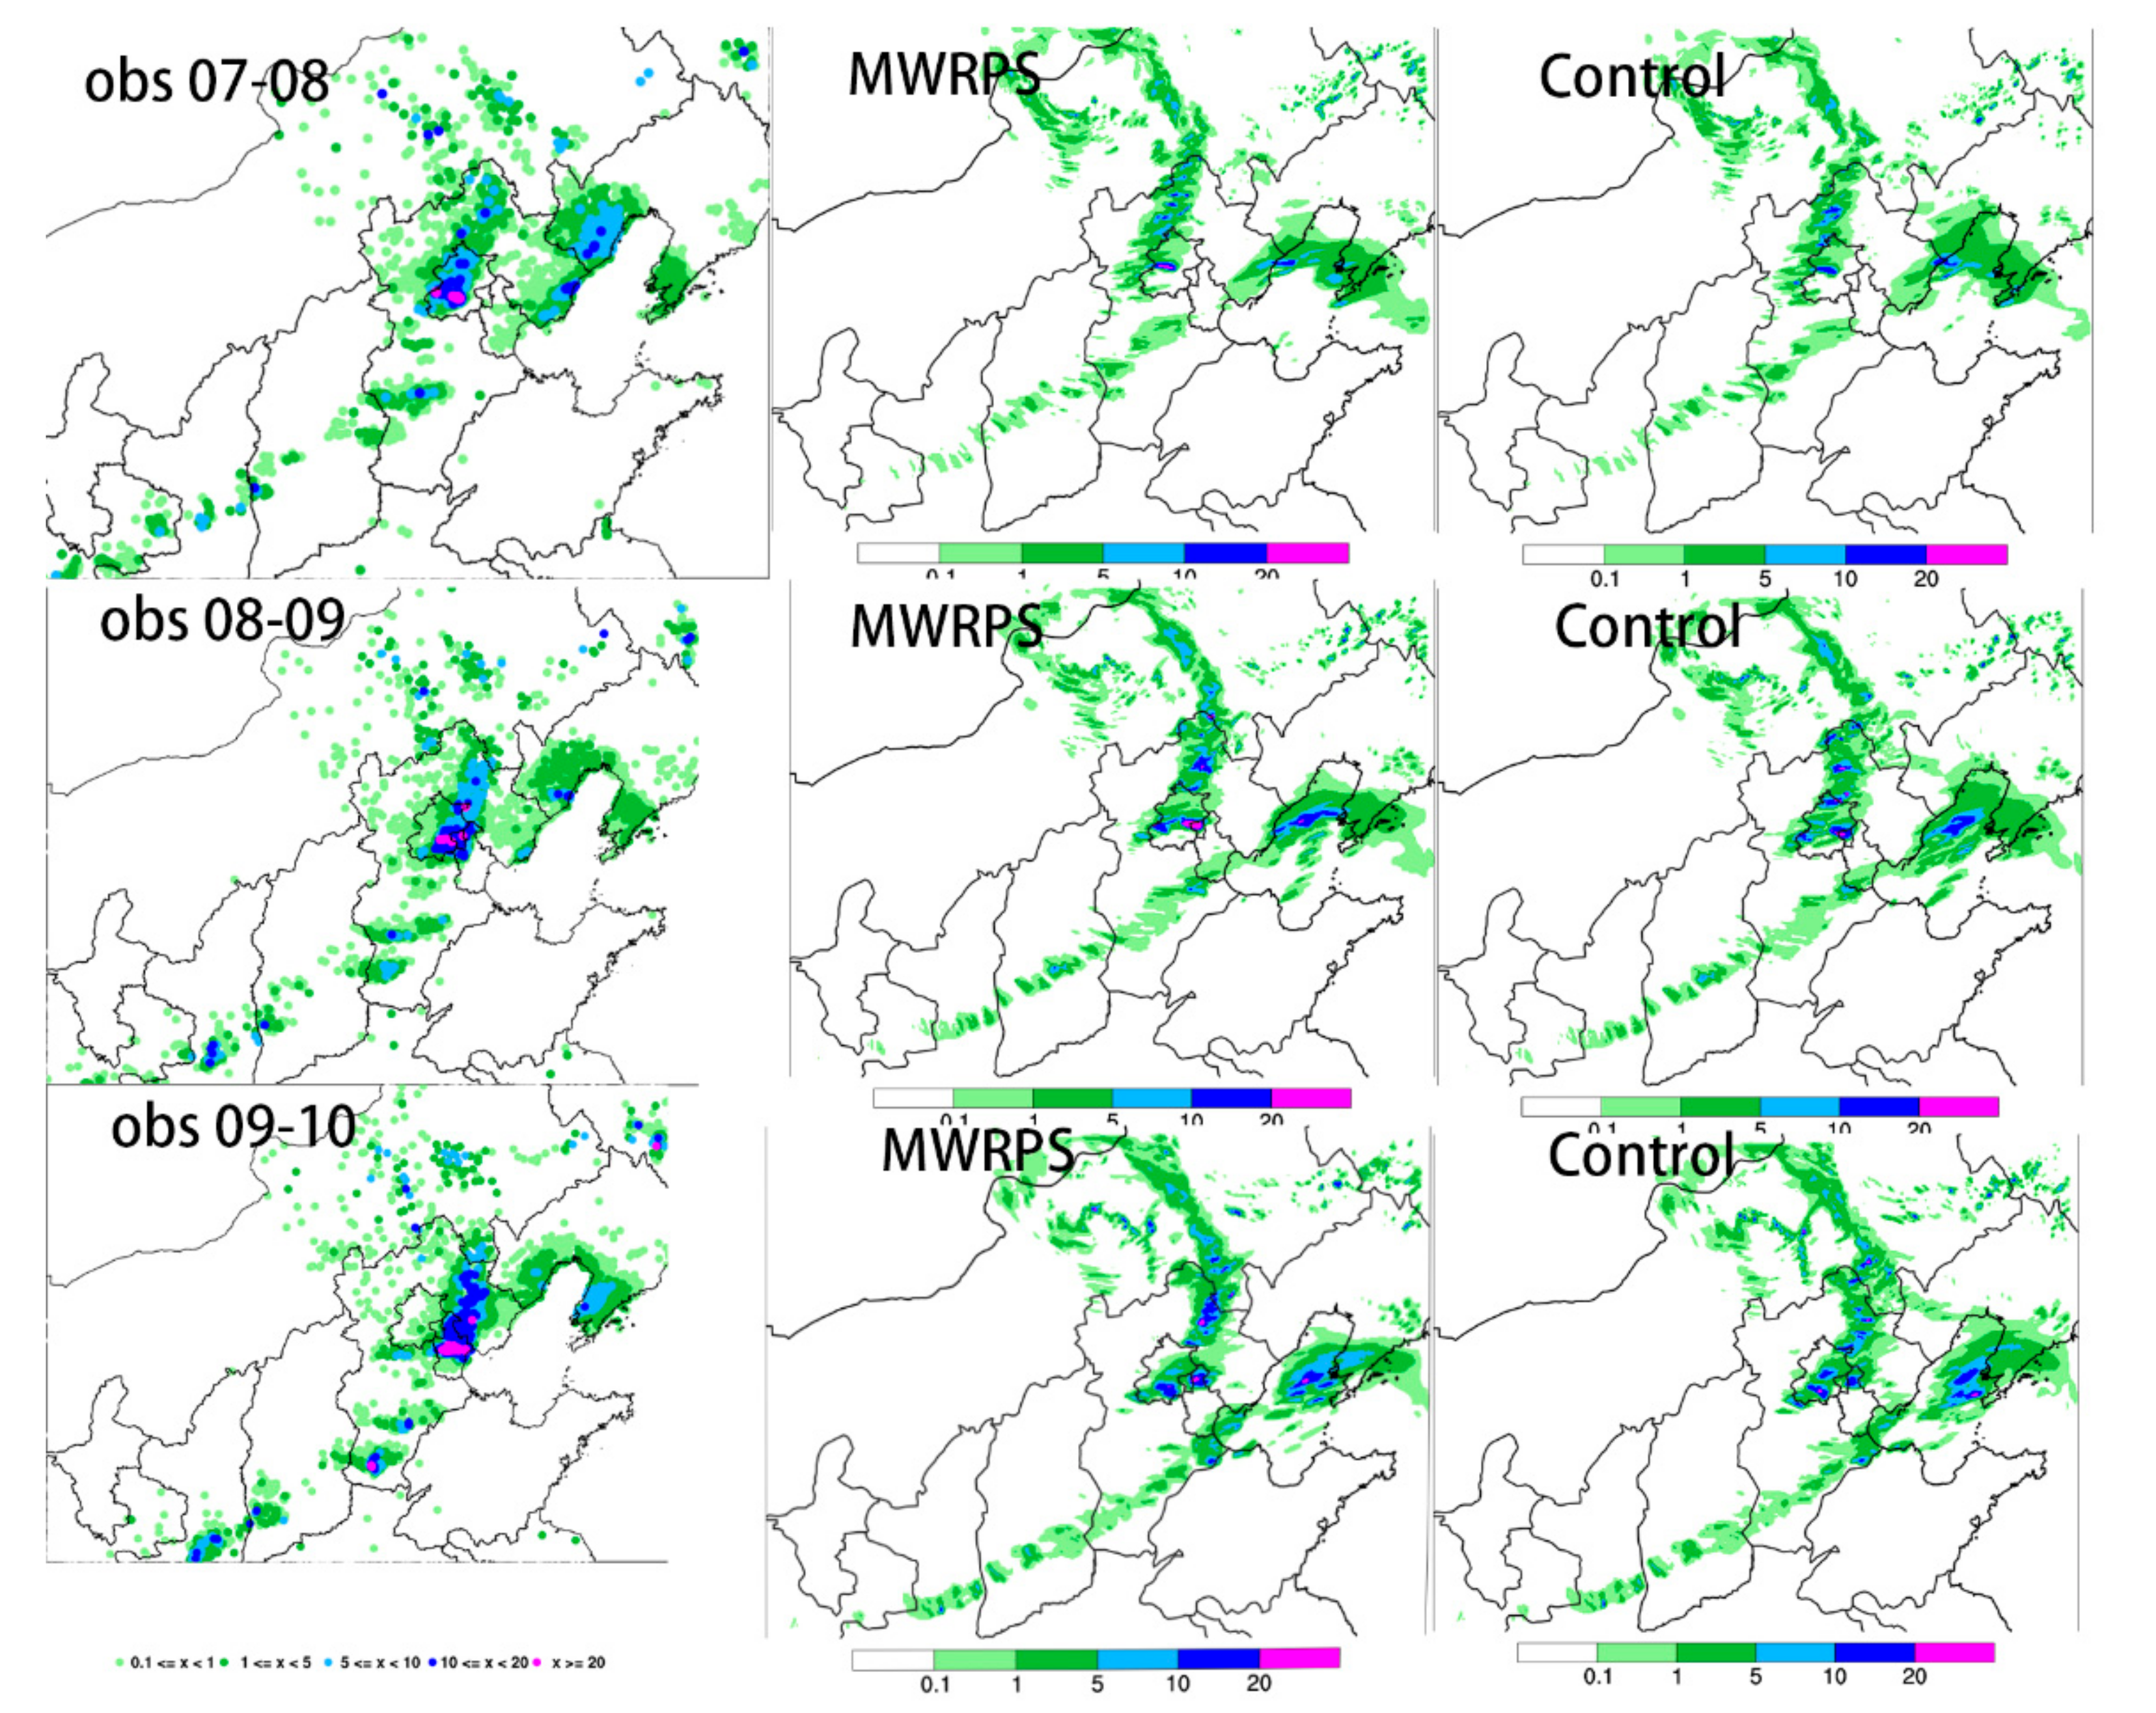
To examine the improvement in the precipitation forecast, the observed and forecasted 1 h accumulated precipitation in Domain 2 during 21 May 2020 are shown in Figure 6. The rain gauge observations from the ground stations are shown in the first column for evaluating the rainfall forecasts. The corresponding forecast results simulated by the MWRPS and control experiments are shown in the second column and the third column, respectively. Compared to the observations, there was a noticeable under-prediction for the precipitation in the control experiment in terms of both location and intensity at 0800 UTC. MWRPS forecasts improved the prediction for the corresponding precipitation intensity at the main center of the heavy rainfall, despite underestimating the range of precipitation. The precipitation intensities predicted by the MWRPS test are the same as the observations (>20 mm.h−1). The spatial patterns of the 1 h accumulated precipitation simulated by the MWRPS experiment agreed with the observations better than those in the control experiment at 0900 UTC, especially for the location of the heavy rainfall’s main center. The precipitation simulation in the control and MWRPS experiments are evaluated by TS (threat score) [34]. TS is the ratio of correct prediction times to the total number of events, representing the accuracy of the rainfall prediction. The numerical range is 0–1. The closer the TS value is to 1, the better the prediction is. The results showed that the assimilation of MWRPS provided an advantage in predicting rainfall, especially for larger precipitation events (>10 mm.h−1). At 1000 UTC, the main differences in heavy rainfall between the two experiments is the location of the heavy rainfall, the MWRPS test shows a result consistent with the observations: the center of the precipitation moved outside of Beijing. In contrast, the center of heavy rainfall, as simulated by the control test, was still in Beijing (Figure 6).
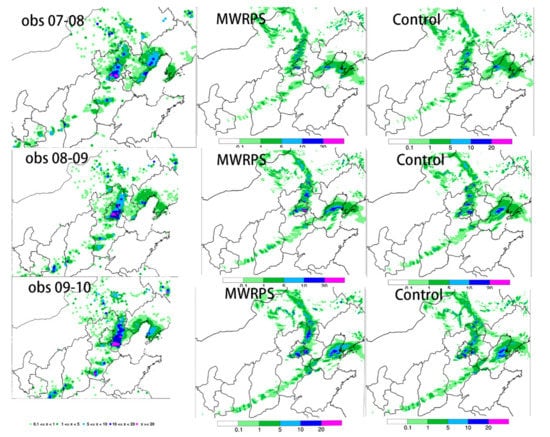
Figure 6.
One-hour accumulated precipitation during the periods 0700 UTC–0800 UTC, 0800 UTC–0900 UTC, and 0900 UTC–1000 UTC on 21 May, 2020: observation (left column), D02 forecasting in MWRPS experiment (middle column), and D02 forecasting in Control experiment (right column).
Overall, the composite reflectivity and the 1 h accumulated precipitation from the observations and the control and MWRPS experiments were compared. We found that the assimilation of ground-based microwave radiometers increased the scope of heavy rainfall in MWRPS, which better agreed with the observations in spatial distribution patterns, as compared to the control experiment.
3.2. Impact of Ground-Based Microwave Radiometer Data Assimilation on Meteorological Element Prediction before Urban Rainfall
The urbanization process was significant in the Beijing–Tianjin–Hebei megalopolis: due to the joint effects of topography and urban thermal circulation [35], precipitation in Beijing is unique and complex [36,37,38]. Previous studies have suggested that the intensity of the urban heat island before the rainfall began could project the thermodynamic impact of the underlying urban surface on the rainfall process. The heat island intensity prior to the start of the rainfall determines the kinds of urban effects which will impact on the rainfall. Under the effect of a strong heat island which precedes the rainfall, the precipitation is concentrated in urban areas since the thermal effect of the urban land surface prevails, increasing the intensity of the convective system after it has moved to the urban area. Under the effect of weak heat island, precipitation bifurcation takes place, meaning that precipitation is mainly distributed upwind of the city and on both sides of the city since urban dynamics prevails [35,39,40].
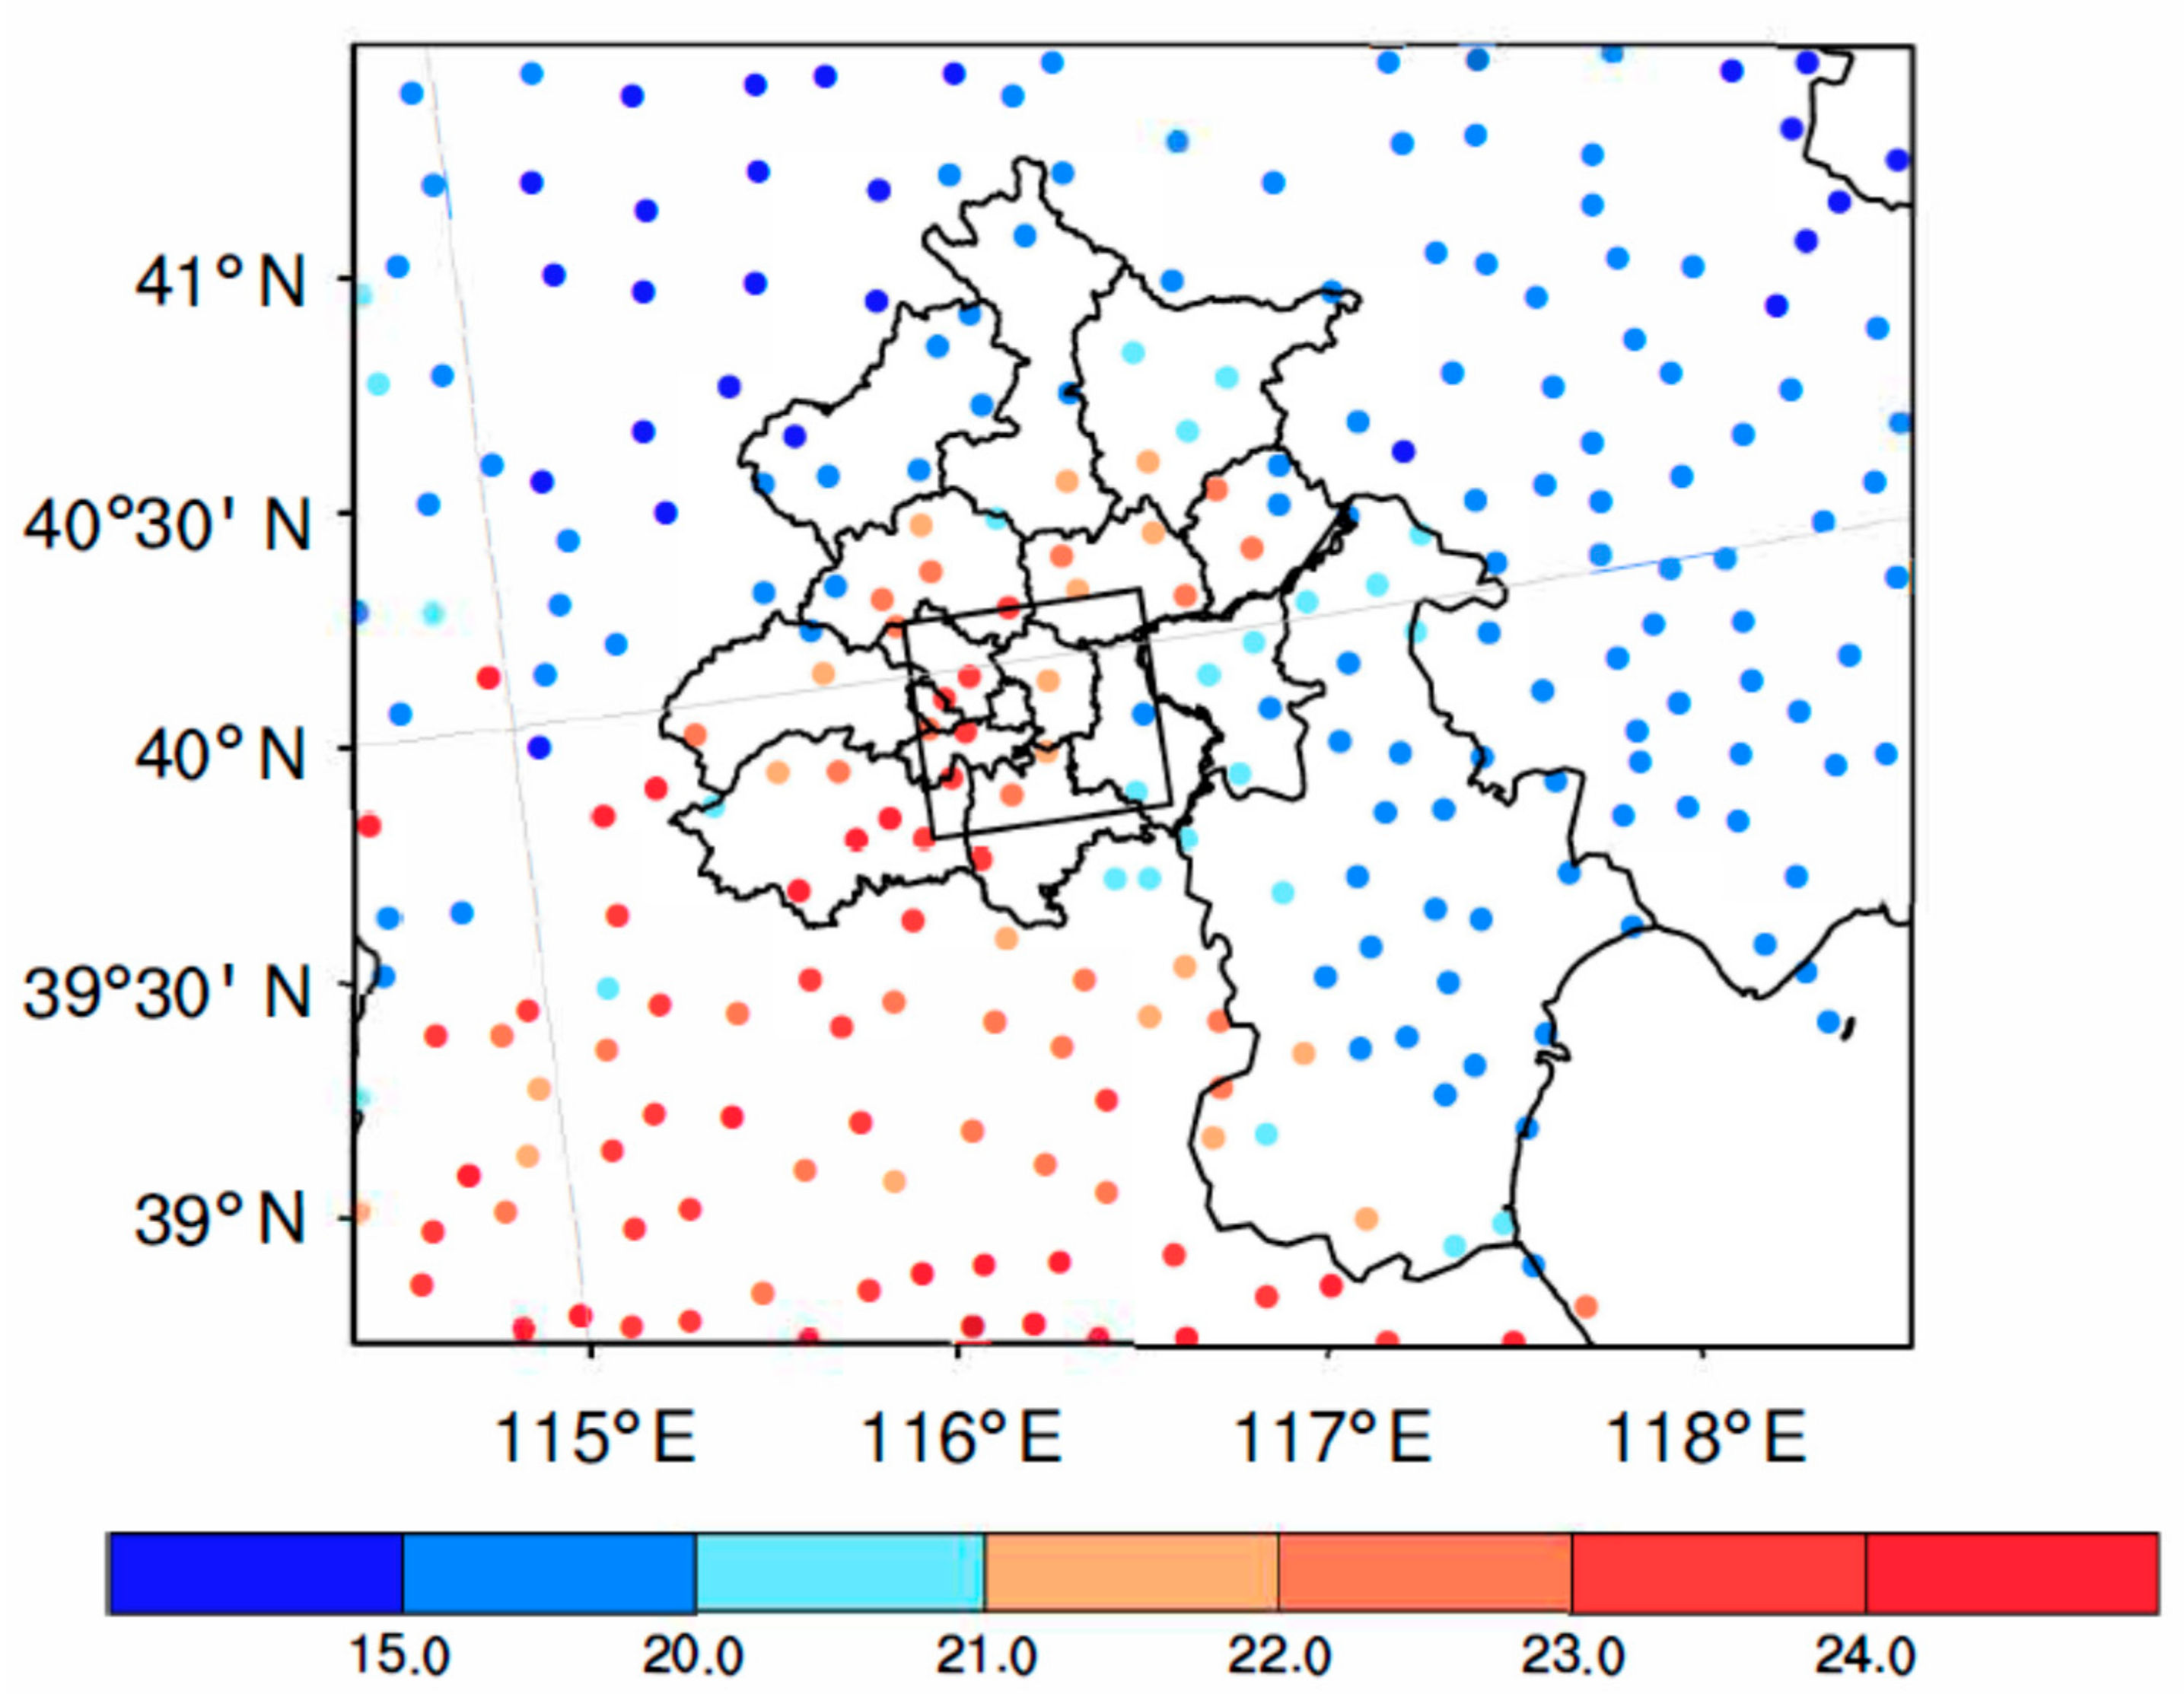
Figure 7 shows the spatial distribution of the observed two-meter air temperature at 0700 UTC before the echo moved to the urban area of Beijing. The black rectangular box was selected to identify the heat island intensity and perform statistical analysis in accordance with Zhang et al. (2017) and Qi et al. (2021) [17,35]. This region includes urban and suburban areas in Beijing, which reported no precipitation at 0700 UTC. It can be seen that before the belt-shaped echo moved to the urban area of Beijing, there was an obvious difference between the urban temperature in the Fifth Ring Road and the temperature in its surrounding area. The heat island intensity in Beijing is strong [35].

Figure 7.
Spatial distribution of 2 m air temperature at 0700UTC on 21 May 2020. The black rectangular box indicates the study area where temperatures prior to the start of rainfall are statistically analyzed (116.12°–116.79° E, 39.65°–40.115° N).
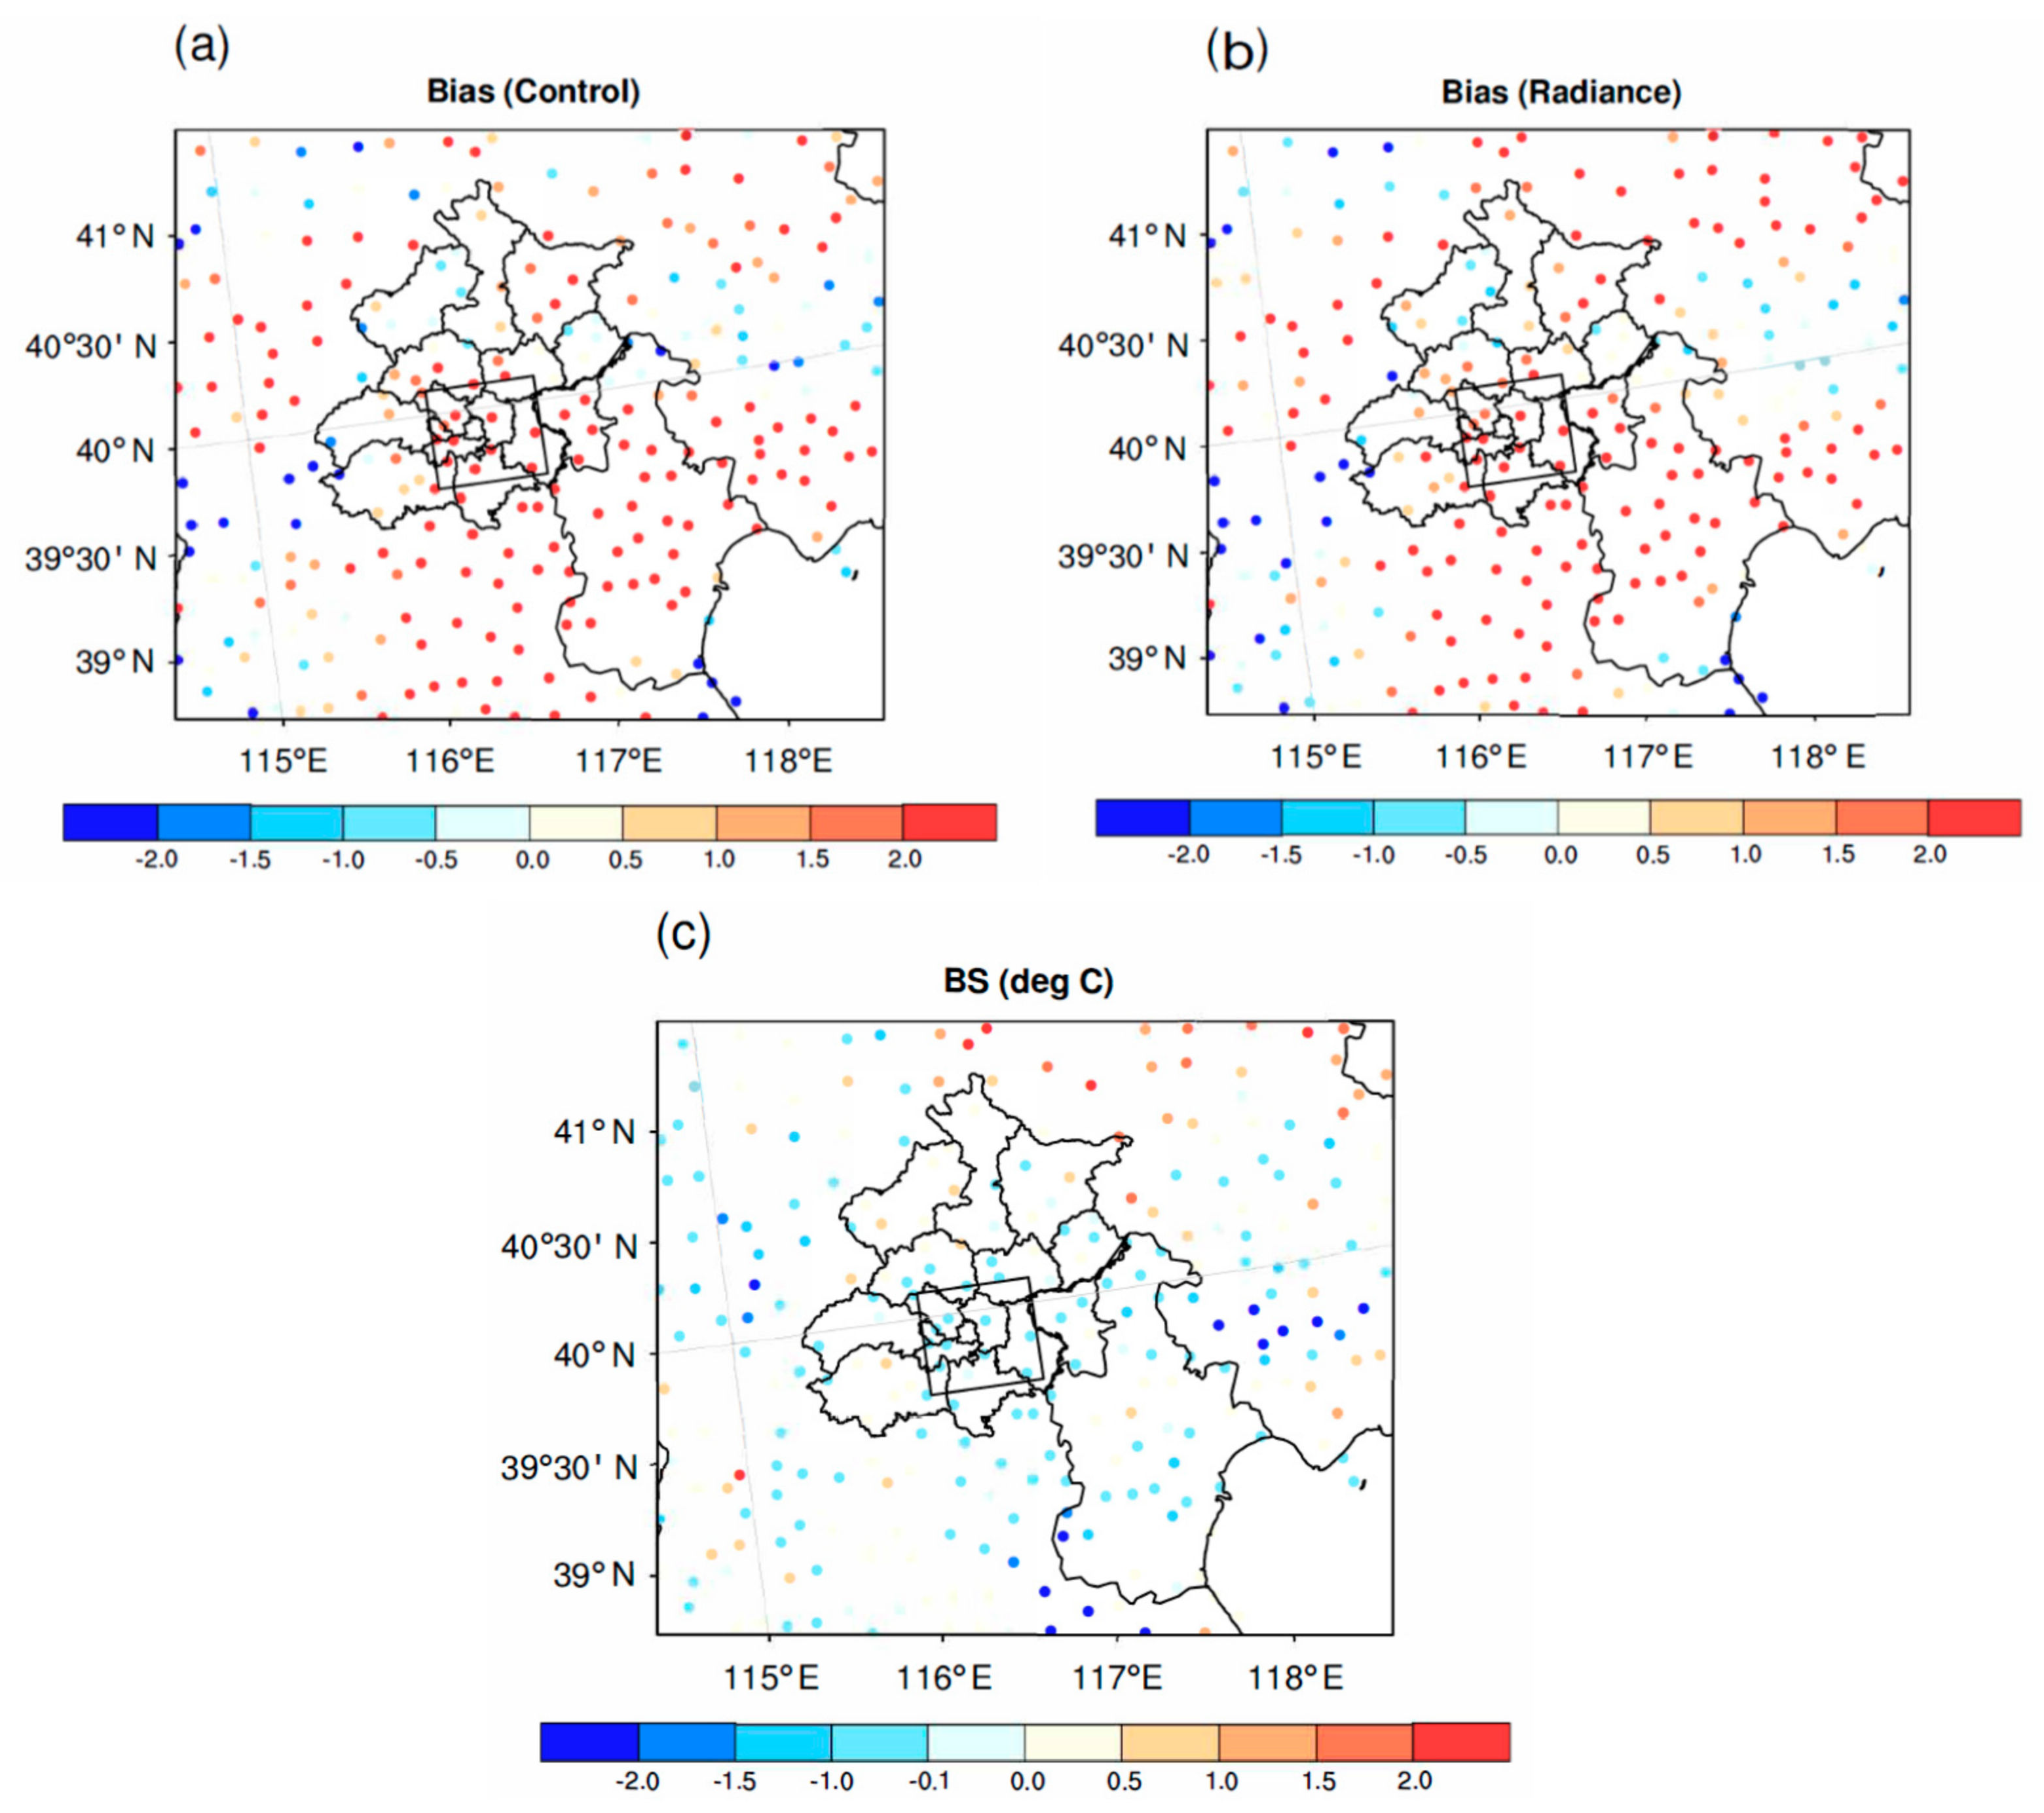
As indicated by the spatial distribution of two-meter temperature bias at 0700 UTC simulated by the control and MWRPS experiments (Figure 8a,b), the temperature deviation predicted by the control test in and around Beijing’s Fifth Ring Road (shown by the black rectangular frame) is larger than that predicted by the MWRPS test. The control test overestimates the observed heat island intensity in the urban area within the Fifth Ring Road. The assimilation of the ground-based microwave radiometers corrected the warm bias in this area, and the modified indexes of the two-meter air temperature are all negative, which agrees better with the observations (Figure 8c).
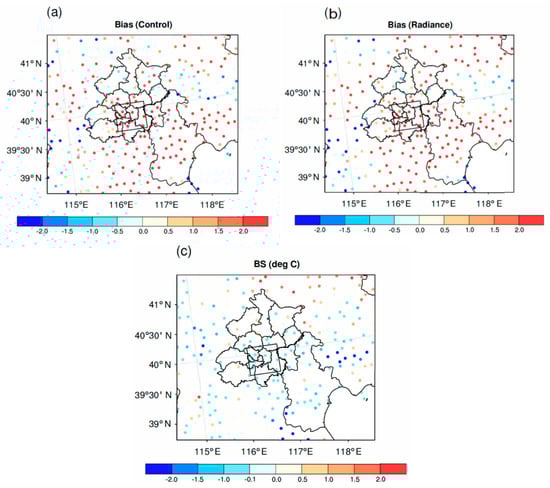
Figure 8.
(a,b) The bias of 2 m temperature (unit: °C) from control experiment and the bias of 2 m temperature from MWRPS experiment; (c) improving index (unit: °C) with the assimilation of ground-based microwave radiometers at 0700 UTC on 21 May 2020.
Compared with the control experiment, the MWRPS experiment improves the forecast of the two-meter temperature in Beijing and better reproduces the observed heat island phenomenon. Thus, the observed rainfall enhancement can be better simulated in the MWRPS experiment, mainly due to the effect of the urban surface in Beijing on rainfall since its thermo-dynamic prevails under urban heat island condition.
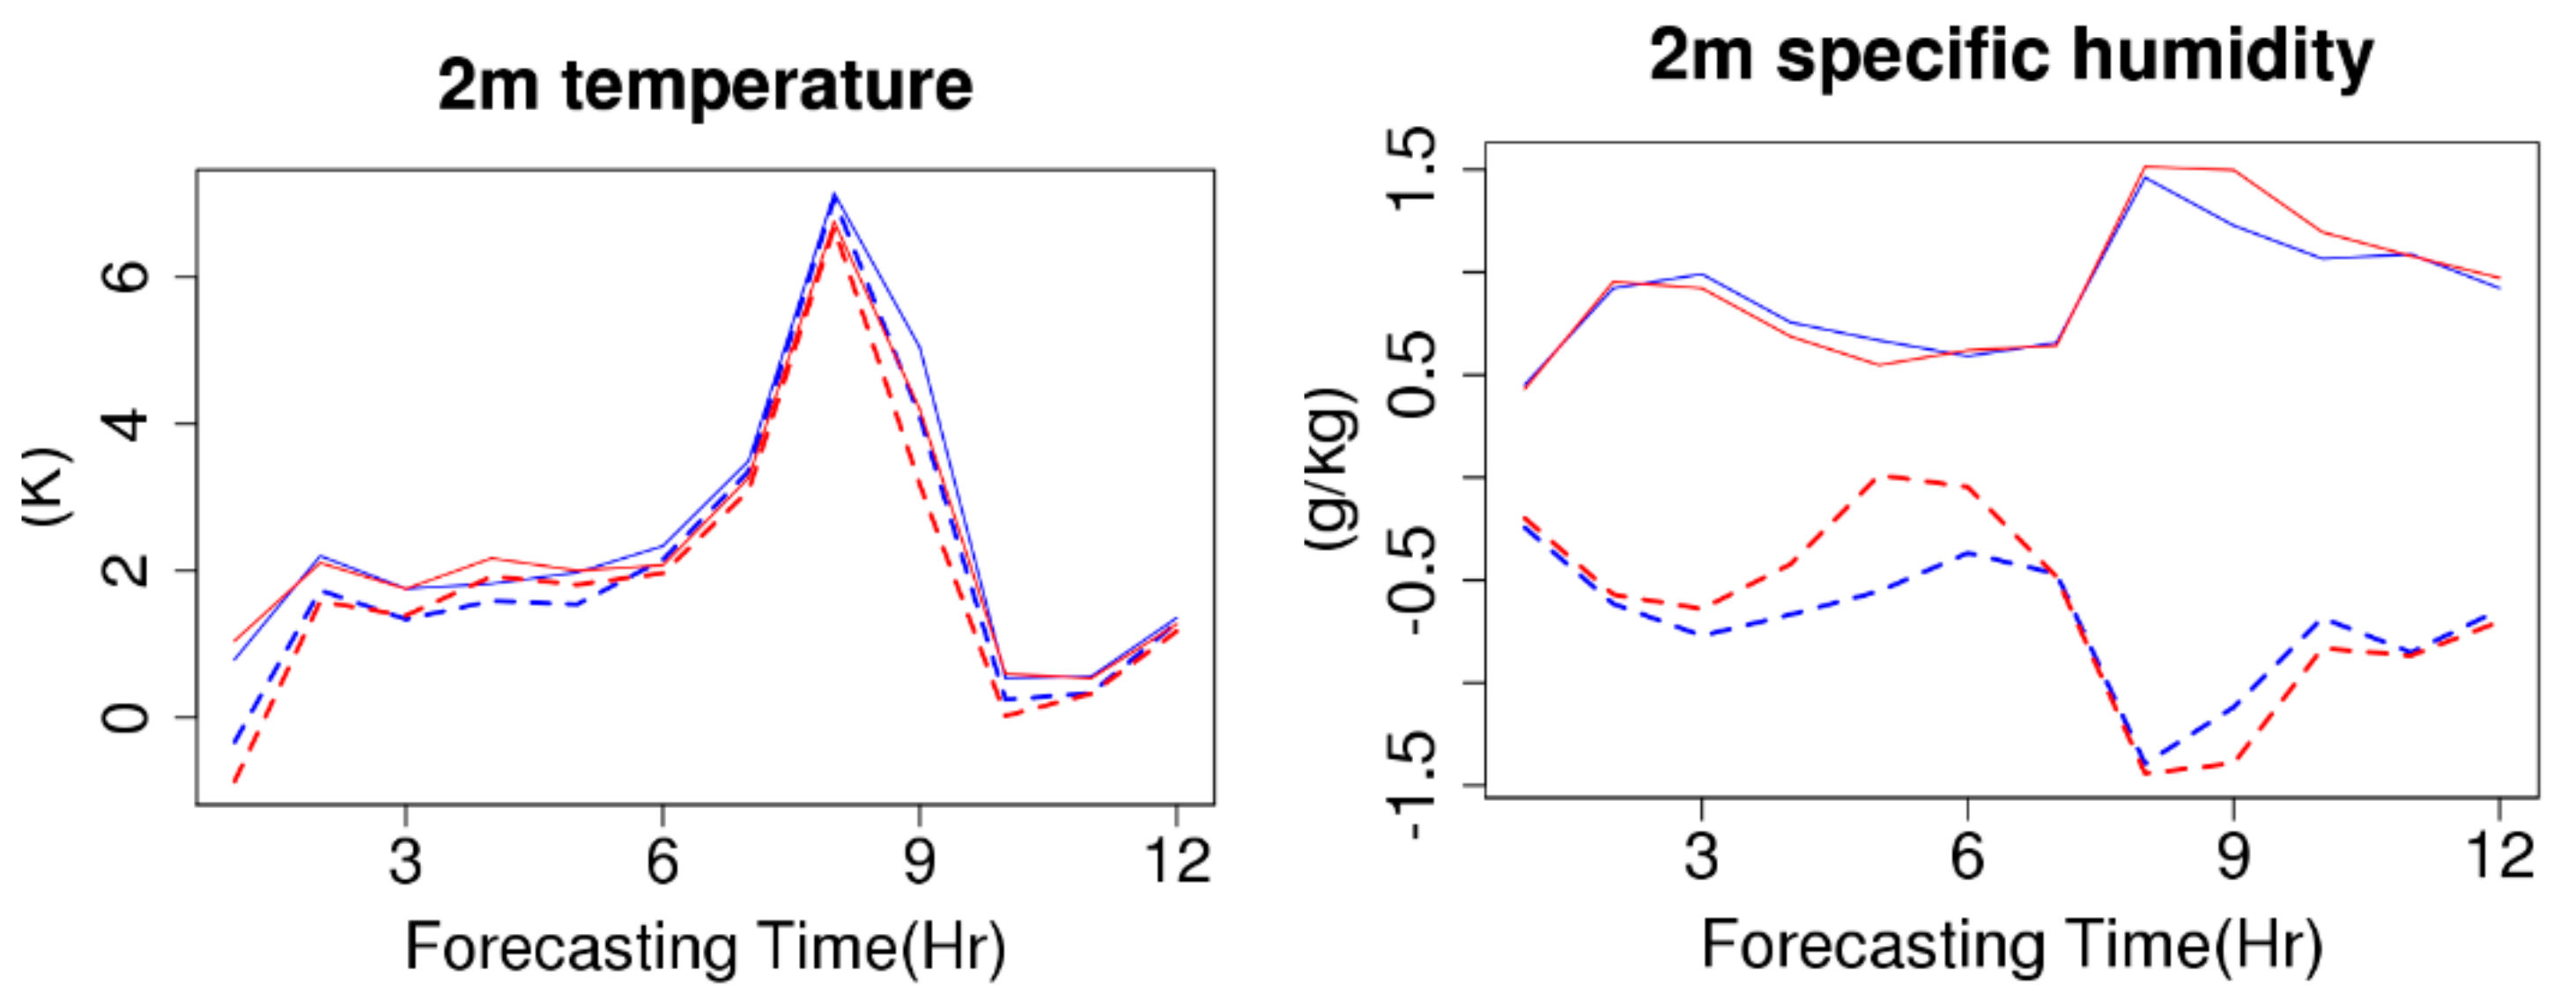
Additionally, the spatial characteristics of forecast of the two-meter temperature and two-meter specific humidity distribution from the two experiments were also evaluated against observations using the statistical metrics of mean bias and the root mean square error (RMSE). The closer the bias value is to 0 and the smaller the RMSE value is, the better the prediction is. Figure 9 shows the bias and RMSE of the average two-meter temperature and two-meter specific humidity over the black rectangular boxes, including urban and suburban areas in Beijing.
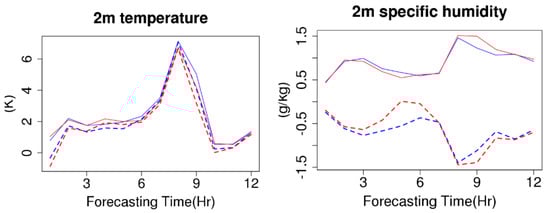
Figure 9.
RMSE (solid lines) and Bias (dotted lines) for 2 m temperature and 2 m specific humidity forecasted by the control experiment (blue lines) and the MWRPS experiment (red lines) in relation to observations for the black rectangular box.
Both experiments overestimate the observed two-meter temperature with a positive bias. Both the bias and RMSE in the MWRPS test are smaller than those in the control test. The two-meter temperature forecast indicates a better forecast performance for a longer period of time. The two-meter specific humidity is drier than the observation in both the control and MWRPS tests. The MWRPS test effectively improves for the first 8 h. To sum up, the assimilation of the ground-based microwave radiometers solved the warm bias for the two-meter temperature and dry bias for the two-meter specific humidity, thus laying a good foundation for the simulated urban precipitation enhancement process.
4. Discussion
Figure 10 shows the radial vertical profile of temperature and vertical velocity along 40°N in the boundary layer of the Fifth Ring Road and its surrounding areas in the forecast field from two experiments at 0800 UTC on 21 May 2020. It can be seen that the temperature in the lower atmosphere simulated by the control experiment is larger than that simulated by the MWRPS experiment. However, the observed heat island effect cannot be reproduced in the control experiment because of the small temperature difference between the urban and suburban areas. For the MWRPS experiment, a clear heat island was found. Compared to the control experiment, a clear updraft with a larger vertical velocity was also found, producing stronger updrafts in the urban area, which led to a rainfall forecast. This urban ascending motion is strengthened under the strong heat island effect, which promotes the emergence of updrafts. This suggests that the assimilation of ground-based microwave radiometer observations in Beijing, which reproduced the heat island and the intensified local updraft in the urban area in Beijing, is consequently able to improve predictions of rainfall enhancements in urban areas.
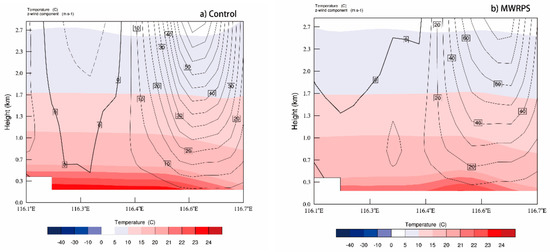
Figure 10.
The cross sections of the vertical profiles along 40° N from control (a) and MWRPS (b) forecast field at 0800 UTC on 21 May 2020, in which the vertical velocity (unit: 10−1 m/s) is represented as the contour, and the temperature (unit: °C) is represented as shaded.
5. Conclusions
In view of the case of heavy rainfall in Beijing on 21 May 2020, the RMASPS-ST was used to explore whether the data assimilation of the ground-based microwave radiometers with high spatial and temporal resolution in Beijing could improve the weather forecast. Two experiments—to gather control and MWRPS —were conducted in this study. The simulation results for this case of heavy rainfall with and without the assimilation of MWRPS data were verified. The experimental results show that the assimilation of ground-based microwave radiometers in Beijing did improve the prediction of precipitation and echo and better predicted the rainfall enhancement process. The main conclusions are as follows:
- (1)
- The RMAPS-ST model system can provide a good simulation of the selected rainfall case, by assimilating the MWRPS data in Beijing. It can clearly reproduce the observed urban heat island of the main urban area in Beijing prior to the start of this rainfall, thus reproducing the forecast of precipitation enhancement in the urban area. Compared with the control experiment, the simulated precipitation and radar reflectivity are closer in the MWRPS experiment to the observation.
- (2)
- After the data from the ground-based microwave radiometers are assimilated, the observed weak heat island phenomenon is better reproduced. The simulated surface temperature distribution in Beijing is also closer to the observation prior to the start of the rainfall in the urban area. The model not only clearly improves the forecast of precipitation distribution, but also makes the precipitation intensity prediction closer to the actual situation and accurately predicts the enhancement process of the belt-shaped echo and the precipitation in the urban area of Beijing.
- (3)
- The heavy rainfall process in Beijing on 21 May 2020 shows that the assimilation of the ground-based microwave radiometer can improve the numerical forecast, contributing to improving the precipitation simulation in the urban area of Beijing, indicating a bright prospect for applications in numerical models. This rainfall event can also help us understand the impact of urban space on the rainfall system, considering urban heat island conditions.
These conclusions are based on heavy rainfall, which occurred in the urban area of Beijing. Further investigation into the impact of the ground-based microwave radiometer on weather forecasts will continue. More cases will be investigated to study the application of the assimilation of ground-based microwave radiometer data in the future. In this way, we will gain a more insightful understanding of the impact of assimilation of ground-based microwave radiometer data on forecasts.
Author Contributions
Conceptualization, B.L., Y.Q. and S.F.; methodology, Y.Q. and S.F.; software, Y.Q.; validation, Y.Q.; formal analysis, Y.Q. and J.M.; computing resources, Y.Q.; writing—original draft preparation, Y.Q.; writing—review and editing, S.F., Y.Q. and D.L.; supervision, S.F.; funding acquisition, S.F. and Y.Q. All authors have read and agreed to the published version of the manuscript.
Funding
This research was funded by the National Key Technologies Research and Development Program of China (2017YFC1501704), National Natural Science Foundation of China (42005124), and the Key Laboratory for Cloud Physics of China Meteorological Administration LCP/CMA (2020Z007).
Data Availability Statement
The ground-based microwave radiometer data are be available from Meteorological Observation Center of China Meteorological Administration.
Acknowledgments
The authors appreciate the help of the RMAPS-ST group, including code support and the sharing of valuable data. We acknowledge the Meteorological Observation Center of China Meteorological Administration for the ground-based microwave radiometer data.
Conflicts of Interest
The authors declare no conflict of interest.
References
- Illingworth, A.J.; Cimini, D.; Haefele, A.; Haeffelin, M.; Hervo, M.; Kotthaus, S.; Löhnert, U.; Martinet, P.; Mattis, I.; O’Connor, E.J.; et al. How can existing ground-based profiling instruments improve European weather forecasts? Bull. Am. Meteorol. Soc. 2019, 100, 605–619. [Google Scholar] [CrossRef]
- Boylan, P.; Wang, J.; Cohn, S.A.; Fetzer, E.; Maddy, E.S.; Wong, S. Validation of AIRS version 6 temperature profiles and surface-based inversions over Antarctica using Concordiasi dropsonde data. J. Geophys. Res. Atmos. 2015, 120, 992–1007. [Google Scholar] [CrossRef]
- Sun, Q.; Vihma, T.; Jonassen, M.O.; Zhang, Z. Impact of assimilation of radiosonde and UAV observations from the Southern Ocean in the Polar WRF Model. Adv. Atmos. Sci. 2020, 37, 441–454. [Google Scholar] [CrossRef] [Green Version]
- Rüfenacht, R.; Haefele, A.; Pospichal, B.; Cimini, D.; Bircher-Adrot, S.; Turp, M.; Sugier, J. EUMETNET opens to microwave radiometers for operational thermodynamical profiling in Europe. Bull. Atmos. Sci. Technol. 2021, 2, 1–5. [Google Scholar] [CrossRef]
- Cimini, D.; Hewison, T.; Martin, L.; Güldner, J.; Gaffard, C.; Marzano, F.S. Temperature and humidity profile retrievals from ground-based microwave radiometers during TUC. Meteorol. Z. 2006, 15, 45–56. [Google Scholar] [CrossRef]
- Martinet, P.; Cimini, D.; De Angelis, F.; Canut, G.; Unger, V.; Guillot, R.; Tzanos, D.; Paci, A. Combining ground-based mi-crowave radiometer and the AROME convective scale model through 1DVAR retrievals in complex terrain: An Alpine valley case study. Atmos. Meas. Tech. 2017, 10, 3385–3402. [Google Scholar] [CrossRef] [Green Version]
- Crewell, S.; Lohnert, U. Accuracy of boundary layer temperature profiles retrieved with multifrequency multiangle microwave radiometry, IEEE T. Geosci. Remote 2007, 45, 2195–2201. [Google Scholar] [CrossRef]
- Löhnert, U.; Maier, O. Operational profiling of temperature using ground-based microwave radiometry at Payerne: Prospects and challenges. Atmos. Meas. Tech. 2012, 5, 1121–1134. [Google Scholar] [CrossRef] [Green Version]
- Qiu, J.; Chen, H.; Wang, P.; Liu, Y.; Xia, X. Recent progress in atmospheric observation research in China. Adv. Atmos. Sci. 2007, 24, 940–953. [Google Scholar] [CrossRef]
- Cimini, D.; Campos, E.; Ware, R.; Albers, S.; Giuliani, G.; Oreamuno, J.; Joe, P.; Koch, S.E.; Cober, S.; Westwate, E. Thermo-dynamic atmospheric profiling during the 2010 Winter Olympics using ground-based microwave radiometry. IEEE Trans. Geosci. Remote Sens. 2011, 49, 4959–4969. [Google Scholar] [CrossRef]
- Cimini, D.; Nelson, M.; Güldner, J.; Ware, R. Forecast indices from a ground-based microwave radiometer for operational meteorology. Atmos. Meas. Tech. 2015, 8, 315–333. [Google Scholar] [CrossRef] [Green Version]
- Caumont, O.; Cimini, D.; Löhnert, U.; Alados-Arboledas, L.; Bleisch, R.; Buffa, F.; Ferrario, M.E.; Haefele, A.; Huet, T.; Madonna, F.; et al. Assimilation of humidity and temperature observations retrieved from ground-based microwave radiometers into a convective-scale NWP model. Q. J. R. Meteorol. Soc. 2016, 142, 2692–2704. [Google Scholar] [CrossRef] [Green Version]
- Yan, X.; Ducrocq, V.; Poli, P.; Hakam, M.; Jaubert, G.; Walpersdorf, A. Impact of GPS zenith delay assimilation on convective-scale prediction of Mediterranean heavy rainfall. J. Geophys. Res. Space Phys. 2009, 114, D03104. [Google Scholar] [CrossRef] [Green Version]
- Sun, J. Convective-scale assimilation of radar data: Progress and challenges. Q. J. R. Meteorol. Soc. 2005, 131, 3439–3463. [Google Scholar] [CrossRef]
- Stephan, K.; Klink, S.; Schraff, C. Assimilation of radar-derived rain rates into the convective-scale model COSMO-DE at DWD. Q. J. R. Meteorol. Soc. 2008, 134, 1315–1326. [Google Scholar] [CrossRef]
- Wenying, H.; Chen, H.; Li, J. Influence of assimilating ground-based microwave radiometer data into the WRF model on pre-cipitation. Atmos. Ocean. Sci. Lett. 2020, 13, 107–112. [Google Scholar]
- Qi, Y.; Fan, S.; Mao, J.; Li, B.; Guo, C.; Zhang, S. Impact of assimilating ground-based microwave radiometer data on the precipitation bifurcation forecast: A case study in Beijing. Atmosphere 2021, 12, 551. [Google Scholar] [CrossRef]
- Grell, G.A.; Dudhia, J.; Stauffer, D.R. A Description of the Fifth-Generation Penn State/NCAR Mesoscale Model (MM5); University Corporation for Atmospheric Research: Boulder, CO, USA, 1994. [Google Scholar] [CrossRef]
- Vandenberghe, F.; Ware, R. Four-dimensional variational assimilation of ground-based microwave observations during a winter fog event. In Proceedings of the International Workshop on GPS Meteorology, International Symposium on Atmospheric Sensing with GPS, Tsukuba, Japan, 14–17 January 2003. [Google Scholar]
- Otkin, J.A.; Hartung, D.C.; Turner, D.; Petersen, R.A.; Feltz, W.F.; Janzon, E. Assimilation of surface-based boundary layer profiler observations during a cool-season weather event using an observing system simulation experiment. Part I: Analysis impact. Mon. Weather Rev. 2011, 139, 2309–2326. [Google Scholar] [CrossRef]
- Hartung, D.C.; Otkin, J.; Petersen, R.A.; Turner, D.; Feltz, W.F. Assimilation of surface-based boundary layer profiler observations during a cool-season weather event using an observing system simulation experiment. Part II: Forecast assessment. Mon. Weather Rev. 2011, 139, 2327–2346. [Google Scholar] [CrossRef]
- Miao, S.; Chen, F.; Li, Q.; Fan, S. Impacts of urban processes and urbanization on summer precipitation: A case study of heavy rainfall in Beijing on 1 August 2006. J. Appl. Meteorol. Clim. 2011, 50, 806–825. [Google Scholar] [CrossRef]
- Chen, F.; Dudhia, J. Coupling an advanced land-surface/ hydrology model with the Penn State/NCAR MM5 modeling system. Part I: Model description and implementation. Mon. Weather Rev. 2001, 129, 569–585. [Google Scholar] [CrossRef] [Green Version]
- Zhang, L.; Ni, Y.Q. Four-dimensional variational data assimilation of radar radial velocity observations. Chin. J. Atmos. Sci. 2006, 30, 433–440. [Google Scholar]
- Xie, Y.; Shi, J.; Fan, S.; Chen, M.; Dou, Y.; Ji, D. Impact of radiance data assimilation on the prediction of heavy rainfall in RMAPS: A case study. Remote Sens. 2018, 10, 1380. [Google Scholar] [CrossRef] [Green Version]
- Xie, Y.; Chen, M.; Shi, J.; Fan, S.; He, J.; Dou, Y. Impacts of assimilating ATMS radiances on heavy rainfall forecast in RMAPS-ST. Remote Sens. 2020, 12, 1147. [Google Scholar] [CrossRef] [Green Version]
- Fan, S.; Wang, H.L.; Chen, M.; Gao, H. Study of the data assimilation of radar reflectivity with the WRF 3DVar. Acta Meteor. Sin. 2013, 71, 527–537. [Google Scholar]
- Qi, Y.J.; Chen, M.; Zhong, J.Q.; Fan, S.Y.; Liu, R.T.; Guo, C.W. Effect evaluation of short-term forecast of surface meteorological elements by using RMAPS-ST coupled urban canopy model. J. Arid. Meteorol. 2020, 38, 859–868. [Google Scholar]
- Hong, S.-Y.; Noh, Y.; Dudhia, J. A new vertical diffusion package with an explicit treatment of entrainment processes. Mon. Weather Rev. 2006, 134, 2318–2341. [Google Scholar] [CrossRef] [Green Version]
- Pincus, R.; Mlawer, E.J.; Oreopoulos, L.; Ackerman, A.S.; Baek, S.; Brath, M.; Buelhler, S.A.; Cady-Pereira, K.; Cole, J.; Dufresne, J.-L.; et al. Radiative flux and forcing parameterization error in aerosol-free clear skies. Geophys. Res. Lett. 2015, 42, 5485–5492. [Google Scholar] [CrossRef] [Green Version]
- Mlawer, E.J.; Taubman, S.J.; Brown, P.D.; Iacono, M.J.; Clough, S.A. Radiative transfer for inhomogeneous atmospheres: RRTM, a validated correlated-k model for the longwave. J. Geophys. Res. Atmos. 1997, 102, 16663–16682. [Google Scholar] [CrossRef] [Green Version]
- Sun, J.; Wang, H.; Tong, W.; Zhang, Y.; Lin, C.-Y.; Xu, D. Comparison of the impacts of momentum control variables on high-resolution variational data assimilation and precipitation forecasting. Mon. Weather Rev. 2015, 144, 149–169. [Google Scholar] [CrossRef]
- Parrish, D.F.; Derber, J.C. The National Meteorological Center’s Spectral Statistical-Interpolation analysis system. Mon. Weather Rev. 1992, 120, 1747–1763. [Google Scholar] [CrossRef]
- Schaefer, J.T. The critical success index as an indicator of warning skill. Weather Forecast. 1990, 5, 570–575. [Google Scholar] [CrossRef] [Green Version]
- Zhang, Y.; Miao, S.; Dai, Y.; Bornstein, R. Numerical simulation of urban land surface effects on summer convective rainfall under different UHI intensity in Beijing. J. Geophys. Res. Atmos. 2017, 122, 7851–7868. [Google Scholar] [CrossRef]
- Wang, Y.; Zhao, X.; Zuo, L.; Zhang, Z.; Wang, X.; Yi, L.; Liu, F.; Xu, J. Spatial differentiation of land use and landscape pattern changes in the Beijing–Tianjin–Hebei area. Sustainability 2020, 12, 3040. [Google Scholar] [CrossRef] [Green Version]
- Zhang, S.; Huang, G.; Qi, Y.; Jia, G. Impact of urbanization on summer rainfall in Beijing–Tianjin–Hebei metropolis under different climate backgrounds. Theor. Appl. Clim. 2017, 133, 1093–1106. [Google Scholar] [CrossRef]
- Lin, D.W.; Bueh, C.L.; Xie, Z.W. A study on the coupling relationships among Pacific Sea surface temperature and summer rainfalls over North China and India. Chin. J. Atmos. Sci. 2018, 42, 1175–1190. [Google Scholar]
- Bornstein, R.D. Establishment of meso-met modeling case studies to evaluate the relative roles of urban dynamics and aerosols on summer thunderstorms: A proposal. In Proceedings of the 18th Conference on Planned and Inadvertent Weather Modifi-cation, and Third Symposium on Aerosol–Cloud–Climate Interactions, San Jose, CA, USA, 27 January 2011. [Google Scholar]
- Dou, J.; Wang, Y.; Bornstein, R.; Miao, S. Observed spatial characteristics of Beijing urban climate impacts on summer thunderstorms. J. Appl. Meteorol. Clim. 2015, 54, 94–105. [Google Scholar] [CrossRef]


Publisher’s Note: MDPI stays neutral with regard to jurisdictional claims in published maps and institutional affiliations. |
© 2021 by the authors. Licensee MDPI, Basel, Switzerland. This article is an open access article distributed under the terms and conditions of the Creative Commons Attribution (CC BY) license (https://creativecommons.org/licenses/by/4.0/).