Article

Spatial and Temporal Variations of Extreme Precipitation in Central Asia during 1982–2020

1
Xingxian Meteorological Service, Lvliang 033600, China
2
Key Laboratory of Regional Climate–Environment for Temperate East Asia, Institute of Atmospheric Physics, Chinese Academy of Sciences, Beijing 100029, China
3
University of Chinese Academy of Sciences, Beijing 100049, China
*
Author to whom correspondence should be addressed.
Atmosphere 2022, 13(1), 60; https://doi.org/10.3390/atmos13010060
Submission received: 17 November 2021 / Revised: 17 December 2021 / Accepted: 29 December 2021 / Published: 30 December 2021
(This article belongs to the Section Climatology)

Abstract

:
As one of the largest arid and semi-arid regions in the world, central Asia (CA) is very sensitive to changes in regional climate. However, because of the poor continuity of daily observational precipitation records in CA, the spatial and temporal variations of extreme precipitation in recent decades remain unclear. Considering their good spatial and temporal continuity, gridded data, such as Climate Prediction Center (CPC) global precipitation, and reanalysis data, such as ERA-Interim (ERA), are helpful for exploring the spatial–temporal variations of extreme precipitation. This study evaluates how well CPC and ERA can represent observed precipitation extremes by comparing the differences in eight extreme precipitation indices and observation data at 84 meteorological stations. The results indicate that the CPC (except for 1979–1981) is more suitable for depicting changes in precipitation extremes. Based on the CPC data for the period 1982–2020, we found that seven indices of precipitation extremes, including consecutive wet days (CWD), max1-day precipitation amount (Rx1day), max5-day precipitation amount (Rx5day), number of heavy precipitation days (R10), very wet days (R95p), annual total precipitation in wet days (PRCPTOT), and simple precipitation intensity index (SDII) have increased by 0.2 d/10a, 0.9 mm/10a, 1.8 mm/10a, 0.3 d/10, 8.4 mm/10a, 14.3 mm/10a and 0.1 mm/d/10a, respectively, and the consecutive dry days (CDDs) have decreased by −3.10 d/10a. It is notable that CDDs decreased significantly in the north of Xinjiang (XJ) but increased in Kyrgyzstan (KG), Tajikistan (TI), and eastern Turkmenistan (TX). The other indices increased clearly in the west of XJ, north of Kazakhstan (KZ), and east of KG but decreased in the south of KG, TI, and parts of XJ. For most indices, the largest change occurred in spring, the main season of precipitation in CA. Therefore, the large-scale atmospheric circulation in April is analyzed to contrast between the most and least precipitation years for the region. A typical circulation pattern in April for those extremely wet years includes an abnormal low-pressure center at 850 hpa to the east of the Caspian Sea, which enhances the southerly winds from the Indian Ocean and hence the transportation of water vapor required for precipitation into CA. This abnormal circulation pattern occurred more frequently after 2001 than before, thus partly explaining the recent increasing trends of precipitation extremes in CA.

1. Introduction

The combined effects of human activities such as emissions of atmospheric greenhouse gases and land uses have changed water circulation, leading to uneven spatial and temporal distribution of water resources, especially with changing precipitation extremes [1,2,3,4,5,6]. Floods, droughts, and other disasters caused by extreme precipitation events have increasingly influenced the sustainable socioeconomic development around the world [7,8]; for an arid region, however, the effect of an extreme precipitation event could be complex (e.g., it could only fill a dry water channel without a disaster, as discussed by Pielke [9]). In recent decades, precipitation extremes have increased across most of the world [10,11,12,13,14]. According to the IPCC AR6 [15], anthropogenic global warming has caused an increase in the frequency, intensity, and/or amount of heavy precipitation events at a global scale, especially over most land regions with good observational coverage.
Previous studies suggested different changes in precipitation or dryness in arid areas. Sun et al. [12] suggested that there was a reduction in global land precipitation variance due to a redistribution, i.e., on average, the dry became wetter, while the wet became drier. Grave et al. [11] analyzed that about 10.8% of the global land area showed a robust pattern of ‘dry becomes drier, wet becomes wetter’, compared with 9.5% of global land area with the opposite pattern. Donat et al. [13] found that increases in total and extreme precipitation in dry regions were linearly related to the model-specific global warming, with implications for increased risk of flooding, particularly for the world’s dry regions. As one of the largest arid and semi-arid regions in the world, central Asia (CA) has been facing such a risk, with growing bodies of evidence that indicate increasing precipitation [10,16,17]. Zhang et al. [18,19] found that all precipitation indices in five central Asian countries experienced an increasing trend except for the annual maximum number of CDDs, which had a significant decreasing trend during 1938–2005 as well as 1957–2005, and with abrupt changes mainly around 1957 and 1986. However, changes in extreme precipitation remained unclear for the recent decades, due to the lack of daily precipitation records, especially for the years after 2005. In addition, scarcity and uneven distribution of long-term meteorological observations with numerous missing records in CA, especially due to the collapse of the former Soviet Union [20], made the local precipitation series in five central Asian countries severely inhomogeneous and hardly useful for estimating recent trends in precipitation extremes.
Compared with station observations, gridded data or reanalysis data provide good tools for studying climate extremes due to their continuous records and improved spatiotemporal coverage [21,22,23]. In recent years, numerous studies of extreme precipitation changes were carried out. A few discussed precipitation changes in CA with different datasets [10,24,25,26]. The results indicated that gridded or reanalysis datasets can represent characteristics of extreme precipitation to a certain extent. However, it is still necessary to evaluate datasets of different sources regarding precipitation extremes in CA.
In the present study, we firstly analyzed the temporal–spatial distribution of eight precipitation indices (CDDs, CWDs, Rx1day, Rx5day, R10, R95p, PRCPTOT, and SDII, detailed in Table 1) in CA from 1979 to 2005 based on station observations, then evaluated the applicability of ERA and CPC gridded data for characterizing climate extremes, and finally demonstrate the spatial–temporal variations of precipitation extremes in CA during 1982–2020 based on CPC, which was proven to be the more suitable dataset. The revealed temporal and spatial patterns of precipitation extremes in CA should enrich the knowledge base for disaster prevention and mitigation, management of water resources, and sustainable development in the region.

2. Data and Methodology
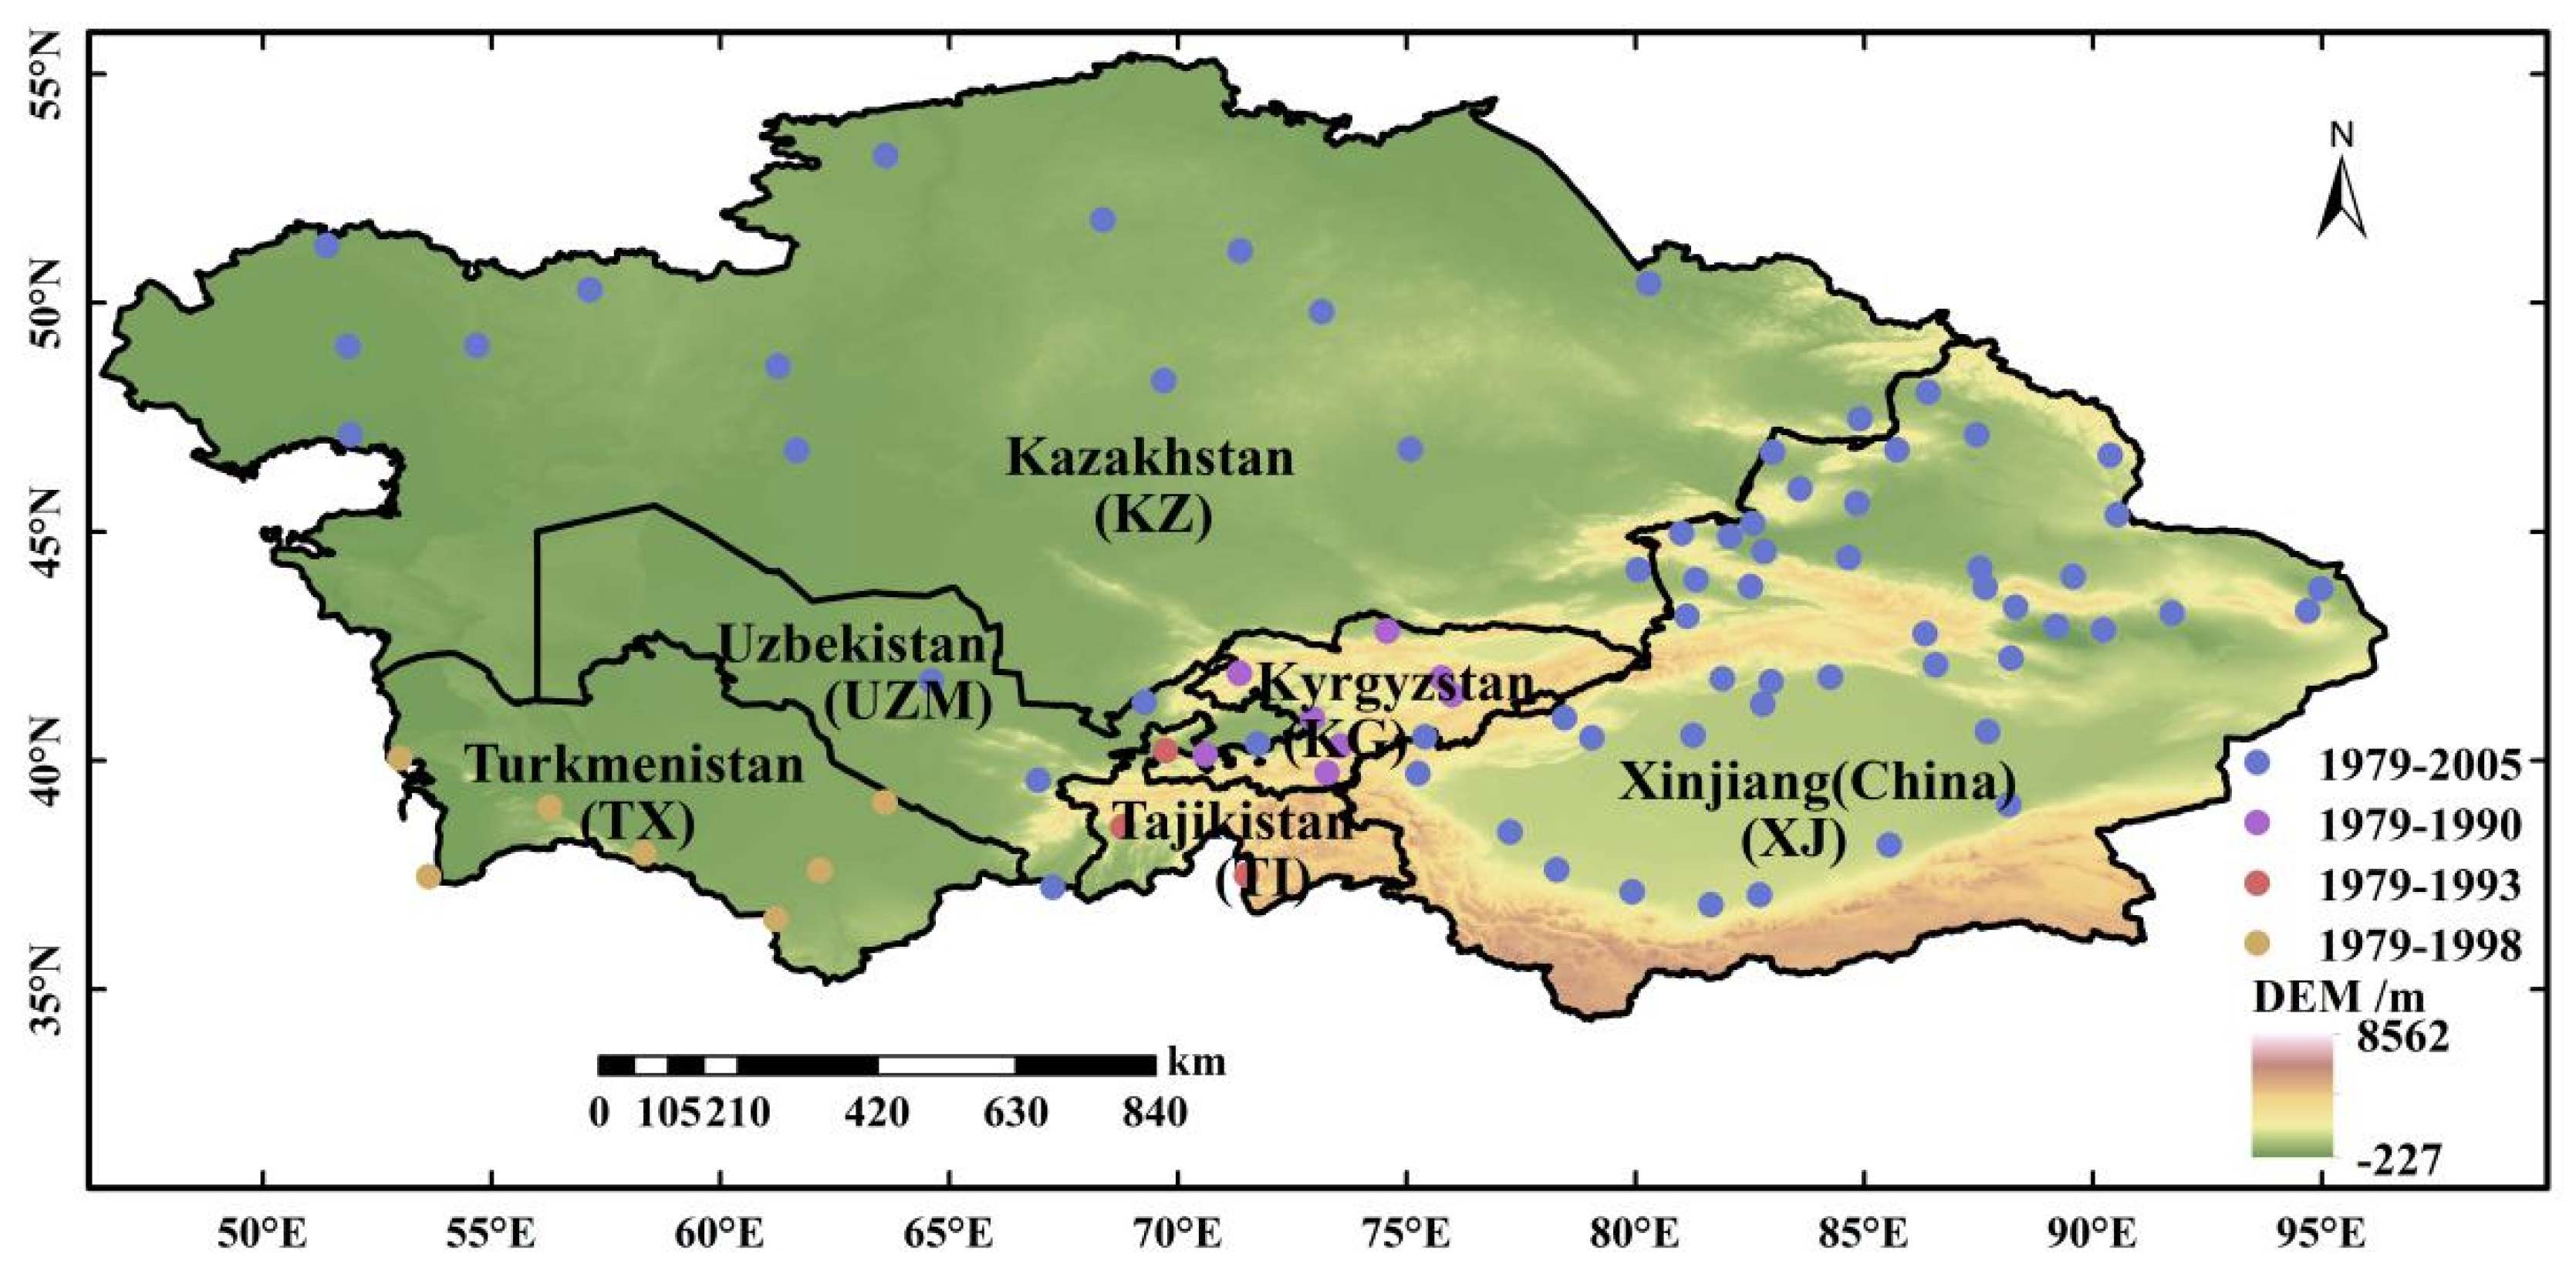
2.1. Study Area

CA in this paper denotes a region in the hinterland of Eurasia, adjacent to the Caspian Sea in the west, bordering Afghanistan and Iran to the south, and Russia to the north (46–97° E, 34–56° N), including Kazakhstan (KZ), Kyrgyzstan (KG), Tajikistan (TI), Turkmenistan (TX), Uzbekistan (UZM), and Xinjiang Uygur Autonomous Region (XJ) in China (Figure 1). CA is an arid inland region, far away from oceans. It has a complex topography with altitudes between −227m and 8562 m (Figure 1). The topography is significantly higher in the east than in the west. The geomorphology of the five CA countries includes mountains, deserts, basins, and valleys. The eastern part of CA is composed of the Tianshan Mountains and Pamir Plateau. Xinjiang has three mountain ranges and two basins ranging from north to south [27,28,29]. CA has a typical temperate continental climate, with sharp seasonal and diurnal temperature differences, intensive evaporation, and dry environments [30]. Due to the location and water shortage, CA is extremely vulnerable to climate change.

2.2. Data

Daily precipitation observations (OBS) at 599 stations in five central Asian countries were collected from the Global Historical Climatology Network—Daily (GHCND) by the US National Oceanic and Atmospheric Administration (ftp://ftp.ncdc.noaa.gov/pub/data/ghcn/daily/, accessed on 17 November 2021). The daily records at 45 stations in XJ were obtained from China Meteorological Administration (http://data.cma.cn/, accessed on 17 November 2021). The precipitation observations in five CA countries were not well continued, with numerous missing records in the 1990s due to the collapse of the former Soviet Union. Considering the completeness and continuity of records, most (560) of the 599 stations were not used, because the annual missing codes exceed 25% for more than 26 years during 1979–2005. In the present study, we used the qualified 39 stations in five CA countries and 45 stations in Xinjiang. These 84 stations chosen are relatively evenly distributed in CA (Figure 1).
The gridded dataset used in this study is CPC global precipitation with a spatial resolution of 0.5° × 0.5° over the same period from 1979 to 2020, which was obtained from NOAA (https://psl.noaa.gov/data/gridded/data.cpc.globalprecip.html, accessed on 17 November 2021). CPC is a suite of unified precipitation products with consistent quantity and improved quality by combining all information sources available at NOAA Climate Prediction Center (Silver Spring, MD, USA) and by taking advantage of the optimal interpolation objective analysis technique.
The reanalysis data used here included the precipitation product of ERA-Interim (ERA) with a spatial resolution of 0.125° × 0.125° and temporal resolution of 12 h during 1979–2020, available from ECMWF (https://apps.ecmwf.int/datasets/data/interim-full-daily/levtype=sfc/, accessed on 17 November 2021). The ERA is produced with a sequential data assimilation scheme, advancing forward in time using 12-hourly analysis cycles. In each cycle, available observations are combined with prior information from a forecast model to estimate the evolving state of the global atmosphere and its underlying surface [31].
Since most stations in five CA countries were without records after 2005, and the two gridded datasets began from 1979, the overlapped period (1979–2005) was used to evaluate the applicability of CPC and ERA data.
Monthly geopotential height at 500-hPa and U/V component of wind at 850-hPa of ERA5 reanalysis were used to analyze possible links between large-scale atmospheric circulation and changes of precipitation in CA. The circulation data were obtained from https://cds.climate.copernicus.eu/cdsapp#!/dataset/reanalysis-era5-pressure-levels-monthly-means?tab=form (accessed on 17 November 2021), covering the period from 1979 to 2020 with a spatial resolution of 0.25 × 0.25.

2.3. Method

2.3.1. Indices for Precipitation Extremes

Precipitation extremes are often expressed by extreme indices [32]. Table 1 lists the eight core indices calculated with daily precipitation records, which were recommended by the CCl/CLIVAR/JCOMM Expert Team on Climate Change Detection and Indices (ETCCDI) and are used to study precipitation indices in CA. Definitions of these core indices are available from http://etccdi.pacificclimate.org/list_27_indices.shtml (accessed on 17 November 2021). Here, R10 was defined as the number of days with ≥10 mm precipitation for the drylands in CA. The indices of Rx1day and Rx5day were used at the annual scale.

2.3.2. Evaluating Methods

To evaluate the applicability of CPC and ERA on characterizing extreme precipitation in CA, we used the nearest-neighbor method, i.e., to compare between the grid point and its nearest OBS station. Then, two parameters, Spearman’s rank correlation coefficients (CCs) and root-mean-squared error (RMSE) were applied to quantitatively evaluate biases between CPC/ERA and its corresponding OBS results, as conducted in previous studies [33,34]. The equations are as follows:
CC = i = 1 n ( S i S ¯ ) · ( O i O ¯ ) i = 1 n ( S i S ¯ ) 2 · i = 1 n ( O i O ¯ ) 2
R M S E = i = 1 n ( S i O i ) 2 N
CC assesses the similarity between reanalysis and OBS. Here, S i is the daily precipitation in reanalysis; O i is that in OBS. S ¯ is the mean precipitation over the whole period in reanalysis; O ¯ is that in OBS. N is the length of the time series. A greater CC denotes more similar variations between reanalysis and OBS. RMSE measures the deviation between reanalysis and OBS. A smaller RMSE value denotes the higher accuracy of reanalysis.

2.3.3. Pettitt Test

Pettitt test was used to identify the most meaningful change point in the regional mean seasonal and annual precipitation series during 1982–2020. Pettitt test is a nonparametric technique to identify the change point in a time series [35], based on the Mann–Whitney two-sample test (rank-based test). It allows the detection of a single sharp shift in a time series [36] and has been widely employed in hydro-climatological studies to detect abrupt changes in the mean of the distribution of variables such as temperature [37] and precipitation [38]. In the present study, a change point occurs at time t 0 , when the statistic k t 0 is significantly different from zero at the 0.1 significance level. The result facilitates comparative analysis of large-scale atmospheric circulation patterns before and after the change point, in order to find possible links with changing precipitation extremes.

2.3.4. Trend Estimation Methods

To analyze changes in precipitation indices during a given period (e.g., 1979–2005 or 1982–2020), the least-squares linear fitting method was used to estimate their linear trends. A trend was considered as statistically significant by the t-test at a given significance level (such as p < 0.05 or p < 0.01).
Ensemble empirical mode decomposition (EEMD) [39] was adopted to identify variations of each precipitation index series at different timescales in addition to a long-term nonlinear trend. The four steps included in the EEMD calculation are as follows: (1) a noise series is added to the target data (a white noise series was added with an amplitude of 0.3 times standard deviation of precipitation indices series); (2) the data with the added noise were decomposed into intrinsic mode functions (IMFs); (3) repeat (1) and (2) calculations 1000 times; (4) the final result can be obtained as the ensemble means of the corresponding IMFs of the decompositions. Here, we combined the last two (the fifth and sixth) components as the decadal-to-trend component, i.e., the nonlinear trend.

3. Results

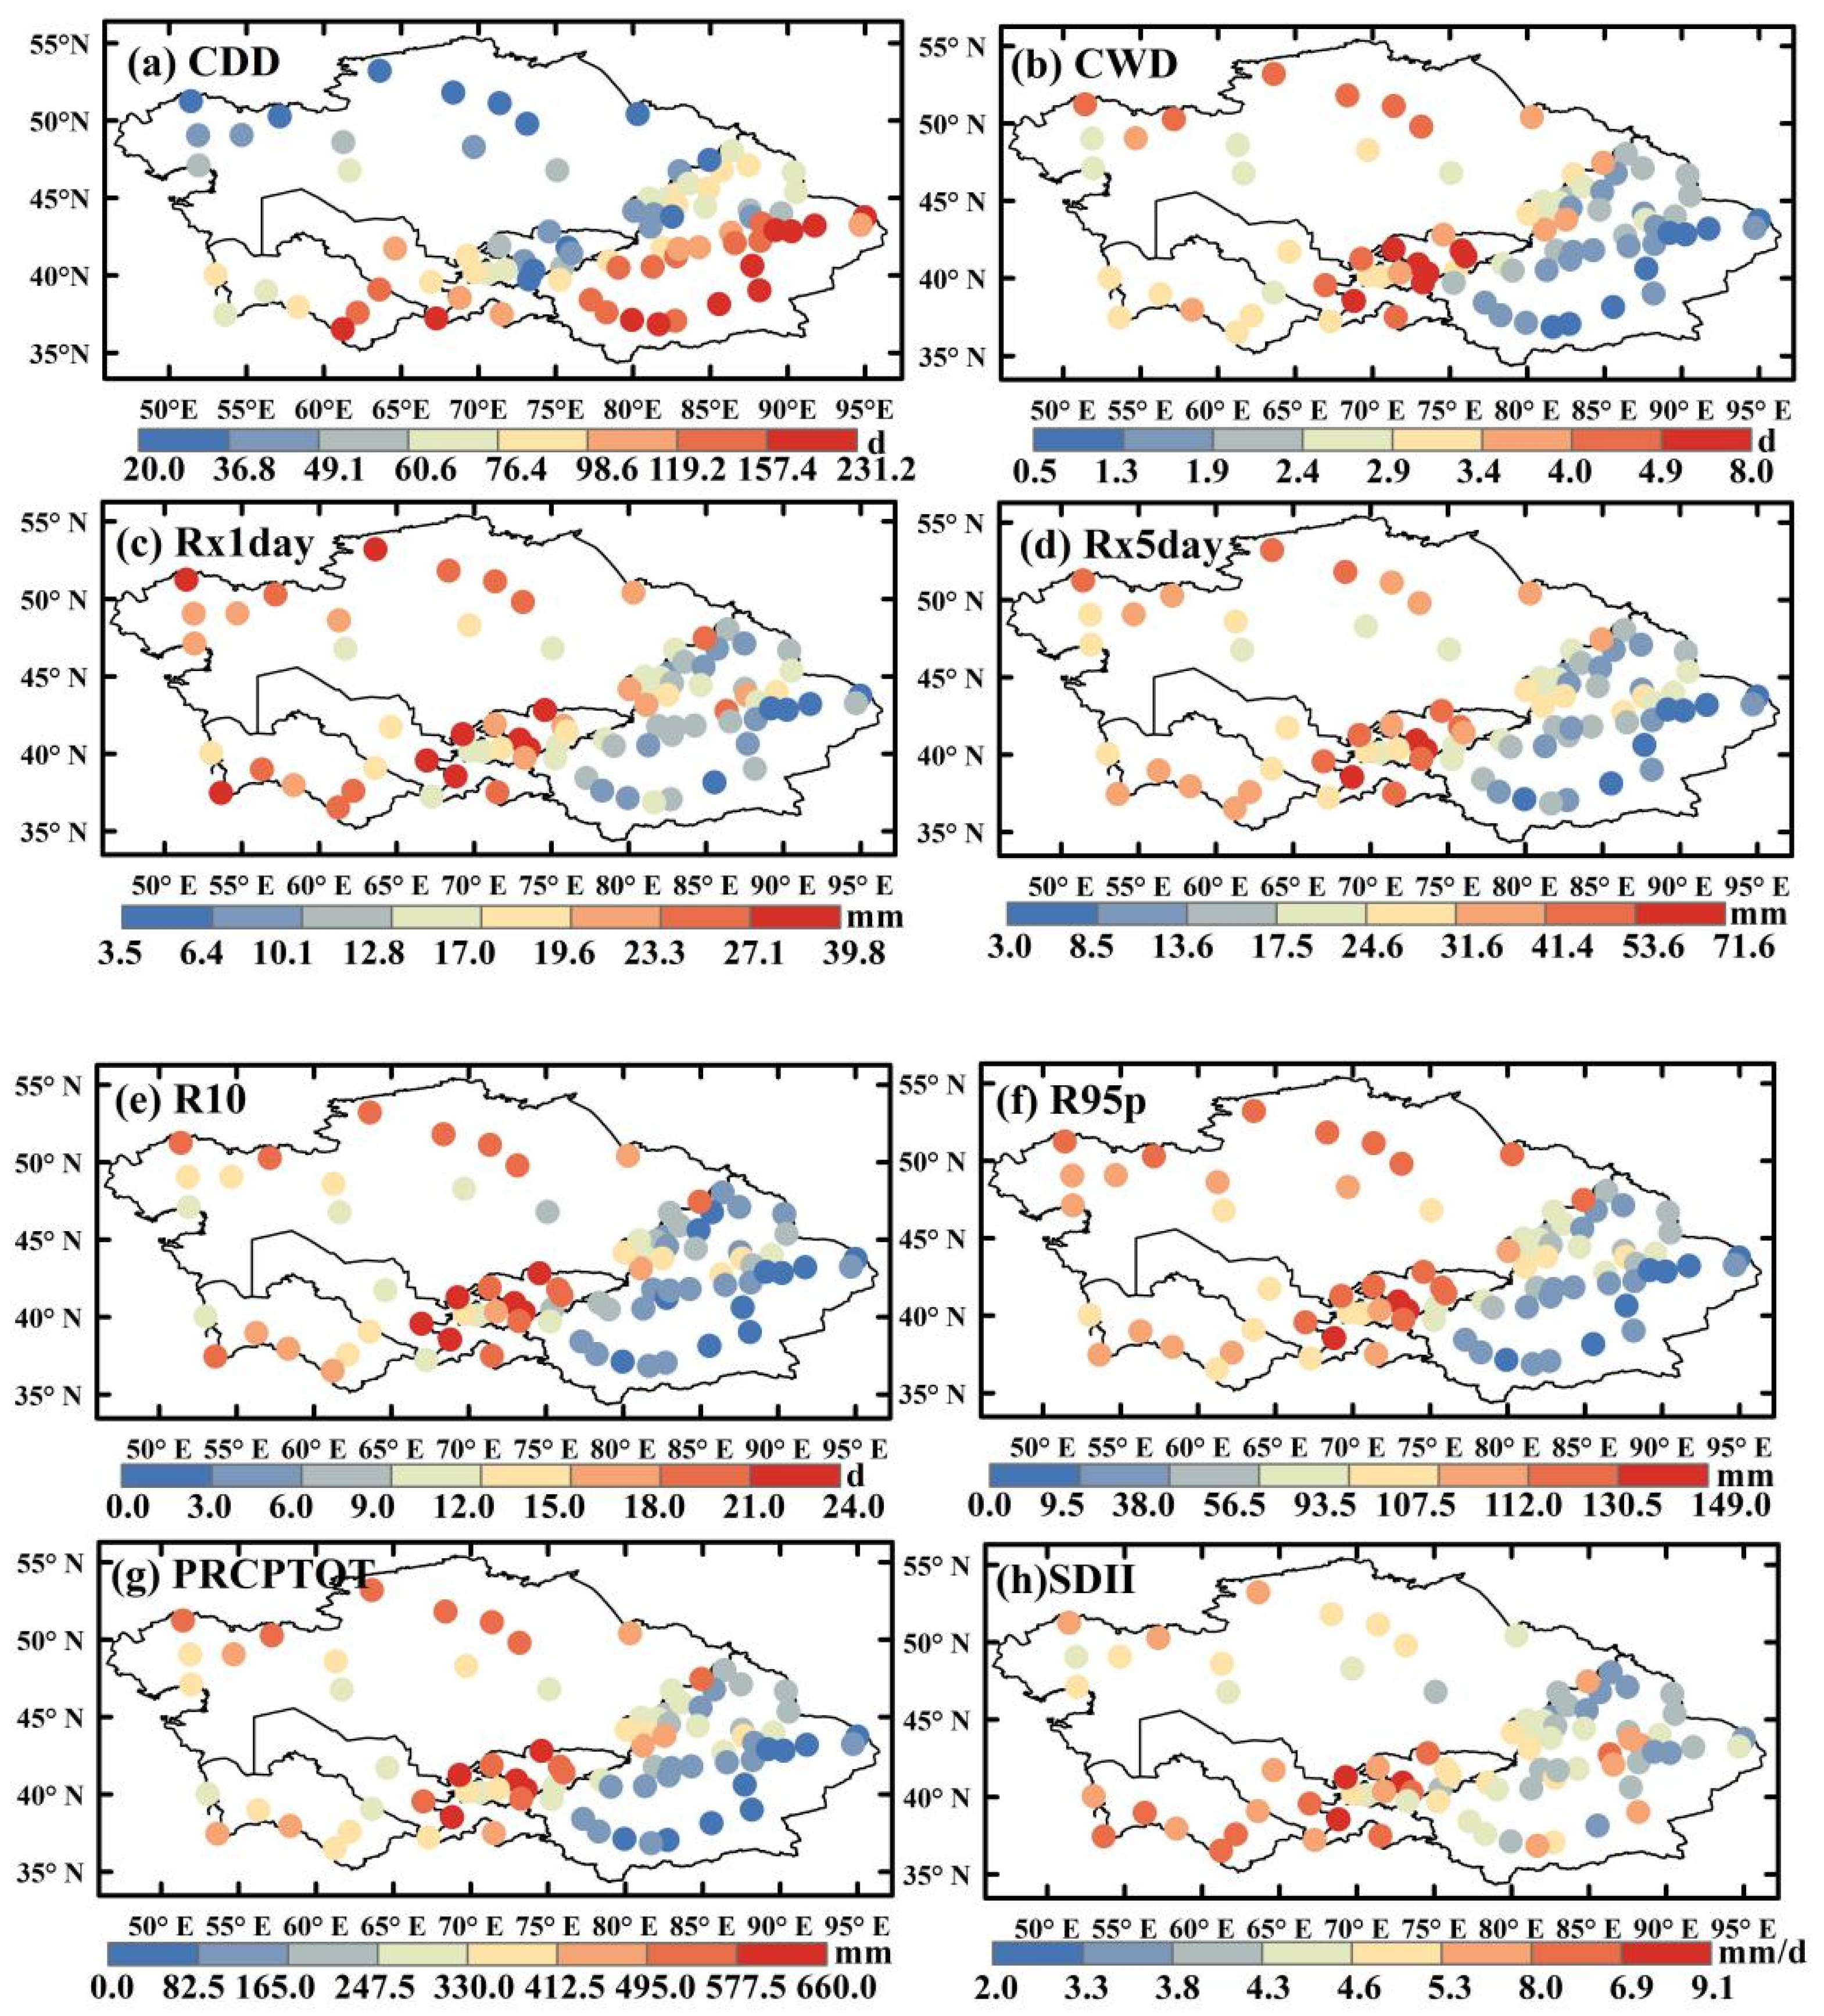
3.1. Changes of Precipitation Indices during 1979–2005

The annual series of eight precipitation indices during 1979–2005 (averaged over CA) obtained from CPC, ERA, and OBS are shown in Figure 2. CWDs exhibited a significant increasing trend by 0.1 days/10a at a 5% significance level. Those of Rx1day, Rx5day, R10, R95p, PRCPTOT and SDII showed increasing trends but not significant, with rates of 0.6 mm/10a, 1.1 mm/10a, 0.1 mm/10a, 3.3 mm/10a, 7.7 mm/10a and 0.1 (mm/days)/10a, respectively. On the contrary, CDDs decreased by −3.6 days/10a. The results suggested that the frequency, intensity, and duration of extreme precipitation in CA had increased during 1979–2005. From the nonlinear trend, we can infer that all indices (except for CDDs) show similar decadal variability. CDDs decreased from 1979 to the late 1980s, increased to the late 1990s, and then decreased again. The other seven indices showed opposite decadal variations.
Figure 3 shows the multi-year average of eight precipitation indices for the period 1979–2005 obtained from OBS at 84 stations in CA and their spatial distributions. Clearly, there are regional differences for each index. Figure 3a indicates that the number of CDDs is larger in the south (especially in TX and the south of XJ, over 100 days at most stations) and smaller in the north (especially in the north of KZ, below 45 days). The other seven indices exhibit similar spatial patterns (just with light differences for SDII), i.e., with larger values in central and western CA (i.e., five central Asian counties especially in KG, TI, and the north of KZ) and smaller values in eastern CA (i.e., XJ), as shown in Figure 3b–h, respectively. The largest values were up to 8.0 d, 39.8 mm, 71.6 mm, 23.0 d, 148.6 mm, 650.2 mm, and 9.1 mm/d for these seven indices, while the lowest values were 0.9 d, 3.6 mm, 3.7 mm, 0.1 d, 1.2 mm, 5.7 mm, and 2.3 mm/d, respectively. Overall, KG and TI were of higher values and XJ was of lower values of extreme precipitation.

3.2. Applicability Evaluation of Reanalysis Datasets for Precipitation Indices

As the daily OBS in CA cannot express the characteristics of extreme precipitation well in a longer period because of their poor quality, the gridded or reanalysis datasets offer good ways to update the estimation of climatic changes in CA. Due to the different performances of these datasets, it is necessary to evaluate which one (CPC or ERA) is more suitable to describe climate extremes in this area.
As shown in Figure 2, the values of eight precipitation indices obtained from CPC were unusual during 1979–1981. Therefore, we calculated the correlation coefficient (CC) of eight indices at all stations in the period of 1979–2005 and 1982–2005 between CPC/ERACPC and OBS, respectively. As shown in Table 2, there are few differences in CCs between ERA and OBS in all indices during two different periods. However, the CCs between CPC and OBS are significantly improved during 1982–2005, compared with those in 1979–2005. Considering CWDs, for example, the CC between ERA and OBS was 0.40 in both periods, while it was 0.26 during 1979–2005 and up to 0.60 during 1982–2005 for CPC. All CCs between CPC and OBS during 1982–2005 were higher and all significant at the 0.01 significance level, compared with those in ERA. This suggests that the CPC data since 1982 are of better quality.
Based on the above conclusions, the regional mean annual series of eight precipitation indices in the period of 1982–2005 obtained from ERA and CPC datasets were further evaluated by comparing their CCs and RMSEs with OBS in CA (Table 3). Clearly, all precipitation indices from two reanalysis datasets are significantly positively correlated with OBS (p < 0.01), which shows that reanalysis datasets can well describe the characteristics of extreme precipitation on a regional scale. For CCs, the values were from 0.60 to 0.84 for CPC, while those for ERA ranged from 0.25 to 0.62. The CPC PRCPTOT had the highest correlation with OBS, up to 0.84. The RMSE values are 30.81 d/a, 1.28 d/a, 8.24 mm/a, 10.58 mm/a, 1.71 d/a, 31.53 mm/a, 52.13 mm/a and 1.03 mm/d/a based on CPC, lower than those based on ERA. The results indicate that the CPC reanalysis data had smaller errors and a better representation of precipitation indices in CA than ERA.

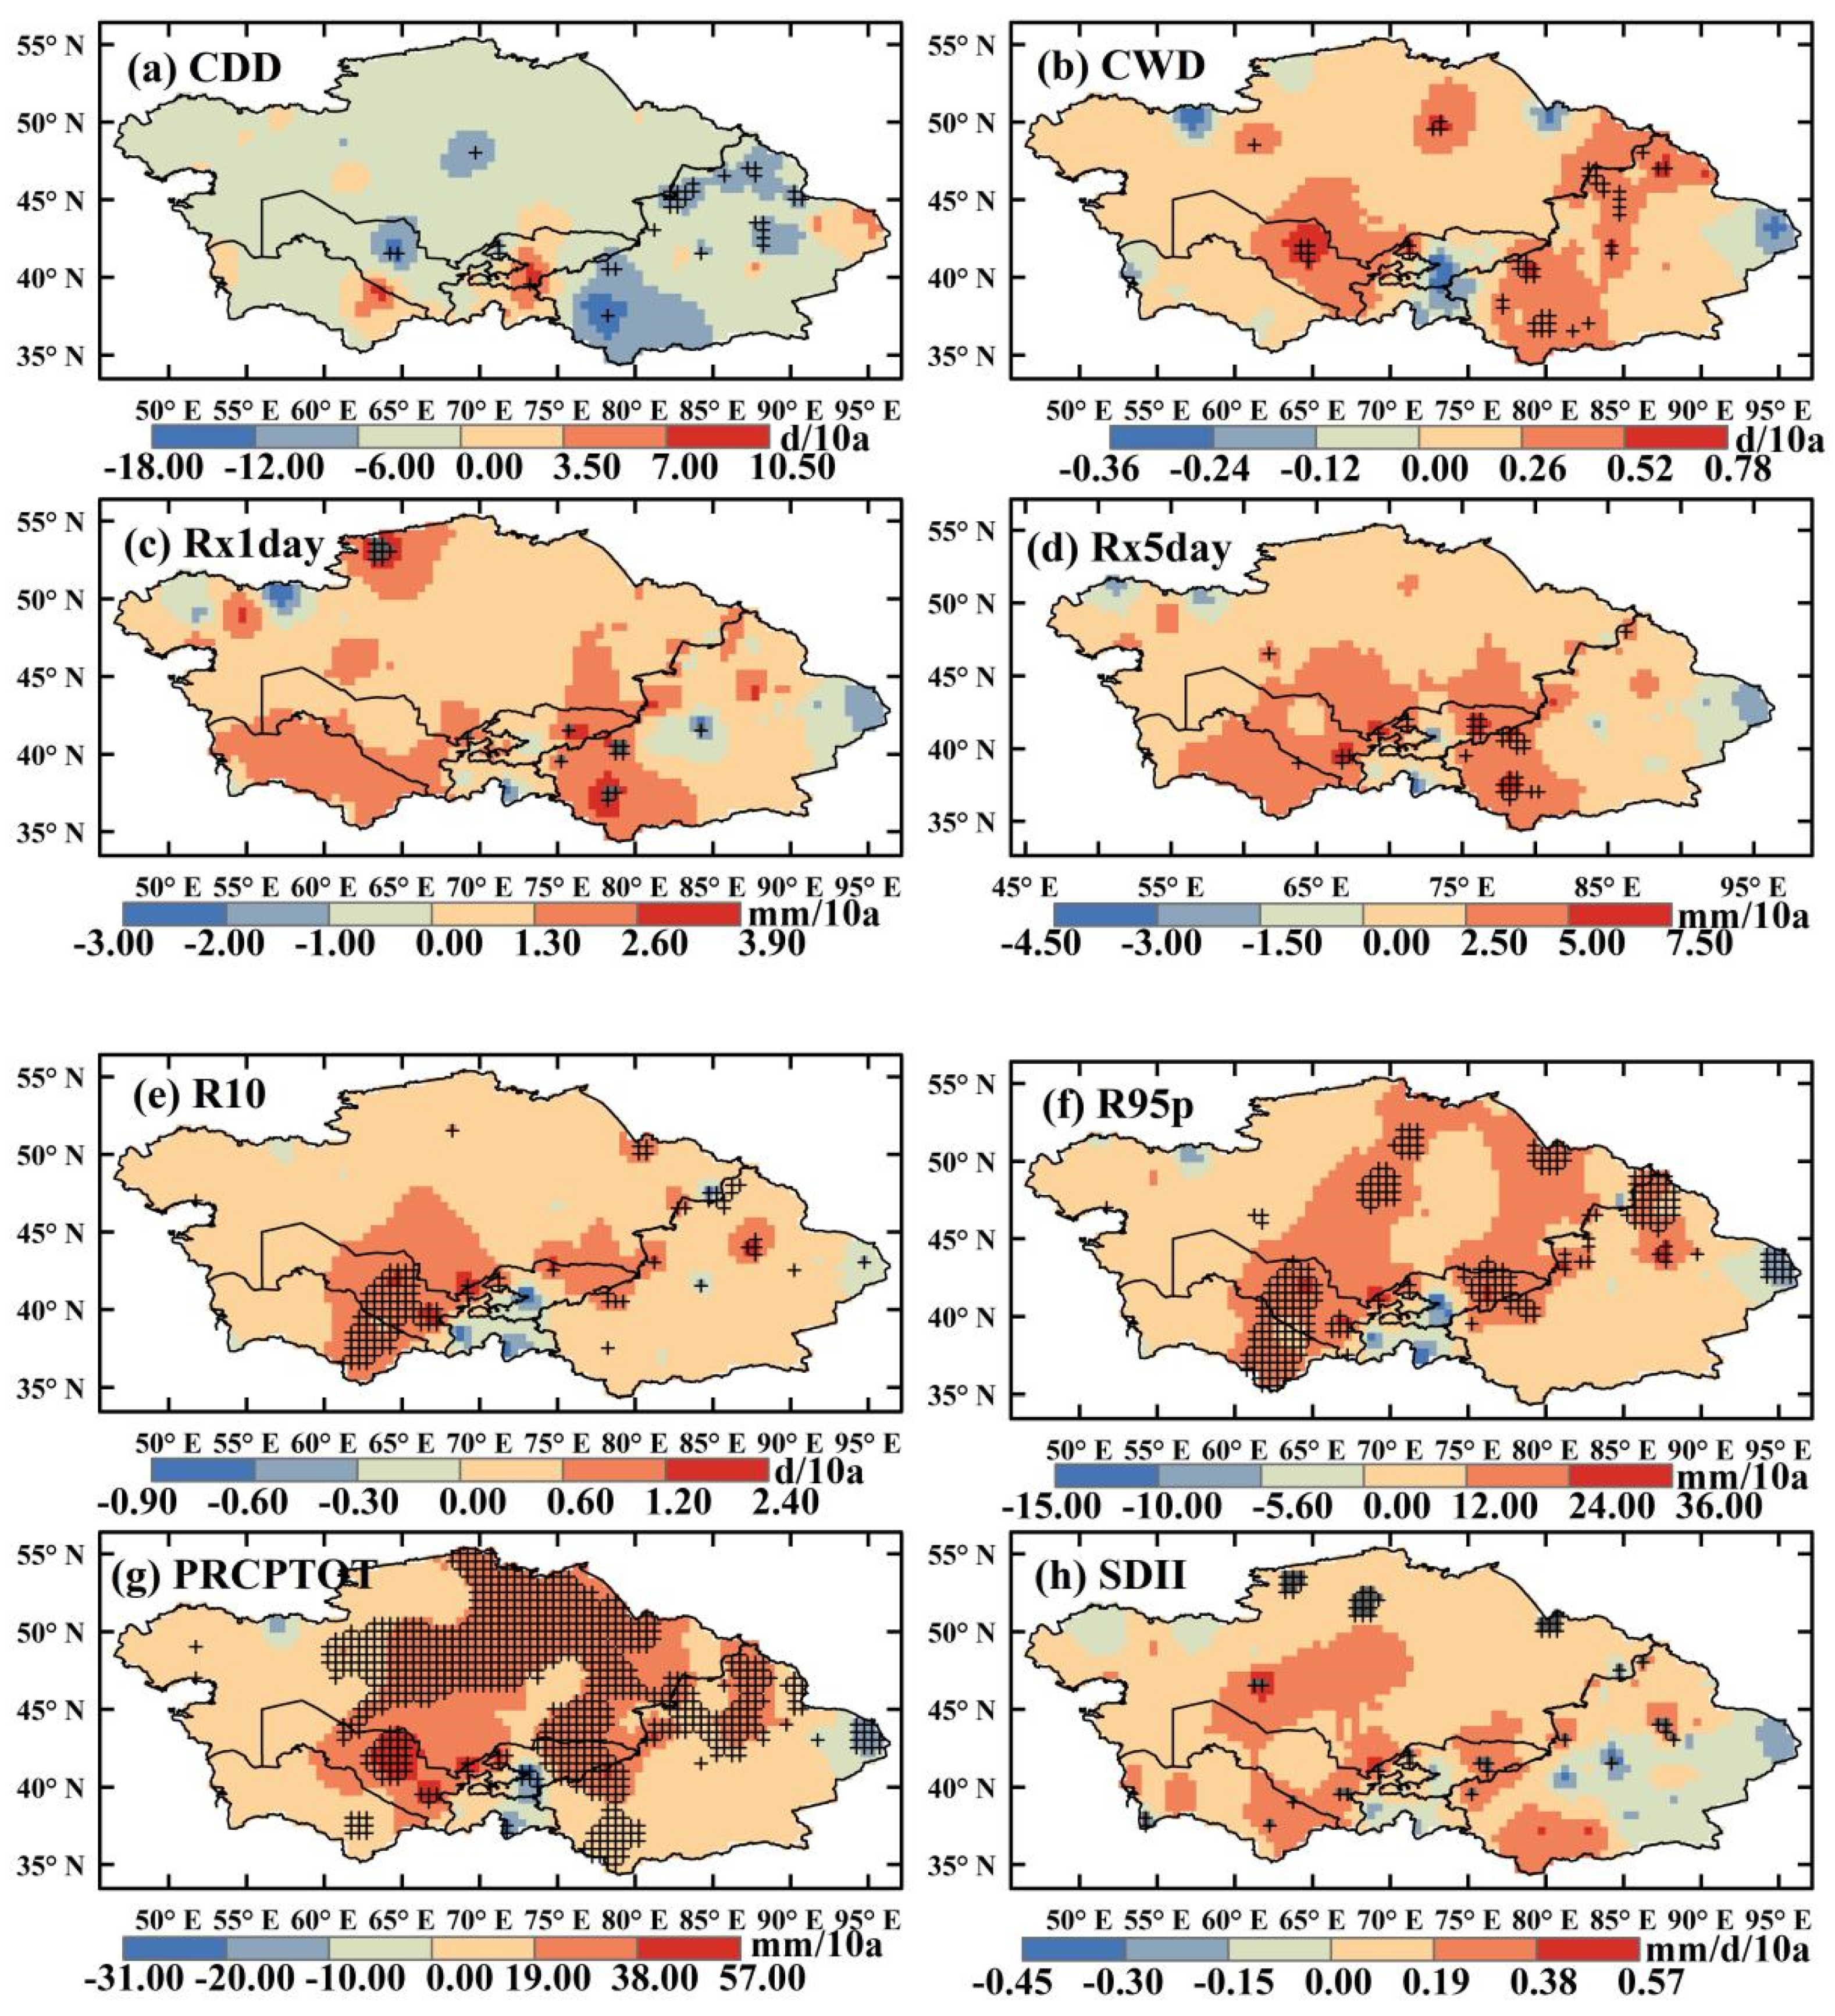
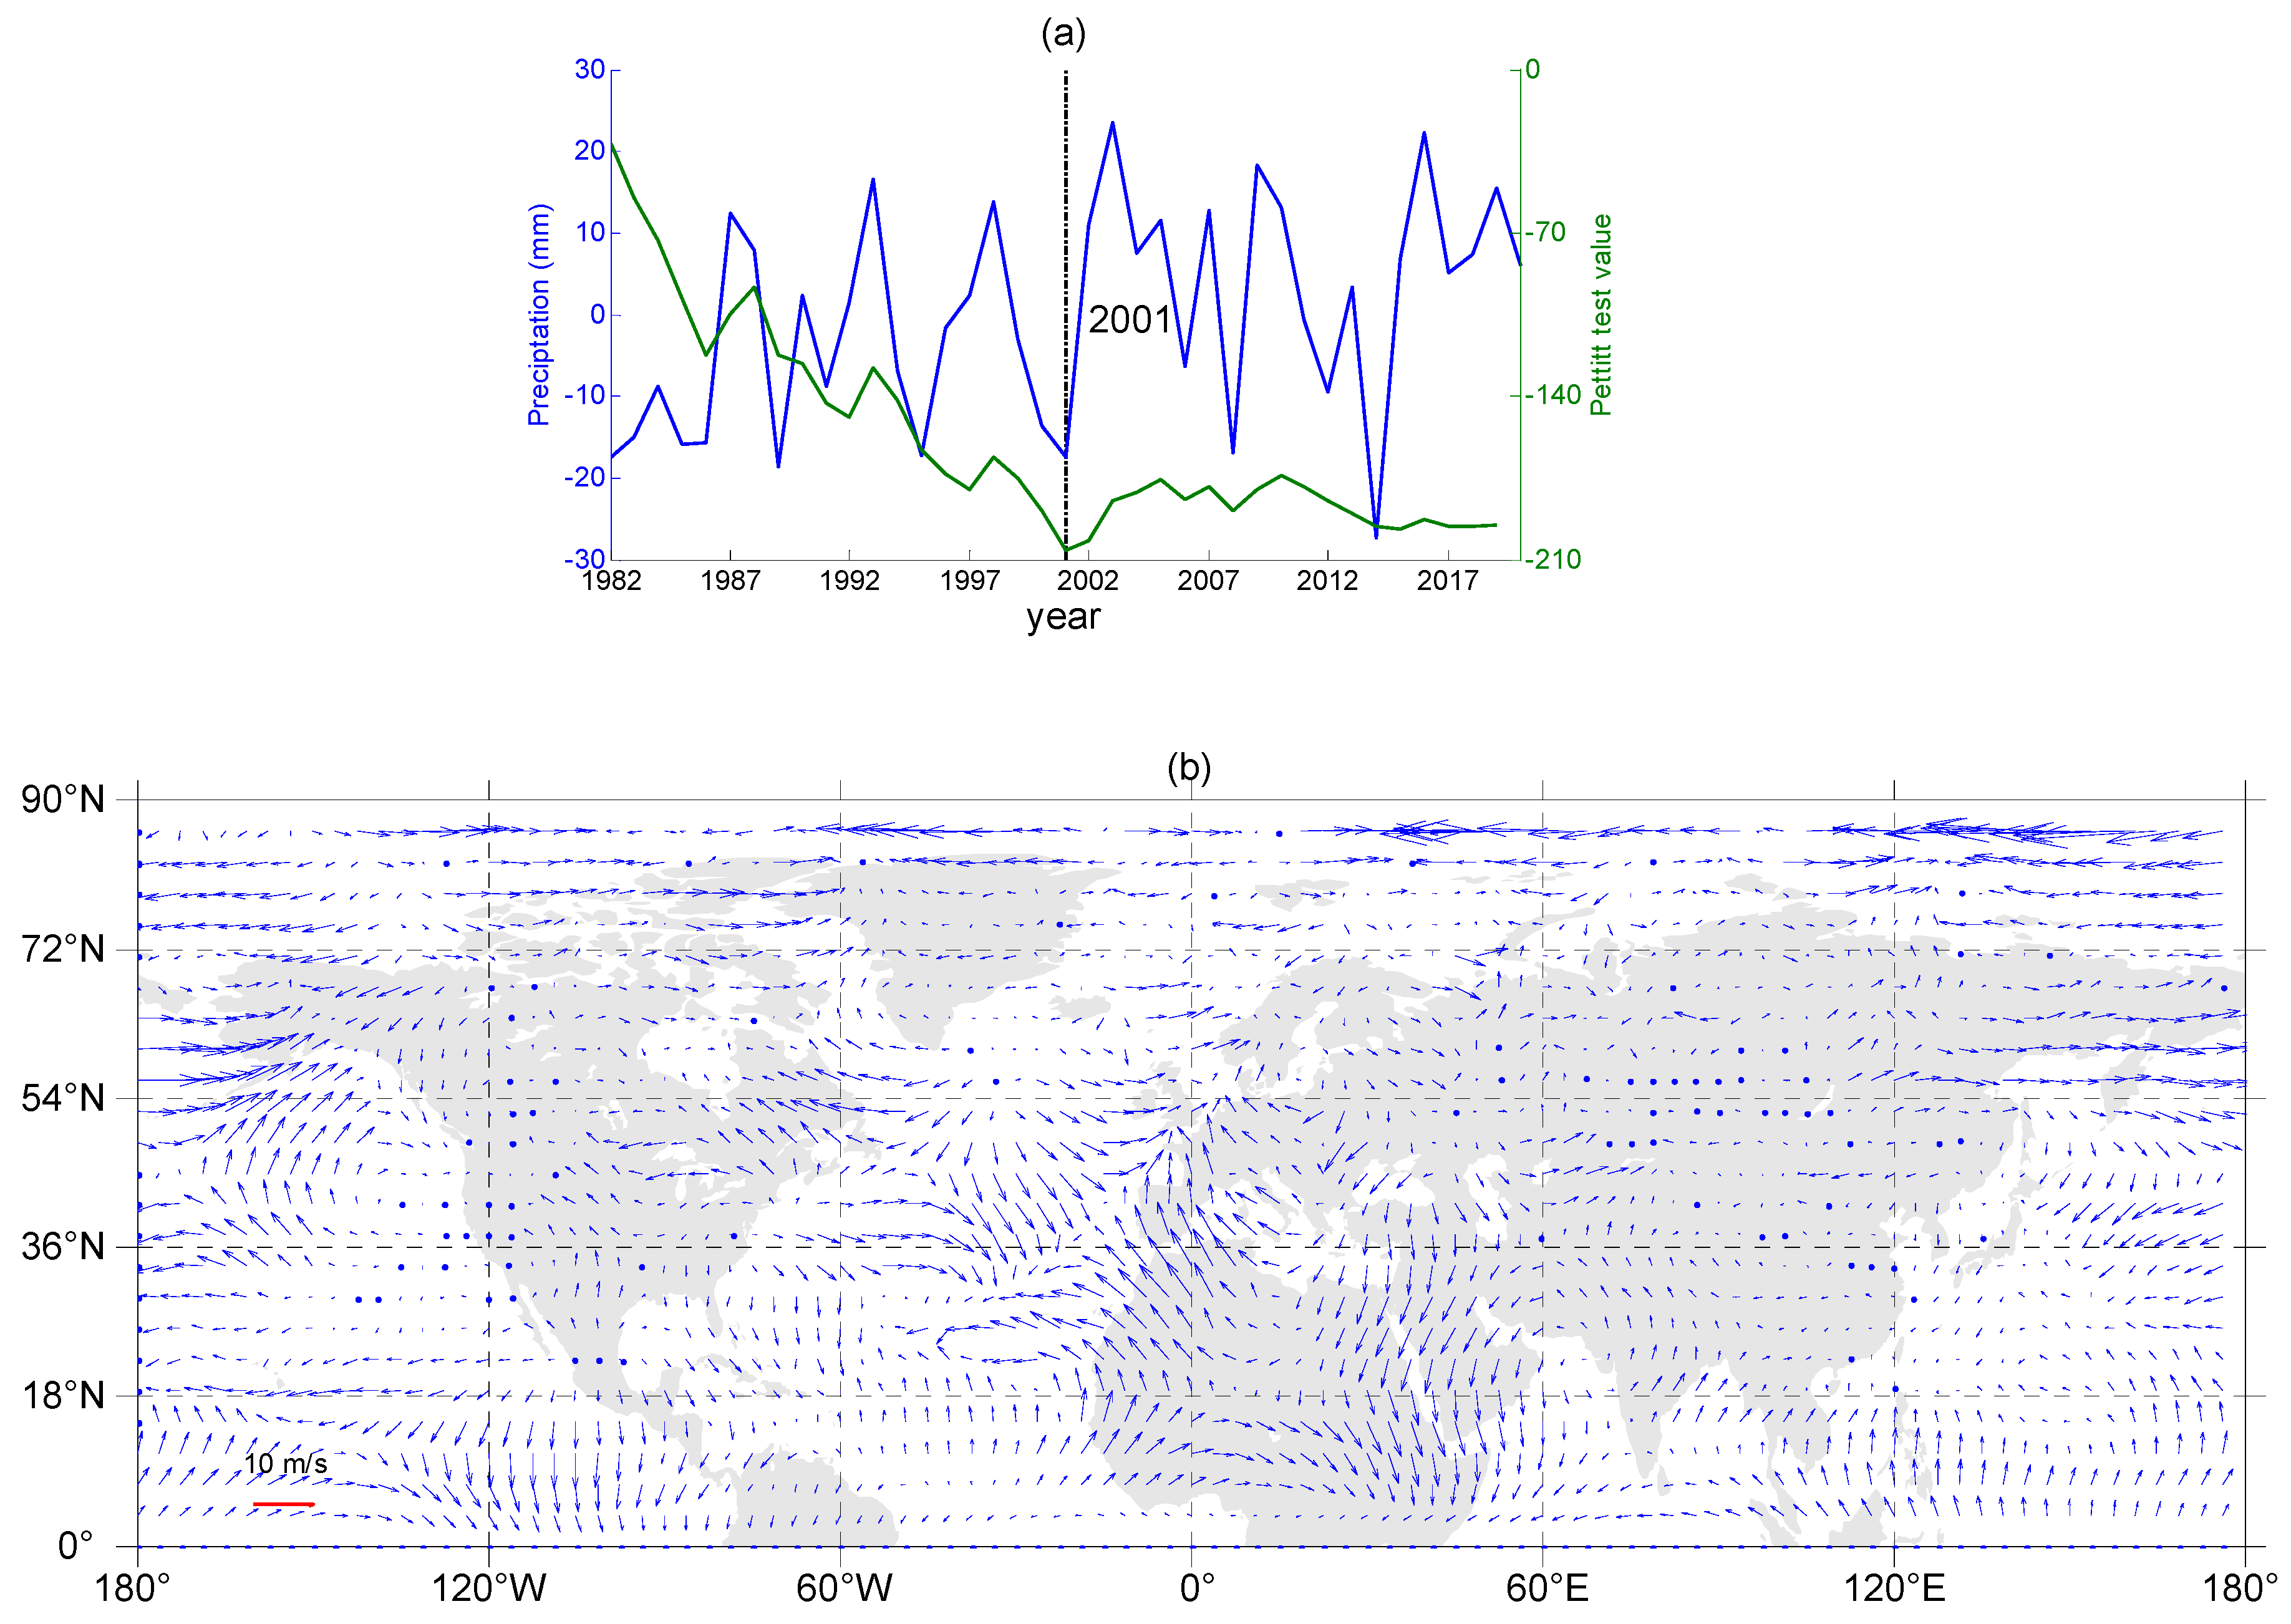
3.3. Temporal and Spatial Variations of Precipitation Indices in CA during 1982–2020

This section demonstrates the temporal-spatial variations of precipitation indices over CA in the most updated period (1982–2020) based on CPC. Figure 4 displays the regional mean annual series of eight precipitation indices in the last 39 years. The increasing trends were 0.2 d/10a, 0.9 mm/10a, 1.8 mm/10a, 0.3 d/10a, 8.4 mm/10a, 14.3 mm/10a and 0.1 (mm/d)/10a for CWDs, Rx1day, Rx5day, R10, R95P, PRCPTOT and SDII, respectively. Six of them are significant at the 0.01 level, while SDII is at the 0.05 level. In contrast, CDDs showed a significant negative trend (p < 0.05), with a rate of −3.1 d/10a. The nonlinear trends also indicate that CDDs decreased, and other seven indices increased but with more-or-less inter-decadal variations (Figure 4, blue line).
The geographical patterns of linear trends in the annual extreme index series during 1982–2020 in CA are shown in Figure 5. CDDs showed decreasing trends at 88.0% grids (significant at 1.4% grids mainly in XJ). Meanwhile, the grids with positive trends in the five CA countries were mainly located in KG, TI, and eastern TX (Figure 5a). CWDs, Rx1day, and Rx5day exhibited similar spatial patterns, with increasing trends at 89.3%, 90.0%, and 92.8% grids (significant at 2.0%, 0.8%, and 1.5% grids mainly over the southwest of XJ and the north of KZ (Figure 5b–d). For R10 (94.3%), R95P (94.4%), and PRCPTOT (95.2%), their trend patterns were basically consistent, i.e., over 94% grids experience increasing trends (significant at 5.0%, 11.4%, and 33.2% grids mainly located around the north of KZ, east of UZM and TX, and north of XJ (Figure 5e,f). SDII (83.2%) increased in most parts of CA, especially in southern XJ and central-western KZ (Figure 5h). In addition, there were two small-scale centers of negative trends, one in TI and the southwest of KG and the other in the easternmost part of XJ, for all indices except for CDDs.
Over all, besides CDDs, other seven regional mean annual precipitation indices exhibited significant increasing trends during 1982–2020, with significant increasing trends mainly in the west of XJ, north of KZ, and east of KG and decreasing trends in the south of KG, TI, and part of XJ.

3.4. Background Changes in Atmospheric Circulation

The precipitation season in CA is mainly concentrated in spring. Therefore, we firstly applied the Pettitt test to the regional mean spring precipitation series during 1982–2020 to detect the most prominent change point. The result showed that there was a significant change in 2001 (Figure 6a). The 5 years that had the least precipitation were 2014, 1989, 2001, 1982, and 1995, while the 5 years with the most precipitation were 2019, 1993, 2009, 2016, and 2003. Clearly, 4 of the 5 wettest years were after 2001, and 4 of the 5 driest years occurred in the earlier years.
Then, we analyzed the composite anomalies patterns of the 500-hPa geopotential height, and horizontal wind at 850-hPa in April, compared between the five wettest years and five driest years. Figure 6b indicates that there was an obvious low vortex circulation at 850-hPa to the east of the Caspian Sea, with the southerly winds from the Indian Ocean, favorable for transporting the water vapor required for precipitation into CA. This spring circulation pattern in favor of rainy CA occurred more frequently after 2001. Figure 6c suggests that there was a low-pressure regime at 500-hPa over CA in spring in the wettest years, which was conducive to the formation of vortex precipitation in the middle and lower troposphere. These form a large-scale background for explaining the increasing trends of precipitation extremes in CA in recent decades.

4. Conclusions and Discussions

In the present study, we evaluated the applicability of two widely used datasets (ERA and CPC) to describe extreme precipitation in CA during 1982–2005 by comparing observations and then analyzed temporal and spatial characteristics of extreme precipitation in CA based on CPC in recent decades (1982–2020). The main conclusions are summarized as follows:
(1) Based on OBS, the regional mean annual series of precipitation indices experienced increasing trends except for CDDs, which had a significant decreasing trend in CA during 1979–2005. The nonlinear trends based on EEMD also indicate that most indices (except CDDs) exhibited similar interdecadal variability, i.e., increased from 1979 to the late 1980s, decreased to the late 1990s, and then increased again. For the spatial pattern, seven indices (CWDs, Rx1day, Rx5day, R10, R95P, and PRCPTOT and SDII) showed similar characteristics, i.e., large in central and western of CA (especially in KG, TI, and north of KZ) and small in eastern (XJ). The number of CDDs was larger in the south and smaller in the north.
(2) Both of the used reanalysis datasets can reflect the spatial and temporal characteristics of extreme precipitation indices in CA to a certain extent. Compared with ERA, CPC is more suitable to describe extreme precipitation indices in CA, with larger CC and smaller RMSE between CPC and OBS.
(3) The long-term temporal and spatial variabilities during 1982–2020 were further analyzed based on CPC. CDDs decreased with a rate of −3.10 d/10a. The other seven precipitation indices increased with interdecadal variations. CWDs, Rx1day, Rx5day, R10, R95p and PRCPTOT exhibited significant increasing trends at the 0.01 level by 0.2 d/10a, 0.9 mm/10a, 1.8 mm/10a, 0.3 d/10, 8.4 mm/10a and 14.3 mm/10a, respectively. SDII increased with a rate of 0.4 mm/d/10a at the 0.05 level. Most grids (88.4%) showed negative trends in CDDs, significant at 1.3% grids. For other indices, the majority of grids (at least 83.2%) showed positive trends, especially for PRCPTOT (95.2%). For the spatial distribution pattern of trends, extreme precipitation indices showed increasing trends in most parts of CA over the last several decades, especially in most parts of KZ, east of UZM and TX, and parts of XJ, while decreasing trends appeared in the southern KG, TI, and small parts of XJ.
(4) A typical anomalous circulation pattern in spring (April) for the wettest years in CA includes negative 500-hPa height anomalies and a vortex circulation at 850-hpa wind field over CA. This typical circulation pattern occurred more frequently after 2001, forming a large-scale background for explaining the increasing levels of precipitation and extremes in CA during recent decades.
Frequent precipitation extremes have great impacts on energy and water supplies, human health, and agriculture. The dry/wet trend is a key issue in arid and semi-arid areas such as CA. Li et al. [30] found that the most significant drying trend was in northern KZ during 1960–2013. Zhang et al. [19] found wetting trends in the Tianshan Mountains, Kazakhskiy Melkosopochnik, the Kyzylkum Desert, and most of Xinjiang, and drying trends in the West Siberian Plain and the Turgay Valley. Chen et al. [10] indicated that northern Iran, southern Turkmenistan, and northern Afghanistan have experienced a slow but step-by-step decrease in precipitation since the 1980s. Zhong et al. [40] revealed that CA is vulnerable to forced global warming due to anthropogenic activity, which features a tripolar pattern with wetting–drying–wetting responses, arranged from southeast to northwest, and shows strong interdecadal-to-interannual amplitude variations. Generally, the response of regional extreme precipitation to climatic warming is complicated in CA. How much water vapor supplies change with the westerly circulation changes is one of the most important factors affecting precipitation extremes in CA [10]. Extreme precipitation over CA tended to be modulated by PDO through an excited wave train in the mid-high latitudes of the Northern Hemisphere and possibly demonstrated a dipole pattern with intensified and reduced rainfalls in northwest and southeast of this region, respectively, during a warm PDO phase [41]. Although there are some differences among different studies due to different data sources, analysis methods, time periods, etc., our results serve as updated assessments of extreme precipitation indices and trends in CA and offer new references to policymakers for the adaptation of climate change regarding changing precipitation extremes in CA.

Author Contributions

Conceptualization, Y.T. and Z.L.; methodology, Y.T. and Z.L.; software, Y.T.; validation, Z.Y.; formal analysis, Z.L.; investigation, Z.Y.; resources, Z.L.; data curation, Y.T.; writing—original draft preparation, Y.T.; writing—review and editing, Z.Y. and Z.L.; visualization, Y.T.; supervision, Z.L.; project administration, Z.L.; funding acquisition, Z.Y. All authors have read and agreed to the published version of the manuscript.

Funding

This study was supported by the Strategic Priority Research Program of the Chinese Academy of Sciences (XDA20020201), the National Key R&D Program of China (2017YFE0133600), and the National Natural Science Foundation of China (41975115).

Institutional Review Board Statement

Not applicable.

Informed Consent Statement

Not applicable.

Data Availability Statement

Publicly available datasets were analyzed in this study. Observed daily data in Xinjiang, China was provided by the China Meteorological Administration (http://data.cma.cn, accessed on 17 November 2021). The data are not publicly available due to privacy or ethical concerns. Observed GHCN daily data in Central Asian countries can be found here: ftp://ftp.ncdc.noaa.gov/pub/data/ghcn/daily/ (accessed on 17 November 2021). Gridded data (CPC) can be found here: https://psl.noaa.gov/data/gridded/data.cpc.globalprecip.html (accessed on 17 November 2021). Reanalysis data (ERA) and ERA5 can be found https://apps.ecmwf.int/datasets/data/interim-full-daily/levtype=sfc/ (accessed on 17 November 2021) and https://cds.climate.copernicus.eu/cdsapp#!/dataset/reanalysis-era5-pressure-levels-monthly-means?tab=form (accessed on 17 November 2021), respectively.

Conflicts of Interest

The authors declare no conflict of interest.

Abbreviations

CACentral Asia
CPCClimate Prediction Center
ERAERA Interim
KZKazakhstan
KGKyrgyzstan
TITajikistan
TXTurkmenistan
UZMUzbekistan
XJXinjiang Uygur Autonomous Region in China
CDDsConsecutive dry days
CWDsConsecutive wet days
Rx1dayMax1-day precipitation amount
Rx5dayMax5-day precipitation amount
R10Number of heavy precipitation days
R95pVery wet days
PRCPTOTAnnual total precipitation in wet days
SDIISimple precipitation intensity index
CCsCorrelation coefficients
RMSERoot-mean-squared error
OBSObservation

References

  1. Watts, G.; Battarbee, R.W.; Bloomfield, J.P.; Crossman, J.; Daccache, A.; Durance, I.; Elliott, J.A.; Garner, G.; Hannaford, J.; Hannah, D.M.; et al. Climate change and water in UK-past changes and future prospects. Prog. Phys. Geogr. 2015, 39, 6–28. [Google Scholar] [CrossRef]
  2. Hossain, F.; Jeyachandran, I.; Pielke Sr, R. Dam safety effects due to human alteration of extreme precipitation. Water Resour. Res. 2010, 46, W03301. [Google Scholar] [CrossRef]
  3. Hossain, F.; Arnold, J.; Beighley, E.; Brown, C.; Burian, S.; Chen, J.; Shahrbanou, M.; Mitra, A.; Niyogi, D.; Pielke Sr, R.; et al. Local-to-regional landscape drivers of extreme weather and climate: Implications for water infrastructure resilience. J. Hydrol. Eng. 2015, 20, 02515002. [Google Scholar] [CrossRef] [Green Version]
  4. Shepherd, J.M.; Shem, W.; Manyin, M.; Hand, L.; Messen, D. Modeling Urban effects on the precipitation component of the water cycle. In Geospatial Analysis and Modeling of Urban Environments; Jiang, B., Yao, X., Eds.; Springer Book Series and GIScience: Dordrecht, Netherlands, 2010; p. 445. [Google Scholar]
  5. Shepherd, J.M.; Burian, S.J.; Jin, M.; Liu, C.; Johnson, B. Two decades of urban hydroclimatological studies have yielded discovery and societal benefits. In Satellite Precipitation Measurement, Advances in Global Change Research; Levizzani, V., Kidd, C., Kirschbaum, D., Kummerow, C., Nakamura, K., Turk, F., Eds.; Springer: Cham, Switzerland, 2020; Volume 67. [Google Scholar]
  6. National Research Council. Radiative Forcing of Climate Change: Expanding the Concept and Addressing Uncertainties; The National Academies Press: Washington, DC, USA, 2005; p. 208. [Google Scholar]
  7. Siegfried, T.; Bernauer, T.; Guiennet, R.; Sellars, S.; Robertson, A.W.; Mankin, J.; Bauer-Gottwein, P.; Yakovlev, A. Will climate change exacerbate water stress in Central Asia? Clim. Chang. 2012, 112, 881–899. [Google Scholar] [CrossRef]
  8. Zhao, J.; Su, B.; Mondal, S.K.; Wang, Y.; Tao, H.; Jiang, T. Population exposure to extreme precipitations in the Indus River Basin at 1.5 °C 2.0 °C and 3.0 °C warming levels. Adv. Clim. Chang. Res. 2021, 12, 199–209. [Google Scholar] [CrossRef]
  9. Pielke, R., Jr. The Rightful Place of Science: Disasters and Climate Change; Arizona State University’s Consortium for Science, Policy, & Outcomes: Arizona, AZ, USA, 2014; p. 124. [Google Scholar]
  10. Chen, F.; Huang, W.; Jin, L.; Chen, J.; Wang, J. Spatiotemporal precipitation variations in the arid Central Asia in the context of global warming. Sci. China Earth Sci. 2011, 54, 1812–1821. [Google Scholar] [CrossRef]
  11. Grave, P.; Orlowsky, B.; Mueller, B.; Sheffiled, J.; Reichstein, M.; Senevratne, S.I. Global assessment of trends in wetting and drying over land. Nat. Geosci. 2014, 7, 716–742. [Google Scholar] [CrossRef]
  12. Sun, F.; Roderick, M.L.; Farquhar, G.D. Changes in the variability of global land precipitation. Geophys. Res. Lett. 2012, 39, L19402. [Google Scholar] [CrossRef] [Green Version]
  13. Donat, M.G.; Lowry, A.L.; Alexander, L.V.; O’Gorman, P.A.; Maher, N. More extreme precipitation in the world’s dry and wet regions. Nat. Clim. Chang. 2017, 6, 154–158. [Google Scholar] [CrossRef] [Green Version]
  14. Wang, H.; Chen, Y.; Xun, S.; Lai, D.; Fan, Y.; Li, Z. Changes in daily climate extremes in the arid area of northwestern China. Theor. Appl. Clim. 2013, 112, 15–28. [Google Scholar] [CrossRef]
  15. IPCC. 2021: Summary for Policymakers. In Climate Change 2021: The Physical Science Basis. Contribution of Working Group I to the Sixth Assessment Report of the Intergovernmental Panel on Climate Change; Cambridge University Press: Cambridge, UK, 2021; in press. [Google Scholar]
  16. Xu, L.; Zhou, H.; Du, L.; Yao, H.; Wang, H. Precipitation trends and variability from 1950 to 2000 in arid lands of Central Asia. J. Arid Land 2015, 7, 514–526. [Google Scholar] [CrossRef] [Green Version]
  17. Hu, Z.; Zhou, Q.; Chen, X.; Cheng, Q.; Wang, S.; Li, J. Variations and changes of annual precipitation in Central Asia over the last century. Int. J. Climatol. 2017, 37 (Suppl. 1), 157–170. [Google Scholar] [CrossRef]
  18. Zhang, M.; Chen, Y.; Shen, Y.; Chen, J.; Zhao, Y.; Tuoliewubieke, D.; Li, J.; Yang, L.; Mao, W. Changes of extreme precipitation in arid Central Asia. Quat. Int. 2017, 436, 16–27. [Google Scholar] [CrossRef]
  19. Zhang, M.; Chen, Y.; Shen, Y.; Li, B. Tracking climate change in Central Asia through temperature and precipitation extremes. J. Geog. Sci. 2019, 20, 3–28. [Google Scholar] [CrossRef] [Green Version]
  20. Reinhard, S.; Lüthi, D.; Vidale, P.L.; Schär, C. The precipitation climate of central Asia—Intercomparison of observational and numerical data sources in a remote semiarid region. Int. J. Climatol. 2008, 28, 295–314. [Google Scholar]
  21. Donat, M.G.; Sillmann, J.; Wild, S.; Alexander, L.V.; Lippmann, T.; Zwiers, F.W. Consistency of Temperature and Extreme precipitations across Various Global Gridded in Situ and Reanalysis Datasets. J. Clim. 2014, 27, 5017–5035. [Google Scholar] [CrossRef]
  22. Hu, L.; Huang, G.; Hu, K. The performance of multiple datasets in characterizing the changes of extreme air temperature over China during 1979 to 2012. Theor. Appl. Climatol. 2018, 133, 619–632. [Google Scholar] [CrossRef]
  23. Zhou, B.; Xu, Y.; Wu, J.; Dong, S.; Shi, Y. Changes in temperature and extreme precipitation indices over China: Analysis of a high-resolution grid dataset. Int. J. Climatol. 2016, 36, 1051–1066. [Google Scholar] [CrossRef]
  24. Song, S.; Bai, J. Increasing winter precipitation over arid Central Asia under global warming. Atmosphere 2016, 7, 139. [Google Scholar] [CrossRef] [Green Version]
  25. Hu, Z.; Hu, Q.; Zhang, C.; Chen, X.; Li, Q. Evaluation of reanalysis, spatially-interpolated and satellite remotely-sensed precipitation datasets in Central Asia. J. Geophys. Res. Atmos. 2016, 121, 5648–5663. [Google Scholar] [CrossRef] [Green Version]
  26. Chen, X.; Wang, S.; Hu, Z.; Zhou, Q.; Hu, Q. Spatiotemporal characteristics of seasonal precipitation and their relationships with ENSO in Central Asia during 1901–2013. J. Geog. Sci. 2018, 28, 1341–1368. [Google Scholar] [CrossRef] [Green Version]
  27. Cao, L.; Chen, X.; Zhang, C.; Kurban, A.; Yuan, X.; Pan, T.; Maeyer, P.D. The Temporal and Spatial Distributions of the Near-Surface CO2 Concentrations in Central Asia and Analysis of Their Controlling Factors. Atmophere 2017, 8, 85. [Google Scholar] [CrossRef] [Green Version]
  28. Yao, J.; Chen, J.; Zhang, T.; Dilinuer, T.; Mao, W. Stationarity in the variability of arid precipitation: A case study of arid Central Asia. Adv. Clim. Chang. Res. 2021, 12, 172–186. [Google Scholar] [CrossRef]
  29. He, H.; Luo, G.; Cai, P.; Hamdi, R.; Termonia, P.; Maeyer, P.D.; Kurban, A.; Li, J. Assessment of Climate Change in Central Asia from 1980 to 2100 Using the Köppen-Geiger Climate Classification. Atmophere 2021, 12, 123. [Google Scholar] [CrossRef]
  30. Li, Z.; Chen, Y.; Li, W.; Deng, H.; Fang, G. Potential impacts of climate change on vegetation dynamics in Central Asia. J. Geophys. Res. Atmos. 2015, 120, 12345–12356. [Google Scholar] [CrossRef]
  31. Dee, D.P.; Uppala, S.M.; Simmons, A.J.; Berrisford, P.; Poli, P.; Kobayashi, S.; Andrae, U.; Balsamo, G.; Bauer, P.; Bechtold, P.; et al. The ERA-Interim reanlysis: Configuration and performance of the data assimilation system. Q. J. R. Meteorol. Soc. 2011, 137, 553–597. [Google Scholar] [CrossRef]
  32. Frich, P.; Alexander, L.V.; Della-Marta, P.; Gleason, B.; Haylock, M.; Klein Tank, A.M.G.; Peterson, T. Observed coherent changes in climatic extremes during the second half of the twentieth century. Clim. Res. 2002, 19, 193–212. [Google Scholar] [CrossRef] [Green Version]
  33. Hu, Z.; Zhou, Q.; Chen, X.; Li, J.; Li, Q.; Chen, D.; Liu, W.; Yin, G. Evaluation of three global gridded precipitation data sets in central Asia based on rain gauge observation. Int. J. Climatol. 2018, 38, 3475–3493. [Google Scholar] [CrossRef]
  34. Guo, H.; Chen, S.; Bao, A.; Hu, J.; Gebregiorgis, A.S.; Xue, X.; Zhang, X. Inter-comparison of high-resolution satellite precipitation products over central Asia. Remote Sens. 2015, 7, 7181–7212. [Google Scholar] [CrossRef] [Green Version]
  35. Pettitt, A.N. A non-parametric approach to the changepoint problem. J. R. Stat. Soc. C (Appl. Stat.) 1979, 28, 126–135. [Google Scholar]
  36. Mallakpour, I.; Gabriele, V. A simulation study to examine the sensitivity of the Pettitt test to detect abrupt changes in mean. Hydrol. Sci. J. 2016, 61, 245–254. [Google Scholar] [CrossRef] [Green Version]
  37. Herrera-Grimaldi, P.; García-Marín, A.; Ayuso-Muñoz, J.L.; Flamini, A.; Morbidelli, R.; Ayuso-Ruíz, J.L. Detection of trends and break points in temperature: The case of Umbria (Italy) and Guadalquivir Valley (Spain). Acta Geophys. 2018, 66, 329–343. [Google Scholar] [CrossRef]
  38. Amiri, M.A.; Mesgari, M.S. Modeling the spatial and temporal variability of precipitation in northwest Iran. Atmosphere 2017, 8, 254. [Google Scholar] [CrossRef] [Green Version]
  39. Huang, N.E.; Wu, Z. A review on Hilbert-Huang Transform: The method and its applications on geophysical studies. Rev. Geophys. 2008, 46, RG2006. [Google Scholar] [CrossRef] [Green Version]
  40. Zhong, L.H.; Hua, L.J.; Yao, Y.; Feng, J.M. Interdecadal aridity variations in Central Asia during 1950–2016 regulated by oceanic conditions under the background of global warming. Clim. Dyn. 2021, 56, 3665–3686. [Google Scholar] [CrossRef]
  41. Wei, W.G.; Yan, Z.W.; Li, Z. Influence of Pacific Decadal Oscillation on global precipitation extremes. Environ. Res. Lett. 2021, 16, 044031. [Google Scholar] [CrossRef]
Figure 1. The topographic map and geographical distribution of chosen stations in CA. The dots indicate locations of meteorological stations and each color represents groups with different lengths of available daily precipitation records used in the present study.
Atmosphere 13 00060 g001
Figure 2. Annual precipitation indices series in CA during 1979–2005. Black, magenta, and cyan lines indicate OBS, ERA, and CPC, respectively. Red and blue lines indicate linear and nonlinear trends of OBS: (a) CDDs; (b) CWDs; (c) Rx1day; (d) Rx5day; (e) R10; (f) R95P; (g) PRCPTOT; (h) SDII.
Atmosphere 13 00060 g002
Figure 3. Geographical distribution of multi-year average of eight precipitation indices at 84 stations in CA during 1979–2005: (a) CDDs; (b) CWDs; (c) Rx1day; (d) Rx5day; (e) R10; (f) R95P; (g) PRCPTOT; (h) SDII.
Atmosphere 13 00060 g003
Figure 4. Annual series of regional mean extreme precipitation indices during 1982–2020 (black line). Red and blue lines indicate linear and nonlinear trends, respectively: (a) CDDs; (b) CWDs; (c) Rx1day; (d) Rx5day; (e) R10; (f) R95P; (g) PRCPTOT; (h) SDII.
Atmosphere 13 00060 g004
Figure 5. Geographical patterns of linear trends of annual extreme indices series obtained from CPC during 1982–2020 in CA, where the cross symbols denote significance at the 0.05 level: (a) CDDs; (b) CWDs; (c) Rx1day; (d) Rx5day; (e) R10; (f) R95P; (g) PRCPTOT; (h) SDII.
Atmosphere 13 00060 g005
Figure 6. (a) Pettitt test statistic for regional mean spring precipitation series in CA; (b) the composite anomalous patterns of horizontal wind at 850-hPa; (c) patterns for 500-hPa geopotential height between five years of the largest rainfall and five years of the least rainfall. The anomalies were calculated against the mean climatology for 1982–2020.
Atmosphere 13 00060 g006aAtmosphere 13 00060 g006b
Table 1. Definitions of eight precipitation indices.
IndiceDescriptive NameDefinitionsUnit
CDDsConsecutive dry daysAnnual maximum number of consecutive days with daily precipitation <1 mmd
CWDsConsecutive wet daysAnnual maximum number of consecutive days with daily precipitation ≥1 mmd
Rx1dayMax1-day precipitation amountAnnual maximum 1day precipitationmm
Rx5dayMax5-day precipitation amountAnnual maximum consecutive 5 days precipitationmm
R10Number of heavy precipitation daysAnnual count of days when daily precipitation ≥10 mmd
R95pVery wet daysAnnual total precipitation when daily precipitation >95th percentilemm
PRCPTOTAnnual total precipitation in wet daysAnnual total precipitation in wet days with daily precipitation ≥1 mmmm
SDIISimple precipitation intensity indexAnnual total precipitation in wet days divided by number of these days with daily precipitation ≥1 mmmm/d
Table 2. The CCs of eight precipitation indices between ERA/CPC and OBS in periods of 1979–2005 and 1982–2005.
IndicesERA-OBS
(1979–2005)
ERA-OBS
(1982–2005)
CPC-OBS
(1979–2005)
CPC-OBS
(1982–2005)
CDDs0.58 **0.58 **0.71 **0.93 **
CWDs0.40 *0.40 *0.260.60 **
Rx1day0.63 **0.63 **0.42 *0.78 **
Rx5day0.61 **0.63 **0.51 **0.82 **
R100.73 **0.75 **0.69 **0.85 **
R95p0.83 **0.84 **0.59 **0.90 **
PRCPTOT0.84 **0.84 **0.57 **0.91 **
SDII0.64 **0.68 **0.66 **0.81 **
* or ** indicates CC is statistically significant at the 0.05 or 0.01 level.
Table 3. CC and RMSE of eight regional mean annual precipitation series obtained from ERA/CPC and OBS in CA during 1982–2005.
IndicesCC
(ERA-OBS)
RMSE
(ERA-OBS)
CC
(CPC-OBS)
RMSE
(CPC-OBS)
CDDs0.62 **34.820.79 **30.81
CWDs0.25 **3.010.60 **1.28
Rx1day0.34 **8.580.59 **8.24
Rx5day0.43 **17.000.68 **10.58
R100.36 **6.660.73 **1.71
R95p0.46 **70.130.73 **31.53
PRCPTOT0.51 **195.400.84 **52.13
SDII0.32 **1.080.60 **1.03
** indicates CC is statistically significant at the 0.01 level.
Publisher’s Note: MDPI stays neutral with regard to jurisdictional claims in published maps and institutional affiliations.

