Abstract
This study aims to evaluate the thermal field of the central business district (CBD) of Rio de Janeiro during summer from land surface temperature (LST) and the thermal characteristics of the urban canopy layer (UCL) of the urban canyon in Avenida Rio Branco. In order to conduct this evaluation, two methods were employed: (1) TIRS Landsat-8 sensor for data selection and processing (latest generation, 2011–2020); (2) a field survey using nine sampling points—seven along two mobile transects, one fixed point, and one vertical measurement point, which required the use of an RPA (remotely piloted aircraft). Three categories of analysis were established for the field survey based on the prevailing synoptic situations: stability, instability, and post-instability. The CBD is characterized by extensive areas with surface heat islands, in which temperatures were higher than 38.9 °C; the areas with milder LSTs were Campo do Santana, Avenida Rio Branco, and one of the mixed-use zones (Praça Mauá). With respect to Rio Branco Avenue, the LST niches of lowest elevation were derived through building shadowing; however, due to the nature of the data, the orbital data diverged from the observation data of the 10 field-study days. In situ data revealed that the characteristics urban morphology of Avenida Rio Branco, by contrast with the LST result, is susceptible to the formation of atmospheric heat islands, presenting heat islands of very strong magnitude (over 6.1 °C) in atmospheric stability, strong magnitude (4.1–6.0 °C) in atmospheric instability, and moderate magnitude (2.1–4.0 °C) in post-atmospheric instability. Despite the synoptic situation, thermal cores were concentrated at 1 p.m. The intersection between Avenida Rio Branco, Rua do Ouvidor, and Praça Mauá stored most of the solar energy received during the day due to the greater sky obstruction caused by the verticalization. Finally, vertical analysis demonstrated the formation of a thermal inversion on the night of the highest mean air temperature (29.5 °C), probably due to the roughness and number of buildings in the urban canyon.
1. Introduction
At the end of the 20th century, urban spaces became mankind’s favored environment on Earth [1]. Changes to the natural landscape produced by intense, and increasingly dense, urbanization have generated urban climates, one of the most evident proofs of the interaction between society and nature in the Anthropocene.
At the genesis of urban climate are the changes in solar radiation absorption, which impact thermodynamic parameters such as heat, humidity, and wind [2,3]. The main result of these changes are urban heat islands (UHI), which are urban spaces with increased air and surface temperature than their surroundings [3]. Depending on the size, shape, and function of the urban space, heat islands can also be interspersed with cool islands, forming an archipelago of distinct thermal subfields [4].
In Brazil, studies in the field of urban climate, with a focus on geography, began to take shape starting with the work of Carlos Augusto de Figuei redo Monteiro [2], whose theoretical and methodological underpinnings were taken up by [5] for the analysis of the complexed urban climate of Rio de Janeiro. Her research motivated studies on Rio neighborhoods, and for the current purposes it is worth reviewing those concerning thermal aspects [6,7,8,9,10,11,12,13,14].
The central business district (CBD) of Rio de Janeiro was created after profound changes in the natural landscape (landfill of marshes and mangroves, razing of hillsides, deforestation, waterfront interventions), which were funded by both the private and the public sector. From the Pereira Passos urban intervention (1904), which sought to replicate European architecture and encouraged the opening of large avenues (such as Avenida Rio Branco), to the transformations that occurred for the 2016 Olympic Games, spatial restructuring has been based on hygienist values, artificial forms, and fluidity, with disregard for other impacts [15,16]. In 2021, a new phase of the revaluation project of Rio de Janeiro’s CBD, which started with the Olympic City urban project, begins with the Reviver o Centro (Reviving the Center) urban project, which proposes the expansion of residential areas [17,18].
The complex dynamics of this urban restructuring demonstrate the need for further investigation of the urban climate of the CBD of Rio de Janeiro. Therefore, the present study aims to evaluate the land surface temperature (LST) and the thermal characteristics of the urban canopy layer (UCL) of the urban canyon in Avenida Rio Branco in the CBD of Rio de Janeiro during summer, in order to assess the hottest weather types in the city. A better understanding of the climate in this part of the city can aid urban interventions in promoting thermal comfort and quality of life in the area.
2. Materials and Methods
Two methods were employed to conduct the proposed evaluation: (1) TIRS Landsat-8 sensor for data selection and processing (latest generation, 2011–2020); (2) a summer field survey using nine sampling points—seven along two mobile transects in Avenida Rio Branco, one fixed point at the Santos Dumont Airport’s weather station, and one vertical measurement point at Largo da Carioca, which required the use of a RPA (Remotely Piloted Aircraft).
2.1. Summer Land Surface Temperature Estimate (LST)
The land surface temperature estimate was anchored in the selection and processing of TIRS sensor data available for the period spanning 2011–2020. Eleven 10-band images (09/01/2014, 25/01/2014, 10/02/2014, 26/02/2014, 27/12/2014, 12/12/2015, 13/02/2015, 31/01/2016, 18/02/2017, 22/12/2018, 24/02/2019) of summer periods (2011–2020) were acquired on the United States Geological Survey (USGS) website [19]. The following steps were performed for the LST calculation:
- (1)
- insertion of LANDSAT-8 band 10 into Arcgis;
- (2)
- conversion of digital numbers (DNs) to 10-band radiances;
Lλ = ML ∗ Qcal + AL
- (3)
- conversion of DNs to reflectance and reflectance correction of bands 4 and 5 (OLI LANDSAT-8 sensor);
- (4)
- calculation of the normalized difference vegetation index (NDVI) using the corrected reflectances of bands 4 and 5;
- (5)
- emissivity estimation;
Ei = 1.0094 + 0.047 ∗ Ln(NDVI)
- (6)
- atmospheric correction;
- (7)
- conversion of radiance to LST;
- (8)
- conversion from Kelvin (K) to Celsius (°C).
The multiplicative scaling factor (MSF), specific additive scaling factor (ASF), calibration constant 1 (k1), calibration constant 2 (k2), multiplicative scaling factor (Mρ), additive scaling factor (Aρ), and local sun elevation angle () were extracted from the metadata of each image. The quantized values, calibrated by the pixels in DN (Qcal), represented bands 4, 5, and 10 in their calibration equations. Air transmittance (τ) and radiance emitted (Lu) and received (Ld) by the surface are corrective parameters of the atmosphere and of the radiation–atmosphere–surface interaction process. They were obtained using the Atmospheric Correction Parameter Calculator, which incorporates satellite date, time, and location data and also surface conditions: altitude (km), temperature (°C), pressure (mb), and relative humidity (%). This tool was accessed from the NASA/GSFC website (https://atmcorr.gsfc.nasa.gov/, accessed on 10 April 2021) [20], and the meteorological data was acquired from the National Institute of Meteorology (INMET), using the Forte de Copacabana Station as reference [21].
For the recognition of the specific emissivity, the estimation method of [22] was followed, which in addition to providing [23] includes more detailed classes of NDVI (Table 1). It should be noted that the atmospheric correction is based on [24,25]. Other equations followed what was established by [19] regarding the use of Landsat-8 products.

Table 1.
Emissivity estimation using normalized difference vegetation index (NDVI).
2.2. Summer Field Experiment (2021)
Summer field experiments were conducted following episodic logic, widely adopted in Brazilian climatology [1], on Sundays-24/01/2021, 31/01/2021, 07/02/2021, 14/02/2021, 21/02/2021, 07/03/2021, 14/03/2021-and Mondays-25/01/2021, 22/02/2021, 15/03/2021-in the morning (6 a.m.), in the afternoon (1 p.m.), and at night time (8 p.m.). During the field experiments, measurements were taken at seven different points distributed along two mobile transects and one weather station. Vertical analysis of the urban canopy layer was conducted at one sampling point every 10 m from the ground to an altitude of 50 m (Figure 1 and Figure 2).

Figure 1.
Study area and distribution of measurement points.
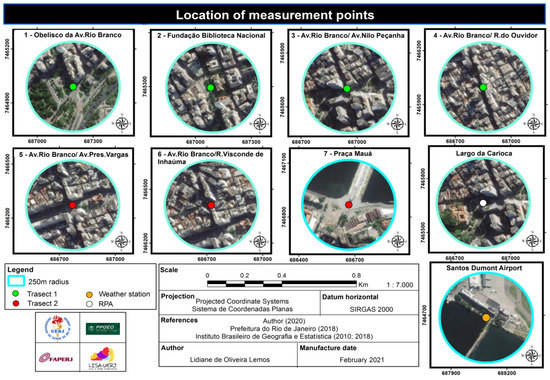
Figure 2.
Location of measurement points.
Avenida Rio Branco was divided into transect 1 (South-North) and transect 2 (North-South). Transect 1 comprises points: 1 (Obelisco da Avenida Rio Branco), 2 (Fundação Biblioteca Nacional), 3 (Avenida Rio Branco/Avenida Nilo Peçanha), and 4 (Avenida Rio Branco/Rua do Ouvidor); and transect 2 comprises the points: 1 (Praça Mauá), 2 (Avenida Rio Branco/Rua Visconde de Inhaúma), and 3 (Avenida Rio Branco/Avenida Presidente Vargas).
The weather station at Santos Dumont Airport, also located in the CBD, was used as a control station since airports capture aspects of regional meteorology, important for intra-urban thermal specialization analysis [1]. Although located within an urban area, this airport is a space with few changes, presenting different urban parameters from the legislation. Moreover, the airport is seen as a reference in the international literature for the installation of meteorological stations and a point for comparison with data from urban spaces [4].
The intersection between Avenida Rio Branco and Avenida Nilo Peçanha, where Largo da Carioca, a place surrounded by higher buildings (between 50 m and 145 m), is located, was chosen for the RPA (drone) flight and, consequently, for the vertical data collection from the urban canopy layer of the CBD.
Temperature, humidity, and wind data from the mobile transects were collected using bicycles and an Incoterm T-ANE-0030.00 digital thermo-anemometer. The NOVOTEST 1041 professional wireless weather station with memory and USB-PC connection, which collects data on air temperature, relative humidity, precipitation, atmospheric pressure, and wind (speed and direction), was allocated at the control point.
An Impac IP-747 data logger was used for air temperature and relative humidity vertical collections taking into account the current recommendations on the use of this technique [26]. It was attached to the RPA, which, upon takeoff, collected the data on the ground and at 10 m, 20 m, 30 m, 40 m, and 50 m (altimetric positions georeferenced by the aircraft’s GPS). These altimetric positions were defined based on the autonomy of the RPA battery and the fact that these values are subunits of adiabatic rates’ reference values, which are widely spread in the literature.
Data was collected simultaneously on the mobile transects and RPA at 6 a.m., 1 p.m., and 8 p.m., over 30 min each time. These times correspond, respectively, to the beginning of the heating process, maximum heating, and beginning of the cooling process.
Treatment of Primary Data
The data registered throughout the 10 days of field experiments were tabulated, organized, and integrated into a Microsoft Office Excel 2007 spreadsheet.
With the air temperature, relative humidity, precipitation, atmospheric and wind pressure (speed and direction) data from the professional meteorological station, a table was put together containing the precise measurements at the following intervals: 5:30, 6:00, 7:00, 8:00, 9:00, 10:00, 11:00, 12:00, 13:00, 14:00, 15:00, 16:00, 17:00, 18:00, 19:00, 20:00 and 20:30. With that information, daily Excel charts were built for the rhythmic analysis of the behavior of the atmospheric conditions (atmospheric elements) and, above all, for the analysis of thermal field rebound.
Meteorological station data from 6:00, 13:00 and 20:00 acted as comparison points for the monitoring of horizontal comparison, also carried out at those times. Specifically, the station air temperature figures served as the basis for the calculation and identification of heat island intensity [4,6].
The table with horizontal monitoring data containing the thermal differential measurements was run through Arcgis software (v. 10.5) to map out the thermal profile along transects 1 and 2. The table with the episodic horizontal monitoring data also served as the basis for the identification and subtraction between the highest and lowest temperature values, aiming at calculating the heating rate (greater or lesser efficiency in energy gain) of each sampling point, in the sampling that occurred throughout the day [6].
The assessment of the vertical thermo-hygrometric profile, from the ground up to 50 m, was obtained through graphs also produced in Excel.
Finally, the analysis of synoptic charts (00Z and 12Z) [27], comprised of the available images from channel 13 of the GOES 16 satellite (00 GMT and 12 GMT) [28] and the radiosonde plots (00 UTC and 12 UTC) captured by the station at Tom Jobim International Airport (Galeão) [29], was performed in order to qualify the configuration of the thermal field and enable its understanding under the conditions of distinct atmospheric processes.
The charts were the basis for visual interpretation and recognition of the atmospheric systems and air masses prevailing on the days of the field experiments, as well as for the comprehension of the impact of synoptic conditions on the variability of the atmospheric parameters registered by the weather station. The images from GOES-16 Infrared channel 1 (IR-1, with 10.35 μ) and channel 13 allowed us to identify the temperature of the cloud tops and thus infer their level of vertical development, which contributed to the knowledge of weather conditions that favor the different magnitudes and intensities of heat islands. On the other hand, the radiosonde plots from Galeão International Airport allowed us to evaluate the vertical variation of temperature in the troposphere, offering parameters for classification of the atmospheric situation (stability, instability and post-instability), like CAPE index [28], criteria for a categorization analysis of field experiments [29].
3. Results and Discussion
3.1. Estimative of Land Surface Temperature during Summer (2011 to 2020)
Analysis of the average land surface temperature of summer mornings from 2014 to 2019 indicates the predominance of higher surface temperature ranges (>38.9 °C), with only a small area of the CBD showing lower values (between 28 °C and 38.9 °C). Overall, the results suggest that the average LST of the study area was relatively high (Figure 3).

Figure 3.
Average land surface temperature (LST) of summer in the central business district (CDB), Rio de Janeiro.
Using the 2018 Land Use and Occupation Law and LANDSAT-8 images, it was possible to observe that Campo de Santana, a “green island” embedded in the central consolidated zone (CCZ), presented temperature ranges between 34.9 °C and 38.9 °C, meaning it constitutes a cool island within the CBD heat island, reinforcing the importance of latent heat fluxes in the configuration of the thermal field [4,15,22]. On the other hand, in zones with commerce and services concentration (CCZ and commercial and services zone (CSZ), special operations zone (SOZ), and multifamily residential zone 2 (MRZ-2)), the registered LST ranged mostly between 38.9 °C and 46.8 °C, in response to the production and storage of anthropogenic heat derived from these urban forms and functions [22]. The differences are associated with the potential for attenuation of vegetation on the thermal load due to by the cooling effect of evapotranspiration [30], the covering of land by buildings, and the roughness of the urban morphology. For example, both the CSZ and MRZ-2 have 10% of minimum free surface, that is, area that must be kept free of any level of construction and preferably covered with the existing vegetation; there is no such percentage for the CCZ. Furthermore, the setback of the buildings’ front is 3 m in the CSZ, 3 to 5 m in the MRZ-2, and non-existent in the CCZ, which hinders air circulation and heat dispersion [31].
As for the SOZ, the vegetation removal for the construction of paved runways at the Santos Dumont Airport is responsible for its high LST. The mixed use zones (MUZ) present two behaviors: the one close to CSZ exhibits a thermal field similar to the aforementioned zone as it has the same occupation patterns established by [31]; on the other hand, the MUZ located in the port area (Praça Mauá), which is influenced by the sea breeze of the Baía de Guanabara (Guanabara Bay), has few spaced buildings (Museu do Amanhã, Serviço de Assistência Social da Marinha, and Odontoclínica da Marinha), thus presenting the lowest ranges of land surface temperatures (28 °C to 34.9 °C).
In addition, it is worth noting that the land surface temperatures of the CCZ, precisely those of the urban canyons of Avenida Rio Branco, converged with those of Campo de Santana (34.9 °C and 38.9 °C). Areas with a high level of vertical urbanization and proximity between buildings, which cast shadows on each other, tend to create milder land surface temperature zones (Figure 4).
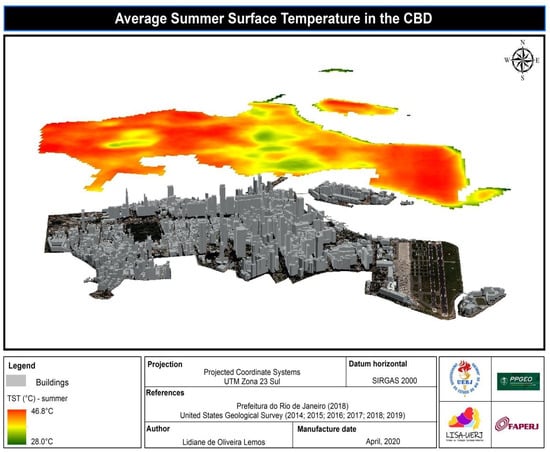
Figure 4.
Average summer surface temperature in the CBD.
3.2. Thermal Profile during Summer (2021)
Regarding the synoptic conditions determined by the regional circulation, the thermal characteristics of the different data obtained from the Avenida Rio Branco points were classified into qualitative situations of the atmosphere: stability situation (01/24, 01/25, 01/31 03/14, and 03/15), instability situation (02/14, 02/22, and 03/07), and post-instability situation (02/07, and 02/21).
An atmosphere considered stable [29,32] is resistant to vertical drafts (updrafts and downdrafts) and tends to return to its initial position. In this case, if the air is forced to rise, it will tend to spread horizontally; if there are cloud formations (altostratus, nimbostratus, or stratus), this process will cause them to spread in the same way and in relatively thin layers. On the other hand, instability results from the favoring of vertical air currents. This situation enables the development of large clouds, such as Cumulonimbus, which are responsible for producing severe thunderstorms [32].
3.2.1. Thermal Profile in Synoptic Situation of Atmospheric Stability
The South Atlantic Subtropical Anticyclone (SASA) advanced over the study area, widely dominating it on 24 January (Sunday), 25 January (Monday), 31 January (Sunday), 14 March (Sunday), and 15 March (Monday). Since it is characterized as a high-pressure cell, SASA resulted in atmospheric processes identified as stable. The CAPE index reinforce the stable balance of the atmosphere, which is capable of inhibiting vertical drafts and provide an open sky.
This process favored synoptic conditions characterized by open sky, calm weather, and absence of clouds. Good weather conditions were observed, with the overall local response of the weather station for the five days of experiments being an average increase in air temperature, decrease in relative humidity, and absence of rain.
On 31 January, for example, the local response of the weather station presented the highest mean temperature (29.5 °C) of all field experiments and, consequently, the lowest relative humidity (58.8%). Daily temperature ranged from 26.6 °C to 37 °C, and relative humidity ranged from 42% to 72% (Figure 5). The air pressure remained constant until 1 p.m. at 1013 mb, decreasing to 1008.8 mb by the end of the experiment. The winds predominated between 7 a.m. and 8 p.m., with speeds ranging between 0.4 m/s and 1.8 m/s (east, west, south, and southeast).

Figure 5.
Rio de Janeiro—instantaneous temperature of the weather station at 01/31/2021.
The systems producing atmospheric stability determined the weather conditions for the experiments of 24 January, 25 January, 31 January, 14 March and 15 March, favoring the thermal responses generated by the urban morphology and, consequently, the spatio-temporal mobility of the heat island along transects 1 and 2. In addition, the synoptic repercussions of good weather aided the formation of heat islands of very strong magnitude (Figure 6).
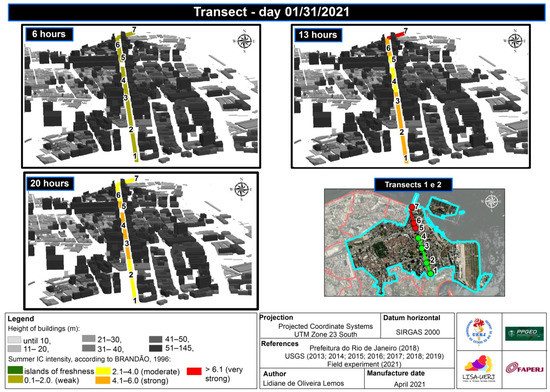
Figure 6.
Rio de Janeiro-horizontal thermal field in the urban canyon of Avenida Rio Branco, 31 January (Sunday).
In Avenida Rio Branco, we observed the configuration of heat islands of up to very strong magnitude, which is above 6,1 °C (Figure 6). This highlights the efficiency of building materials’ properties in the absorption of short waves, as well as in the emission and conductivity of long waves, which, associated with the roughness of urban morphology, allows the absorption and conservation of energy [33,34,35].
The morning (6 a.m.) and night (8 p.m.) heat islands oscillated from weak (0.1 °C to 2 °C) to moderate (2.1 to 4.0 °C) magnitude, and the afternoon island from weak to very strong (above 6.1 °C). Transects 1 and 2 show that the time of 1 p.m. concentrated the thermal cores (Figure 6). According [36], during daytime up to 50% of the net radiation is used for the storage flux which automatically limits the sensible heat flux and during the night this absorbed energy is released and used to compensate the nocturnal negative net radiation at the urban site mostly completely, preventing the air temperatures to decline to low values. However, the position of the site of CDB, under the influence of breezes, alters this classical dynamics of storage and heat flow.
This diverges from the literature [33,34,35,36], which indicates that the night time presents the largest cores in spaces of urban canyon morphology, especially in cities located in the temperate zone [36]. In addition, Refs. [34,35] point out that the lower ability to release long waves at night is associated with the arrangement of buildings and, above all, the reduction of the sky-view factor. In the present study, the lower night time intensities of the heat island might be related to the channeling of breezes along the canyon of Avenida Rio Branco, given the predominant directions of the south/southeast and north/northeast winds along transects 1 and 2, respectively.
In transect 1, the cores of the heat islands oscillated, predominantly, between the Obelisco da Avenida Rio Branco (point 1) and Avenida Rio Branco/Rua do Ouvidor (point 4) during the three collection times (6 a.m., 1 p.m., and 8 p.m.). The urban morphology of Obelisco da Avenida Rio Branco is marked by low and medium ground cover potential per building, which guarantees its direct exposure to solar radiation and, consequently, the absence of shadow projection from the buildings. This characteristic favors both the rapid heating and the release of energy for the cooling of the air temperature. Thus, its cores were registered in the morning (6 h), which coincides with the beginning of the heating process. Overall, the afternoon and night times configured islands of lower intensity, also due to the presence of shrubby and creeping vegetation.
Point 4 is located between buildings that reach 100 m and whose blocks have high ground cover potential (50% to 100%). The surrounding public places are narrower, which implies a more dense spatial arrangement and also hinders the circulation and renewal of air. Because of this, this point functioned as a reservoir of energy, presenting itself during all experiment days (24 January, 25 January, 31 January, 14 March and 15 March) as the core of the night islands. This result dialogues with the literature by highlighting the efficiency of the agglomerated mass and the reduction of the sky view factor in conserving released long waves and in raising air temperature [33,34]. The studies of [5], conducted in different environments of the CBD, also related the larger thermal core to the more verticalized axis (sky-view factor-SVF between 60% and 88%), directly related to day and night energy feedback mechanisms [36].
In general, in transect 1, a temporal-spatial profile was observed with a tendency of increasing intensity of the heat island as it starts from Point 1 (Obelisco da Avenida Rio Branco) to 4 (Avenida Rio Branco/Rua do Ouvidor), when entering the urban canyon, and deepens the roughness and the number of buildings (Figure 7).
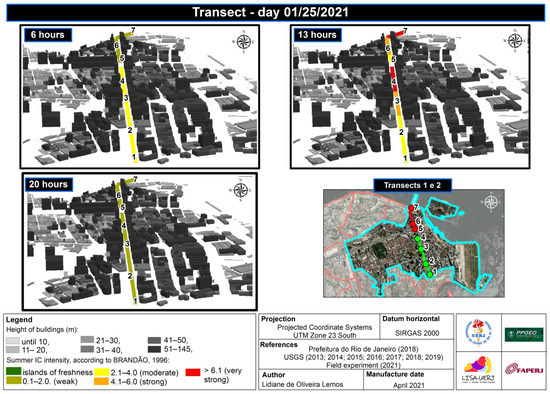
Figure 7.
Rio de Janeiro—horizontal thermal field in the urban canyon of Avenida Rio Branco, 25 January (Monday).
In transect 2, the cores of the heat island oscillated between Praça Mauá (point 7) and Avenida Rio Branco/Avenida Presidente Vargas (point 5). Praça Mauá, despite being an open space (medium ground cover potential) with few buildings around (Museu do Amanhã, Odontoclínica da Marinha e o Serviço Social da Marinha), is a highly transformed space (without vegetation and with extensive impermeable surfaces). Therefore, its logic of conservation and release of energy works similarly to the island configurations of the Obelisco da Avenida Rio Branco. In this way, the projection of this point as a thermal core happened in the afternoon (higher incidence of solar radiation). On the other hand, point 4 (Avenida Rio Branco/Presidente Vargas) has the particularity of being the point between the two busiest avenues of the CBD, which implies the flowing of vehicles and people, and having buildings over 50 m high that are located in blocks with high ground cover potential per building (50% to 100%), presenting heat islands of higher intensity during the morning and night periods.
In general, transect 2 showed increasing heat island intensity in the morning and evening, from Praça Mauá (point 7) to Avenida Rio Branco/Avenida Presidente Vargas (point 5), evidencing the energy storage capacity of the buildings. However, transect 2 also showed decreasing intensity from point 7 to 5 during the afternoon. In this case, the buildings artificially form zones of lower temperatures by casting large shadows, similar to what happens on Avenida Paulista, as shown in [34].
Horizontal thermal field analysis identified that the heat islands of higher intensity, located in Avenida Rio Branco/Rua do Ouvidor (11.8 °C) and Praça Mauá (8.3 °C), found by the summer field experiments (2021), were not related to the hottest day recorded by the weather station, 31 January, but to 25 January, a Monday (Figure 7). It is possible that, on this day, marked by intense dynamics in Avenida Rio Branco, anthropogenic heat influenced these results.
By analyzing the horizontal thermal profile of the transects, it was also possible to identify the points of higher and lower heat storage efficiency. Heating rates revealed that Avenida Rio Branco/Rua do Ouvidor and Praça Mauá were the most critical spaces, while The Obelisco and Avenida Rio Branco/Presidente Vargas had the lowest heat storage efficiency.
At 6 a.m. on 31 January there were persistent signs of thermal inversion up to 30 m from the ground (Figure 8). While at ground level the air temperature was 26.8 °C, at 30 m from the ground it was 27.0 °C. However, the thermal inversion occurred at night, when the air temperature recorded at the maximum altitude (28.5 °C) was 2.3 °C above the one measured at ground level (Figure 9). On this day of atmospheric stability, which registered the highest mean air temperature (29.5 °C) and was favorable to thermal inversions despite being summer, Galeão airport’s radiosonde did not detect thermal inversions. The roughness and amount of buildings in Largo da Carioca may have determined the configuration of this phenomenon.
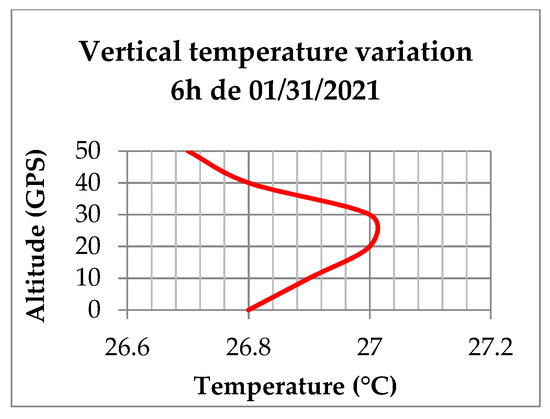
Figure 8.
Vertical temperature at 6 a.m.

Figure 9.
Vertical temperature at 8 p.m.
3.2.2. Thermal Profile in Synoptic Situations of Atmospheric Instability
The synoptic conditions of 14 February (Sunday), 22 February (Monday), and 7 March (Sunday) indicated that the weather type in Rio de Janeiro did not favor the formation of urban heat islands, since there was atmospheric instability.
On 14 February, Rio de Janeiro was under the influence of the South Atlantic Convergence Zone (SACZ), attracted by a low pressure ocean cell that expanded over the city and caused a decrease in isobaric potential, which reached 1010 mb. This was responsible for the relative increase in humidity, cloudiness, rain, northwest winds, and temperature decline. On 22 February and 7 March, the regional atmospheric systems were affected by a cold front (CF), coming from the ocean to meet the SACZ, that had a significant impact on the continent and also generated an increase in relative humidity, cloudiness, rain, and northwest winds.
On 22 February, a mean temperature of 26.4 °C, maximum of 30.2 °C, and minimum of 22.9 °C were registered (Figure 10). The highest air temperature gradients occurred at 11 a.m. and 12 p.m. 2.5 °C and 5.2 °C, respectively. On the same day, right after the increase and subsequent decrease in temperature, there was high rainfall: a total of 40 mm, concentrated between 12 a.m. and 1 p.m. (highest humidity peak: 92%). Still on 22 February, the average humidity was 79.5%, the atmospheric pressure remained constant at 1013 mb, and winds predominated mainly between 8 a.m. and 5 p.m. Their directions varied between northeast, east, and southwest.
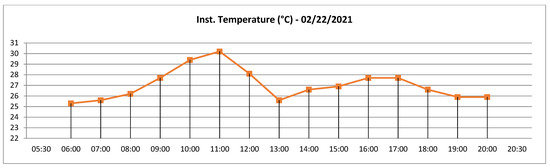
Figure 10.
Rio de Janeiro—instantaneous temperature of the weather station at 02/22/2021.
Considering that the instability at the regional level superseded microclimatic responses, it was still possible to identify, on 14 February, 22 February, and 7 March, the formation of heat islands during the morning and night, up to moderate magnitude (2 °C to 4 °C) and in the afternoon, up to strong (4.1 °C to 6 °C) magnitude (Figure 11).

Figure 11.
Rio de Janeiro—horizontal thermal field in the urban canyon of Avenida Rio Branco, 22 February (Monday).
The different intensities of the heat islands were related not only to the microclimatic conditions of the urban morphology but also to cloudiness. The data analysis indicated that the hotspots of transect 1 (Obelisco da Avenida Rio Branco and Avenida Rio Branco/Rua do Ouvidor) and transect 2 (Praça Mauá and Avenida Rio Branco/Avenida Presidente Vargas) remained the same. However, the magnitudes were more significant under cloudy conditions, as clouds positively interfere with energy balance and trap irradiance.
In transect 1, at 6 a.m., 1 p.m., and 8 p.m., a temporal-spatial profile of the thermal field was observed. Both ends of the transect, that is, the Obelisco da Avenida Rio Branco (point 1) and Avenida Rio Branco/Rua do Ouvidor (point 4), presented the largest differences in relation to the control station. Besides the clouds, trees (bioclimatic effect) and intersections with considerable space between buildings contributed to the lowering of air temperature at Fundação Biblioteca Nacional (point 2) and Avenida Rio Branco/Avenida Nilo Peçanha. The Obelisco had its maximum manifestation times during mornings and afternoons, and Avenida Rio Branco/Rua do Ouvidor in the evening.
In transect 2, the heat island intensity was consistent from Praça Mauá to Avenida Presidente Vargas, increasing in the morning and evening and decreasing in the afternoon; Praça Mauá kept had consistent afternoon cores and Rio Branco Avenue/Presidente Vargas Avenue morning and evening cores. Heat islands of up to strong magnitude (4,1 °C to 6 °C) formed in transect 2. These results reinforce the importance of cloudiness for the heat flux profile and, consequently, intensity and mobility of heat islands [36].
The heating rate recorded during this unstable situation confirmed Avenida Rio Branco/Rua do Ouvidor and Praça Mauá as the points with the highest energy gain capacity over the course of a day. On the other hand, due to the instability and the association of synoptic conditions with the urban morphology, Avenida Rio Branco/Nilo Peçanha showed the lowest heat storage efficiency, also affected by the wide intersection that favors air circulation (Figure 12).
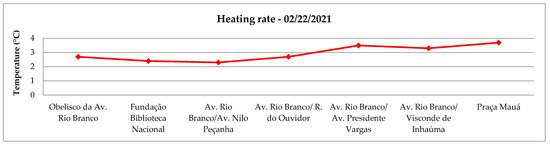
Figure 12.
Rio de Janeiro—heating rate of sampling points on 22 February (Monday).
Regarding the investigation of the thermo-hygrometric vertical profile, which took place only on 7 March, a Sunday (Although February 14th was a Sunday, which is the day of the RPA vertical survey, the survey was not carried out due to technical issues.), in Largo da Carioca, the temperatures were, in general, lower than those in a stable situation. The thermal gradient between the different altitudes remained low, with differences of 0.9 °C in the morning, 2.1 °C in the afternoon, and 0.2 °C in the evening; the greatest vertical gradient occurred at 1 p.m.
On 7 March, in the morning, there was a decrease in temperatures from the ground (24.8 °C) up to 50 m (23.9 °C). At 1 p.m. and 8 p.m., signs of thermal inversion were detected; the temperature decrease persisted up to 40 m. In the afternoon, the temperature was 31.6 °C on the ground and 31.8 °C at 40 m; in the evening, the temperature at 40 m was 0.2 °C higher than that near the ground.
3.2.3. Thermal Profile in Post-Atmospheric Instability Synoptic Situation (Repercussion of the South Atlantic Convergence Zone, SACZ)
The days 7 February and 21 February were marked by the weakening of the regional systems that produced atmospheric instability. Even though the SACZ moved towards the northwest region of Rio de Janeiro, the prevailing weather situation was defined by its weakened repercussion (RSACZ), which was responsible for the formation of low clouds. On 7 February, in addition to the SACZ, a stationary front dissipated, favored by a low pressure ocean cell.
On 7 February, the weather station measured a mean air temperature of 24.7 °C, a minimum of 21.7 °C, and a maximum of 27.3 °C (Figure 13); the average relative humidity was 73.8%, the minimum was 64%, and the maximum was 87%. In general, the times in which the highest temperatures were registered (between 8 a.m. and 4 p.m.) were those that registered the lowest relative humidity. The atmospheric pressure remained constant throughout the day, at 1011 mb; winds occurred mainly between 9 a.m. and 5 p.m. in east, west, and southeast directions.
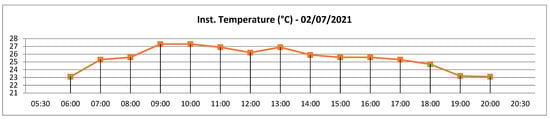
Figure 13.
Rio de Janeiro—instantaneous temperature of the weather station.
On 7 February and 21 February, the post-instability synoptic conditions (marked by the weakening of the SACZ) were responsible for a heat island that varied from weak (0.1 °C to 2 °C) to moderate intensity (2.1 °C to 4 °C) (Figure 14), lower magnitudes when compared to previous patterns of atmospheric stability and instability.
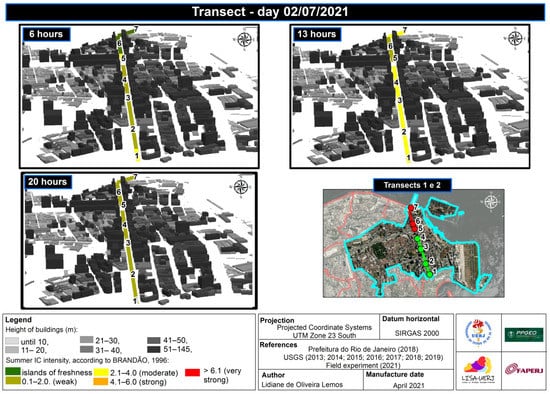
Figure 14.
Rio de Janeiro—horizontal thermal field, in the urban canyon of Rio Branco Avenue, on 7 February (Sunday).
Considering the two days of field experiments, transects 1 and 2 presented morning and evening heat islands of up to moderate magnitude (2.1 °C to 4 °C); however, heat islands of weak intensity (0.1 °C to 2 °C) predominated. In general, the maximum cores were associated with afternoon islands (1 p.m.) (Figure 14).
This confirmed that, in transect 1, the Obelisco da Avenida Rio Branco and Avenida Rio Branco/Rua do Ouvidor were the sampling points with the highest intensities. In transect 2, these points were Praça Mauá and Avenida Rio Branco/Avenida Presidente Vargas.
Unlike in the situations of atmospheric stability and instability, during post-instability a significant temporal-spatial configuration of heat island mobility was not observed. This may be related to the transitional characteristics of the atmosphere.
The heating rates of the points analyzed did not match those measured in previous studies. The heating rates of 7 February and 22 February also did not converge. On 7 February, Avenida Rio Branco/Avenida Nilo Peçanha and Avenida Rio Branco/Avenida Presidente Vargas were the points with most efficient energy storage, while on 22 February, the most efficient points were Avenida Rio Branco/Fundação Biblioteca Nacional, Avenida Rio Branco/Visconde Inhauma, and Praça Mauá. These results highlight a possible consequence of a situation of atmospheric transition.
On 7 February, air temperature and relative humidity behaved as expected when considering altitude: air temperature decreased and relative humidity increased. As a result, the temperatures near the ground remained lower than those found at 50 m; thus, the ground and the maximum altitude registered, respectively, 23.2 °C and 22.8 °C in the morning; 29.2 °C and 28.4 °C in the afternoon; and 23.4 °C and 22.9 °C at night. The morning measurements indicated thermal differences between altimetric positions: 0.4 °C in the morning, 0.8 °C in the afternoon, and 0.6 °C at night.
4. Conclusions
According to the assessed data, almost the entirety of the CBD presents the possibility of urban heat island formation. The results of the mean infrared thermography, during the last decade (2011 to 2020), whose predominant ranges were greater than 38.9 °C, prove this possibility. This fact stems, among other things, from the architectural form and thermophysical properties of Rio de Janeiro’s CBD. The hottest areas identified were the commerce and services zones (commercial and services zone (CSZ) and consolidated central zone (CCZ)); the multifamily residential zone-2 (MRZ-2); and the special operations zone (EOZ). The areas with the lowest land surface temperature were Campo do Santana, Avenida Rio Branco, and one of the mixed use zones (Praça Mauá). These results, when faced with the proposed expansion of residential areas by the urban project Reviver Centro [17], indicate a possible increase in local climate changes with greater repercussions regarding the heat islands and a consequent increase in thermal discomfort.
On what concerns Avenida Rio Branco, the proximity between the buildings that make up the urban canyon is responsible for creating niches of lower LSTs, as indicated in the Figure 4. However, this result diverged from the horizontal data collected during the 10 days of field experiments, which showed that the urban morphology of Avenida Rio Branco is susceptible to heat islands. This area also shows the low cooling capacity of that avenue, as evidenced by the few times a cool island was present.
It is important to highlight, following [36], that satellite data are mostly captured during daytime satellite passes when the urban heat island is not well-developed and, secondly, since most of the satellite measurements represent roof level brightness temperatures of the cities this surface temperature is mostly decoupled from the air temperatures at the same level.
As observed, the heat islands presented magnitudes and intensities that varied according to the different atmospheric processes: heat islands of up to very strong magnitude (above 6.1 °C) in atmospheric stability; heat islands of up to strong magnitude (4.1 °C to 6.0 °C) in atmospheric instability; and heat islands of up to moderate magnitude (2.1 °C to 4.0 °C) in post-atmospheric instability. A response to heat fluxes and storage [36] under the local dynamics of breezes and cloudiness.
Regardless of the prevailing synoptic situation in the field surveys, it was observed that the time of 1 p.m. concentrated the thermal cores both in transect 1 and transect 2. This diverges from the literature, which indicates the night time as presenting the largest cores in spaces of urban canyon morphology. Although the wind data are insufficient to make such a claim, possibly the lower night-time intensities of the heat island are related to the channeling of breezes along the canyon of Avenida Rio Branco. This result draws attention to the need for further studies and for a deeper understanding of the phenomenon of canyon heat islands in tropical coastal cities.
It was also possible to identify the most critical spaces along Avenida Rio Branco through the horizontal monitoring of the thermal field and the daily heating rates. That is, the greater or lesser efficiency each sampling point presents in conserving energy along day and night energy feedback mechanisms [36], namely: Avenida Rio Branco/Rua do Ouvidor and Praça Mauá. Avenida Rio Branco/Rua do Ouvidor is located between buildings that reach 100 m and whose blocks have a high ground coverage potential (50% to 100%). Furthermore, the surrounding public spaces are narrower, implying a denser spatial arrangement. Praça Mauá, despite being an open space (medium ground cover potential) with few buildings around, is a space without vegetation and with extensive impermeable surfaces.
The largest cores during the summer of 2021 were not registered on the same day (31/01) of the highest air temperature (29.5 °C) of the season, but on a Monday. On this day, the heat islands registered 11.8 °C in Avenida Rio Branco/Rua do Ouvidor and 8.3 °C in Praça Mauá. It is possible that on this day, marked by intense urban dynamics on Avenida Rio Branco, the anthropogenic heat made explicit the relevance of function over form.
The vertical analysis of the thermal configuration also converged in registering 1 pm as the time with the greatest thermal behavior and the greatest gradient from the ground up to 50 m. It should be noted that there were signs of thermal inversion in the different synoptic conditions. However, thermal inversion occurred during the night of the day with the highest mean air temperature registered (29.5 °C), since the air temperature registered at the maximum altitude (28.5 °C) was 2.3 °C above that obtained at ground level. Thermal inversion was not registered at a regional level on this day of atmospheric stability, even though the synoptic conditions, despite being summer, were favorable to the emergence of the phenomenon. This finding makes it possible to believe that the roughness and the amount of buildings in Largo da Carioca would have forged the configuration of the phenomenon.
The results obtained by the present study open avenues for future investigations into atypical atmospheric configurations resulting from urban morphology and function. We further highlight the importance of regional analysis from the control station located at the Santos Dumont airport, including the fact that the city of Rio de Janeiro is entirely urban, which requires new strategies for comparing data and evaluating the thermal field, since what can be observed more globally disobeys the rural–urban dichotomy [36,37]. In future studies, the authors intend to carry out a similar analysis at higher altitudes than those of this study, which escape the sphere of the urban canopy layer (UCL) and enter the urban boundary layer (UBL). In addition, the particularities of the configurations of the urban climate of tropical cities constitute challenging topics for scholars of the area.
Author Contributions
Conceptualization, A.C.O.J. and F.M.; Data curation, L.d.O.L.; Formal analysis, L.d.O.L. and A.C.O.J.; Validation, F.M.; Writing—original draft, A.C.O.J.; Writing—review & editing, F.M. All authors have read and agreed to the published version of the manuscript.
Funding
This research was funded by FAPERJ (grant number 200.219/2020 received by Lidiane de Oliveira Lemos), Prociência/UERJ (grant number 039/2020 received by Antonio Carlos Oscar Júnior).
Institutional Review Board Statement
This study doesn’t involve humans or animals.
Informed Consent Statement
Informed consent was obtained from all subjects involved in the study.
Data Availability Statement
The data supporting reported results can be acquired contacting the corresponding author, since they are primary data acquired through fieldwork.
Conflicts of Interest
The authors declare no conflict of interest.
References
- de Figueiredo Monteiro, C.A. A cidade como processo derivador ambiental e a geração de um clima urbano—Estratégias na abordagem geográfica. Rev. Geosul 1990, 5, 80–114. [Google Scholar]
- de Figueiredo Monteiro, C.A.; Mendonça, F. Clima Urbano; Contexto: São Paulo, Brazil, 2003. [Google Scholar]
- Oke, T.R. Boundary Layer Climates; Methuen: London, UK, 1978; p. 372. [Google Scholar]
- Gartland, L. Ilhas de Calor: Como Mitigar Zonas de Calor em Áreas Urbanas; Gonçalves, S.H., Translator; Oficina de Textos: São Paulo, Brazil, 2010; 248p. [Google Scholar]
- Brandão, A.M.P.M. O Clima Urbano da Cidade Do Rio de Janeiro. Ph.D. Thesis, Universidade de São Paulo, São Paulo, Brazil, 1996. [Google Scholar]
- França, D.A.; Brandão, A.M.P.M. O bairro Méier (RJ): O campo térmico e a percepção ambiental dos moradores em episódio de verão e de inverno. In IV Simpósio Brasileiro de Climatologia Geográfica; UFRJ: Rio de Janeiro, Brazil, 2000. [Google Scholar]
- Malheiros, T.S.; Brandão, A.M.P.M. O bairro de Copacabana (RJ): O campo térmico e a percepção ambiental da população em uma situação de verão e de inverno. In IV Simpósio Brazileiro de Climatologia Geográfica; UFRJ: Rio de Janeiro, Brazil, 2000. [Google Scholar]
- Lucena, A.J.; Brandão, A.M.P.M. O bairro Méier (RJ). O campo térmico em Bangu em duas situações sazonais de verão e outono. In IV Simpósio Brasileiro de Climatologia Geográfica; UFRJ: Rio de Janeiro, Brazil, 2000. [Google Scholar]
- Lucena, A.J. O Clima de Bangu no Contexto do Clima Urbano da Cidade do Rio de Janeiro; Monografia (Bacharelado em Geografia); Instituto de Geociência, Departamento de Geografia, Universidade Federal do Rio de Janeiro: Rio de Janeiro, Brazil, 2002; 91p. [Google Scholar]
- Lemos, L.O. Análise do Subcanal Termodinâmico na Área Central do Bairro Bangu (RJ) em Episódio Sazonal de Inverno; Monografia (Bacharelado em Geografia); Instituto de Geociência, Departamento de Geografia, Universidade do Estado do Rio de Janeiro: Rio de Janeiro, Brazil, 2018; 89p. [Google Scholar]
- Farias, H.S.; Brandão, A.M.P.M. O campo térmico como indicador de qualidade ambiental para políticas públicas: Estudo de caso no bairro Maracanã/RJ. In III Encontro Das Anppas; Centro de Convenções Israel Pinheiro: Brasília, Brazil, 2006. [Google Scholar]
- Pereira, P.V.S.; Brandão, A.M.P.M. Urbanização e derivações no clima local: Estudo de caso no bairro Penha. In VIII Simpósio Brazileiro de Climatologia Geográfica; UFU/ABClima: Alto Caparaó, Brazil, 2008. [Google Scholar]
- Oscar Júnior, A.C.S.; Brandão, A.M.P.M. O sistema clima urbano da ilha do fundão (RJ): Subsídio para o planejamento urbano. Rev. Bras. Geogr. Física Recife 2015, 8, 113–127. [Google Scholar]
- Mendonça, F. O Clima e o Planejamento de Cidades de Porte Médio e Pequeno: Proposição Teórico-Metodológica e Sua Aplicação à Cidade de Londrina/PR. Ph.D. Thesis, Universidade de São paulo, São Paulo, Brazil, 1995. [Google Scholar]
- Brandão, A.M.P.M. As alterações climáticas na área metropolitana do Rio de Janeiro: Uma provável influência do crescimento urbano. In Natureza e Sociedade no Rio de Janeiro; Secretaria Municipal de cultura, turismo e Esporte: Rio de Janeiro, Brazil, 1992; pp. 143–200. [Google Scholar]
- Mascarenhas, G. A produção da cidade olímpica e os sinais da crise de um modelo globalitário. GEOUSP Espaço E Tempo 2016, 20, 52–68. [Google Scholar] [CrossRef]
- Rio de Janeiro—Secretaria Municipal de Planejamento Urbano. Plano de requalificação do Centro do Rio de Janeiro (Decreto Municipal n. 48.348/2021); Prefeitura da Cidade do Rio de Janeiro: Rio de Janeiro, Brazil, 2021; Available online: https://reviver-centro-pcrj.hub.arcgis.com (accessed on 26 June 2021).
- United States Geological Survey. Available online: http://landsat.usgs.gov/about_project_descriptions.php (accessed on 23 March 2020).
- NASA/GSFC—NASA’s Goddard Space Flight Center. Available online: https://atmcorr.gsfc.nasa.gov/ (accessed on 10 April 2020).
- Instituto Nacional de Meteorologia. Available online: http://www.inmet.gov.br/portal/index.php?r=bdmep/bdmep (accessed on 3 April 2020).
- Zhang, Y. Land surface temperature retrieval from CBERS-02 IRMSS thermal infrared data and its applications in quantitative analysis of urban heat island effect. J. Remote Sens. 2006, 10, 789–797. [Google Scholar] [CrossRef]
- van de Griend, A.A.; Owe, M. On the relationship between thermal emissivity and the normalized difference vegetation index for natural surfaces. Int. J. Remote Sens. 1993, 14, 1119–1131. [Google Scholar] [CrossRef]
- Barsi, J.A.; Backer, J.L.; Schott, J.R. An Atmospheric correction parameter calculator for a single thermal. In Proceedings of the 2003 IEEE International Geoscience and Remote Sensing Symposium. Proceedings (IEEE Cat. No.03CH37477), Toulouse, France, 21–25 July 2003; pp. 3014–3016. [Google Scholar]
- Barsi, J.A.; Schottb, J.R.; Palluconic, F.D.; Hook, S.J. Validation of a web-based atmospheric correction tool for single thermal band instruments. Proc. SPIE 2000, 5, 5882. [Google Scholar]
- Abichandani, P.; Lobo, D.; Ford, G.; Bucci, D.; Kam, M. Wind meansurement and simulacion tecbhiques in milto-rotor small unmaneed aerial vehicules. IEEE Access 2020, 8, 54910–54927. [Google Scholar] [CrossRef]
- Marinha do Brazil. Available online: https://www.marinha.mil.br/chm/dados-do-smm-cartas-sinoticas/cartas-sinoticas (accessed on 15 September 2018).
- Instituto Nacional de Pesquisas Espaciais. Available online: http://satelite.cptec.inpe.br/acervo/goes16.formulario.logic (accessed on 3 March 2021).
- Universidade Federal de Itajaúba. Available online: https://meteorologia.unifei.edu.br/ (accessed on 1 May 2021).
- Stoyanova, J.; Georgiev, C.; Neytchev, P.; Kulishev, A. Spatial-Temporal Variability of Land Surface Dry Anomalies in Climatic Aspect: Biogeophysical Insight by Meteosat Observations and SVAT Modeling. Atmosphere 2019, 10, 636. [Google Scholar] [CrossRef]
- Câmara Municipal do Rio de Janeiro. Available online: https://mail.camara.rj.gov.br/APL/Legislativos/scpro1720.nsf/d08c1d300048019c0325775900523a3e/3724a3c95d41b1348325822c00635c91?OpenDocument (accessed on 20 September 2020).
- Dias, V.S. Análise dos Índices de Instabilidade Para Previsão de Formações Convectivas Severas Para a Região do Aeródromo do Galeão, Aeroporto Tom Jobim; Especialização em Meteorologia Aeronáutica, Instituto de controle do espaço aéreo (ICEA): São josé dos Campos, Brazil, 2008; 47p. [Google Scholar]
- Taha, H. Urban climates and heat islands: Albedo, avapotranspiration and anthropogenic heat. Energy Build. 1997, 25, 99–113. [Google Scholar] [CrossRef]
- Voogt, J.A. Urban heat island, causes and consequences of global environmental change. Encycl. Glob. Environ. Chang. 2002, 3, 660–666. [Google Scholar]
- Rizwan, A.M.; Dennis, L.Y.C.; Chunho, L.I.U.A. A review on the generation, determination and mitigation of urban heat island. J. Environ. Sci. 2008, 20, 120–128. [Google Scholar] [CrossRef]
- Parlow, E.; Vogt, R.; Feigenwinter, C. The urban heat island of Basel—Seen from different perspectives. DIE ERDE J. Geogr. Soc. Berl. 2014, 145, 96–110. [Google Scholar] [CrossRef]
- Brenner, N. Espaços da Urbanização. O Urbano a Partir da Teoria Crítica; Observatório das Metrópoles/Letra Capital: Rio de Janeiro, Brazil, 2018. [Google Scholar]
- Souza, L.B. Implicações climáticas de um modelo neodesenvolvimentista: Impactos, riscos e injustiças no estado do Tocantins, Brazil (Climatic implications of a neodevelopmentalist model: Impacts, risks and injustices in the tocantins state, Brazil). Rev. Bras. Climatol. 2016, 19, 129–145. [Google Scholar] [CrossRef][Green Version]


Publisher’s Note: MDPI stays neutral with regard to jurisdictional claims in published maps and institutional affiliations. |
© 2021 by the authors. Licensee MDPI, Basel, Switzerland. This article is an open access article distributed under the terms and conditions of the Creative Commons Attribution (CC BY) license (https://creativecommons.org/licenses/by/4.0/).