Article

Conceptual Framework for Disaster Management in Coastal Cities Using Climate Change Resilience and Coping Ability

1
Graduate Institute of Environmental Engineering, National Taiwan University, No. 1, Sec. 4, Roosevelt Rd., Taipei 106, Taiwan
2
Water Innovation, Low-Carbon and Environmental Sustainability Research Center, College of Engineering, National Taiwan University, Taipei 106, Taiwan
3
International Program for Sustainable Development, International College of Practice and Education for the Environment, Chang Jung Christian University, No.1, Changda Rd., Gueiren District, Tainan City 71101, Taiwan
4
Department of Geomatics Engineering, National Cheng Kung University, No.1, University Road, Tainan City 701, Taiwan
5
College of Engineering, Laboratory of Renewable Resources Engineering, Purdue University, 610 Purdue Mall, West Lafayette, IN 47907, USA
*
Author to whom correspondence should be addressed.
Atmosphere 2022, 13(1), 16; https://doi.org/10.3390/atmos13010016
Submission received: 11 November 2021 / Revised: 17 December 2021 / Accepted: 21 December 2021 / Published: 23 December 2021
(This article belongs to the Special Issue Climate Change Impacts, Adaptation, and Mitigation in Urban Areas)

Abstract

:
Global warming and environmental changes have resulted in more frequent and extreme weather events, as well as larger-scale disasters around the world. This study presents a disaster risk analysis in Taiwan coastal area using the Climate Disaster Resilience Index (CDRI) and examines the strategies adopted by the coastal residents of Taiwan, through a new concept of “copability” analysis. Based on the results, the majority of the coastal regions fall under the medium-to-low resilient category with the south-western and northern coast of Taiwan as the most high-risk regions posing a high risk to millions of people facing climatic disasters in the future. The coping mechanisms used by local residents are also influenced by the socioeconomic status of the decision-makers as well as the synchronization of disasters. Based on the findings, a 4R management package is developed in which the copability and resilience management strategy are squeezed into four main sectors of resource, reason, roadmap, and respond to work towards a more coordinated management and use of natural resources across sectors and scales. It is advised that all governmental, private, and community actors implement coherent climate risk management measures, accompanied by mitigation initiatives, in order to establish a sustainable level of climate resilience in cities.

1. Introduction

Urbanization is generally associated with an increase in disaster risk, owing to the rapid growth of the urban population [1]. Natural disasters have intensified and become more frequent in the twenty-first century as a result of climate change’s effects [2]. Climate change challenges are increasingly recognized as a serious threat to the future of the environment and civilization, and improvements are needed to put the world on a climate-resilient path in the future [3]. Climate change mitigation and adaptation are thus required to avoid severe effects of anthropogenic climate change [4] on regions that are “particularly vulnerable” to climate change.
The term vulnerability has been defined in various ways by different scholarly teams. The notions of vulnerability vary so greatly without further elaboration that the phrase becomes multidisciplinary in an almost meaningless manner [5]. Vulnerability has been linked or matched to conditions such as resilience, sensitivity, adaptability, risk, coping capacity, and robustness. Several research have distinguished between biophysical and social vulnerability, despite a lack of agreement on what these terms exactly mean [6,7].
The quantification of climate change risks is crucial to helping a city identify the possible benefits of adapting to climate change and thus take proactive adaptive measures [8]. Many climate change vulnerability assessments link vulnerability to the consequence of hazard exposure, which is a crucial component of the risk-hazards technique. Simultaneously, they emphasize the importance of socioeconomic variables (also known as adaptive or coping capacity) in determining the susceptibility of locations and demographic groups [5].
Meanwhile, there is a growing trend in which climate change resilience is included in development planning and resource allocation. At the World Conference on Disaster Reduction (WCDR), the relationship between climate change and disaster risk reduction was the focus of intense official and informal debates [9]. Furthermore, the ‘Hyogo Framework for Action 2005–2015’ highlighted climate change as one of the risks to the world’s future, and disaster risk management planning as one of the major key areas to address these concerns [10]. Recognizing the need of establishing methodologies and techniques for assessing resilience has grown in tandem with its conceptual evolution [11,12]. Although resilience has been studied extensively, there is still a lack of consistent characteristics or standard metrics that can be used to evaluate the disaster resilience of specific populations or a particular region. Mulligan et al. [13] argued that community is a “multi-layered” concept where they can “function simultaneously across multiple scales” amongst communities. In another study by Almeida et al. [14], the exposure to natural hazards was assessed using four indicators that describe the exposure of Brazilians towards landslides, floods, droughts, and sea level rise. According to their work, vulnerability comprises susceptibility, coping capacity, and adaptive capacity and is measured using 32 factors that reflect a society’s social, economic, and environmental characteristics. Cutter et al. [15] proposed the disaster resilience of place (DROP) model as a conceptualization of natural disaster resilience to present the relationship between vulnerability and resilience and to improve comparative assessments of disaster resilience at the local or community level. An agent-based model was later developed by Yang et al. [16] that simulates flood response preferences and actions taken within individual households to reduce flood losses, highlighting the key role of people in mitigating flood impacts before, during, and after a flood. Using community risk assessments (CRAs) for climate change adaptation was examined in another study by van Aalst et al. [17] where CRA refers to participatory methods for assessing hazards, vulnerabilities, and capacities. All of these initiatives highlight the importance of better understanding the relationships between the causes of climate change risk (hazards, exposure, susceptibility, and adaptability), as well as measurements and policy options for coping with such a risk [3].
Although global awareness has developed in support of programs to promote resilience, existing ways to evaluate and track resiliency have not effectively achieved the required regulatory approval. The quantification of household resilience relies mostly on ‘objective’ indicators, such as the identification of major socioeconomic variables that sustain the livelihoods of individuals. The selection of these elements is also worthwhile and controversial [18,19].
The Climate Disaster Resilience Index (CDRI), established by Kyoto University’s Climate and Disaster Resilience Initiative, is one of the planning tools used in assessing climate disaster resilience across five dimensions: physical, social, economic, institutional, and natural [20].
Although some disaster resilience studies have successfully implemented CDRI, subjective household resilience as a supplemental tool to evaluate resilience has been mainly neglected and the resilience score may not properly represent future risks facing local people. People not only have a realistic view of their strengths, abilities, and limitations but also employ a range of ways to tackle the impact of climate change [21]. According to the urban vulnerability assessment approach, people and individuals in every society are more vulnerable and unable to adapt to climate change. People’s ability to address and cope with potential hazards is influenced by demographic, health, and socioeconomic factors which influence risk mitigation, response, and natural disaster rehabilitation [22].
Individuals, particularly those in vulnerable locations, such as coastlines, use various coping techniques in response to environmental stresses and natural risks. Communities may be subjected to stressful situations that they are unaware of [23]. This is especially important in communities that rely on rainfed farming and other natural resource-based activities. Not only would average climate change have an impact on these areas, but climatic variability, particularly extreme events, could have even a greater impact as well [24].
Significant lessons can be drawn from studying how to cope with increased vulnerability caused by climate change, as well as extreme weather events, such as floods, heavy rainfall, heat, and drought, and how to deal with their hazards, particularly for urban residents in coastal regions with a high sensitivity to natural disasters.
The objective of this research is to add to our current understanding of urban coping strategies by examining the tactics developed and accepted by Taiwanese coastal dwellers, as well as to the discussion of how grassroots coping skills might be used to influence adaptation planning. Understanding these current disaster risk reduction capabilities can assist cities in strengthening their adaptation planning procedures, as they rely on established grassroots governance processes and knowledge systems.

2. Materials and Methods
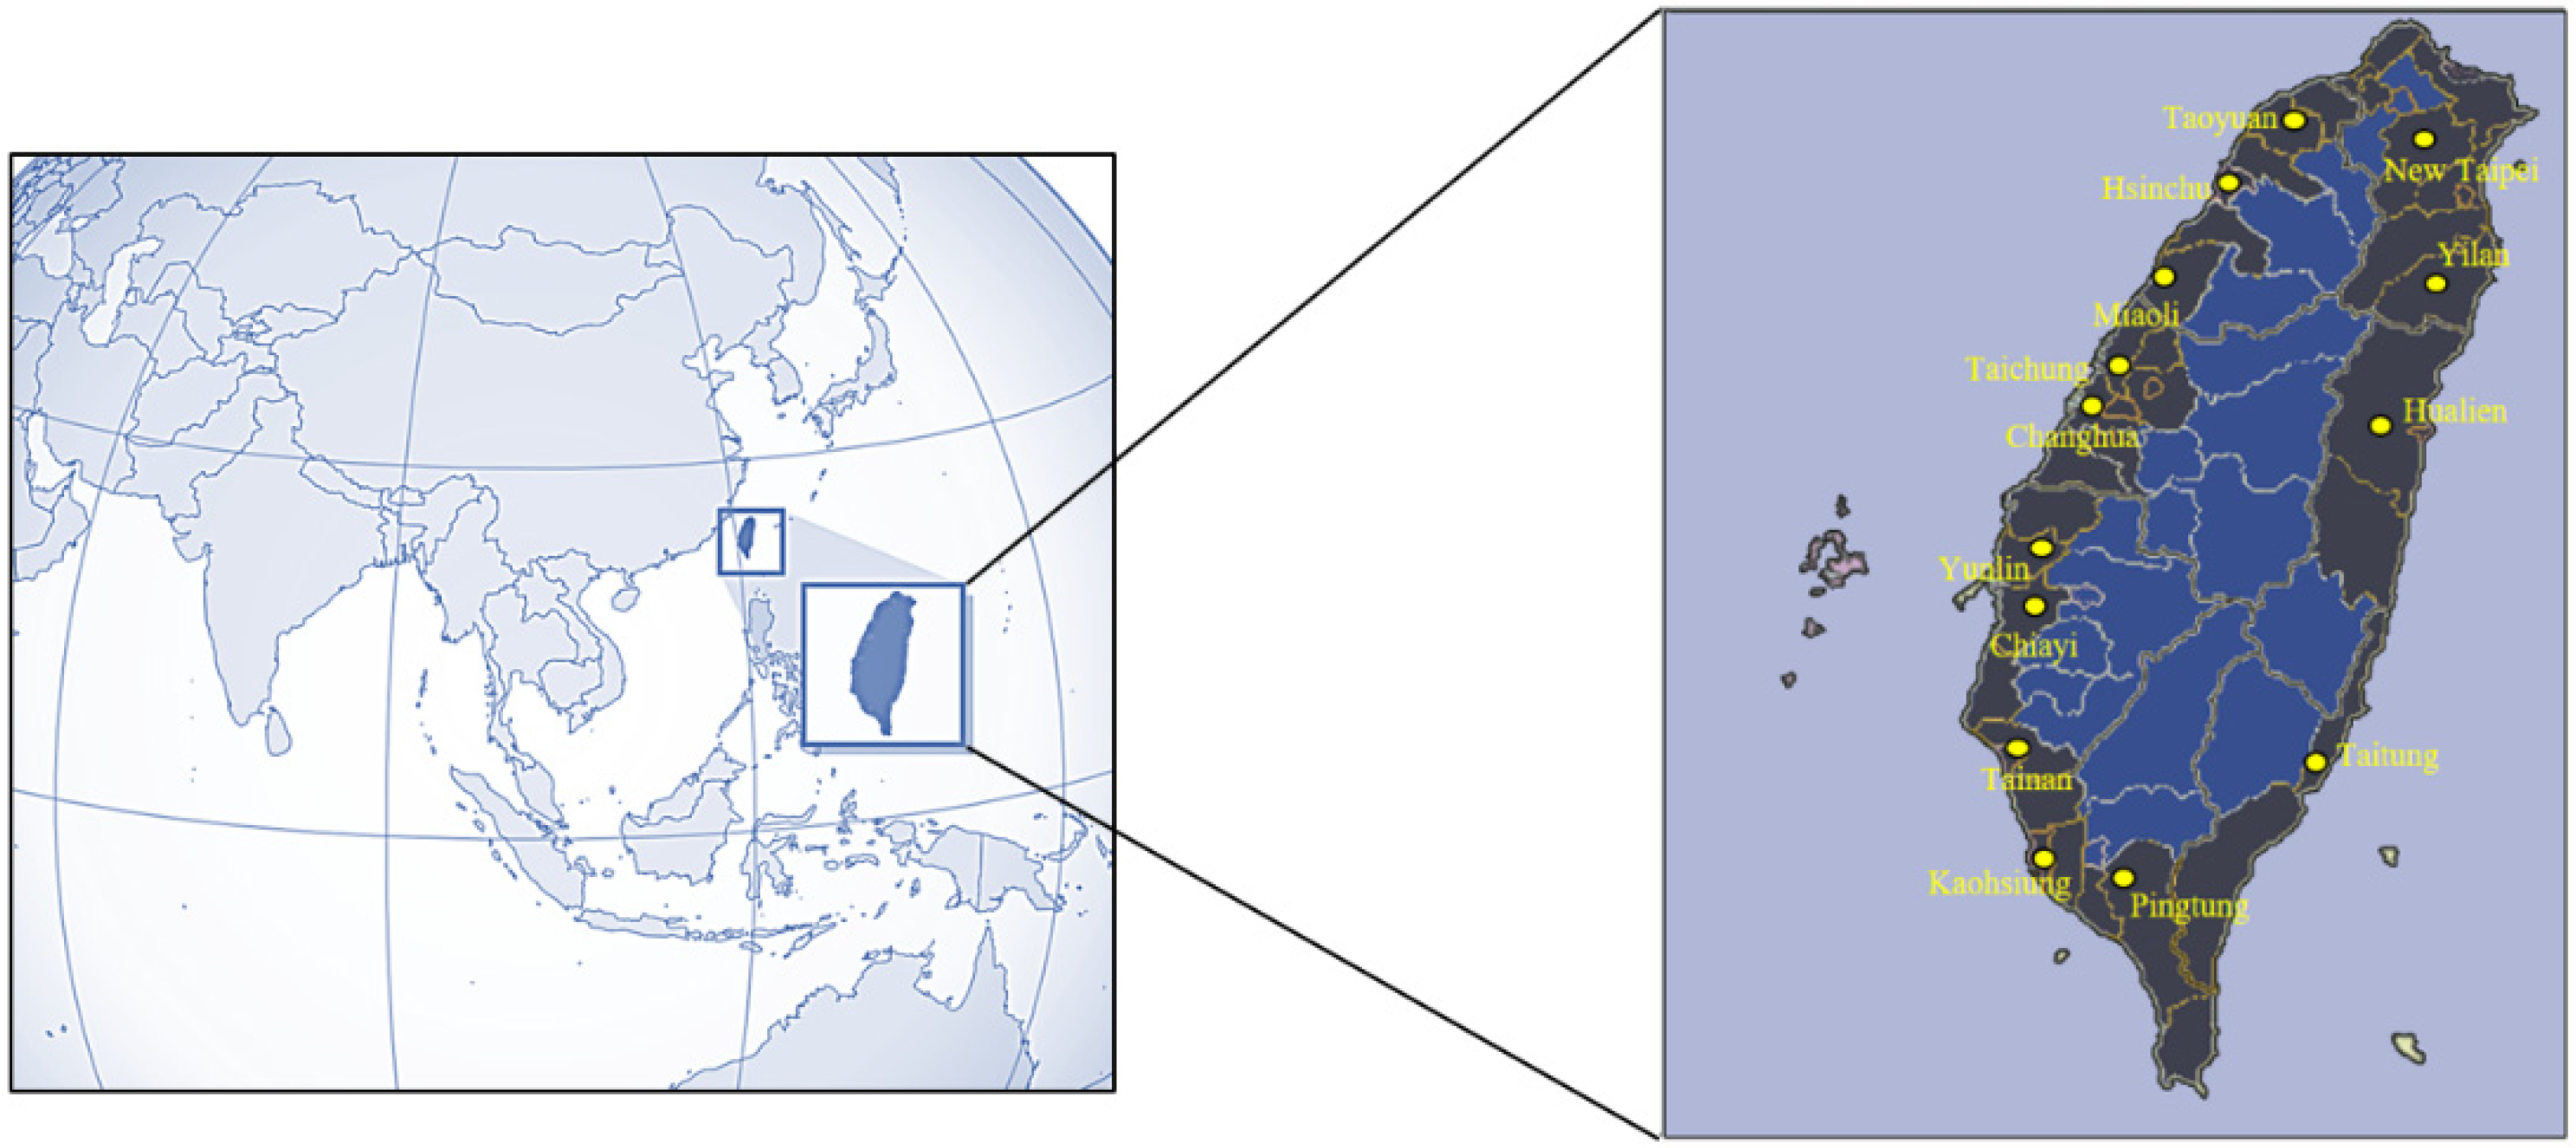
2.1. Study Area

Taiwan is one of the world’s most vulnerable regions, frequently affected by natural disasters. Typhoons, floods, landslides, droughts, and earthquakes are the most prevalent natural disasters in Taiwan [25,26].
The coastal residential area of Taiwan was chosen as the study’s target area because residents are frequently impacted by natural disasters and climate change, such as storms, sea waves, tides, and sea level rise. The study covered residential coastal districts in Taiwan (Figure 1), where adequate ecological and socioeconomic information exists. The selection was based on their potential risk to climate-induced disasters, as well as their different city structures and population densities.
Water level fluctuations produced by storm surges and typhoon-induced high tides frequently inflict severe damage to Taiwan’s coastal regions [27]. Additionally, numerous communities are located near the coast and face a range of hazards, including coastal flooding [28].

2.2. Socioeconomic Status of Taiwan’s Coastline

Taiwan’s 1319-km-long coastline features a diverse range of topographies, from white sand or darker gravel beaches to coral reefs and rocky coasts, from the gently sloping west coast to the rough east coast [29]. Although Taiwan’s coastline covers only around 3% of its total geographical area, the majority of the population lives along the shore, with 90% of the people living in the west plain [30], where they face a variety of risks, including coastal flooding. Taiwan’s rapid economic expansion has resulted in population growth and a scarcity of suitable land. Coastal land reclamation projects (for example, harbors, recreational parks, and industrial parks) have become more prevalent in recent years. These human actions are widely believed to be the primary cause of modern coastal erosion. As the shoreline recedes landward, storm waves may demolish a natural buffer zone, resulting in the loss of homes and property [31].
Coastal processes are affected by human activities that interfere with natural sediment flow. In Taiwan, tourism is regarded as a natural component of the socioeconomic fabric in many coastal locations as a result of the Taiwanese government’s goal of turning fisheries into tourism [32]. The growing popularity of marine tourism highlights the importance of the coastal and marine environment in providing open space and possibilities for recreation, contemplation, and physical activity [33]. Yet, Taiwan’s coastline is one of the most vulnerable in the world, due to a mix of frequent natural hazards, most notably earthquakes and typhoons, and high levels of coastal development [34].

2.3. Climate Disaster Resilience Index (CDRI)

The Climate Disaster Resilience Index (CDRI) is a management tool for analyzing society’s resilience to climate disasters at various levels. The CDRI analysis uncovered critical information that may be used to guide strategic planning and policy development. The investigation provides effective evidence that may be used to prioritize disaster-prone zones and sectors [35]. Despite the lack of a universal method for assessing disaster resilience, it is mainly characterized by the state of various dimensions of well-being or “rigidity,” such as the physical, social, economic, institutional, and natural aspects of wellbeing. For instance, the infrastructure component refers to a region’s ability to respond to, withstand, and recover from disasters, and physical capability is an integral part of any community resilience architecture. When people are displaced or face a disaster, they need to be able to access food, water, and sanitation, as well as housing, to aid in their recovery [36]. The importance of the social and economic resilience dimension has been widely recognized by the scientific community among all different indicators. Social and economic resilience in coastal regions refers to a community’s ability to live on scarce natural resources when it is generally highly reliant on such resources [37]. While the economic pillar is influenced by post-disaster property loss and the effects of business disruption, the social pillar is influenced by factors related to communications, risk awareness, and preparedness which are linked to a community’s demographics and resources [38]. The institutional dimension, on the other hand, is crucial for informed decision-making and coordinated action [39]. High institutional quality and governance can guarantee that emergency planning, as well as climate change adaptation and resilience measures, are implemented effectively [15,40]. A well-functioning democracy, according to Larsen [41], is positively connected with the amount of societal trust in the system.
Finally, the natural dimension’s resilience is measured in terms of the intensity/severity of natural hazards, the frequency of natural hazards, ecosystem services, natural land use, and environmental policies [20]. Natural disasters that threaten coastal communities vary depending on their location and climatic circumstances. Typhoons (heavy rain), floods, extreme temperatures, and water scarcity are some of the natural disasters that Taiwan may confront. The natural dimension is crucial in shaping the regions and its different zones’ natural resilience.
Each of these dimensions comprises a collection of parameters, each of which contains a variety of variables. Furthermore, these features can be used to evaluate a coastal community’s resilience to climate disasters [30]. CDRI is intended to inform experts and city managers about the current and future susceptibility of their cities to climate disasters. Weights were assigned to aid in the description of CDRI. The Aggregate Weighted Mean Index (AWMI) was calculated using the Weighted Mean Index (WMI) approach (for each dimension). The calculated AWMI of a dimension is the dimension’s CDRI. To start, a rating system was developed, and subjective weights were assigned based on how city officials judged the vulnerability of each feature in comparison with each other. Each dimension (natural, physical, social, economic, and institutional) is associated with a number of variables (Table 1) that are used to compute their respective scores. Resilience patterns and spatial variations of high/low-resilience areas can be studied using this method to enable future planning decisions and the improvement in community resilience in the future [30]. An example of a CDRI variable set of questions is shown in Table 2. Detailed information on CDRI dimensions and assigned variables can be found in [30].

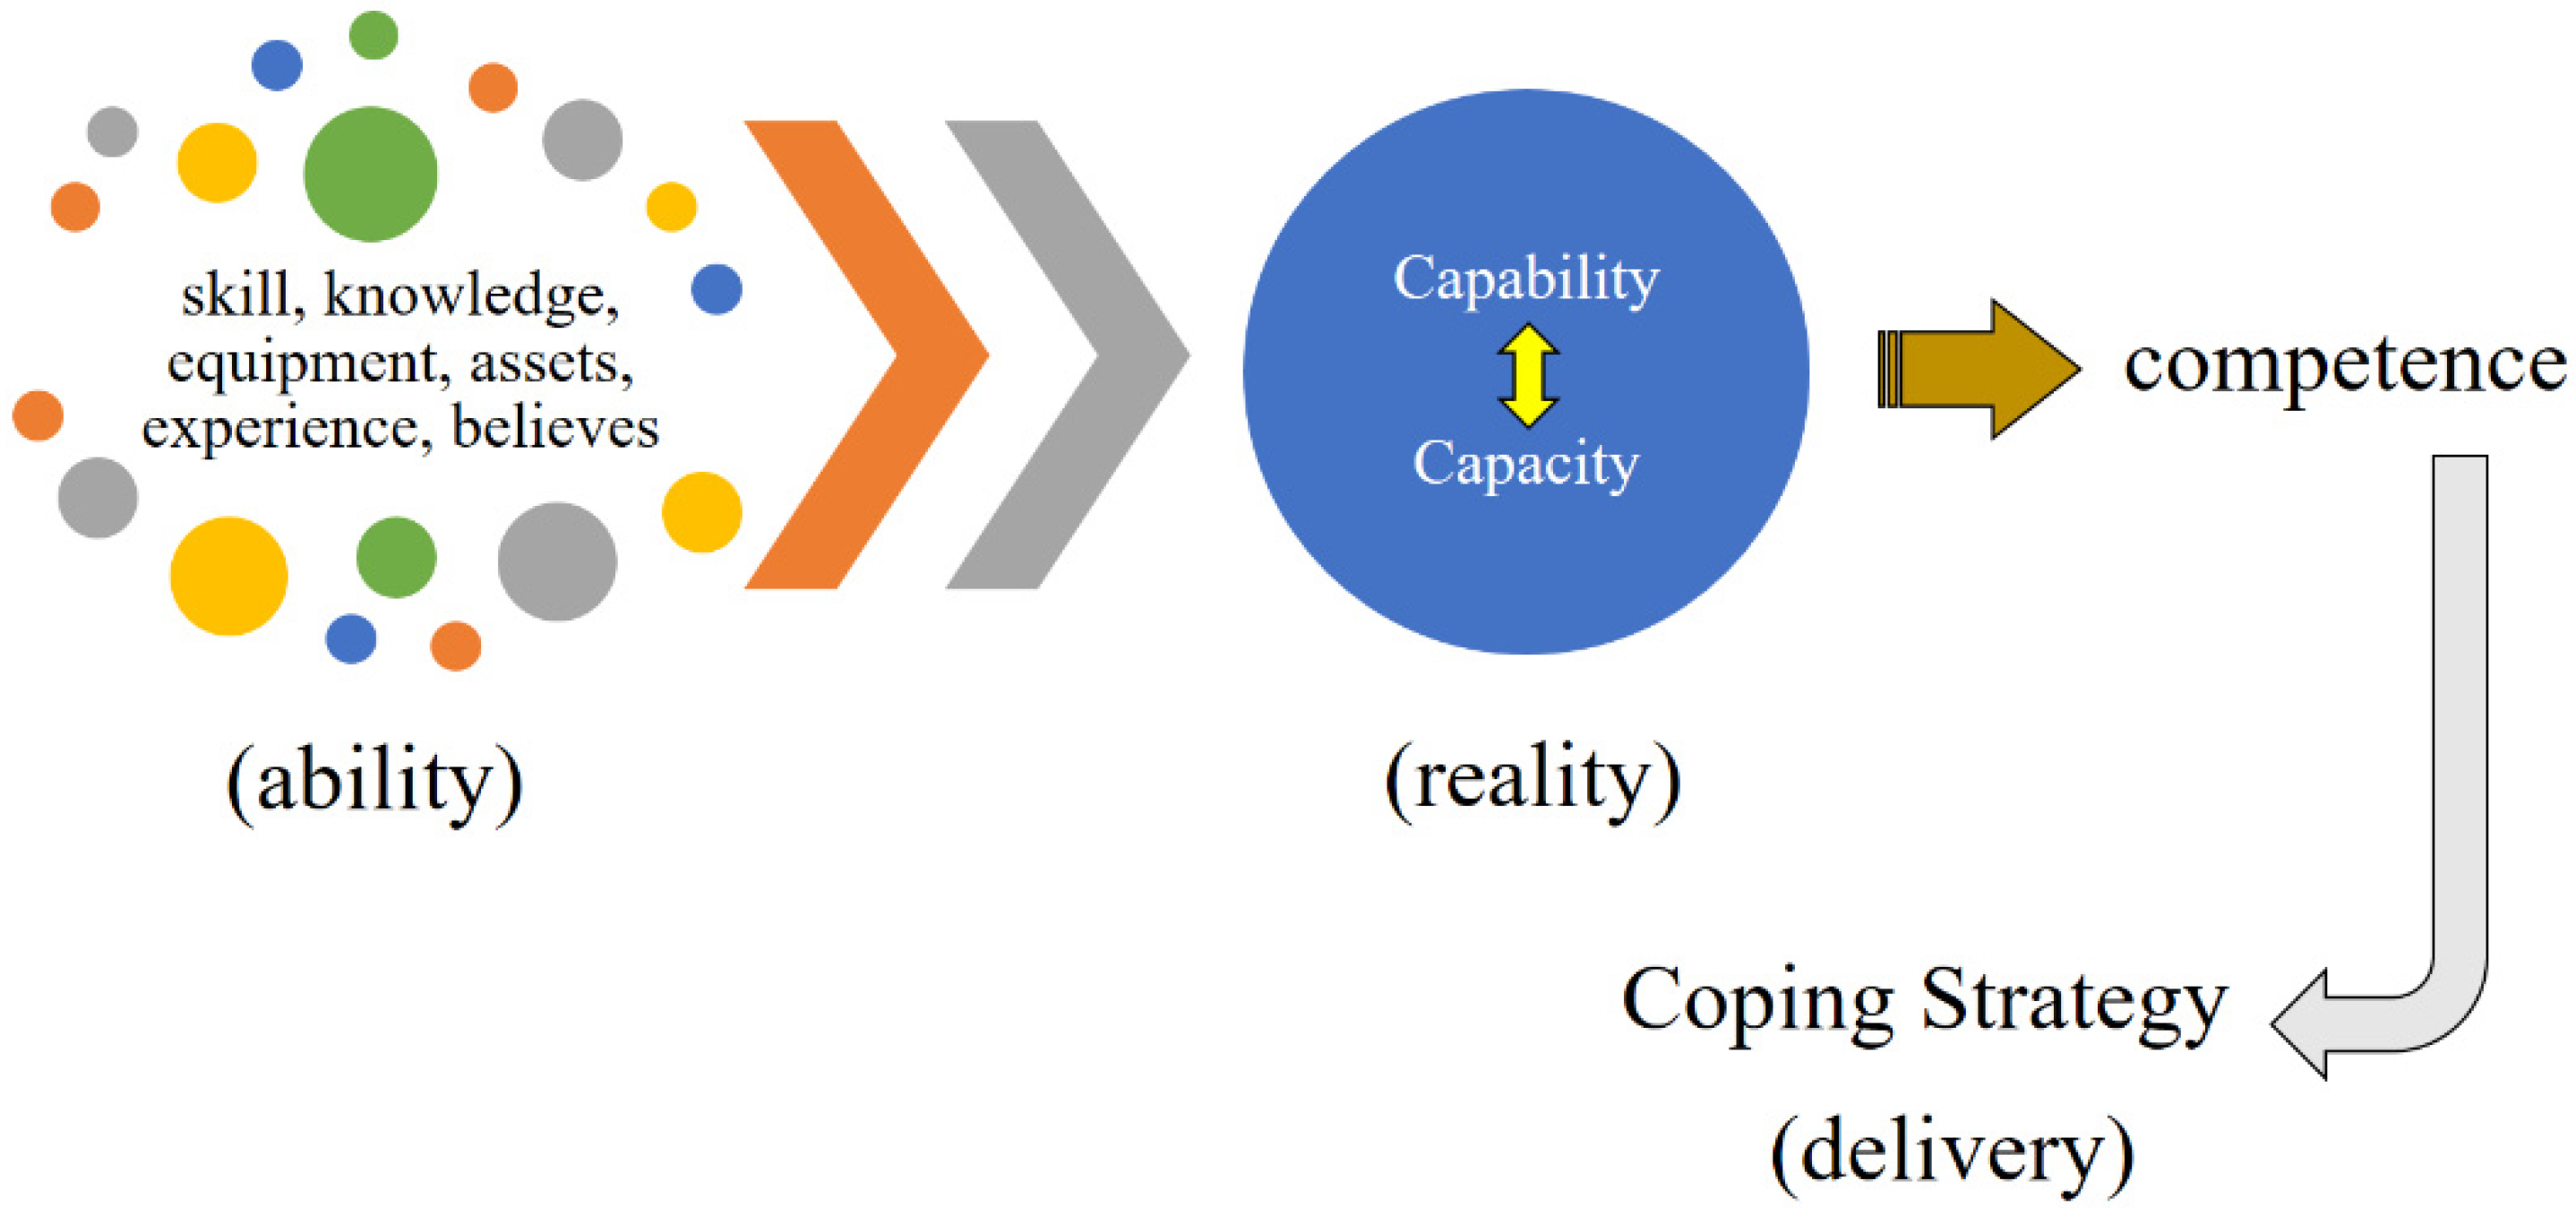
2.4. Coping Ability (Copability)

Coping and resilience are two well-known connected ideas in psychology that refer to how we deal with issues and difficulties and recover from misfortune or adversity [42]. The terms “resilience” and “coping capacity” sound identical at first glance, and that is because their definitions are so similar. However, resilience is a system attribute that can affect either human and natural systems or just one of them. Conversely, coping capacity focuses on the unique abilities and specific strategies used by human systems to contribute to resilience. When a system is resilient, it can withstand a certain amount of stress or change while still maintaining its core structure, functionality, and organization [43]. On the other side, coping capacities are the social and technical skills and strategies of individuals and groups that are directed towards responding to environmental and socioeconomic changes.
Coping strategies are the cognitive and behavioral changes that occur as a result of managing an individual’s distinct external/internal stressors [44]. Building resilience and responding to climate change will necessitate work at numerous levels and across industries. Investing in communities and people most vulnerable to the impacts of climate change will need to be matched by more effective national policies, risk management systems, and response capacity [45]. A competency is the capacity to apply or deploy a collection of related knowledge, skills, and abilities required to successfully perform “important work functions” or activities in a particular work situation. We should assess a city’s resilience in terms of competence: the capacity to do a task successfully or efficiently. Resilience and coping are related but distinct entities in terms of their influence on behavioral changes. Coping refers to cognitive and behavioral techniques for dealing with and managing stressful events or negative and physical repercussions [46], whereas resilience is the adaptive capacity to recover from stressful conditions in the face of adversity [47]. In this study, we also try to explore local inhabitants’ coping mechanisms and behavior in the context of a successful Community idea to deal with stressful conditions both internally and externally (Figure 2).
Coping is typically divided into two types: reactive coping (a reaction to the stressor) and proactive coping (an attempt to avoid future stresses) [48]. With this knowledge, individuals can choose one or a combination of three approaches to dealing with shocks and disasters: problem-solving, seeking social assistance, or avoiding them (ignorance). To broaden the range of possible responses by local communities, we assessed five alternative coping strategies employed by coastal households in the case of extreme weather events (Figure 3). These coping mechanisms were chosen based on the primary coping strategies used by people in distressing situations, preliminary research, and expert-led focus groups. The term “copability” was coined in the current study to refer to both the abilities and capacities of coastal residents to cope with climate-related disasters.

2.5. Data Collection

The primary method of data collecting in this study was through a questionnaire survey, with two distinct sets of questions prepared specifically for the purpose of the study. To begin, a questionnaire survey was distributed to key informants from the respective authorities and scholars involved in the planning and development of cities and disaster risk management for the purpose of conducting a CDRI analysis; and second, a copability questionnaire survey was distributed to coastal households and local residents for the purpose of conducting a coping strategy analysis. A survey questionnaire for CDRI analysis of different components of the area of study was developed with 125 variables (five dimensions × 5 parameters × 5 variables), where each parameter was evaluated using five choices, between 1 = poor and 5 = best, as x1, x2, ..., x5.
Further analysis was carried out in order to understand the strength and weaknesses of each administrative area and their interconnections. In order to acquire some variables, especially physical and nature data, secondary sources, such as semi-structured interviews, focus groups, direct observation, population census reports, government annual documents, and official authorities’ websites were also used. CDRI was then estimated using data from the questionnaire and secondary sources for each study area. In addition, the weighting of the AWMI technique was computed to better understand the resilience of each dimension. A rating scale has been developed and weight subjectively allocated for this purpose on the basis of how the city officials regarded every parameter’s vulnerability using the comparative method. To achieve this, respondents were asked to apply weights to variables and parameters ranging from less important (1) to high importance (5) using a weighting approach (w1, w2, ..., w5) in order to reflect the priorities in the study area and the relevance of the indicators to the local situation. The CDRI of one dimension was the estimated value of the AWMI of that dimension. The final score of each parameter was then calculated, followed by a standardized approach to calculating the final CDRI values:
i = 1 n w i x i i = 1 n w i = w 1 x 1 + w 2 x 2 + w 3 x 3 + w 4 x 4 + w 5 x 5 w 1 + w 2 + w 3 + w 4 + w 5
where x represents the variable, and w is the assigned weight. Overall, the CDRI values were obtained after averaging each of the five dimensions’ resilience values [30,49].
It is noted that two different sets of data collection procedures were used for this study. One for CDRI analysis and the other for copability assessment to see how the system’s properties (resilience) contributed to the coping capacity of individuals in case of natural disaster. For CDRI analysis, around 385 questionnaire survey responses were received for each coastal side (western coast: Kaohsiung, Tainan, Chiayi, Yunlin, Changhua, Taichung, Miaoli; northern coast: Hsinchu, Taoyuan, New Taipei, Yilan; eastern coast: Hualien, Taitung; and southern coast: Pingtung) from various stakeholders and city officials with diverse backgrounds of all respondents to the survey, of which 32% were local government officials, 47% were scholars and academicians working in relevant departments, 15% were civil society actors, and the rest were other groups, including the private sector. Informed consent was also obtained from all participants included in the study.
Surveyed studies suggest that people choose coping strategies depending on the characteristics and nature of the disaster [50] A stressor can be caused by climate or weather conditions, such as drought or flooding; human health problems, such as illness or the death of a household member; crop insect infestations or animal diseases; or pricing shocks, such as high food/input prices. Whether they occur concurrently or sequentially, shocks result in either a loss of real income [51] through reduced profits, increased consumption expenditures, or asset destruction, or in the death or illness of family members.
This study exclusively looks at climatic shocks and disasters that have a large impact on humans in a specific place. To extract information about household adaptation to climate change disasters, a climate copability study was conducted using questionnaire-based interviews.
For copability assessment sampling, the target population was local people and coastal residents living in western coastal areas (Kaohsiung, Tainan, Chiayi, and Yunlin) based on the CDRI results of the least resilient cities (mostly consist of farmers, workers in fishery industry, and small-scale business proprietor). A multi-stage sampling procedure was used to choose the households. Within each coastal town, three zones were defined based on population density and administrative authority, and 43 houses were chosen using a random stratified sample within each zone. A total of 516 survey data were collected in the research area for copability analysis. Before the interviews, the participants were informed in their native language. As shown in Figure 3, the questionnaire survey addressed several situations for coping mechanisms, such as funding, behavioral change, and material support for infrastructure, food availability, information and technology, and spiritual beliefs. Respondents were asked about the climatic shocks they have experienced in the last five years, as well as the coping strategies they utilized to deal with the consequences of those shocks. Coping mechanisms are described in this study as specific efforts made by the household to control or attenuate, tolerate, minimize, or limit stressful circumstances. In order to decrease the possibility and degree of detrimental effects, most individuals were found to use coping systems both during and after the climate shock. The IPCC [4] states that adaptive capacity refers to the ability or capacity of a system to successfully respond to climate change and variability. It involves both behavioral and resource-related changes, as well as technological advancements. A household may occasionally adopt a variety of strategies to reduce the consequences of climate shocks, and these strategies were frequently tied to the socioeconomic position of the decision-maker. The following considerations will influence the technique for picking the best collection of coping mechanisms: (a) the capability of the family (family size, occupation, education, and age); (b) each family member’s awareness of climate change, as well as coping or adapting methods developed through training or other sources; (c) the severity of the shock: the extent to which the shock has harmed the family’s overall security [52]. Respondents were asked to rate the parameters (choosing a coping strategy for each occurrence) on a five-point Likert scale ranging from 1 (never) to 5 (always).

2.6. Investigating the Impact of Single and Multiple Climatic Disasters on the Selection of Coping Strategies

To mitigate and reduce the impact of disasters on income and asset losses, households will employ a variety of coping strategies. As a result, it is hypothesized that the type(s) of coping methods employed are also influenced by the properties of the events, particularly their idiosyncratic or covariate nature. The coping methods chosen by a household are determined by its objectives as well as its traditions and spiritual beliefs, which are particularly common in rural settings. Zimmerman and Carter [53] argued that households react differently to stressors depending on their asset status. This idea was supported experimentally by Hoddinott [54] utilizing rural Zimbabwe panel data. Asset development is also reported to be crucial for escaping chronic poverty and relieving food insecurity, according to Barrett et al. [55] and Hoddinott [54]. However, Ellis [56] discovered that when households face significant shocks, asset depletion is typically the last resort. Ansah et al. [57] shed fresh light on coping techniques by demonstrating that the coping technique used is reliant on whether the disaster occurs in isolation or in clusters. They discovered that when climate shocks are combined with health, pest, or price shocks, additional consequences emerge that influence households’ coping strategy selection.
The present survey on climate disaster management collects data on Taiwanese coastal residents and coping practices. Different stressors identified by households were classified as typhoons (heavy rain), floods, extreme temperatures, and water scarcity. Faced with these shocks, households described the various methods to be used. As shown in Figure 3, the reported coping techniques were divided into five major groupings.
In testing H1a, we assessed how many shocks can alter the possibility of selecting one of five categories with binary probit models (2) and (3). We explored the link between the number of shocks and the coping mechanism adopted in the probit model 1. (2):
P ( C j ) = 1 | n , X ) = G ( b 0 + b 1 n + b 2 W + b 3 X )
where a household’s choice for adopting coping strategy category j is Cj, (j = 1, …, 5), the number of shock categories is (= 0, 1, …, 4), shock characteristics are W, control variables are vector X and G is the cumulative density function (CDF) of the standard normal distribution. In model (1), rejecting b1 = 0 indicates that the number of disasters matters for choosing coping mechanism Cj (H1a).
Then using a probit model (2), we evaluated whether several events have a cumulative influence. This model comprises four dummy variables indicating whether a predefined number of occurrences (dn = 1) or none (dn = 0) has been reported by the family. The category with no disasters (n = 0) is used as the reference. The strength of each event here is considered to be consistent and that households do not face several cases of the same type of disaster.
P ( C j = 1 | n , X ) = G ( b 0 + b 11 d 1 + b 12 d 2 + b 13 d 3 + b 14 d 4 + b 2 W + b 3 X )
The difference between parameters is checked sequentially, i.e., b12b11; b13b12; b14b13, equal zero. Significant deviations from zero show that exposure to a greater number of disasters has an effect on coping strategy selection. The incremental effect of additional stresses on coping strategy selection can then be assessed by means of model (2) [57].

3. Results and Discussion

The spatial distribution of CDRI scores showed that the majority of the coastal regions fall under the low and medium-to-low resilient category (Figure 4).
Using indicator-based resilience analysis, our study recognized that most high-risk regions are located along the south-western as well as the northern coast of Taiwan particularly Taoyuan and Yilan. We also found some moderate to low resilient regions along Hualien and Taichung.
Typhoon surges, wave set-up, and overtopping, as well as land subsidence, are all specific key challenges along Taiwan’s southwestern coastline, which, along with the region’s high population density, make it less resilient to climate change [58]. Climate change will also have an effect on the wet/dry season in the north in the future, likely resulting in flooding and coastal destruction and increasing vulnerability to its maximum level. In northern Taiwan, heavy rain and societal vulnerability as a result of socioeconomic expansion, household asset accumulation, and population density are key factors affecting the resilience score [59,60].
Additionally, CDRI scores varied among research regions. While the southwest and northern coasts had the lowest resilience levels (low to extremely low scores), other coastal zones rarely demonstrated high levels of resilience. The low resilience of Taiwan’s coastal zones to climate change has a negative impact on not just the marine environment, ecology, and human communities whose economies are heavily dependent on marine activities but also on the country’s economic sustainability. Southwest coastal residents are referred to be the first generation of climate refugees. They are routinely flooded as a result of prolonged land subsidence, storm wave destruction, rising sea levels, excessive rainfall, extensive inundation, and saltwater intrusion. As a result, Taiwan’s southwest coast is particularly vulnerable to climate change [61]. Additionally, both northern subtropical and southern tropical climates are dominated by a northeasterly winter monsoon and a southwesterly summer monsoon. Furthermore, long-distance transit contributes significantly to air pollution and environmental degradation in most of northern Taiwan’s regions [62]. In comparison, being less prone to extreme events and having a lower population density on the eastern coast increases the score for natural and physical dimensions, resulting in a higher total CDRI score in this area.
While the CDRI results indicated a greater degree of diversity in the institutional and economic categories, the overall score ranged from 1.1 for the economics and institutional component (Yunlin) to 4.49 for the physical component (New Taipei), based on analysis and comparison of different dimensions.
Six coastal cities with the lowest overall CDRI scores—Tainan, Kaohsiung, Chiayi, Taoyuan, New Taipei, and Yunlin—were chosen as hot spots for further analysis of various dimension scores and identification of coastal cities’ strengths, weaknesses, limitations, and potential risks in vulnerable zones. While the total CDRI ratings for these hotspots ranged from 2.72 for Yunlin to 3.88 for New Taipei, the majority of regions scored lower on natural dimensions, which is unsurprising given Taiwan’s placement in the IPCC’s high-risk group for climate change. Additionally, Taiwan’s ecology and ecosystem services have suffered severe damage in various spots as a result of the country’s rapid economic growth. Air and water pollution, soil degradation, and deforestation have all become significant challenges [63].
The analysis and comparison of different dimensions in hotspots (Figure 5) revealed that the CDRI scores were more diverse in the institutional and economic categories than in the natural and social dimensions.
Yunlin showed the lowest institutional and economic resilience scores among the least resilient areas. Yunlin County is located in central-southwestern Taiwan and has a subtropical climate. Typhoon-caused floods and debris flows are the most prevalent disasters in Yunlin County, where low-lying plains are especially vulnerable to flooding during heavy rains and typhoon season. Flooding may also occur in some metropolitan townships due to a lack of and/or inefficient drainage infrastructure [64,65]. Furthermore, because of its proximity to the Taiwan Straits, the county has a long history of fish farming as well as being a trading harbor, making the low-lying areas especially vulnerable to natural disasters. Emergency management which is an essential sector in the institutional dimension is largely dependent on the local economic and social conditions and divided into four stages of mitigation, readiness, response, and recovery [66]. The area’s low institutional and economic scores, possibly due to inadequate funding, result in a lack of preparedness, disaster recovery, and response planning [65].
Additionally, Yunlin County is the primary agricultural county in Taiwan. While rising sea levels cause coastal flooding, the coexistence of seawater intrusion and challenges associated with rainwater venting, resulting in significant agricultural and economic losses in central and southern regions, particularly Yunlin County. Furthermore, Yunlin County has been affected in recent years by climate change and artificial groundwater overexploitation, making coastal townships prone to flooding and severe subsidence [67].
On the other hand, New Taipei which is located approximately 200 km above Yunlin, showed the highest economy and institutional score. New Taipei City is a wide municipality that consists of both urban and rural zones, each with its own culture and characteristics [68]. In comparison to Yunlin, where population growth has been negative for over a decade, resulting in an aging society, the New Taipei City government has integrated resources at the local level and improved disaster management through the establishment of a large number of resilient communities [69]. With the global economy migrating steadily toward Asia, New Taipei City’s central location makes it an ideal place for international companies to establish regional or Taiwan headquarters [68]. In addition, New Taipei’s administration is giving more priority today to innovation on its policy agenda, acknowledging its economic capabilities and alleviating social and environmental challenges. Moreover, New Taipei City works closely with Taipei City to increase the political and economic weight of northern Taiwan [68].
Taoyuan received the lowest scores for natural resilience among the studied cities. Autumn and winter in Taoyuan are commonly associated with poor air quality due to the city’s vulnerability to northeast monsoons [70]. Additionally, Taoyuan serves as the gateway to Taiwan, housing the country’s main international airport. Taoyuan City is estimated to have the highest level of synthesized vulnerability in the northern region, which includes biophysical and social vulnerability, where potential flooding, industrial output, and family assets with a high degree of exposure may contribute to low natural and institutional scores [60]. Traditional management policies in this area are believed to have had a wide-ranging impact on socioeconomic issues, including changes in coastal land use patterns, the activation of underutilized fishing ports, and the economic development of coastal settlements [71].
Tainan and Kaohsiung scored similarly on the most of categories, with the exception of institutional when Kaohsiung significantly surpassed Tainan.
Although Kaohsiung has a high disaster rate and significant seasonal variation in rainfall patterns [72], it is a pioneer in Taiwan’s smart city movement, with the city government emphasizing the three “As” (Anytime, Anywhere, Anyone) as the goal of smart government service to its citizens, with any individual able to obtain necessary services at any time [73,74]. The local government is working hard to create a smart city by employing online services, the Cloud sensors, and mobile telecommunications to optimize and improve the life quality of its citizens [75]. On the other hand, Tainan is vulnerable to both extremes—floods and sea level rise, as well as strong typhoons. As a result, the city’s ecosystem’s quality (biodiversity, soil, air, and water quality) is degraded. Additionally, some districts’ aging infrastructure poses a threat to the economy’s resilience and institutional features, making it harder for local governments to meet demand in the event of a crisis [30].
Tainan, on the other hand, is vulnerable to both extremes—floods and rising sea levels, as well as severe typhoons. As a result, the condition of the city’s environment (biodiversity, soil, air, and water) has deteriorated. Furthermore, the aging infrastructure of some districts poses a threat to the economy’s resilience and institutional features, making it more difficult for local governments to meet demand in the case of a crisis [30].
It is noted that the CDRI parameters and variables in the current study are proximal representations of disaster resilience and therefore may not necessarily fully explain the actual resilience levels of real communities. This is one of the limitations of index-based approaches which may pose some management challenges. As only a few of the many disaster-resilience indices have been empirically validated, it is recommended to examine the validity of CDRI in future research to ensure its practical efficacy for other regions and situations. With no validation evidence showing that an index is useful in assessing disaster-resilience levels, policymakers have limited confidence to make investment decisions regarding resilience-enhancement projects [76]. A short collection of empirical-validation studies of disaster-resilience indices are presented in a study by Ji et al. [77] revealing that certain indicators, such as education, income, and place attachment, can be empirically valid, but their explanatory power varies significantly across the two outcome measures of resistant capacity and recovery capacity in the case study of Hong Kong residents.
A copability study was conducted on the cities that were the least resilient (Tainan, Kaohsiung, Chiayi, Taoyuan, New Taipei, and Yunlin). Residents of Kaohsiung were more likely to use structural and technological strategies (e.g., repairing, reconstructing houses with more durable materials, changing farming or aquaculture patterns, installing pumping machines, and early warning systems) than residents of Yunlin, who were more likely to use behavioral and spiritual mechanisms (e.g., worship and evacuation to a safer location) (Figure 6).
In addition, participants were asked to assign a weight to the most effective disaster-prevention technique. Residents of Chiayi and Yunlin believed that financial techniques, such as borrowing money, selling assets, and employing family resources, were more practical, whereas residents of Tainan and Kaohsiung believed that technological and structural operations were more effective (Figure 7). Seniors living alone, limited household assets, and inadequate healthcare are all factors that contribute to socioeconomic vulnerability in Yunlin County’s rural districts. Economic indicators are the most sensitive sector to climate change in this region, as it is primarily reliant on agriculture for the survival of the region’s resource-poor rural population. Furthermore, Yunlin County has experienced negative growth for nearly a decade as a result of long-term labor outmigration [67].
Although the findings revealed that people who reside in low-resilience areas used less efficient coping mechanisms when faced with disasters, these two measures were produced using two separate sets of data from different spatial scales, and so it may be influenced by the scale effect [78]. Nonetheless, this is likely to be more visible in social resilience as other aspects were evaluated more quantitatively and were spread more evenly across a region. According to Yang et al. [78], because of the different spatial scale effects of resilience measures, city-scale data are often more resilient to disasters than smaller-scale data (community or individual scale measurements). As a result, even if parts of a bigger urban system or community residences are destroyed, the major operations of the city can continue to work. This suggests that while a larger urban system is more resilient, a smaller community-scale system might lose all functionalities which consequently affect the coping techniques chosen by households and individuals when facing disasters.

3.1. The Effects of Single and Multiple Disasters on the Selection of Coping Strategies

The results of the probit models (1) and (2) for testing hypothesis H1a are presented in Table 3 and Table 4, respectively. The number of climatic disasters experienced by local residents was significantly associated with all coping techniques except the spiritual approach, probably because those with stronger spiritual convictions would engage in worship, self-regulation, and resource sharing regardless of disaster frequency. The findings showed that as the average duration of a disaster increased, so do the possibilities of adopting financial, behavioral, and structural-based strategies, while the choice of technological techniques was unaffected by disaster duration. Furthermore, the season in which a disaster happened had a significant impact only on the financial coping strategy, presumably because the majority of people in the study have season-dependent income.
Prior to the rainy season, usually from May to September, the majority of coastal residents would construct scaffolding to protect residential structures, shift furniture and appliances upstairs, or repair/rebuild structures using more durable materials. Moreover, as Taiwan’s farming population ages, agriculture can only be supported if farmers earn a living income. Because the majority of Taiwan’s farms are small and family-run, and the peak harvest season occurs in the autumn and winter, disasters that hit during the summer will likely compel residents to shift their strategy toward a more financial-based coping mechanism.
To confirm and quantify the cumulative impact of multiple disasters, we referred to the results of model (2). According to Table 4, experiencing two disasters concurrently greatly increased the possibility of choosing behavioral and structural coping mechanisms, such as relocating to a safe location, storing food and water, and erecting household protective structures. While meeting several disasters increased the possibility of employing the majority of coping strategies, the data indicated that the cumulative effects of disaster encounters had minimal effect on the likelihood of employing financial or spiritual coping strategies. In other words, regardless of the number of disasters, saving and diversifying income sources, as well as worship and self-regulation, can assist to lessen the damage. When there were more than two concurrent disasters, the difference in strategy selection became less important, though. Similarly, all other coping mechanisms, with the exception of technological mechanisms, demonstrated no significant difference between two to three concurrent disasters and more than three concurrent disasters, implying that when at least three concurrent disasters occur, a technology option is chosen.
Rational households would first prefer to deal with shocks using their available savings. Multiple shocks (especially more than two concurrent disasters) had a negligible incremental effect on the chance of these mechanisms being adopted. Similarly, those who adhered to spiritual beliefs employed worship and self-regulation to lessen the effects of disasters, regardless of the number of disasters occurring concurrently.
As Corbett [79] and Ellis [56] discussed when households are faced with disasters, they prefer low-cost policies, such as secured belongings, and the use of sandbags/concrete blocks as dykes over more expensive methods, such as changing cropping patterns, installing pumping machines, or early warning systems.

3.2. Conceptual Framework for Disaster Management

“The only constant is change” is a well-known phrase from Heraclitus, a late sixth-century BC Greek philosopher best known for his philosophy of change [80]. Indeed, life is continuously in a state of change and evolution. Climate change consequences are evident in a wide range of sectors and areas of society, including human health, agriculture and food security, water supply, transportation, energy, and ecosystems.
Calculating the risk of climate hazards involves an understanding of the region’s resilience and the community’s coping methods (copability). Although Taiwan ranked seventh in the 2017 United Nations Climate Change Conference in Germany [81] in terms of climate change impact countries, this study shows that Taiwan’s west coast has a major share of the high-risk locations where the storm surges, sea level rises, and shoreline erosion are possible. Priority should therefore be given to flood mitigation measures in these vulnerable regions in order to properly limit the hazard impact. Additionally, future research should use the Analytic Hierarchy Process (AHP) to estimate the weights of individual components to highlight the relative relevance of contributing variables in various domains [82]. Additional social aspects, such as hospitals, disabled care, and nursing homes should be incorporated in the computation, as well as a higher spatial resolution, to increase the accuracy of the technique.
Collective action capability, a high level of social capital (for example, strong community interactions), a strong community competency (including local government institutions and processes), and a robust infrastructure are all characteristics of climate-resilient communities. Resilience is not a one-size-fits-all personality trait. It encompasses everyone’s learned and formed behaviors, beliefs, and actions. The 4R package concept is offered in light of the current study’s findings, in which the resilience management strategy is organized into four key sectors: resource, reason, roadmap, and respond (Figure 8). In practice, it establishes a conceptual framework for studying and comprehending the interactions between the natural environment and human activities, as well as promoting more coordinated natural resource management and use across sectors and scales.

3.2.1. 4R Package: Resource

The first critical element in developing disaster management plans is to assess available and accessible resources, which are reliant on both natural and human-derived capital to varying degrees. While it is vital to protect natural resources from human activities, communities have demonstrated their ability to collaborate for the long-term benefit of those resources. Social capital is described as the importance placed on social interactions and social norms, the quantity of which affects an organization’s sustainability. People are more likely to accept collective acts in informal groupings because they feel others will join in as well [83]. It is critical to invest in both biophysical and social capital resources while making decisions, managing them, and strategizing.

3.2.2. 4R Package: Reason

Recommendations should not be made without a discussion of the probable consequences of failing to implement them (and lessons learned). This way, decision-makers can be fully apprised of the potential cost of inaction if the next natural hazard becomes a national disaster. Simply said, recommendations should not be issued without awareness of the ramifications of their non-implementation [82]. Following that, education will include both training recommendations and follow-up cautions.

3.2.3. 4R Package: Roadmap

Additionally, resilience might be described as the capacity to withstand extreme future threats successfully. Mapping a country’s resilience is crucial because it enables planners and policymakers to identify areas of greatest risk [84]. A roadmap, on the other hand, will be unsuccessful at expressing vision and strategy unless the detailed planning process and scope of action for each dimension have been thoroughly considered, validated, and agreed upon. This action-oriented approach is critical to the success of resilience-building across its various stages of development. Utilizing disaster resilience indices can aid in establishing each region’s strengths and weaknesses, as well as the level of effort required to facilitate hazard planning and urban resilient structure.

3.2.4. 4R Package: Respond

The Water–Energy–Food Nexus has evolved into a powerful model for explaining and addressing the complexity and interconnectivity of the world’s resource systems. Although the nexus idea clearly depicts the complex and interconnected nature of our global resource systems [85], the major role of people in the three-dimensional nexus has largely been overlooked. While each city management team is responsible for developing their own adaptation, mitigation, coping, and response plans, local residents are likely to be the most impacted and resource-scarce if they are to respond effectively to climate change. Understanding how historical climate change implications impacted local residents—in this example, coastal—and how societies responded or failed to adapt can provide important insights into how to adapt to similar or equivalent consequences in the future [84]. To select the “best” climate change plan, decision-makers and stakeholders must first establish the social values and selection criteria to be used [86].

3.2.5. Interdependency of 4R Package, Resilience, and Copability

The 4R package emphasizes a “conceptual management approach” that aims to enhance resilience while also increasing the efficiency of coping mechanisms during extreme weather events. In other words, resilience is characterized by the system’s contributions to the success of people’s coping mechanisms in the face of climate change [87]. Additionally, according to the proposed 4R package, optimal indicators of resilience (natural, social, institutional, economic, and physical) are not only theoretically related to the risk experienced but also to people’s chosen coping styles and skills in emergencies. It is important to recognize that a focus on resilience does not exclude mitigation activities, particularly when evaluated through the lens of community resilience [88,89]. Indeed, when individuals are aware of collective resources for adaptive response to extreme weather and the broader goals of climate change mitigation, competing individual and collective interests can be balanced. For example, perceived social cohesion has been linked to disaster preparedness [90,91]. On the other side, extreme weather events and climatic disasters provide an opportunity to strengthen and build new social bonds [92]. By increasing empathy and identification with fellow victims [93], shared experiences of such adversity might promote pro-social behavior, improve well-being, and enable those affected by climate change to respond more effectively.

4. Conclusions

The current study used the Disaster Risk Index and coping ability analysis to identify possibly high- and low-risk sites along Taiwan’s coast. The Yunlin area was found to be the most vulnerable, facing economic, ecological, social, and institutional risks. Additionally, it was demonstrated that the households of this area had inadequate coping skills in the event of a crisis. The overall findings of the current study have been supersized as follow:
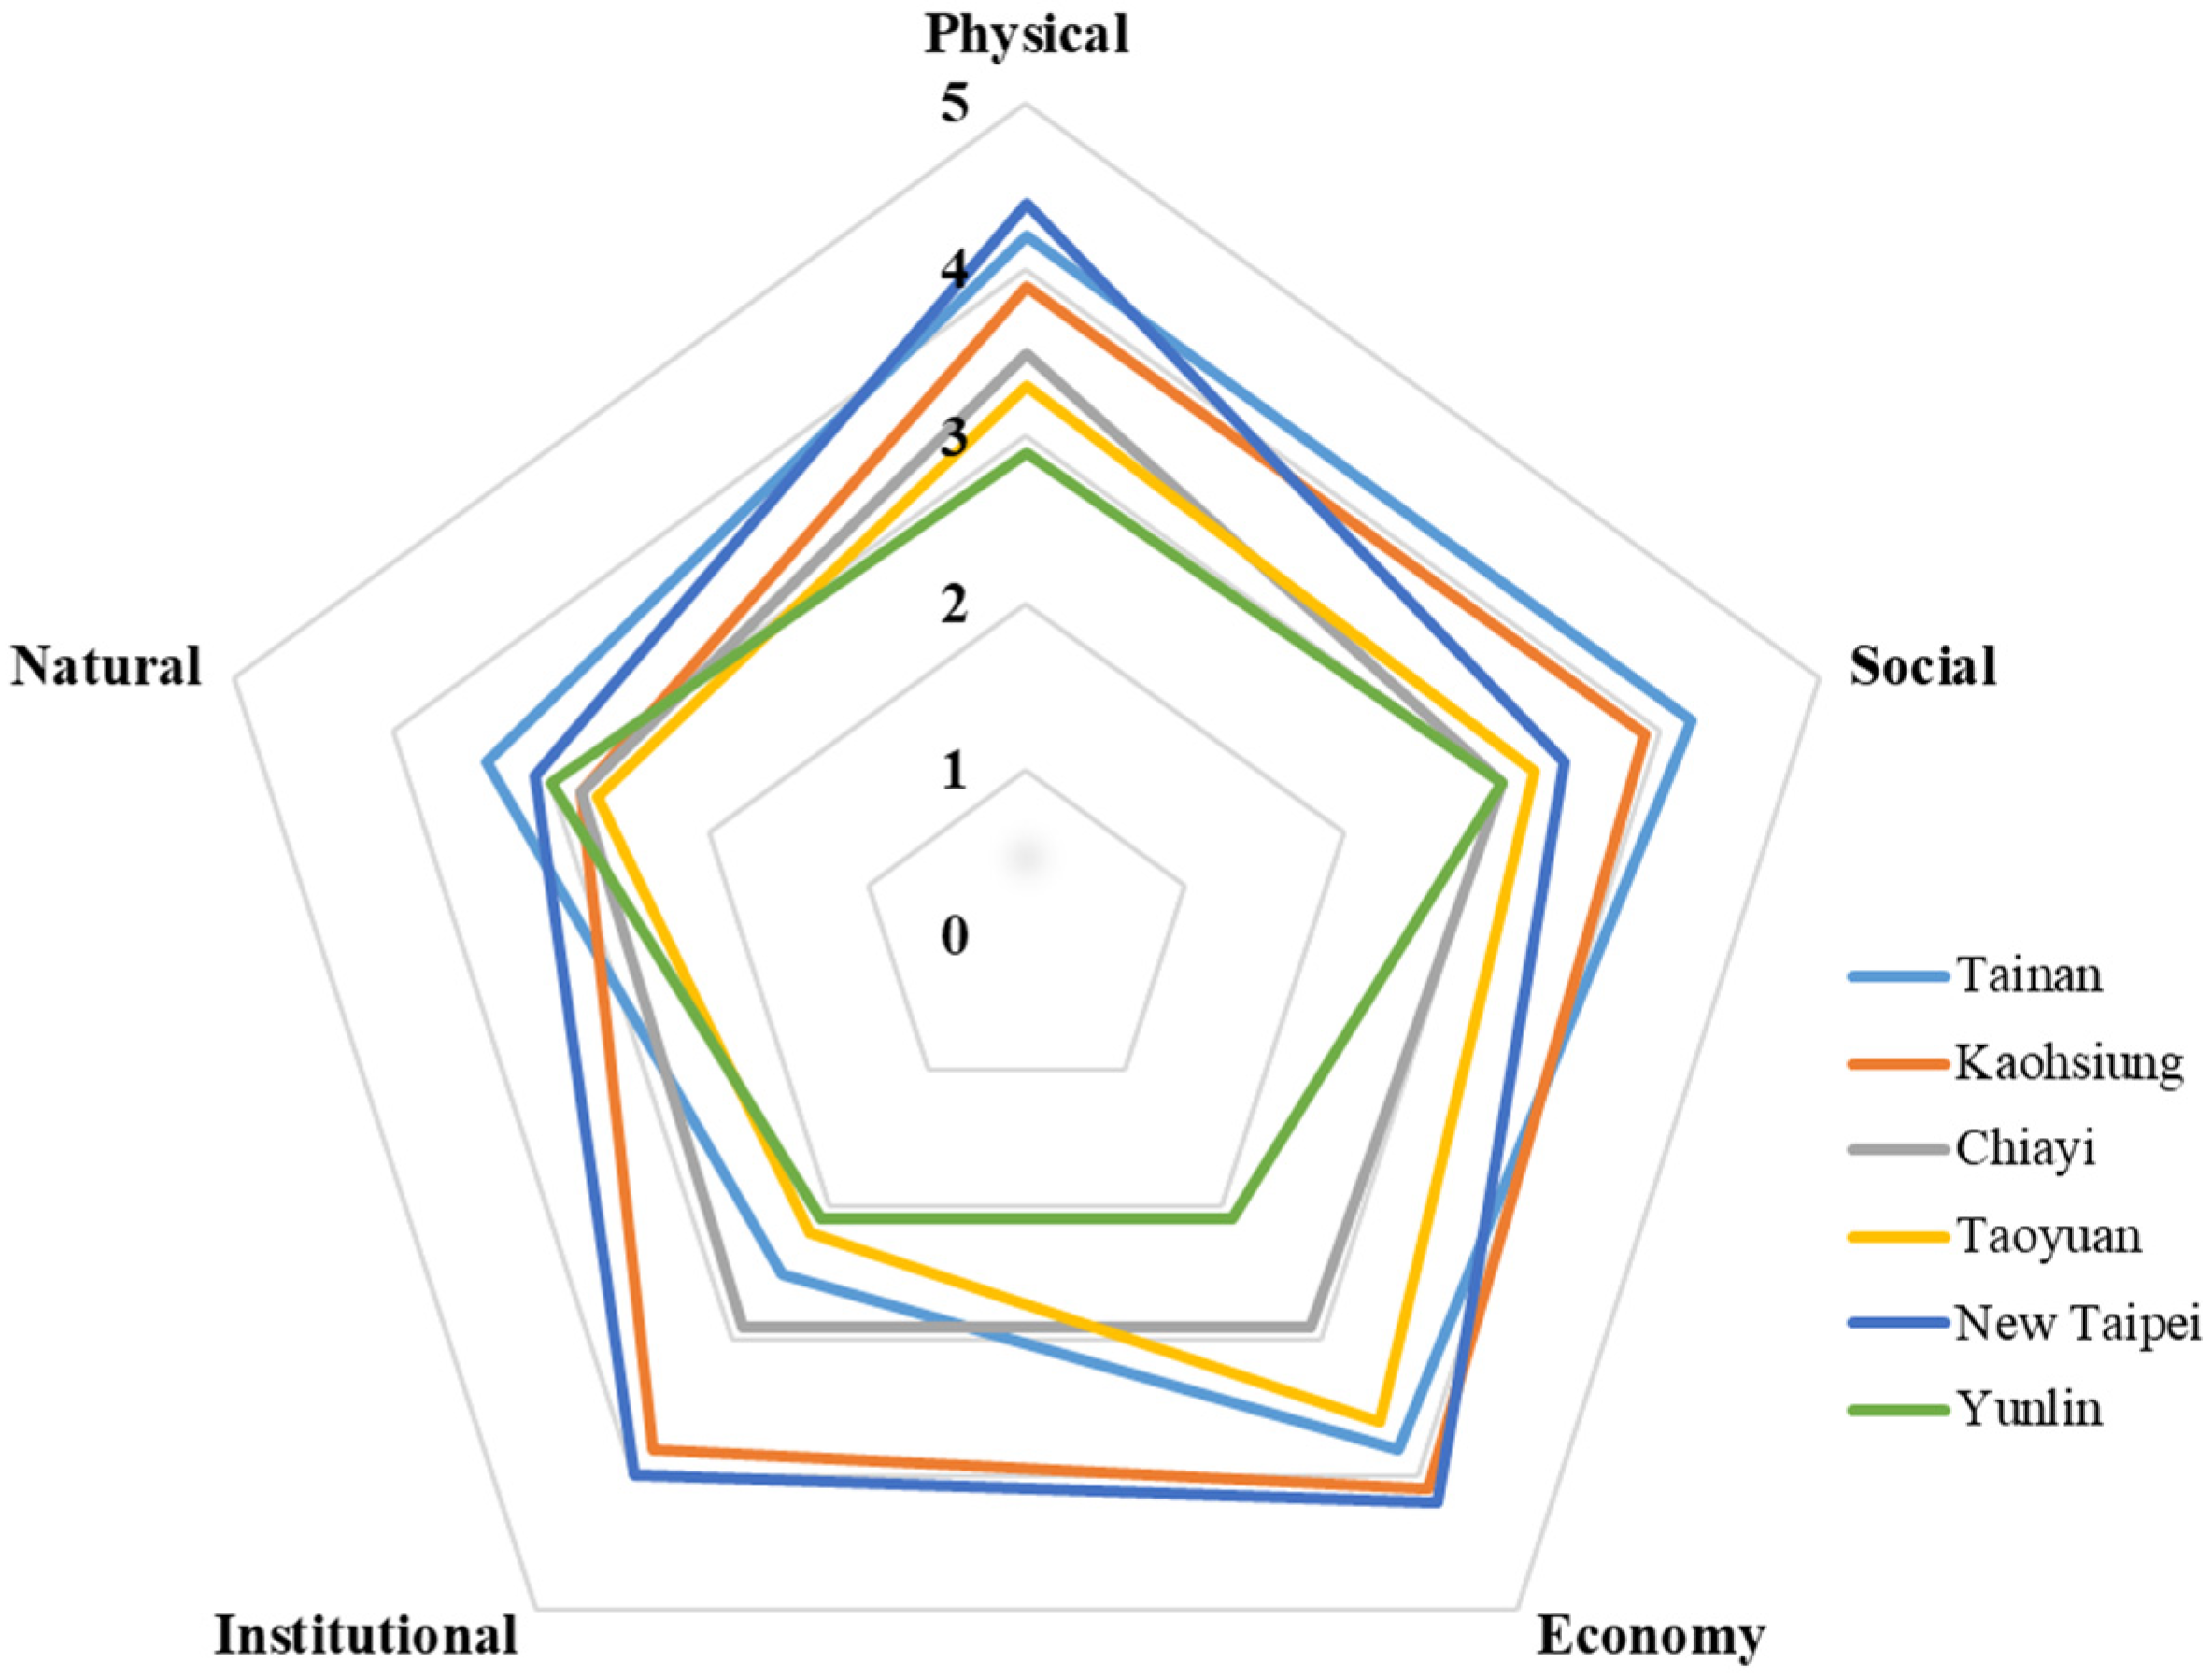
  • The majority of the coastal regions in Taiwan fall under the low and medium-to-low resilient categories.
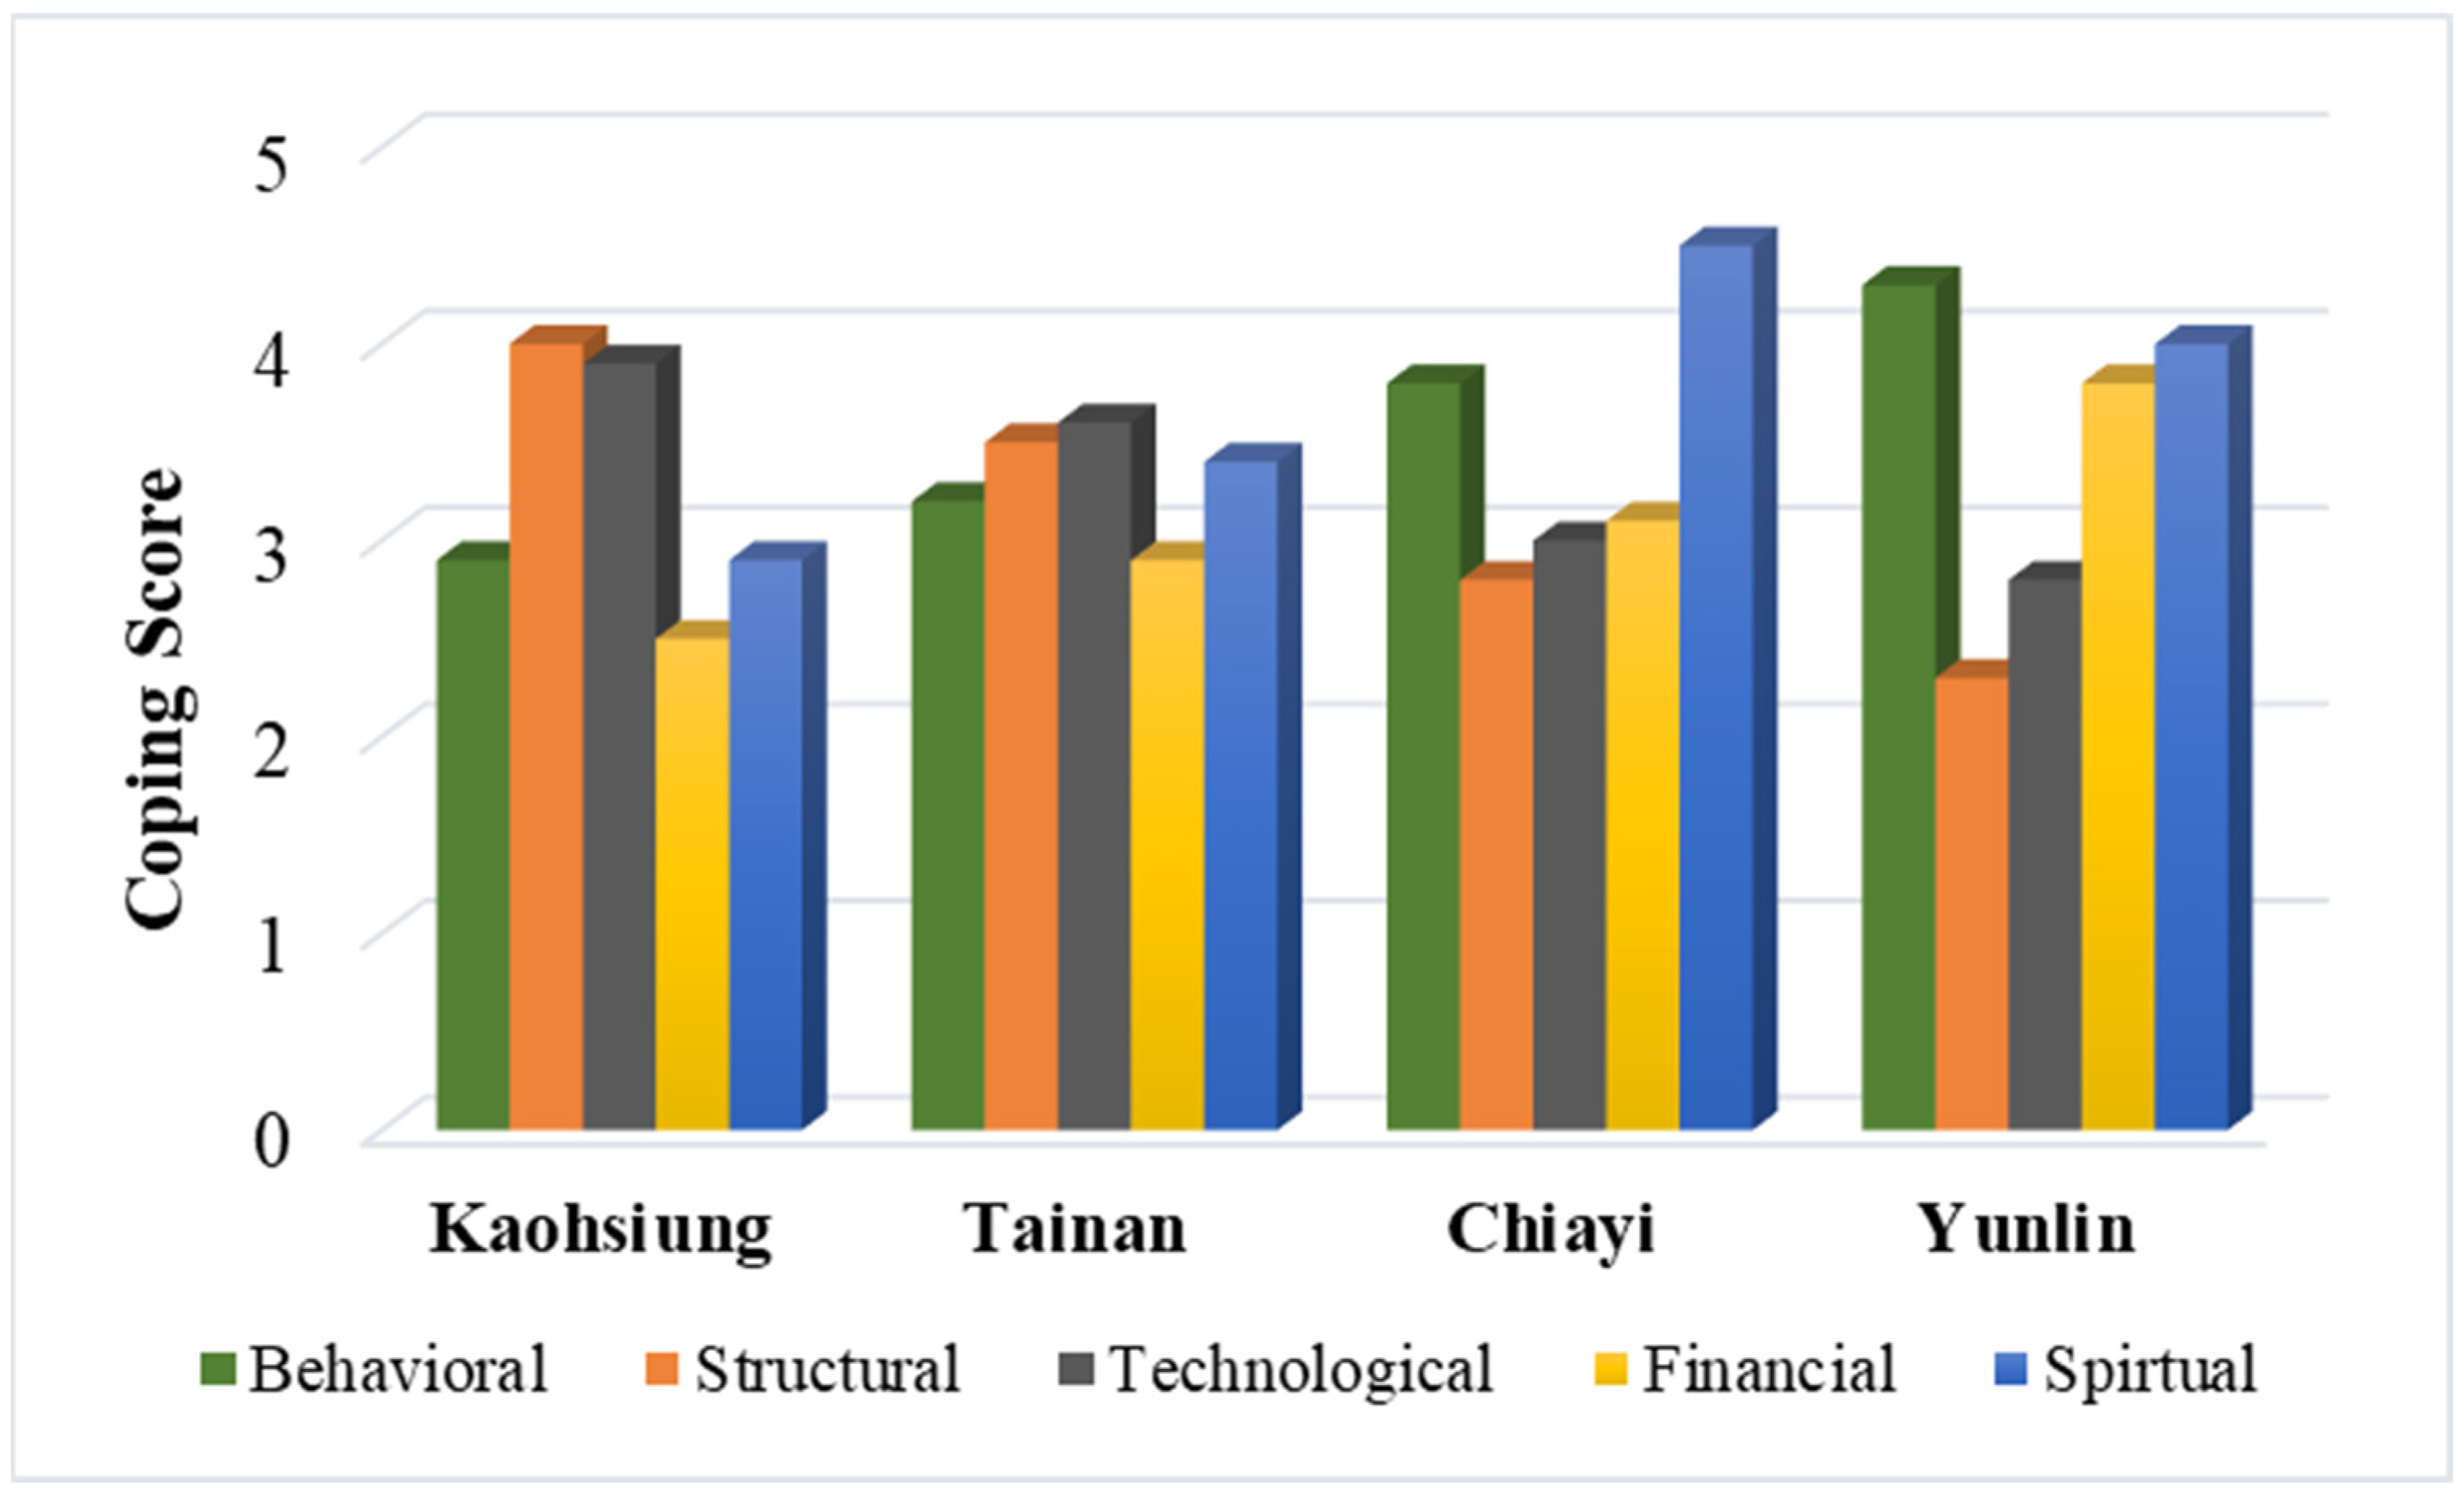
  • For people living in low-resilience sites, chosen coping methods were also less successful mostly due to financial and social constraints when dealing with stressful events.
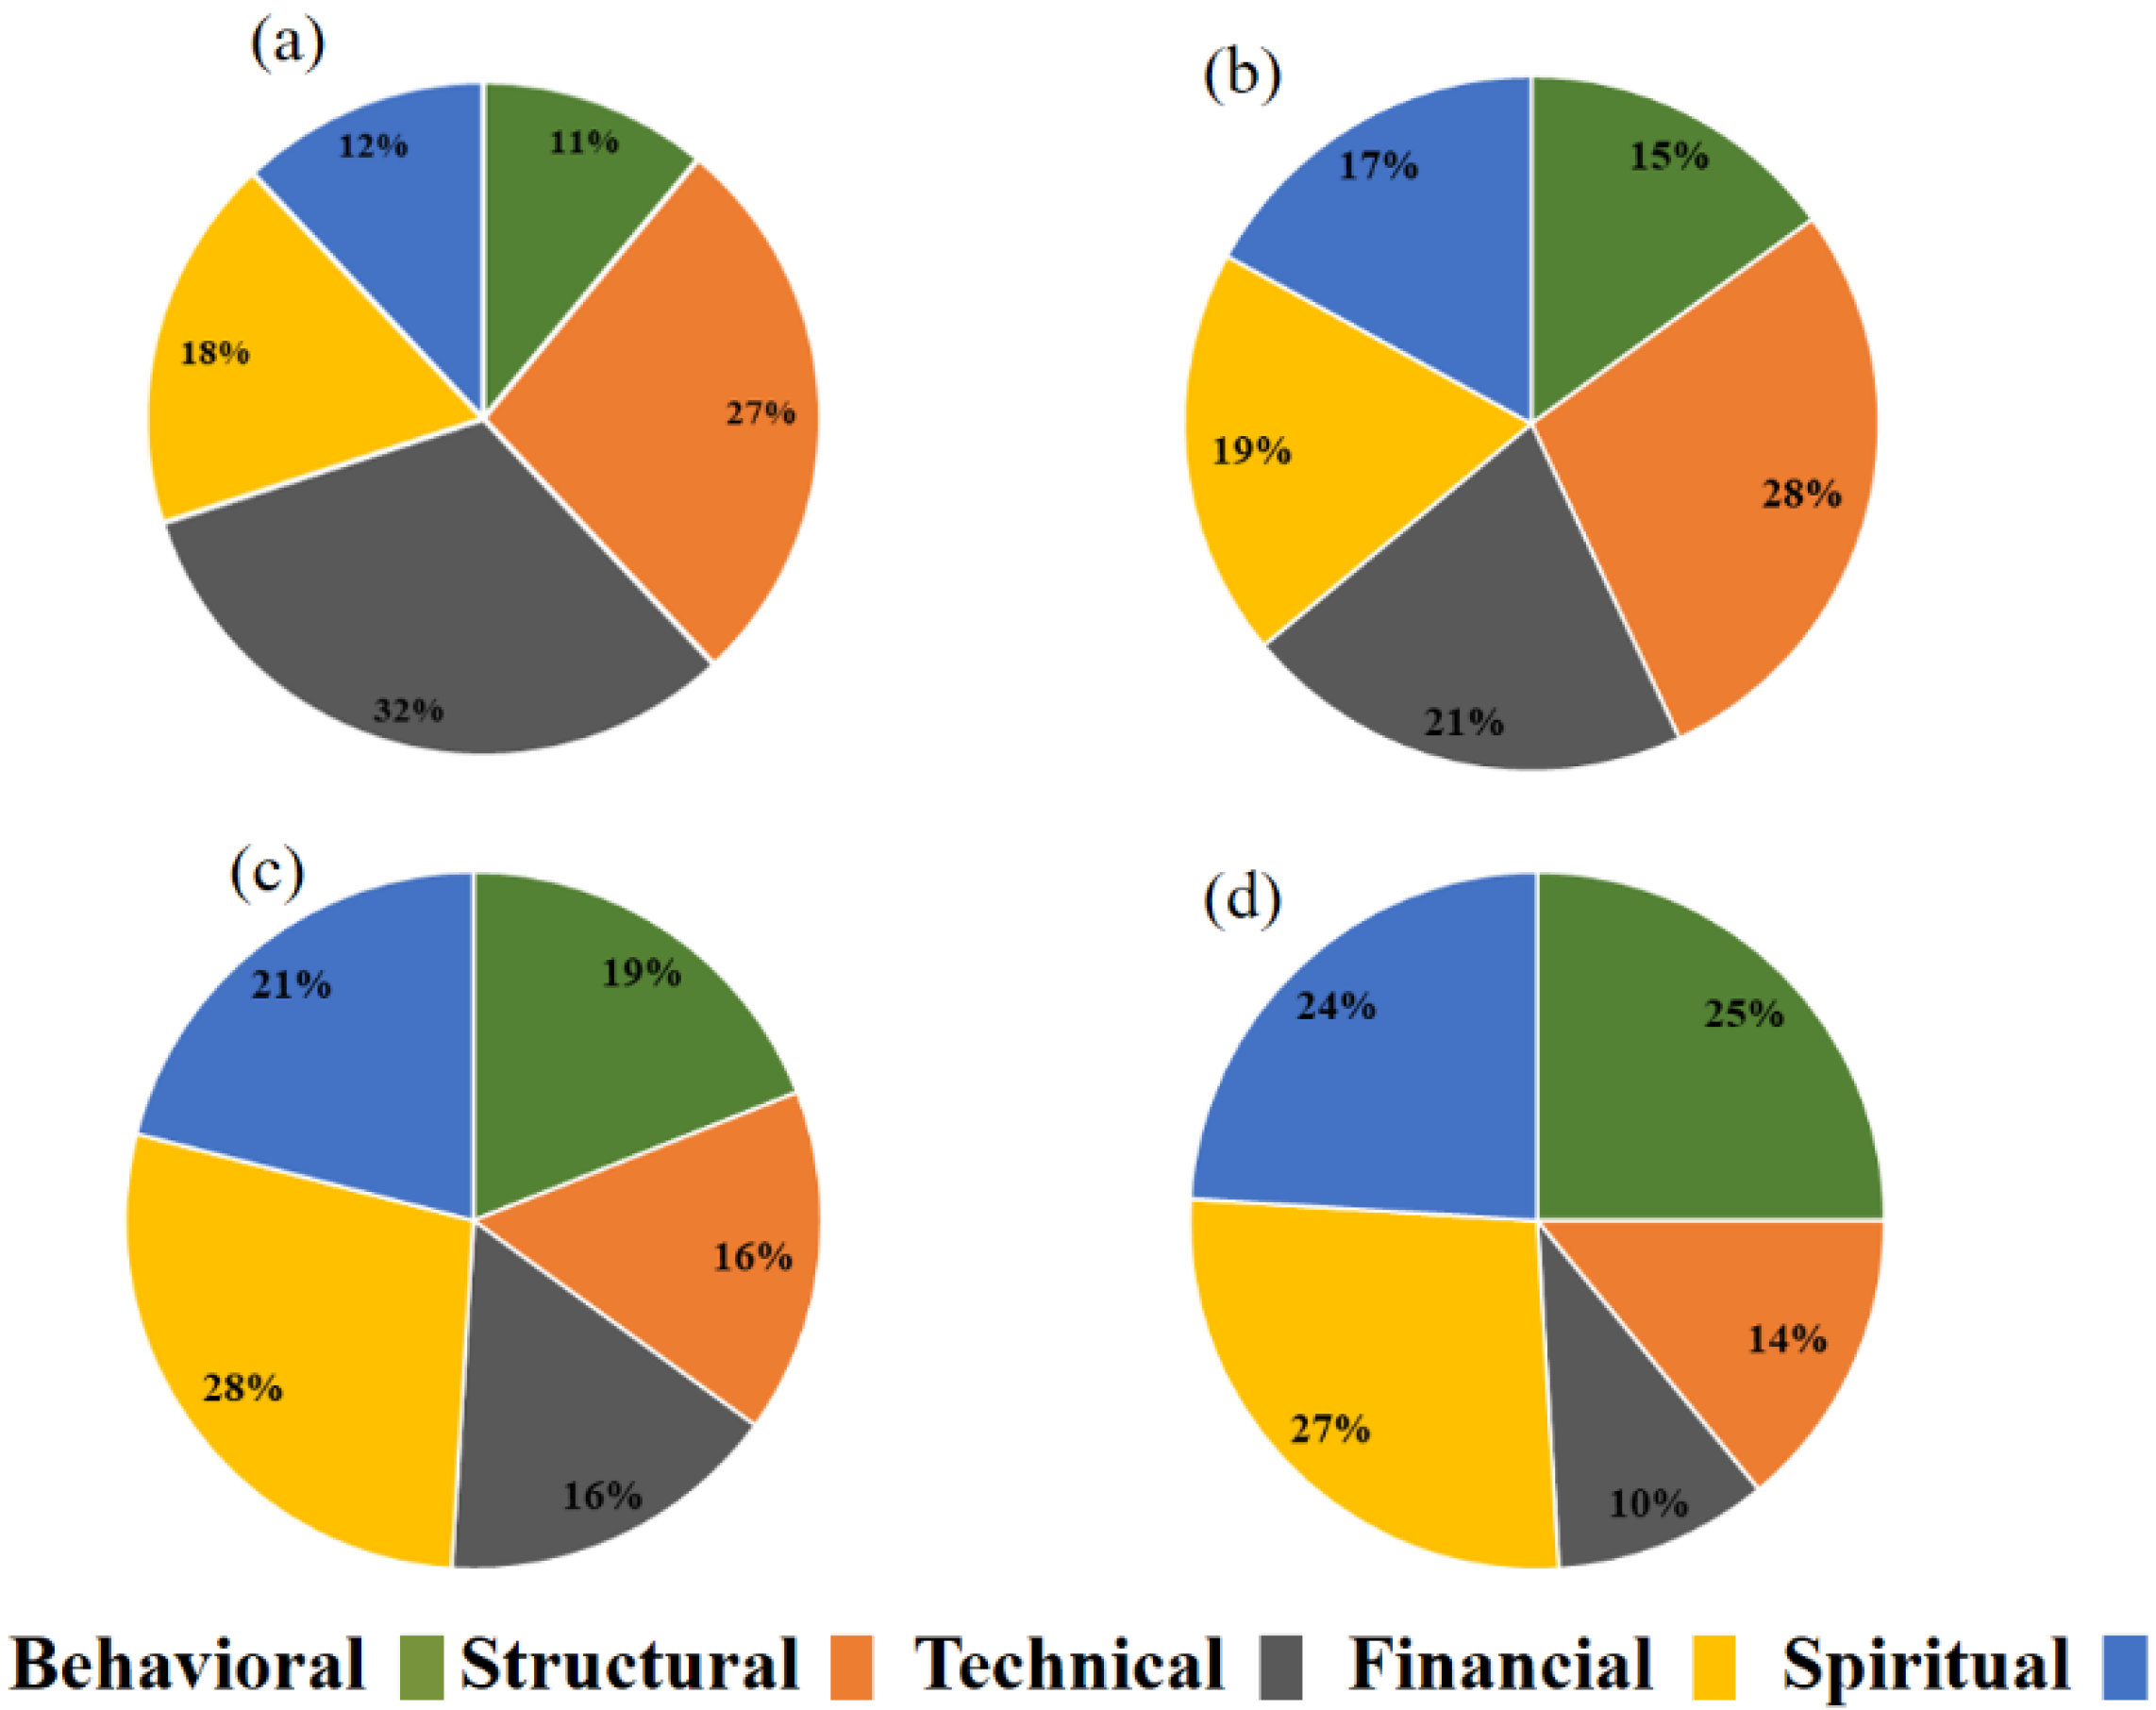
  • While behavioral and structural coping mechanisms were more likely to be applied when presented with two to three disasters at the same time, a technology-based approach was used when at least three disasters occur simultaneously.
  • A comprehensive conceptual model for disaster management has been proposed that includes interconnections of resilience and copability analysis.
The lack of empirical validation of CDRI parameters as well as the presence of spatial scale effect is among the limitations and challenges of the current study which may influence the efficiency of management strategies in the future. It is thus recommended to conduct a more comprehensive survey taking the resilience and coping ability into account to reduce the temporal and spatial scale effect and propose more efficient management alternatives. The successful management strategy considers the communities’ abilities to withstand, absorb, and recover from disasters while improving wellbeing in the context of resilience.

Author Contributions

M.I.: writing original draft, writing—review and editing, methodology; S.-L.L.: review and editing, supervision; H.F.: writing—review and editing, formal analysis, investigation; C.-Y.K.: review and editing, validation; S.M.: review and editing, data curation. All authors have read and agreed to the published version of the manuscript.

Funding

This research was funded by the Ministry of Science and Technology of Taiwan (MOST), with grant number MOST 110-2621-M-309-001-, MOST 110-2621-M-002-011-, MOST 108-2621-M-309-001-MY2, and MOST 107-2221-E-006-124-MY3. The work was also partially supported by National Taiwan University (NTUCCP-110L901003, NTU-110L8807), and NTU Research Center for Future Earth from The Featured Areas Research Center Program within the framework of the Higher Education Sprout Project by the Ministry of Education (MOE) in Taiwan, and the Ministry of Science and Technology of the Republic of China (MOST108-2621-M-002-MY2).

Informed Consent Statement

Written informed consent was obtained from all subjects involved in the study.

Data Availability Statement

The data that support the findings of this study are available from the corresponding author upon reasonable request.

Conflicts of Interest

The authors declare no conflict of interest.

References

  1. Lu, X.; Liao, W.; Fang, D.; Lin, K.; Tian, Y.; Zhang, C.; Zheng, Z.; Zhao, P. Quantification of disaster resilience in civil engineering: A review. J. Saf. Sci. Resil. 2020, 1, 19–30. [Google Scholar] [CrossRef]
  2. Forzieri, G.; Feyen, L.; Russo, S.; Vousdoukas, M.; Alfieri, L.; Outten, S.; Migliavacca, M.; Bianchi, A.; Rojas, R.; Cid, A. Multi-hazard assessment in Europe under climate change. Clim. Chang. 2016, 137, 105–119. [Google Scholar] [CrossRef] [Green Version]
  3. European Union (EU). European Union (EU). European Commission Joint Research Centre Institute for Environment and Sustainability. In Concepts and Metrics for Climate Change Risk and Development: Towards an Index for Climate Resilient Development; Joint Research Centre (JRC): Ispra, Italy, 2014; ISBN 978-92-79-36876-9. [Google Scholar] [CrossRef]
  4. IPCC. Climate Change 2007: Climate Change Impacts, Adaptation, and Vulnerability; Cambridge University Press: Cambridge, UK, 2007. [Google Scholar]
  5. Füssel, H.M. Review and Quantitative Analysis of Indices of Climate Change Exposure, Adaptive Capacity, Sensitivity, and Impacts; World Bank: Washington, DC, USA, 2010. [Google Scholar]
  6. Klein, R.J.T.; Nicholls, R.J. Assessment of coastal vulnerability to climate change. Ambio 1999, 28, 182–187. [Google Scholar]
  7. Brooks, N. Vulnerability, Risk and Adaptation: A Conceptual Framework; Working Paper 38; Tyndall Centre for Climate Change Research: Norwich, UK, 2003. [Google Scholar]
  8. Ofori, B.Y.; Stow, A.J.; Baumgartner, J.B.; Beaumont, L.J. Influence of adaptive capacity on the outcome of climate change vulnerability assessment. Nat. Sci. Rep. 2017, 7, 12979. [Google Scholar] [CrossRef]
  9. Vulnerability and Adaptation Resource Group. Linking Climate Change Adaptation and Disaster Risk Management for Sustainable Poverty Reduction: A Synthesis Report; Vulnerability and Adaptation Resource Group, The World Bank: Washington, DC, USA, 2006; p. 30. [Google Scholar]
  10. United Nations International Strategy for Disaster Reduction. Hyogo framework for action 2005–2015: Building the resilience of nations and communities to disasters. In Proceedings of the World Conference on Disaster Reduction, Kobe, Japan, 18–22 January 2005; p. 22. [Google Scholar]
  11. Cohen, O.; Bolotin, A.; Lahad, M.; Goldberg, A.; Aharonson-Daniel, L. Increasing sensitivity of results by using quantile regression analysis for exploring community resilience. Ecol. Indic. 2016, 66, 497–502. [Google Scholar] [CrossRef] [Green Version]
  12. Cutter, S.L. The landscape of disaster resilience indicators in the USA. Nat. Hazards 2016, 80, 741–758. [Google Scholar] [CrossRef]
  13. Mulligan, M.; Steele, W.; Rickards, L.; Fünfgeld, H. Keywords in planning: What do we mean by ‘community resilience’? Int. Plann. Stud. 2016, 21, 348–361. [Google Scholar] [CrossRef]
  14. Almeida, L.Q.D.; Welle, T.; Welle, J. Disaster risk indicators in Brazil: A proposal based on the world risk index. Int. J. Disaster Risk Reduct. 2016, 17, 251–272. [Google Scholar] [CrossRef]
  15. Cutter, S.L.; Barnes, L.; Berry, M.; Burton, C.; Evans, E.; Tate, E.; Webb, J. A place-based model for understanding community resilience to natural disasters. Glob. Environ. Chang. 2008, 18, 598–606. [Google Scholar] [CrossRef]
  16. Yang, L.E.; Scheffran, J.; Süsser, D.; Dawson, R.; Chen, Y.D. Assessment of Flood Losses with Household Responses: Agent-Based Simulation in an Urban Catchment Area. Environ. Model. Assess. 2018, 23, 369–388. [Google Scholar] [CrossRef] [Green Version]
  17. van Aalst, M.K.; Cannon, T.; Burton, I. Community level adaptation to climate change: The potential role of participatory community risk assessment. Glob. Environ. Chang. 2008, 18, 165–179. [Google Scholar] [CrossRef]
  18. Carpenter, S.R.; Walker, B.H.; Anderies, J.M.; Abel, N. From metaphor to measurement: Resilience of what to what? Eco-Systems 2001, 4, 765–781. [Google Scholar] [CrossRef]
  19. Bahadur, A.V.; Wilkinson, E.; Tanner, T.M. Measuring resilience: An analytical review. In ODI Working Paper; Overseas Development Institute: London, UK, 2015. [Google Scholar]
  20. The World Bank. Climate and disaster resilience of greater Dhaka area: A micro level analysis. In Bangladesh Development Series; Paper No. 32; World Bank: Washington, DC, USA, 2015. [Google Scholar]
  21. Jones, L.; Tanner, T. ’Subjective resilience’: Using perceptions to quantify household resilience to climate extremes and disasters. Reg. Environ. Chang. 2017, 17, 229–243. [Google Scholar] [CrossRef] [Green Version]
  22. Ojerio, R.; Moseley, C.; Lynn, K.; Bania, N. Limited Involvement of Socially Vulnerable Populations in Federal Programs to Mitigate Wildfire Risk in Arizona. Nat. Hazards Rev. 2011, 12, 28–36. [Google Scholar] [CrossRef]
  23. Adger, W.N.; Huq, S.; Brown, K.; Conway, D.; Hulme, M. Adaptation to climate change in the developing world. Prog. Dev. Stud. 2003, 3, 179–195. [Google Scholar] [CrossRef]
  24. Smit, B.; Pilifosova, O. Adaptation to Climate Change in the Context of Sustainable Development and Equity Chapter 18 in Climate Change: Impacts, Adaptation, and Vulnerability—Contribution of Working Group II to the Third Assessment Report of the Intergovernmental Panel on Climate Change; Cambridge University Press: Cambridge, UK, 2001. [Google Scholar]
  25. Chan, M. Risk Management for Disasters in Taiwan. Japan SPOTLIGHT, the Challenge to Risk Management. 2012. Available online: https://www.jef.or.jp/journal/pdf/185th_cover03.pdf (accessed on 17 September 2021).
  26. Knight, C.L.; Burgin, G.; Chen, Y.F. Living with Typhoons: Disaster Management in Rural Taiwan. Final Report to the Royal Geographical Society (with IBG). 2013, p. 195. Available online: https://www.rgs.org/CMSPages/GetFile.aspx?nodeguid=e3e7f910-b484-4bc5-9d80-cd0e1dfd8e74&lang=en-GB (accessed on 22 August 2021).
  27. Hsu, T.W.; Shih, D.S.; Chen, W.J. Destructive Flooding Induced by Broken Embankments along Linbian Creek, Taiwan, during Typhoon Morakot. J. Hydrol. Eng. ASCE 2015, 20, 5014025. [Google Scholar] [CrossRef]
  28. Small, C.; Nicholls, R.J. A global analysis of human settlement in coastal zones. J. Coast. Res. 2003, 19, 584–599. [Google Scholar]
  29. Chiang, Y.C.; Fang, H.M.; Hsiao, S.S.; Wang, H.Y. Approaching Taiwan’s coastal management problems from the perspective of Toucheng Beach’s disappearance. Ocean Coast. Manag. 2017, 146, 170–177. [Google Scholar] [CrossRef]
  30. Imani, M.; Fakour, H.; Lo, S.L. Exploring Climate Disaster Resilience: Insight into City and Zone Levels of Southern Taiwan. Agriculture 2021, 11, 107. [Google Scholar] [CrossRef]
  31. Hsu, T.W.; Lin, T.Y.; Tseng, I.F. Human Impact on Coastal Erosion in Taiwan. J. Coast. Res. 2007, 23, 961–973. [Google Scholar] [CrossRef]
  32. Chen, C.L. Diversifying fisheries into tourism in Taiwan: Experiences and prospects. Ocean Coast. Manag. 2010, 53, 487–492. [Google Scholar] [CrossRef]
  33. Kenchington, R. Tourism in coastal and marine environments—A recreational perspective. Ocean Coast. Manag. 1993, 19, 1–16. [Google Scholar] [CrossRef]
  34. Chiu, P.G.; Yu, I.Y. Examining typhoon activity in the western north pacific: Difference between active and non-active years. Atmos. Sci. 2006, 34, 201–216. [Google Scholar]
  35. Almutairi, A.; Mourshed, M.; Ameen, R.F.M. Coastal community resilience frameworks for disaster risk management. Nat. Hazards 2020, 101, 595–630. [Google Scholar] [CrossRef] [Green Version]
  36. Teo, M.; Goonetilleke, A.; Ziyath, A. An integrated framework for assessing community resilience in disaster management. In Proceedings of the 9th Annual International Conference of the International Institute for Infrastructure Renewal and Reconstruction, Brisbane, Australia, 7–10 July 2013; pp. 309–314. [Google Scholar]
  37. Dasgupta, R.; Shaw, R. An indicator based approach to assess coastal communities’ resilience against climate related disasters in Indian Sundarbans. J. Coast. Conserv. 2015, 19, 85–101. [Google Scholar] [CrossRef]
  38. Rose, A. Economic resilience to disasters: Toward a consistent and comprehensive formulation. In Disaster Resilience: An Integrated Approach; Paton, D., Johnston, D., Eds.; Charles C. Thomas: Springfield, IL, USA, 2006; pp. 275–303. [Google Scholar]
  39. Weichselgartner, J.; Pigeon, P. The Role of Knowledge in Disaster Risk Reduction. Int. J. Disaster Risk Sci. 2015, 6, 107–116. [Google Scholar] [CrossRef] [Green Version]
  40. Bowen, A.; Cochrane, S.; Fankhauser, S. Climate change, adaptation and economic growth. Clim. Chang. 2012, 113, 95–106. [Google Scholar] [CrossRef] [Green Version]
  41. Larsen, C.A. Social Cohesion: Definition, Measurement and Developments. Institut for Statskundskab, Aalborg Universite, Denmark. 2014. Available online: https://vbn.aau.dk/ws/portalfiles/portal/207548602/85_2014_CAL.pdf (accessed on 18 July 2021).
  42. Hallen, R.V.d.; Jongerling, J.; Godor, B.P. Coping and resilience in adults: A cross-sectional network analysis. Anxiety Stress Coping 2020, 33, 479–496. [Google Scholar] [CrossRef]
  43. Zaccarelli, N.; Petrosillo, I.; Zurlini, G. Retrospective Analysis. Encycl. Ecol. 2008, 4, 3020–3029. [Google Scholar]
  44. Folkman, S.; Lazarus, R.S. If it changes it must be a process: Study of emotion and coping during three stages of a college examination. J. Pers. Soc. Psychol. 1985, 48, 150–170. [Google Scholar] [CrossRef] [PubMed]
  45. Turnbull, M.; Sterrett, C.L.; Hilleboe, A. Toward Resilience, A Guide to Disaster Risk Reduction and Climate Change Adaptation. Practical; Action Publishing Ltd.: Warwickshire, UK, 2013; p. 194. [Google Scholar]
  46. Folkman, S.; Moskowitz, J.T. Coping: Pitfalls and promise. Annu. Rev. Psychol. 2004, 55, 745–774. [Google Scholar] [CrossRef]
  47. Steinhardt, M.; Dolbier, C. Evaluation of a resilience intervention to enhance coping strategies and protective factors and decrease symptomatology. J. Am. Coll. Health 2008, 56, 445–453. [Google Scholar] [CrossRef] [PubMed]
  48. Coppens, C.M.; de Boer, S.F.; Koolhaas, J.M. Coping styles and behavioural flexibility: Towards underlying mechanisms. Philos. Trans. R. Soc. B Biol. Sci. 2010, 27, 4021–4028. [Google Scholar] [CrossRef] [PubMed]
  49. Shaw, R.; IEDM Team. Climate disaster resilience: Focus on coastal urban cities in Asia. Asian J. Environ. Disaster Manag. 2009, 1, 101–116. [Google Scholar]
  50. Lokonon, B.O.K. Farmers’ vulnerability to climate shocks: Insights from the Niger basin of Benin. Clim. Dev. 2019, 11, 585–596. [Google Scholar] [CrossRef]
  51. Møller, L.R.; Smith-Hall, C.; Meilby, H.; Rayamajhi, S.; Herslund, L.B.; Larsen, H.O.; Nielsen, J.; Byg, A. Empirically based analysis of households coping with unexpected shocks in the central Himalayas. Clim. Dev. 2019, 11, 597–606. [Google Scholar] [CrossRef]
  52. Mehar, M.; Mittal, S.; Prasad, N. Farmers coping strategies for climate shock: Is it differentiated by gender? J. Rural Stud. 2016, 44, 123–131. [Google Scholar] [CrossRef]
  53. Zimmerman, F.J.; Carter, M.R. Asset smoothing, consumption smoothing and the reproduction of inequality under risk and subsistence constraints. J. Dev. Econ. 2003, 71, 233–260. [Google Scholar] [CrossRef]
  54. Hoddinott, J. Shocks and their consequences across and within households in rural Zimbabwe. J. Dev. Stud. 2006, 42, 301–321. [Google Scholar] [CrossRef]
  55. Barrett, C.B.; Garg, T.; McBride, L. Well-being dynamics and poverty traps. Annu. Rev. Resour. Econ. 2016, 8, 303–327. [Google Scholar] [CrossRef] [Green Version]
  56. Ellis, F. Rural Livelihoods and Diversity in Developing Countries; Oxford University Press: Oxford, UK, 2000. [Google Scholar]
  57. Ansah, I.G.K.; Gardebroek, C.; Ihle, R. Shock interactions, coping strategy choices and household food security. Clim. Dev. 2021, 13, 414–426. [Google Scholar] [CrossRef]
  58. Lan, Y.J.; Hsu, T.W.; Lin, Y.C.; Huang, C.J. An Adaptation Due to Climate Change in Southwest Coast of Taiwan. Coast. Manag. 2013, 41, 172–189. [Google Scholar] [CrossRef]
  59. Teng, W.H.; Hsu, M.H.; Wu, C.H.; Chen, A. Impact of Flood Disasters on Taiwan in the Last Quarter Century. Nat. Hazards 2006, 37, 191–207. [Google Scholar] [CrossRef] [Green Version]
  60. Lee, Y.J. A synthesized biophysical and social vulnerability assessment for Taiwan. IOP Conf. Ser. Earth Environ. Sci. 2017, 94, 012161. [Google Scholar] [CrossRef]
  61. Wu, C.-C.; Jhan, H.-T.; Ting, K.-H.; Tsai, H.-C.; Lee, M.-T.; Hsu, T.-W.; Liu, W.-H. Application of Social Vulnerability Indicators to Climate Change for the Southwest Coastal Areas of Taiwan. Sustainability 2016, 8, 1270. [Google Scholar] [CrossRef] [Green Version]
  62. Lin, C.-Y.; Liu, S.C.; Chou, C.C.-K.; Liu, T.H.; Lee, C.-T.; Yuan, C.-S.; Shiu, C.-J.; Young, C.-Y. Longrange transport of Asian dust and air pollutants to Taiwan. Terr. Atmos. Ocean. Sci. 2004, 15, 759–784. [Google Scholar] [CrossRef] [Green Version]
  63. Chan, D.C. The environmental dilemma in Taiwan. J. Northeast Asian Stud. 1993, 12, 35–57. [Google Scholar]
  64. Lee, Y.J.; Lin, S.Y. Vulnerability and ecological footprint: A comparison between urban Taipei and rural Yunlin, Taiwan. Environ. Sci. Pollut. Res. 2020, 27, 34624–34637. [Google Scholar] [CrossRef]
  65. Gwee, Q.; Takeuchi, Y.; Wen, J.C.; Shaw, R. Disaster Education System in Yunlin County, Taiwan. Asian J. Environ. Disaster Manag. 2011, 3, 189–203. [Google Scholar] [CrossRef]
  66. Wilson, S.; Temple, B.; Milliron, M.; Vazquez, C.; Packard, M.; Rudy, B. The Lack of Disaster Preparedness by the Public and it’s Affect on Communities. Int. J. Rescue Disaster Med. 2007, 7, 2. [Google Scholar]
  67. Lee, Y.J. Relationships among Environmental Attitudes, Risk Perceptions, and Coping Behavior: A Case Study of Four Environmentally Sensitive Townships in Yunlin County, Taiwan. Sustainability 2018, 10, 2663. [Google Scholar] [CrossRef] [Green Version]
  68. New Taipei City (NTPC) Government, Taiwan. Innovative Policies. Available online: https://foreigner.ntpc.gov.tw/home.jsp?id=ca11f6fbd52e6cd5 (accessed on 24 February 2021).
  69. Ke, K.Y.; Lin, Y.J.; Tan, Y.C.; Pan, T.Y.; Tai, L.L.; Lee, C.A. Enhancing Local Disaster Management Network through Developing Resilient Community in New Taipei City, Taiwan. Int. J. Environ. Res. Public Health 2020, 17, 5357. [Google Scholar] [CrossRef] [PubMed]
  70. Chuang, M.-T.; Chen, Y.-C.; Lee, C.-T.; Cheng, C.-H.; Tsai, Y.-J.; Chang, S.-Y.; Su, Z.-S. Apportionment of the sources of high fine particulate matter concentration events in a developing aerotropolis in Taoyuan, Taiwan. Environ. Pollut. 2016, 214, 273–281. [Google Scholar] [CrossRef] [PubMed]
  71. Chen, J.G.; Zhong, Y.Z.; Chuang, L.Z.H.; Koppe, B.; Chien, H. Risk management of coastal water safety for recreational activities: The case of Taoyuan coast. Appl. Geogr. 2020, 117, 102173. [Google Scholar] [CrossRef]
  72. HChang, S.; Hsieh, H.Y. An exploratory study on land use planning of disaster prevention: A case study of Kaohsiung new town. Procedia Environ. Sci. 2013, 17, 382–391. [Google Scholar] [CrossRef] [Green Version]
  73. Smart City Summit & Expo (SCSE). Available online: https://smartcityonline.org.tw/pavilion.php?vip=kaohsiung (accessed on 12 March 2021).
  74. Global Organization of Smart Cities (GO SMART). GO SMART Opportunity Report. 2020, Volume 3. Available online: https://www.phoenixsistercities.org/wp-content/uploads/2020/04/GO-SMART-Opportunity-Report-Vol.3-1.pdf (accessed on 12 September 2021).
  75. Kaohsiung City Government. Available online: https://www.kcg.gov.tw/EN/News_Content.aspx?n=3788E6E04BC17563&sms=7E0BEA6C4C2D1715&s=7397933D6206936F (accessed on 25 January 2021).
  76. Bakkensen, L.A.; Fox-Lent, C.; Read, L.K.; Linkov, I. Validating resilience and vulnerability indices in the context of natural disasters. Risk Anal. 2017, 37, 982–1004. [Google Scholar] [CrossRef] [Green Version]
  77. Ji, T.; Wei, H.H.; Sim, T.; Yang, L.E.; Scheffran, J. Disaggregated validation of disaster-resilience indicators using household survey data: A case study of Hong Kong. Sustain. Cities Soc. 2021, 67, 102726. [Google Scholar] [CrossRef]
  78. Yang, L.E.; Chen, J.; Geng, J.; Fang, Y.; Yang, W. Social resilience and its scale effects along the historical Tea-Horse Road. Environ. Res. Lett. 2021, 16, 45001. [Google Scholar] [CrossRef]
  79. Corbett, J. Famine and household coping strategies. World Dev. 1988, 16, 1099–1112. [Google Scholar] [CrossRef]
  80. Cambridge University Land Society. 2019. Available online: https://issuu.com/culandsoc/docs/culs_2019_v13_lr.pdf_-_final_version (accessed on 14 April 2021).
  81. Taipei Times. Available online: http://www.taipeitimes.com/News/front/archives/2017/11/14/2003682216 (accessed on 19 December 2020).
  82. Yang, J.; Shi, P. Applying Analytic Hierarchy Process in Firm’s Overall Performance Evaluation: A Case Study in China. Int. J. Bus. 2002, 7, 29–46. [Google Scholar]
  83. Pretty, J. Social Capital and the Collective Management of Resources. Science 2003, 32, 1912–1914. [Google Scholar] [CrossRef] [PubMed] [Green Version]
  84. Glantz, M.H.; Gommes, R.; Ramasamy, S. Coping with a Changing Climate: Considerations for Adaptation and Mitigation in Agriculture; Food and Agriculture Organization of the United Nations: Rome, Italy, 2009. [Google Scholar]
  85. Food and Agriculture Organization of the United Nations (FAO). The Water-Energy-Food Nexus. A New Approach in Support of Food Security and Sustainable Agriculture; Food and Agriculture Organization of the United Nations: Rome, Italy, 2014. [Google Scholar]
  86. Scheraga, J.D.; Ebi, K.L.; Furlow, J.; Moreno, A.R. From Science to Policy: Developing Responses to Climate Change. In Climate Change and Human Health: Risks and Responses; Mcmichael, A.J., Campbell-Lendrum, D.H., Corvalán, C.F., Ebi, K.L., Scheraga, J.D., Woodward, A.E., Eds.; World Health Organization: Geneva, Switzerland, 2003. [Google Scholar]
  87. Leipold, B.; Greve, W. Resilience: A conceptual bridge between coping and development. Eur. Psychol. 2009, 14, 40–50. [Google Scholar] [CrossRef]
  88. Chapman, D.A.; Trott, C.D.; Silka, L.; Lickel, B.; Clayton, S. Psychological perspectives on community resilience and climate change: Insights, examples, and directions for future research. Psychol. Clim. Chang. 2018, 267–288. [Google Scholar] [CrossRef]
  89. Ogunbode, C.A.; Böhm, G.; Capstick, S.B.; Demski, C.; Spence, A.; Tausch, N. The resilience paradox: Flooding experience, coping and climate change mitigation intentions. Clim. Policy 2019, 19, 703–715. [Google Scholar] [CrossRef]
  90. Greene, G.; Paranjothy, S.; Palmer, S.R. Resilience and vulnerability to the psychological harm from flooding: The role of social cohesion. Am. J. Public Health 2015, 105, 1792–1795. [Google Scholar] [CrossRef]
  91. Lo, A.Y.; Chan, F. Preparing for flooding in England and Wales: The role of risk perception and the social context in driving individual action. Nat. Hazards 2017, 88, 367–387. [Google Scholar] [CrossRef]
  92. Walker-Springett, K.; Butler, C.; Adger, W.N. Wellbeing in the aftermath of floods. Health Place 2017, 43, 66–74. [Google Scholar] [CrossRef] [Green Version]
  93. Vollhardt, J.R. Altruism born of suffering and prosocial behavior following adverse life events: A review and conceptualization. Soc. Justice Res. 2009, 22, 53–97. [Google Scholar] [CrossRef]
Figure 1. Geographic location of Taiwan and the study area (shadow zones).
Atmosphere 13 00016 g001
Figure 2. A successful community will be aware of all of its abilities, have realistic capacities, and be skilled in its delivery.
Atmosphere 13 00016 g002
Figure 3. Coping strategies adopted by coastal households during extreme weather events.
Atmosphere 13 00016 g003
Figure 4. Overall Climate Disaster Resilience Index (CDRI) analysis of coastal regions.
Atmosphere 13 00016 g004
Figure 5. CDRI dimension scores in Tainan, Kaohsiung, Chiayi, Taoyuan, New Taipei, and Yunlin.
Atmosphere 13 00016 g005
Figure 6. Coping scores achieved by coastal residents of the least resilient cities.
Atmosphere 13 00016 g006
Figure 7. The most important coping strategies recommended by coastal households in (a) Kaohsiung, (b) Tainan, (c) Chiayi, and (d) Yunlin to deal with extreme weather events.
Atmosphere 13 00016 g007
Figure 8. Comprehensive conceptual model (4R package) for disaster management and its connection with resilience and copability.
Atmosphere 13 00016 g008
Table 1. List of variables considered in CDRI five dimensions.
Dimension Parameters
PhysicalElectricity, Water, Sanitation, Accessibility of roads, Housing
SocialPopulation, Health, Education and awareness, Social capital, Community preparedness
during a disaster
EconomicIncome, Employment, Household assets, Finance and savings, Budget and subsidy
InstitutionalKnowledge dissemination, Institutional collaboration, Mainstreaming of disaster risk reduction, Effectiveness of crisis management, Good governance
NaturalIntensity of natural hazards, Frequency of natural hazards, Ecosystem services, Land use, Environmental policies
Table 2. A sample of the Climate Disaster Resilience Index (CDRI) questionnaire survey.
Please Rate How Effective the Following Accessibility of Roads Indicators Are in Your AreaVery PoorPoorMediumGoodVery Good
1.1.1 The percentage of land transportation network in different streets in the city during natural disaster
1.1.2. The percentage of paved roads in the city during natural disasters.
1.1.3. The efficiency of fixing damaged roads during and after a natural disaster.
1.1.4. To what extent the traffic situation in your area after a natural disaster (such as intense rainfall) is handled effectively.
1.1.5. To what extent the roadside-covered drains are equipped.
Weight factor: Please rank the variables between 1 and 5 (5 = most important, 1 = least important)
1.1.11.1.21.1.31.1.41.1.5
Table 3. Statistical relationship between disaster characteristics and coping strategy selection.
VariableBehavioralStructuralTechnologicalFinancialSpiritual
No. of disasters0.011 *0.0250.0280.0370.162
Duration of disasters0.0420.0010.0950.0010.029
Season of the disasters0.0830.4120.1030.0470.371
* p-value < 0.05 were considered statistically significant.
Table 4. Marginal and combined effects of disaster frequencies and coping strategy.
ScenarioBehavioralStructuralTechnologicalFinancialSpiritual
I. One disaster vs. two disaster0.011 *0.0250.0710.0470.162
II. Two disasters vs. three disasters0.0320.0010.0850.0730.099
III. Three disasters vs. four disasters0.0830.4120.0030.1290.201
* p-value < 0.05 were considered statistically significant.
Publisher’s Note: MDPI stays neutral with regard to jurisdictional claims in published maps and institutional affiliations.

