Abstract
We investigated the role of the passive volcanic plume of Mount Etna (Italy) in the formation of new particles in the size range of 2.5–10 nm through the gas-to-particle nucleation of sulfuric acid (H2SO4) precursors, formed from the oxidation of SO2, and their evolution to particles with diameters larger than 100 nm. Two simulations were performed using the Weather Research and Forecasting Model coupled with chemistry (WRF-Chem) under the same configuration, except for the nucleation parameterization implemented in the model: the activation nucleation parameterization (JS1 = 2.0 × 10⁻⁶ × (H2SO4)) in the first simulation (S1) and a new parameterization for nucleation (NPN) (JS2 = 1.844 × 10⁻⁸ × (H2SO4)1.12) in the second simulation (S2). The comparison of the numerical results with the observations shows that, on average, NPN improves the performance of the model in the prediction of the H2SO4 concentrations, newly-formed particles (~2.5–10 nm), and their growth into larger particles (10–100 nm) by decreasing the rates of H2SO4 consumption and nucleation relative to S1. In addition, particles formed in the plume do not grow into cloud condensation nuclei (CCN) sizes (100–215 nm) within a few hours of the vent (tens of km). However, tracking the size evolution of simulated particles along the passive plume indicates the downwind formation of particles larger than 100 nm more than 100 km far from the vent with relatively high concentrations relative to the background (more than 1500 cm−3) in S2. These particles, originating in the volcanic source, could affect the chemical and microphysical properties of clouds and exert regional climatic effects over time.
1. Introduction
Volcanic eruption and passive degassing are among the main natural sources of several atmospheric gaseous species and particles, primarily emitted or secondarily newly-formed particles [1]. The annual global volcanic emission flux of sulfur dioxide (SO2) reaches 9.2 Tg/year [2]. For sulfates from volcanic SO2 and sulfates such as ammonium bisulfate (NH4HSO4), this value reaches 10 and 21 Tg/year, respectively [3,4]. Although the anthropogenic SO2 source intensity is about five times greater than volcanic emissions, the radiative effects of volcanic sulfates are only slightly weaker than those induced by anthropogenic sulfates. This potential impact on climate arises from the higher efficiency of volcanic sulfur at producing sulfate aerosols, which is thought to be 4.5 times higher than that of anthropogenic sulfur because volcanic SO2 molecules released at high tropospheric altitudes feature a longer residence time; this is mainly due to their appreciably lower dry deposition rate compared to that of anthropogenic SO2 emitted at surface level [5,6]. Natural variability in the composition of the atmosphere related to volcanic activity, especially the emission of ash and SO2 flux (which further transforms to sulfuric acid (H2SO4) and water vapor (H2O)), changes the atmospheric albedo and solar radiation budget (direct effect). Gaseous volcanic emissions also contribute to increasing the number of aerosol particles through gas-to-particle conversion processes, and therefore impact the concentrations of potential cloud condensation nuclei (CCN) and ice nucleating particles (INP), with a subsequent effect on cloud properties, resulting in local or regional climate change (the so-called indirect effect of aerosols) [7,8,9,10,11,12]. An increase in CCN, for clouds of equal liquid water content, enhances the concentration of cloud droplets and reduces their size. This results in an increase in cloud albedo. Aerosols also affect cloud thickness and lifetime, leading to precipitation [13,14,15].
The New Particle Formation (NPF) process is an atmospheric phenomenon including the formation of nanometer-sized clusters through the gas-to-particle chemical mechanisms and their subsequent growth to larger sizes [16,17]. These clusters may grow via condensation to sufficiently large sizes (~100 nm) to act as cloud condensation nuclei (CCN) [18]. NPF is an effective source of CCN in both the free troposphere (FT) and the planetary boundary layer (PBL) [19,20]. A review of previous studies shows that up to 50% of global CCNs are attributable to nucleation [21]. Evidence of new particle formation has been reported in highly polluted urban areas and even in fresh plumes with sufficient OH concentrations [22]. In field studies across Asia, new particles (3–4 nm) have been observed in both anthropogenic and volcanic plumes with high H2SO4 concentrations [23]. From the numerical approach, a new aerosol model representation with 20 size bins between 1 nm and 10 µm and activation-type and kinetic nucleation parameterization is introduced into the Weather Research and Forecasting Model coupled with chemistry (WRF-Chem model; [24]). The results of this study indicate that NPF contributed 20–30% of the condensation nuclei concentrations (>10 nm in diameter) in and around the urban environment of Beijing, on average. NPF suppresses the increases in both the size and hygroscopicity of pre-existing particles through the competition of condensable gases between new particles and pre-existing particles [25]. Lupascu et al. [26] found that at a supersaturation of 0.5%, the freshly nucleated particles could explain up to 20–30% of predicted CCN, depending on location and the specific nucleation parameterization. In a similar study, the WRF-Chem model, which represents an aerosol size distribution between 1 nm and 10 µm, is used for the study of the frequency of new particle formation and concentrations of aerosols including both condensation nuclei and cloud condensation nuclei within the boundary layer in East Asia in spring 2009. The results of this work show that the nucleation process depends on the availability of SO2 and H2SO4, and atmospheric conditions (high-pressure systems) [27]. The investigation of the NPF in the urban boundary layer using CERN CLOUD chamber (Cosmic Leaving Outdoor Droplets, [28]) and mixtures of anthropogenic vapors (H2SO4, ammonia, dimethylamine, NOx, ozone, water, and several anthropogenic volatile organic compounds) indicates that the formation of sulfuric acid-base clusters is the first stage in the NPF process [29].
Two processes determine the NPF process: (1) the formation of molecular clusters by nucleation, and (2) subsequent growth of clusters to CCN aerosols (larger than 100 nm) [30]. Sulfuric acid, formed from the oxidation of SO2 through different chemical reactions, including OH-SO2 reaction [31], catalytic oxidation of SO2 inside the volcanic dome [32], high-temperature chemistry in the gas phase [33], and aqueous production from SO2 [34], is known to be a key species in these processes [35]. The formation of sulfuric acid and its concentration depends on the oxidation rate of SO2 and its concentration, which can be significant in volcanic plumes, both during eruptions and in passive plumes [35,36]. Volcanoes are usually viewed as a source of stratospheric aerosols. This is true of major explosive eruptions, but degassing volcanoes are continuous sources of SO2 in the troposphere. Emissions of gaseous species may remain significant, likely to contributing to the formation of new particles [37]. Global modeling studies of new particle formation indicate that volcano eruption can be an important source of new particles in the troposphere, at least on a regional scale [38]. Volcanic aerosols include components either directly released or formed over a seconds–minutes time scale after the release of the hot gas mixture from the vent. This contrasts with the secondary sulfate aerosols that are formed by atmospheric oxidation of SO2 over typically hours to days [15]. Evidence of “volcanically” induced NPF from volcanic emission is reported in previous field studies, which show the essential role of sulfuric acid in this process [37,39,40,41]. A significant contribution of the particles formed in the piton de la Fournaise volcanic plume to the budget of potential CCN at the Maïdo observatory (La Réunion Island), located ~40 km from the vent of the volcano is demonstrated [42]. Similarly, several NPF events triggered by air masses coming from volcanic emissions were reported at Chacaltaya mountain station in Bolivia, and it was proven that all the nucleation events observed during the volcano activity were triggered by sulfuric acid and ammonia [43]. From the numerical approach, the formation and evolution of particles in volcanic plumes were studied using an aerosol microphysics model [38]. Simulation results indicate that newly-formed particles can grow to CCN-sized within about one day because of relatively high precursor gas concentrations in the volcanic plume. Numerical simulations using the two-moment version of the Global Model of Aerosol Processes (GLOMAP-mode; [44,45,46,47]) with binary homogeneous H2SO4-H2O nucleation scheme [48] show that tropospheric volcanic degassing increases global annual mean cloud droplet number concentrations [49]. Similarly, numerical results using the Mesoscale Non-Hydrostatic model (Meso-NH [50]), with the implementation of the homogeneous binary nucleation scheme developed in [51], showed that volcanic passive plumes have a significant impact on CCN formation and increase the number of CCN, and depending on the plume location, the aerosols act as CCNs at different distances from the vent [52]. In this study, particle numbers are evaluated in two different modes: Aitken mode (particles with diameters less than 50 nm) and accumulation mode (aerosols with diameters between 50 and 300 nm), which do not cover particles with diameters less than 20 nm. However, in these studies, the number of new particles (2.5–10 nm) and their climatic impacts are underestimated due to the deficiencies in applied nucleation schemes.
The simulation of new, ultra-fine particle concentrations with acceptable accuracy is the first step in the reliable prediction of volcanic particles’ role in CCN concentrations. Current mesoscale models coupled with chemistry with default configuration are not practical for the main purpose of the current project. For instance, the default nucleation rates in the Model for Simulating Aerosol Interactions and Chemistry (MOSAIC) in WRF-Chem (version 3.9) are the Wexler binary H2SO4-H2O nucleation scheme [53] and ternary H2SO4-H2O-NH3 nucleation rates [54,55]. It is proven that these nucleation schemes show deficiencies in the simulation of newly-formed particles with diameters less than 10 nm. The binary nucleation scheme underestimates the magnitude of the observed particle formation rate by 7 to 8 orders [39,56,57]. The activation nucleation parameterization based on H2SO4 concentration can be used for the evaluation of new particle formation rates in numerical models (for example, [58] (coupled with the NCAR CAM3 atmospheric circulation model [59], and the LLNL/Umich IMPACT aerosol model [60]); [61] (GLOMAP aerosol microphysics model); [62] (the global aerosol-climate model ECHAM5-HAM); [63] (GEOS-Chem-TOMAS model)). In this scheme, J is the formation rate of clusters at 1 nm: Activated-type nucleation: J = 2.0 × 10⁻⁶ × (H2SO4) [64,65]. Similarly, a simple power-law model for the 3 nm ultra-fine particles formation rate (J = K × (H2SO4)P) was tested in diverse continental and marine atmospheric environments. p = 2 and K ranges from 10−14 to 10−11 cm3 s−1 were suggested to be used in global climate models [66]. However, in these studies, the nucleation rate is validated in the boundary layer and for anthropogenic emission sources, but not in the FT and volcanic emission conditions with the high temperatures and complex chemical reactions inside the plumes.
In this study, numerical results using new parameterization of nucleation (NPN) ([37]; J = 1.844 × 10⁻⁸ × [H2SO4]1.12) are evaluated against the activation parameterizations of nucleation (J = 2.0 × 10⁻⁶ × (H2SO4)) in the passive plume of Etna volcano with considerable observed SO2 emission flux and sulfuric acid concentrations. The WRF-Chem model is applied for high-resolution numerical simulations (Section 2.2). This is the first step in the numerical assessment of the passive volcanic plume’s role in new particle formation rate and evolution and growth of these particles. The NPN for the activation nucleation is derived from new field measurements of SO2, H2SO4, and particles through different size distributions using equipped and up-to-date tools (Section 2.1). The access to these data provides an opportunity to evaluate the performance of the WRF-Chem mesoscale numerical model in a volcanic passive plume for the first time, especially in terms of newly-formed ultra-fine particles with diameter less than 10 nm through the gas to particles nucleation process, which is not well documented from the numerical perspective in previous literature. In addition to the continuous source of SO2 emission, lower removal sinks for new particles in FT relative to PBL [37] make Etna passive plume a suitable case study to carry out a comprehensive numerical analysis of the new particle formation processes and their growth to CCNs.
2. Materials and Methods
2.1. An Overview of the Case Study, Measurements and New Parameterization of Nucleation
Etna volcano (3330 m above the sea level, located at 37.748° N, 14.99° E; Italy) is the largest regional source of gas and particles that are transported in the FT by winds for long distances covering a significant portion of the Mediterranean Sea [67]. A study performed in the context of the Aerosol Comparisons between Observations and Models (AEROCOM) program [68], reported that when considering the daily SO2 emissions and plume heights above the vent for 1167 volcanoes from 1 January 1979 to 31 December 2009, Etna was the largest contributor, with more than 45 Tg. This was also evidenced by the NASA Modeling, Analysis, and Prediction (MAP) program [69,70].
The particle formation rate as a function of sulfuric acid concentration under volcanic plume conditions was examined by [37] from the aircraft measurements performed during the STRAP (Synergie Transdisciplinaire pour Répondre aux Aléas liés aux Panaches Volcaniques) project in the period of 15–16 June 2016 over Etna and Stromboli volcanoes. The French research aircraft (ATR-42) was equipped with a range of instrumentation equipment, allowing the measurement of particle number concentrations over a broad size range and the monitoring of several gaseous species with a time resolution of 1 s. In particular, measurements from two particle counters, with cut-off diameters of 2.5 nm (Condensation Particle Counters (CPC); TSI 3788; [71]) and 10 nm (the Condensation Particle System (COPAS) CPC [72]) were used in this study, together with the particle number size distributions retrieved by a passive cavity aerosol spectrometer probe (PCASP100X V3.11.0, Droplet Measurement Technologies, boulder, CO, USA) in the range between 100 nm and 3 µm. In the gas phase, specific attention was paid to SO2 mixing ratios measured with a UV fluorescence analyzer (Teledyne API T100U, San Diego, CA, USA) and sulfuric acid concentrations obtained from an atmospheric pressure interface time-of-flight mass spectrometer (APi-TOF, Aerodyne Research Inc. and TOFWERK AG, Thun, Switzerland; [73]) equipped with a specific inlet dedicated to airborne measurements. For more details about the deployed airborne instruments, see [37], Section 2.3.
The NPN was derived from the comprehensive investigation of the new particle formation rate based on the measurements of SO2, H2SO4, and particles in natural passive plumes of Etna and semi-active Stromboli and defined as J = 1.844 × 10⁻⁸ × (H2SO4)1.12 [37]. This NPN shows reliable accuracy for predicting the role of sulfuric acid on observed newly-formed particles.
2.2. Model Configuration
2.2.1. Domain Characteristics
The WRF-Chem, model version 3.9, was used for high-resolution numerical simulations over three nested domains (with increasing spatial resolution: 9, 3, and 1 km resolution for d01, d02, and d03, respectively; Figure 1). The topography data for the innermost domain were extracted from a high-resolution SRTM dataset (the NASA Shuttle Radar Topographic Mission 90 m Digital Elevation Data) at 3 s (about 100 m) horizontal resolution (https://srtm.csi.cgiar.org/, accessed on 15 December 2020) and the land use data used a CORINE (coordination of the information on the environment) Land Cover inventory with 33 different land use/land cover classes. For the two outermost domains (d01 and d02), the USGS (United States Geological Survey) land cover dataset was used. Meteorological initial and boundary conditions were taken from the ERA5 reanalysis data [74] with a temporal resolution of 6 h. The chemical boundary conditions for d01 and initial conditions for the three domains were produced from the Model for Ozone and Related chemical Tracers, version 4 (MOZART-4) [75]. The data from the coarse domains were used for inner domain boundary conditions. The model configuration details are available in Table 1.
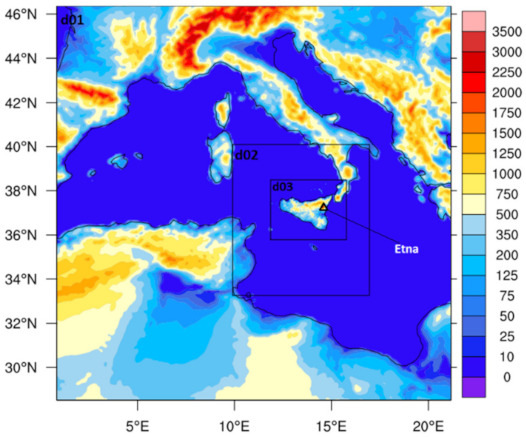
Figure 1.
The extent of three domains with horizontal resolution of 9 (d01), 3 (d02) and 1 km (d03) and terrain heights (in meters), and the location of Etna (37.748° N, 14.99° E; Italy) in the third domain.

Table 1.
WRF-Chem Configuration.
2.2.2. Emissions
WRF-Chem has proven to be an excellent candidate for the prediction of the formation, transport, dispersion, and sedimentation of different types of natural emissions [85]. A small number of recent studies focused on the effects of volcanic emissions within the atmosphere for eruptions or passive degassing at various volcanoes: Kasatochi volcano, 2008 [86], Eyjafjallajökull volcano, April–May 2010 [87], Etna volcano, 2015 [8], Grimsvötn volcano, 2011 [88], Eyjafjallajökull volcano, 2010 [89], and Mount Redoubt volcanic ash clouds using coupled PUFF and WRF-Chem dispersion models, 2009 [90]), as well as gas-phase species, aerosol, and cloud properties [9,91]. In some of these studies, a module [85] was implemented to WRF-Chem to generate volcanic ash and sulfur dioxide emitted during the volcanic eruptions and passive degassing from a global emission database [92], based on field regional observations.
The work described hereafter is focused on the passive degassing of the Etna volcano observed on 15 June 2016 (as described in Section 2.1; Table 1) where only the products of passive emissions (no ash) could be recorded [37]. To accurately represent the level of sulfur dioxide emission, we did not use the global emission database [92]. Nevertheless, in a similar way, a continuous source of SO2 mass flux was introduced to the model at the nearest grid point to the real Etna coordinates (located at 37.748° N, 14.99° E; 3330 m above the sea level) at every meteorological time step. However, due to the spatial resolution of the model and the mismatch between the topography heights considered in the model and the real values, the location of the simulated volcanic plume showed horizontal and vertical shifts (see Section 2.3 for more details). A series of test runs (not shown) were performed with various SO2 emission mass fluxes (including 5.47 × 10⁵, 4.1 × 10⁵, 3.485 × 10⁵ and 2.87 × 10⁵ mol km−2 h−1) according to the values reported in previous research for Mount Etna (0.6–2 kt/day: [93,94]). The results were evaluated to access the reliable agreement between the simulated SO2 concentrations and the available observation data (as the first chemical species in the loop of reactions results in new particle formation inside the volcanic plume). Finally, SO2 emission from Etna was considered a continuous mass flux of 2.87 × 10⁵ mol km−2 h−1. To accurately characterize the formation of volcanic new particles, both anthropogenic and biogenic emissions are ignored in the model configuration.
2.2.3. Aerosol Properties
The MOSAIC aerosol module was used for aerosol-related processes. Since the default 8 bin structure in this module features a diameter range of 39 nm –10 μm, which is much larger than the reported sizes of newly-formed particles (~1–2 nm), the default module was developed into a 12 bin aerosol size distribution (1 nm–10 µm) in the modified version of the model (following the approach in [25,26,27]) to explicitly track the formation and evolution of simulated new particles with diameters less than 10 nm (see Table 2 for more details). The aerosol species in MOSAIC included sulfate, nitrate, ammonium, sodium, chloride, calcium, carbonate, other inorganics (i.e., dust), methane sulfonate, elemental carbon, primary organic aerosols (POAs), and aerosol water [95]. Secondary organic aerosols (SOAs) are represented by the simplified volatility basis-set (VBS) approach of [96], with additional updates for biogenic SOA yields [97].
Table 2.
The 12 modified sectional aerosol bins (1 nm–10 µm) in the MOSAIC scheme in WRF-Chem, and the size distribution of available observations (flight ETNA13); dp refers to particles’ diameter. The size ranges indicated in bold are used for the model validation.
2.2.4. Chemical Reactions
For the Statewide Air Pollution Research Center (SAPRC-99) chemical mechanism, no aqueous phase chemistry is used in the model configuration. Since this study is focused on the NPF, and the reported cloud content was close to zero during the STRAP campaign, no aqueous phase chemistry was applied, but in future works, this option needs to be activated (see Section 4 for more details). The SAPRC-99 detailed atmospheric chemical mechanism for VOCs (volatile organic compounds) and NOx (nitrogen oxides) represents a complete update of the SAPRC-90 mechanism of [83]. The chemical reaction for H2SO4 production in this module is the OH-SO2 reaction:
OH (hydroxyl radical) + SO2 → HO2 (hydroperoxyl radical) + H2SO4 + “biogenic VOC precursors”
The production of OH begins with the generation of excited states of atomic oxygen from the ozone and diatomic oxygen via photolysis during the day [98,99] or direct emission from the vent [31]. The initial background and boundary condition concentrations of OH, HO2, hydrogen peroxide (H2O2), and ozone (O3) as the key chemical elements in the chain of reactions related to the consumption and production of OH in the SAPRC-90 mechanism chemical mechanism were updated using MOZART-4.
2.2.5. Model Experiments
The simulation period included three days (two days of spin-up between 13 June 2016 (00:00 UTC) and 15 June 2016 (00:00 UTC) and lasted until 15 June 2016, 13:00 UTC). In the following sections, the analysis is focused on the period between ~10:45 and 11:15 UTC (15 June), during which measurements are available for the model validation (Table 1; Section 2.1).
Two simulations were performed with different expressions of the nucleation rate (J) from (H2SO4). In the first simulation (S1), JS1 was considered activation-type [64,65] and follows the expression: JS1 = 2.0 × 10⁻⁶ × (H2SO4). In the second simulation (S2), the newly-developed NPN parameterization [37] was applied: JS2 = 1.844 × 10⁻⁸ × [H2SO4]1.12. Note that another simulation named NO-VOLCANO was performed, using the same configuration as S1 but without considering volcanic SO2 emission, to assess the numerical performance of the model and track the temporal variations of the precursor background concentrations (underlying chemistry) and the number of pre-existing particles.
Note that due to the computational constraints for performing the simulations with high spatial (1 km) and temporal (5 s meteorological time step) resolutions as well as using a 12 bin aerosol scheme (instead of the default 4 or 8 bin) with considerable extra computational time, a higher time step for the chemistry (5 min) relative to meteorology (45 s in the third domain) was considered, which further affected the atmospheric advection and transportation of chemical species.
2.3. Model Validation Method: Observations vs. Simulations
For the detailed analysis of the numerical results, the WRF-Chem outputs were saved with a high temporal resolution of 5 min between 10:45 and 11:15 (UTC). For the model validation, first, numerical results were interpolated over measurement heights (horizontal interpolation) and then over times in the geographical locations (latitude/longitude) of observation points along the ETNA13 aircraft flight path in [37] (see Figure 2). The results of S1 and S2 were evaluated against the observations for SO2, H2SO4, and particle concentrations in different size ranges. Since no aircraft measurements are available for particles with diameters less than 2.15 nm (bin01 of the size distribution in the model; see Table 2), three distinctive ranges were considered for the model validation to access the main purpose of this study: ~2.5–10 nm newly-formed particles (N2.5–10; corresponding to bin02 + bin03), particles in the range between ~10 and 100 nm, corresponding to nucleation and Aitken mode particles (N10–100; corresponding to bin04 to bin06), and ~100–200 nm CCN-sized particles (N100–200; corresponding to bin07) (see Table 2 for more details). Statistics such as minimum, maximum, first quartile (Q1), median, and third quartile (Q3) were used to assess the mean and the spread for the mentioned chemical species and particle size ranges (Table 3).
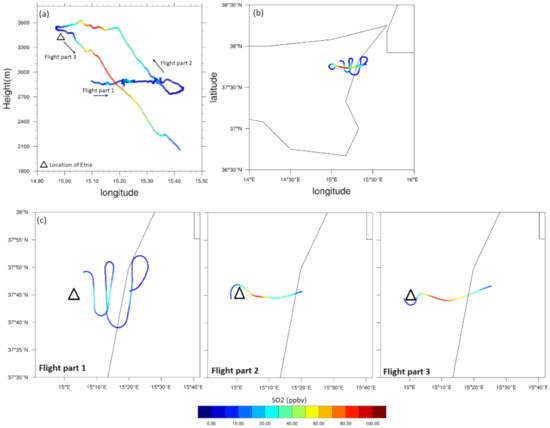
Figure 2.
Vertical (a) and horizontal (b) tracks of the ATR-42 ETNA13 flight (STRAP project) showing the measured SO2 (ppbv) concentrations. In addition to (b), the sub-panels in (c) illustrate the three distinctive legs (flight parts) of the aircraft’s trajectory (see Section 2.3 for more details). The black lines are geographical borders of the Sicily Island, Italy.
Table 3.
Statistical comparisons of measured and simulated key species concentrations in S1 and S2 (Approaches 1 and 2 are described in detail in Section 2.3 and 3.2.2).
The accurate detection of degassing volcanic plumes is a challenging process through field measurement because these diluted plume feature no distinctive boundaries to catch easily. However, it is completely traceable through simulations because of the significantly higher SO2 and H2SO4 concentrations in the plume relative to the ambient air (Figure 3). As shown in Figure 2, the aircraft flight can be divided into three legs. The first was performed at an almost constant altitude (2700 to 2900 m) in a sinuous trajectory to discover the plume core and its boundaries (corresponding to flight part 1 in Figure 2)’; the second leg included the aircraft ascent and turning around the vent at about 3500 m (flight part 2 in Figure 2); and the last leg included the descent of the aircraft down to altitudes lower than 2100 m (flight part 3 in Figure 2). From these figures, the Etna passive plume seems to be extended vertically between 2000 and 3600 m, and horizontally to more than 50 km far from the vent. The minimum observed value for the SO2 concentration was 1.36 ppb, outside the plume, which contrasts with the maximum of 92.4 ppb reached at an altitude above 3 km (flight part 3), when the aircraft was likely in the center of the plume (see also Table 3). As reported by Sahyoun et al. [37], sampling was not performed in the center of the plume at the location of the vent, where the highest amounts of SO2 are expected; the maximum concentration was instead observed at a distance of 13 km from the vent.
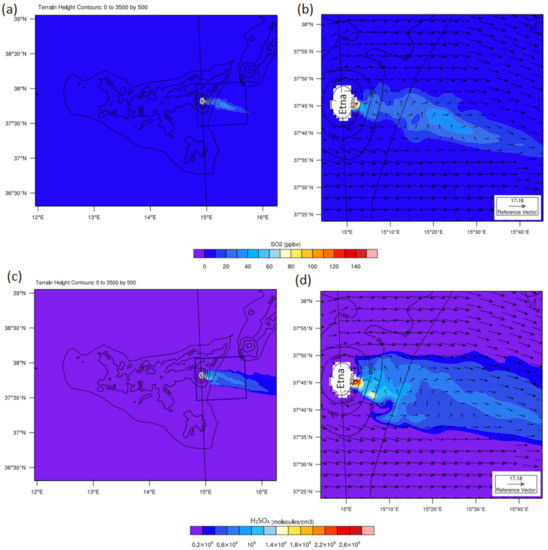
Figure 3.
Simulated SO2 (a,b) and H2SO4 (c,d) concentrations on 15 July 2016 (11:00 UTC) over the 2100 m horizontal cross-section in the third domain (left panels) and downwind zoomed area (right panels) in simulation S2. Black contours show terrain height (in meters). The arrows on right panels show wind properties: speed (m s−1) and direction.
The true detection of the shape and structure of the simulated volcanic plume and visualizing the aircraft flight trajectory inside the horizontally and vertically extended plume were the first steps in this study. Mainly due to the difference between the vent height considered in the model (2620.62 m) and its real height (3330 m), the simulated passive plume showed a vertical shift to lower altitudes relative to the observations. To accurately match the vertical extension of the observed and simulated plumes, the model outputs were shifted by −700 m. More specifically, in leg 1, the numerical results were interpolated over a horizontal plate at an altitude of 2100 m (corresponding to the almost constant altitude of observations minus a vertical shift of 700 m). For legs 2 and 3, where the flight altitude changed, the documented heights minus the same vertical shift than for leg 1 were considered. Besides, the wind field and the topography (Figure 3) rotated the simulated plume to the southeast direction. Indeed, the dominant wind direction during the day was mainly from the west during the three days of simulations, which resulted in the eastward transfer of SO2 (Figure 3a,b) and H2SO4 (Figure 3c,d) and volcanic plume formation. Therefore, the interpolation path was modified horizontally to correctly match the horizontal extent of the observed plume. As further discussed in the next section, this method (hereafter referred to as Approach 1) made it possible to correctly simulate the levels and spatial variations of the observed SO2.
3. Results and Discussion
3.1. Sulfur Dioxide Concentrations
The predicted SO2 concentrations are validated against the observations along the ETNA13 aircraft trajectory in Figure 4a–c, and the spatiotemporal variations (10:45–11:15; UTC) of the observed SO2 concentrations (black line) are additionally compared with the simulated values (blue (S1) and red (S2) lines) in Figure 5a. This period was selected as it included the highest concentrations of newly-formed particles measured during ETNA13 flight ([37]; Figure 2 and Figure 3).
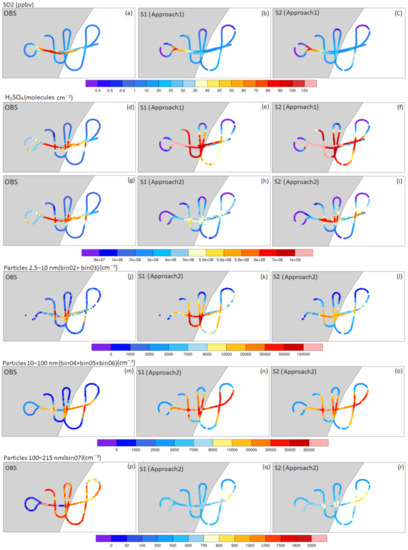
Figure 4.
Evolution of SO2 concentrations (a–c), (H2SO4) (d–i), ~2.5–10 nm-sized newly-formed particles (N2.5–10) (j–l), 10–100 nm-sized particles (N10–100) (m-o), and ~100–200 nm CCN-sized particles (N100–200) (p–r) along the aircraft trajectory, using the analysis Approaches 1 or 2 (see Section 2.3). OBS corresponds to the measurements obtained during the flight ETNA13 (10:45–11:15 UTC). S1 and S2 correspond to simulations that respectively use the activation parameterization for nucleation and the NPN.
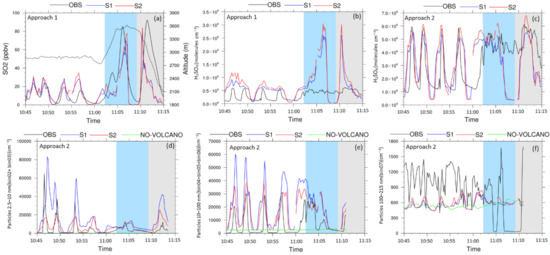
Figure 5.
Spatiotemporal variations of simulated SO2 concentrations (a), (H2SO4) (b,c), ~2.5–10 nm sized newly-formed particles (N2.5–10) (d), 10–100 nm-sized particles (N10–100) (e), and ~100–200 nm CCN-sized particles (N100–200) (f) obtained using the analysis Approaches 1 or 2 (see Section 2.3). OBS corresponds to the measurements obtained during the flight ETNA13 (10:45–11:15 UTC), which can be divided into 3 legs. The white, blue, and grey areas are referred to legs 1, 2, and 3, respectively. NO-VOLCANO does not include volcano-related SO2 flux; S1 and S2 correspond to simulations, which, respectively, use the activation parameterization for nucleation and the NPN. Considering the speed of the aircraft (360 km h−1), 10 s averaged observation data are used in these plots to compare with the simulation results obtained in 1 km horizontal resolution. The dashed line in plot (a) refers to altitudes (in meters) during the flight ETNA13.
As reflected by the statistics reported in Table 3, the model, on average, reasonably predicts the SO2 concentrations in both simulations, since the relative difference reached up to +3.9% for the median (MeanObs = 21.30 ppbv; MeanS1 = 15.93 ppbv; MeanS2 = 16.92 ppbv; MedianObs = 12.75 ppbv; MedianS1 = 12.25 ppbv; MedianS2 = 13.14 ppbv; note that the relative difference for the mean reached higher values (−25.2%) because it was more affected by the few highest values; Table 3). In addition, Figure 4 and Figure 5 show that the model reasonably captured the extent of the passive plume at more than 50 km from the vent. In leg 1, the temporal/spatial variations of predicted SO2 concentrations were in good agreement with the observed values, and, in particular, both simulations show similar values outside the plume boundaries (<5 ppbv), in an acceptable agreement with observed values. Although the model tends to underestimate the concentrations in leg 3 (Figure 5a), the magnitude for the maximum values inside the plume was also well captured by the model, with higher accuracy in S2 in comparison to S1 (Table 3).
The fast rate of SO2 oxidation, which caused deficiencies in the SO2 advection process along the simulated plume (see Section 3.2 for more details), an underestimation of wind speed (MeanObs = 18.76 m s−1 vs. MeanS1&S2 = 11.23 m s−1; MedianObs = 19.29 m s−1 vs. MedianS1&S2 = 11.9 m s−1), and the temporal delay in the transfer of the accumulated SO2 content close to the vent along the plume, was likely the main source of the differences between observations and model results. In addition, the mismatch between the time steps in the meteorology and chemistry parts (as described in Section 2.2.5) and the lower temporal and spatial resolutions in the modeling system relative to the measurements caused inevitable temporal and spatial shifts relative to the observations in capturing the exact location of the maximum and minimum values (Figure 5a). Despite these discrepancies, however, the previous comparison between the observed and simulated SO2 indicates that the plume’s horizontal thickness, its vertical structure and the bounds of the SO2 values were overall well simulated in both simulations, considering the 700 m vertical shift used for this comparative analysis (described in Section 2.3).
There are different pathways for the oxidation of SO2 in a passive volcanic plume, such as OH–SO2 reactions and reactions with H2O2, O3, O2 and halogens such as HOBr. Some of these reactions are not yet included in global or regional numerical models due to uncertainties over reaction rates and a lack of reliable observations through which to extract valid empirical functions [98,100,101]. In this work, the main daytime chemical reaction that consumes SO2 within a short time is the production of sulfuric acid through OH-SO2. Therefore, SO2 concentrations follow similar spatiotemporal patterns in S1 and S2 (considering that the emission sources of SO2 feature identical properties and meteorological factors such as dispersion, dilution, turbulence, and vertical mixing in the free troposphere are the same in S1 and S2).
It is worth noting here that the amount of initial SO2 injection and temporal variations of initial SO2 flux, as well as the updraft of the volcanic plume and the vertical resolution of the model, could be interesting in the future to perform sensitivity tests to quantify their impacts on the nucleation process and newly-formed particle concentrations, since these parameters directly affect the evolution of aerosols in the model [102,103]. Uncertainties in the oxidation rate of SO2 [57,98,104,105] and the OH production rate as the secondary product of photochemical reactions of ozone could be other deficiencies in numerical simulations.
3.2. Sulfuric Acid Concentrations
3.2.1. Chemical Sources of Sulfuric Acid
The performance of the model in predicting (H2SO4) variations is presented in Figure 4d–f and Figure 5b. On average, tracking the predicted sulfuric acid concentrations along the aircraft trajectory indicates that H2SO4 concentrations were overestimated in both simulations (up to two times higher for the Mean; see Table 3). The minimum observed (H2SO4) (~0.86 × 10⁸ molecules cm−3) were not well captured, and there was a clear shortcoming in the prediction of the spatiotemporal variations of sulfuric acid. The assessment of statistics features such as Q1, median and Q3 calculated from the observations and simulations also supports the overestimation of sulfuric acid (Table 3). The largest differences were observed in legs 2 and 3, where (H2SO4) reached more than ~2.5 × 10⁹ molecules cm−3 close to the vent in both simulations, while the measurements did not exceed ~7 × 10⁸ molecules cm−3 during this part of the flight (Figure 5b and Table 3; MaxObs = 6.78 × 10⁸ molecules cm−3; MaxS1 = 28.5 × 10⁸ molecules cm−3; MaxS2 = 31.7 × 10⁸ molecules cm−3). Furthermore, the highest concentrations were located on the east side of the vent in the model, as expected considering the eastward wind field; as a probable consequence of this eastward wind, (H2SO4) seemed to be underestimated on the west side of the vent in both simulations ((H2SO4) < 0.4 × 10⁸ molecules cm−3 compared to the observations in the range between 4.0 × 10⁸ and 5.6 × 10⁸ molecules cm−3). By contrast, at the lower altitude of leg 1, the simulated concentrations show better agreement with the observations, even though the minimum values were not well captured (as mentioned before).
Mount Etna is one of the most important continuous emitters of gases such as H2O, SO2 and less reactive carbon dioxide [106,107], hydrogen sulphide (H2S) [108], and volcanic bromine monoxide (BrO) [109,110,111], as well as high-temperature volcanic products such as Br, OH and NO [110,112]. In a natural volcanic environment, within minutes of emission, primary volcanic plume aerosols catalyze the conversion of co-emitted HBr and HCl into the highly reactive halogens BrO and OClO (chlorine dioxide) through chemical cycles, which cause substantial ozone depletion within the dispersing downwind plume [111,113]. These chemical processes increase the atmospheric lifetime of SO2 and decrease sulfuric production [112,114]. The sources of the above-mentioned overestimation of (H2SO4) in our simulations could be the lack of some key volcanic species in model settings such as halogens, or near-vent high-temperature products, such as OH and Br [112,115]. This might have resulted in the unrealistic abundance of ozone concentrations and the fast consumption of SO2 close to the vent, and, in turn, a significant overprediction of (H2SO4) in the numerical results using the WRF-Chem model, which is also reported by [56]. However, comparing the results with the observations in our case (Figure S1) did not confirm high concentrations of ozone.
As noted in the previous section, the predicted concentrations of SO2 transported by wind inside the extended plume were significantly lower than the observations, particularly in leg 3 (up to ~40 ppbv; Figure 4a–c), which could support the aforementioned fast rate of SO2 oxidation close to the vent. Furthermore, the underestimation of the wind speed, as reported in the previous section, could have helped the accumulation of H2SO4 close to the vent. Another reason for the overestimation of (H2SO4) in the model was the underestimation of the condensational sink compared to observations (Figure S2), as the simulations included particles originating from NPF in the volcanic plume and ignored all other possible aerosol sources (for instance, volcanic primary particles that may still be emitted in low amounts during passive degassing [85], marine aerosols that are likely present in the surroundings of Sicily [116,117], as well as anthropogenic or biogenic particles). Furthermore, NPN is validated under (H2SO4) lower than 4.6 × 10⁸ molecules cm−3 when the coagulation process is negligible compared to the strength of the nucleation rate [37].
3.2.2. Sulfuric Acid: NPF Gas Precursor
Since the accurate prediction of (H2SO4) is a key factor in the analysis of new particle formation through nucleation processes in volcanic environment (as the main objective of the current work) and considering the above-mentioned discrepancies between the observed and simulated H2SO4) (both in terms of absolute values and spatial variability), we chose to slightly shift our H2SO4 model/observation comparisons, vertically, and search for the best match between them. This approach (hereafter referred to as Approach 2) was applied to be able to quantify the impact of solely the new parameterization of nucleation without important discrepancies in the main precursor gas species. The resulting new altitude considered in the model was found at 1500 m for leg 1, i.e., corresponding to a vertical shift of 1200 m (instead of 700 m, as in Approach 1, described in Section 2.3), and the same shift of 1200 m was also applied to legs 2 and 3. With Approach 2, the agreement between the simulated and observed spatiotemporal variations of sulfuric acid concentrations significantly improved (Table 3; Figure 4g–i and Figure 5c).
Therefore, Approach 2 was used for the investigation of the particle number concentration reported in the next sections, as, in the absence of other possible sources in the model set-up, the simulated particles originate from NPF in the plume and are in turn closely related to the prediction of H2SO4. As shown in Figure 5c, however, slight discrepancies remained between the simulated and measured (H2SO4) when using Approach 2; in particular, (H2SO4) tended to be underestimated in the plume core in S1 compared to both S2 and observations. As discussed below, this was likely related (at least partly) to the parametrization of the nucleation rate in S1.
Figure 6a shows the differences in in (H2SO4) between S1 and S2 at 2100 m (where the core of the plume was detected in the simulations by comparing the mean and median of (H2SO4) over the third domain). The negative values indicate that sulfuric acid concentrations were higher in S2 (i.e., the simulation with the NPN). NPN (JS2 = 1.844 × 10⁻⁸ × (H2SO4)1.12) decreased the rate of sulfuric acid consumption, which les to higher values for this chemical species in comparison to S1 (JS1 = 2.0 × 10⁻⁶ × [H2SO4]) (considering that sulfuric acid production rates are the same in both simulations), therefore suggesting that the use of NPN already contributes to improving the predictive ability of the model with respect to (H2SO4).
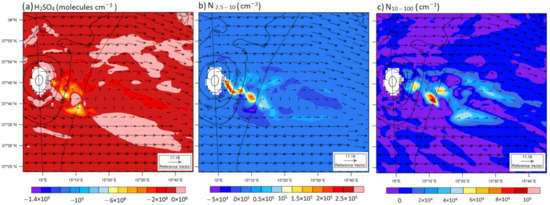
Figure 6.
The same as Figure 3b,d, except for differences (S1–S2) in simulated values for (H2SO4) (a), concentrations of ~2.5–10 nm sized particles (N2.5-10) (b), and concentrations of 10–100 nm-sized particles (N10-100) (c).
3.3. Impact of New Parameterization on Volcanic Newly-Formed Particles and Their Growth
The results in the previous section indicate that the median of the simulated H2SO4 concentrations was 3.85 × 10⁸ molecules cm−3 using Approach 2. As reported by [99,118], under these concentrations, new particle formation is expected to occur and is indeed observed in the passive plume of Etna [37]. According to [31], there are two main sources of secondary particles inside a dense passive volcanic plume:
- Secondary sulphate particles generated by the daytime oxidation of SO2 by the OH radical in the ambient air;
- Secondary aerosols that form immediately after emission from the vent by the oxidation of SO2 by volcanogenic OH.
Since volcanic OH is not considered in this study, secondary particles are only generated by sulfuric acid formed from the volcanic SO2 that reacts with background OH for oxidation.
The simulated newly-formed particle number concentrations (i.e., N2.5–10) in S1 and S2 were compared with the available observations (derived from CPC and COPAS measurements; see Section 2.1) through Approach 2. As reported in Table 3, on average, N2.5–10 was overestimated in both simulations (MedianObs = 1.2 × 103 cm−3; MedianS1 = 11.21 × 103 cm−3; MedianS2 = 5.79 × 103cm−3), but S2 led to more accurate predictions, with significantly lower differences to the observations relative to S1 (which was on average one order of magnitude higher than the observations). From the observations (Figure 5d), the largest N2.5–10, which reached more than 6 × 104 cm−3, were reported at altitudes between 2700 and 2900 m (corresponding to leg 1). At higher altitudes close to the vent, this number declined to lower than 1 × 104 cm−3. In terms of magnitude, the maximum simulated values for these particles (occurring during leg 1) showed an acceptable agreement with the maximum observed values in S1 (MaxObs = 95.50 × 103 cm−3; MaxS1 = 93.4 × 103 cm−3), but, as evidenced in Figure 5d, there was a slight shift in the location of the observed maxima compared to the observations. By contrast, there was an underestimation of these maxima in S2 (MaxS2 = 26.46 × 103 cm−3), but their location appeared to be better reproduced. Similarly, the minimum values were captured better by S2 than by S1 (MinObs =1.13 cm−3; MinS1 = 37 cm−3; MinS2 = 3 cm−3) (see Table 3 for more details). As the modeling set-up was the same in S1 and S2, except for the expression for the nucleation rate, the overestimation of particles in S1 relative to S2 suggests an overprediction of the nucleation rate in S1. This is consistent with the faster rate of H2SO4 consumption, and, in turn, the lower (H2SO4) in S1 discussed in the previous section. These results confirm the faster rate of H2SO4 consumption, nucleation rate, and overprediction of particles in S1 relative to S2 that is described in detail in the previous sections. As mentioned, the detailed evaluation of the model performance in the prediction of N2.5–10 (Table 3) demonstrated that these particles were overpredicted (MeanObs = 5.78 × 103 cm−3; MeanS1 = 17.67 × 103 cm−3; MeanS2 = 7.43 × 10³). This overprediction can be explained by an overestimation of the nucleation rate (J) and particle loss by absorption into the pre-existing aerosol particles in the natural environment [23,119]. These results confirm the fact that the NPN significantly improved the predictive ability of the model with respect to NPF in a passive volcanic plume, with a better agreement between the model predictions and observations for both the number concentration of the newly-formed particles and the concentration of their precursor H2SO4.
Figure 6 shows a numerical comparative study at 2100 m. The difference (S1–S2) in the simulated N2.5–10 reached up to 2.5 × 105 cm−3 and 1 × 105 cm−3 inside the volcanic plume and close to boundaries, respectively. This pattern is consistent with the results obtained for sulfuric acid (Figure 6a), and further confirms the conclusions drawn from the comparison of the model predictions and observations along the flight path. Indeed, a higher nucleation rate in S1 led to lower concentrations of H2SO4 and higher N2.5–10 concentrations.
Subsequently, to study the growth of newly-formed particles in the passive plume of Etna, the simulated concentrations of N10–100 were compared with the observations (Figure 4m–o and Figure 5e). The observations were derived from the difference between CPC and PCASP measurements (see Section 2.1). It is worth noting that, according to the NO-VOLCANO simulation (Figure 5e), where the concentrations of these size-ranged particles were constantly low (equal to ~2000 cm−3) compared to S1 and S2, volcanic degassing was the main source of particles with diameters less than 100 nm in this study (no primary volcanic particles were considered in the simulations).
Figure 4m–o and Figure 5e show that the spatiotemporal features in the concentration fields for N10–100 obtained with both simulations were close to the observations. In particular, the core of the plume, where the concentrations reached higher values, was well captured. However, these figures also highlight the fact that the concentrations were overestimated in two simulations, especially in S1. The detailed statistics presented in Table 3 permit us to quantify the overestimations of these concentrations in S1 and S2 (MedianObs = 2.09 × 103 cm−3; MedianS1 = 19.75 × 103 cm−3; MedianS2 = 14.52 × 103 cm−3). The complementarity of Figure 5d,e illustrates the size evolution of newly-formed particles with diameters less than 10 nm (with the volcanic source) to larger particles inside the plume. In S1, the concentrations of N2.5–10 particles were, on average, overestimated by one order of magnitude (as described before), and an equivalent overestimation for larger particles (i.e., N10–100) is obtained after the growth processes. However, in S2, the concentrations of the newly-formed particles were on average only overestimated by a factor of 2, whereas the overestimation of the concentrations of larger particles reached approximately one order of magnitude compared to observations. This may have been due to the fact that as a lower amount of H2SO4 is necessary for the nucleation process in S2 (due to the use of the NPN parameterization, which decreases the nucleation rate compared to the activation mechanism used in S1) (Figure 6a), more H2SO4 is available to condense on pre-existing particles, making the condensation process on particles smaller than 10 nm more efficient.
3.4. Impact of NPN on CCN-Sized Particles
In this section, the influence of the representation of the nucleation on the concentrations of the CCN-sized particles (N100–200) is evaluated. Specific attention is paid to this size range (corresponding to bin07 in the model, see Table 2), as activation diameters around 100 nm were reported in several earlier studies (e.g., [120], at a supersaturation of 0.24%; [121], at a supersaturation 0.20%). Note that the assumed minimum size for CCN can vary according to different studies, and the smallest particles that are able to activate into cloud droplets are usually assumed to be in the range of 50–150 nm for the typical supersaturations found in natural clouds ([122] and references therein). Similarly, Schmidt (2013) assumed that CCNs correspond to particles with a dry diameter of more than 70 nm [123]. Therefore, with an identical assumption, a subset of 10–100 nm-sized volcanic particles (N10–100) studied in Section 3.3 would feature the potential ability to act as CCNs as well.
Figure 4p–r and Figure 5f show the spatiotemporal evolution of the CCN-sized particles (hereafter referred to as CCNs for simplicity) observed and simulated in S1 and S2. According to these figures, the CCN concentrations were underestimated in both simulations (on average by a factor of lower than 2, MedianObs = 9.3 × 102 cm−3; MedianS1 = 5.6 × 102 cm−3; MedianS2 = 5.9 × 102 cm−3; Table 3), and the spatial variabilities of the CCNs concentrations in the model also did not match those of the observations.
Figure 5f also represents the spatiotemporal evolution of the CCN concentrations obtained in the NO-VOLCANO simulation (i.e., without any volcano-related SO2 flux). Clearly, the difference between the simulated CCNs concentrations inside the plume relative to the ambient air was less than 200 cm−3 in both simulations, indicating the weak role of the volcanic emission in the concentrations of CCN-sized particles in the vicinity of the volcano’s vent and a few tens of kilometers downwind. In addition, unlike the results obtained for particles with diameters less than 100 nm (Figure 5d–e), there was no clear difference between simulated CCNs concentrations in S1 and S2 (Figure 5f), and the differences were also insignificant relative to the background concentrations. These could lead to the conclusion that measured particles with diameters greater than 100 nm were not produced in the plume (i.e., not from the evolution of volcanic nucleated particles) and were likely emitted as primary particles by the volcano. Since these primary particles were not considered in the volcanic emission file in the first place, the model underestimates the number concentrations of CCN-sized particles. Another potential explanation for this underprediction and of the differences between the observed and simulated spatiotemporal distributions of the CCN concentrations is that there were also various non-volcanic sources of particles with diameters greater than 100 nm in natural environments, such as marine, anthropogenic, and biogenic particles ([57] and references therein; [124]) which were not considered in the current simulations. Furthermore, nucleated particles in the plume do not grow into CCNs within a few hours (tens of km) of the vent, but this does not mean that they do not have the ability to grow later along the passive plume over time [38]. In fact, as evidenced in Figure 7 for S2, the highest number of volcanic CCN-sized particles relative to the background (more than 1500 cm−3) was observed in the core of the simulated plume more than 100 km from the vent. This confirms the potential regional-scale climatic forcing effects of grown-up volcanic particles (from the evolution of volcanic nucleated particles) in the free troposphere, which is in agreement with the results described in [52,125].
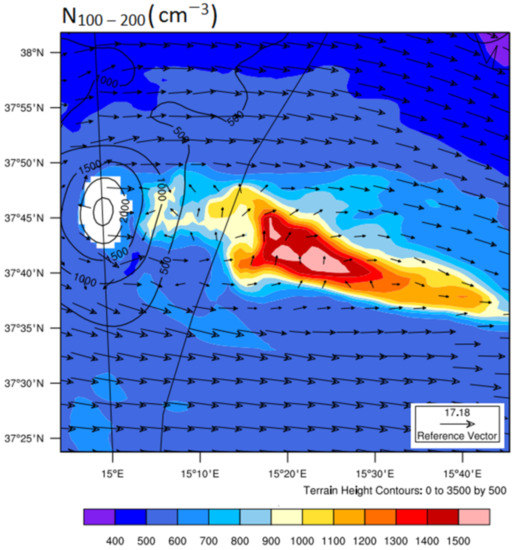
Figure 7.
The same as Figure 3b,d, but for CCN-sized particles (N100–200).
Finally, note that, because simultaneous condensation is a competitive process, the formation of new particles by nucleation is not easily identifiable. Once sulfuric acid has been produced from the oxidation of SO2, it condenses onto pre-existing particles in the plume, and distinction between these two processes is not practically possible using numerical approaches [52]. On the other hand, newly-formed particles may collide with larger particles and be removed from the nucleation cycle. Specifically, current numerical results estimate that the number of pre-existing CCN-sized particles (~100–200 nm) from the NO-VOLCANO simulation reaches more than 500 cm−3 (Figure 5f), and this number is not insignificant compared to the simulated values. Therefore, model validation in the case of CCN-sized particles, which is not the scope of this paper, shows high uncertainty. Nevertheless, this illustrates the necessity to modify the model set-up to focus on this specific question, now that we have been able to assess the nucleation and growth of volcanic-origin particles from a punctual SO2 source.
4. Conclusions
Volcanic passive degassing in the troposphere has long-lasting impacts on the safety of air traffic, air pollution, and local/regional climates through the emission of gases and particles at both local and regional scales [126]. Among these, the emission of SO2 and the subsequent production of sulfuric acid and fine particles are of the most concern since these new particles can grow up and act as CCNs. Numerical assessment of the effect of volcanic SO2 emission on the formation of new particles and further tracking the evolution of these particles to CCN-sized are challenging issues, since the available numerical models feature deficiencies in the prediction of these processes at both local and regional scales. From the general overview of available research described above, the main reasons for these uncertainties are: a lack of adequate measurement data for fine particles to extract empirical nucleation schemes for further implementation in chemical numerical models and the validation of the model performance for this process; and limitations in the default coupled meteorological/chemical modeling configurations (such as WRF-Chem or Meso-NH), which do not allow the study of ultra-fine particles with diameters less than 3 nm. In addition, a complex dynamical volcanic degassing system with a variety of chemical species, high temperatures, and fast chemical reactions (including photochemistry, oxidation, and aerosol formation) that are radically different from the background ambient air, and even from the area near the emission source and inside the extended plume, due to the thermo-dynamical differences in these volcanic environments, increase the uncertainty in the numerical models in this case. Besides, meteorological parameters such as temperature, relative humidity, and wind speed and direction directly affect the dispersion, transportation, and dilution of volcanic plumes [127], which could also have affected the final results. Any improvement in the performance of the current numerical models at local, regional, and global scales helps us to increase the reliability of the prediction of climatic effects of volcanic eruptions or passive degassing.
The observations acquired during the STRAP campaign at Mount Etna and a modified version of the WRF-Chem model with 12 bins (1 nm–10 µm) allows the simulation of ultra-fine particles and a numerical assessment of the formation and evolution of newly-formed particles in passive volcanic plumes. The main objectives of this study were to simulate the spatiotemporal evolution of the volcanic plume using high-resolution simulations with a coupled meteorological/chemical numerical model (WRF-Chem) and, more specifically, to evaluate the impact of a new parameterization for nucleation on the prediction of particle concentrations in different size ranges. For this purpose, two simulations, including the activation nucleation rate of 2.0 × 10⁻⁶ × (H2SO4) (named S1) and the newly derived parameterization of 1.844 × 10⁻⁸ × (H2SO4)1.12 (named S2) were performed.
Our results illustrate the suitable ability of the modified WRF-Chem model to simulate new nucleated particles with diameters less than 10 nm through the gas-to-particle nucleation process inside a dense volcanic plume with high concentrations of SO2 and sulfuric acid and their subsequent evolution. A comparison of the results obtained from S1 and S2 showed that the new parameterization for nucleation improved the performance of the WRF-Chem model in the prediction of newly-formed 2.5–10 nm particles and their growth to 10–100 nm by reducing the rate of nucleation compared to the activation parameterization. Nevertheless, due to the absence of volcanic and non-volcanic sources for primary CCN-sized particles (with diameters greater than 100 nm) in the model and the necessary time for the growth of these particles from newly-formed particles, the number concentrations of these particles are underestimated in both simulations, and it was not possible to truly validate the results against the available measurements in this case. However, tracking the size evolution of volcanic particles along the simulated passive plume shows that newly nucleated particles can grow into CCNs over time and relatively far from the vent (more than 100 km), with possible climatic effects due to the participation in cloud formation processes. Generally, the prediction of particle evolution in a passive volcanic plume with the WRF-Chem model and the new parameterization is reliable whenever simulations result in acceptable estimations of SO2 and sulfuric acid in the first place. This demonstrates that the accuracy of the emission mass flux of SO2 and other reactive chemical species is a substantial step in volcanic numerical simulations.
The results reported in this study can be used for similar studies in the future to understand the processes involved in volcanic plume dispersion, downwind particle formation and evolution, and the possible impact of volcanic emissions on local and regional climate more comprehensively. Considering the spatiotemporal limitations of aircraft measurements in such harsh environments, and the high-temperature region of the plume near the vent, which is difficult to observe through field measurements, using mesoscale models makes it possible to reconstruct and assess these processes for desired long-term periods, close or far from the vent. It should be mentioned here that deficiencies in the empirical nucleation schemes need to be considered before the implementation of the NPN in numerical models for other studies. Very fast rates of nucleation in most parts of the troposphere (and the overestimation of particles) are reported for similar empirical parameterizations (for example J = 3.5 × 10⁻⁷ × (H2SO4) and J = 5.5 × 10⁻¹⁴ × (H2SO4)2), with the main reason for this overprediction being suspected to be the effect of temperature, which is not considered in these empirical formulas [128]. Since current simulations are performed in the same period in which the NPN was derived from observations and at the same location (Mount Etna), they did not include the possible impact of temperature, but this issue needs to be considered when using the NPN in other cases.
The effect of volcanic emissions on CCN numbers, clouds’ microphysical properties, and the mechanism of aerosol–cloud interactions during degassing volcanic events are investigated in several studies through different methods, such as atmospheric modeling, satellite retrievals, and reanalysis products [49,129,130,131,132,133]. As explained in detail earlier in this paper, while there was clear evidence of new particle formation in passive and active volcanic plumes, and their impact on the number of CCN particles was investigated to some extent, this process was not comprehensively documented from a numerical perspective. The main reason for this is that the nucleation process for reproducing new ultra-fine particles and their early growth is not well validated against real data in a volcanic environment. In this work, we tried to suggest the most appropriate nucleation scheme for these processes in a volcanic environment that will be used in future studies to evaluate the influence of newly formed and grown-up volcanic particles on cloud formation and properties.
Supplementary Materials
The following are available online at https://www.mdpi.com/article/10.3390/atmos13010015/s1. Figure S1. Spatiotemporal comparison of observed (OBS) and simulated ozone concentrations in simulations S1 and S2. Figure S2. Spatiotemporal comparison of the calculated condensational sink (CS (S−1)) from observations (OBS) and simulation S2 (following the approach of [134]).
Author Contributions
Supervision, C.P., C.R. and K.S.; conceptualization and methodology, C.P., C.R., K.S., M.G. and A.L.; software, S.B., A.L. and S.A.; formal analysis, validation, investigation, writing—original draft preparation, S.A. The final manuscript was edited, reviewed, and given approval by all the authors. All authors have read and agreed to the published version of the manuscript.
Funding
This research was funded by ClerVolc Project-Programme 1, “Detection and characterization of volcanic plumes and ash clouds”, funded by the French government’s “Laboratory of Excellence” initiative no. ANR-10-LABX-0006 and the Region Auvergne. This is Laboratory of Excellence ClerVolc contribution number no. 515.
Institutional Review Board Statement
Not applicable.
Informed Consent Statement
Not applicable.
Data Availability Statement
See the Acknowledgments section.
Acknowledgments
The lead author and this work were funded by ClerVolc Project-Programme 1, “Detection and characterization of volcanic plumes and ash clouds”, funded by the French government’s “Laboratory of Excellence” initiative no. ANR-10-LABX-0006 and the Region Auvergne. This is Laboratory of Excellence ClerVolc contribution number no. 515. The aircraft measurements were carried out within the CLerVolc and STRAP (Synergie Transdisciplinaire pour Répondre aux Aléas liés aux Panaches volcaniques) projects thanks to the SAFIRE facilities in the period of 15 and 16 June 2016 over Etna and Stromboli volcanoes, and this database is available on the STRAP website (http://osur.univ-reunion.fr/recherche/strap/database/, accessed on 13 January 2021). We thank all the people who contributed to the measurements and/or pre-processing of the data and M. Sahyoun for the modelling feasibility study. We acknowledge the use of MOZART-4 global model outputs available at https://www.acom.ucar.edu/wrf-chem/mozart.shtml (accessed on 15 December 2020) and the use of the WRF-Chem preprocessor tool mozbc provided by the Atmospheric Chemistry Observations and Modeling Lab (ACOM) of NCAR. This work was granted access to the HPC/AI resources of CINES under the allocation 2020- A0090111919.
Conflicts of Interest
The authors declare no conflict of interest.
References
- Kerminen, V.M.; Chen, X.; Vakkari, V.; Petj, T.; Kulmala, M.; Bianchi, F. Atmospheric new particle formation and growth: Review of field observation. Environ. Res. Lett. 2018, 13, 103003. [Google Scholar] [CrossRef] [Green Version]
- Tsigaridis, K.; Krol, M.; Dentener, F.J.; Balkanski, Y.; Lathière, J.; Metzger, S.; Hauglustaine, D.A.; Kanakidou, M. Change in global aerosol composition since preindustrial times. Atmos. Chem. Phys. 2006, 6, 5143–5162. [Google Scholar] [CrossRef] [Green Version]
- Hobbs, P.V. Introduction to Atmospheric Chemistry; Cambridge University Press: Cambridge, UK, 2000. [Google Scholar]
- Intergovernmental Panel on Climate Change (IPCC). Climate Change 2001: The Scientific Basis. Contribution of Working Group I to the Third Assessment Report of the Intergovernmental Panel on Climate Change; Houghton, J.T., Ding, Y., Griggs, D.J., Noguer, M., Linden, P.J., Dai, X., Maskell, K., Johnson, C.A., Eds.; Cambridge University Press: New York, NY, USA, 2001. [Google Scholar]
- Benkovitz, C.M.; Berkowitz, C.M.; Easter, R.C.; Nemesure, S.; Wagener, R.; Schwartz, S.E. Sulfate over the North Atlantic and adjacent continental regions: Evaluation for October and November 1986 using a three-dimensional model driven by observation-derived meteorology. J. Geophys. Res. 1994, 99, 20725–20756. [Google Scholar] [CrossRef]
- Tomasi, C.; Fuzzi, S.; Kokhanovsky, A. Atmospheric Aerosols: Life Cycles and Effects on Air Quality and Climate; Wiley: Hoboken, NJ, USA, 2017. [Google Scholar]
- McCormick, M.P.; Thomason, L.W.; Trepte, C.R. Atmospheric effects of the Mt Pinatubo eruption. Nature 1995, 373, 399–404. [Google Scholar] [CrossRef]
- Rizza, U.; Brega, E.; Teresa, M.; Castorina, G.; Morichetti, M.; Munaò, G.; Passerini, G.; Magazù, S. Analysis of the ETNA 2015 Eruption Using WRF–Chem Model and Satellite Observations. Atmosphere 2020, 11, 1168. [Google Scholar] [CrossRef]
- Barbet, C.; Deguillaume, L.; Chaumerliac, N.; Leriche, M.; Freney, E.; Colomb, A.; Sellegri, K.; Patryl, L.; Armand, P. Evaluation of Aerosol Chemical Composition Simulations by the WRF-Chem Model at the Puy de Dôme Station (France). Aerosol Air Qual. Res. 2016, 16, 909–917. [Google Scholar] [CrossRef] [Green Version]
- Lohmann, U.; Feichter, J. Global indirect aerosol effects: A review. Atmos. Chem. Phys. 2005, 5, 715–737. [Google Scholar] [CrossRef] [Green Version]
- Pauli Paasonen, P.; Asmi, A.; Petäjä, T.; Kajos, M.K.; Äijälä, M.; Junninen, H.; Holst, T.; Abbatt, J.P.D.; Arneth, A.; Birmili, W.; et al. Warming-induced increase in aerosol number concentration likely to moderate climate change. Nat. Geosci. 2013, 6, 438–442. [Google Scholar] [CrossRef]
- Twomey, S. Influence of pollution on shortwave Albedo of clouds. J. Atmos. Sci. 1977, 34, 1149–1152. [Google Scholar] [CrossRef] [Green Version]
- Bangert, M.; Kottmeier, C.; Vogel, B.; Vogel, H. Regional scale effects of the aerosol cloud interaction simulated with an online coupled comprehensive chemistry model. Atmos. Chem. Phys. 2011, 11, 4411–4423. [Google Scholar] [CrossRef] [Green Version]
- Allen, R.J.; Sherwood, S.C. Aerosol-cloud semi-direct effect and land-sea temperature contrast in a GCM. Geophys. Res. Lett. 2010, 37, L07702. [Google Scholar] [CrossRef] [Green Version]
- Glasow, R.V.; Bobrowski, N.; Kern, C. The effects of volcanic eruptions on atmospheric chemistry. Chem. Geol. 2009, 263, 131–142. [Google Scholar] [CrossRef]
- Kulmala, M.; Kerminen, V.-M. On the formation and growth of atmospheric nanoparticles. Atmos. Res. 2008, 90, 132–150. [Google Scholar] [CrossRef]
- Kulmala, M.; Pirjola, L.; Mäkelä, J. Stable sulphate clusters as a source of new atmospheric particles. Nature 2000, 404, 66–69. [Google Scholar] [CrossRef]
- Merikanto, J.; Spracklen, D.V.; Pringle, K.J.; Carslaw, K.S. Effects of boundary layer particle formation on cloud droplet number and changes in cloud albedo from 1850 to 2000. Atmos. Chem. Phys. 2010, 10, 695–705. [Google Scholar] [CrossRef] [Green Version]
- Rose, C.; Sellegri, K.; Moreno, I.; Velarde, F.; Ramonet, M.; Weinhold, K.; Krejci, R.; Andrade, M.; Wiedensohler, A.; Ginot, P.; et al. CCN production by new particle formation in the free troposphere. Atmos. Chem. Phys. 2017, 17, 1529–1541. [Google Scholar] [CrossRef] [Green Version]
- Yue, D.L.; Hu, M.; Zhang, R.Y.; Wu, Z.J.; Su, H.; Wang, Z.B.; Peng, J.F.; He, L.Y.; Huang, X.F.; Gong, Y.G.; et al. Potential contribution of new particle formation to cloud condensation nuclei in Beijing. Atmos. Environ. 2011, 45, 6070–6077. [Google Scholar] [CrossRef]
- Dong, C.; Matsui, H.; Spak, S.; Kalafut-Pettibone, A.; Stanier, C. Impacts of New Particle Formation on Short-term Meteorology and Air Quality as Determined by the NPF-explicit WRF-Chem in the Midwestern United States. Aerosol. Air Qual. Res. 2019, 19, 204–220. [Google Scholar] [CrossRef]
- Brock, C.A.; Washenfelder, R.A.; Trainer, M.; Ryerson, T.B.; Wilson, J.C.; Reeves, J.M.; Huey, L.G.; Holloway, J.S.; Parrish, D.D.; Hübler, G.; et al. Particle growth in the plumes of coal fired power plants. J. Geophys. Res. 2002, 107, AAC-9. [Google Scholar] [CrossRef]
- Weber, R.J.; Lee, S.; Chen, G.; Wang, B.; Kapustin, V.; Moore, K.; Clarke, A.D.; Mauldin, L.; Kosciuch, E.; Cantrell, C.; et al. New particle formation in anthropogenic plumes advecting from Asia observed during TRACE-P. J. Geophys. Res. Atmos. 2003, 108, 8814. [Google Scholar] [CrossRef] [Green Version]
- Grell, G.A.; Peckham, S.E.; Schmitz, R.; McKeen, S.A.; Frost, G.; Skamarock, W.C.; Eder, B. Fully coupled “online” chemistry within the WRF model. Atmos. Environ. 2005, 39, 6957–6975. [Google Scholar] [CrossRef]
- Matsui, H.; Koike, M.; Kondo, Y.; Takegawa, N.; Wiedensohler, A.; Fast, J.D.; Zaveri, R.A. Impact of new particle formation on the concentrations of aerosols and cloud condensation nuclei around Beijing. J. Geophys. Res. 2011, 116, D19208. [Google Scholar] [CrossRef]
- Lupascu, A.; Easter, R.; Zaveri, R.; Shrivastava, M.; Pekour, M.; Tomlinson, J.; Yang, Q.; Matsui, H.; Hodzic, A.; Zhang, Q.; et al. Modeling particle nucleation and growth over northern California during the 2010 CARES campaign. Atmos. Chem. Phys. 2015, 15, 12283–12313. [Google Scholar] [CrossRef] [Green Version]
- Matsui, H.; Koike, M.; Takegawa, N.; Kondo, Y.; Takami, A.; Takamura, T.; Yoon, S.; Kim, S.-W.; Lim, H.-C.; Fast, J.D. Spatial and temporal variations of new particle formation in East Asia using an NPF-explicit WRF-chem model: North-south contrast in new particle formation frequency. J. Geophys. Res. Atmos. 2013, 118, 11647–11663. [Google Scholar] [CrossRef]
- Kirkby, J.; Curtius, J.; Almeida, J.; Dunne, E.; Duplissy, J.; Ehrhart, S.; Franchin, A.; Gagné, S.; Ickes, L.; Kürten, A.; et al. Role of sulphuric acid, ammonia and galactic cosmic rays in atmospheric aerosol nucleation. Nature 2011, 476, 429–435. [Google Scholar] [CrossRef] [PubMed]
- Xiao, M.; Hoyle, C.R.; Dada, L.; Stolzenburg, D.; Kürten, A.; Wang, M.; Lamkaddam, H.; Garmash, O.; Mentler, B.; Molteni, U.; et al. The driving factors of new particle formation and growth in the polluted boundary layer. Atmos. Chem. Phys. 2021, 21, 14275–14291. [Google Scholar] [CrossRef]
- Mather, T.A.; Pyle, D.M.; Oppenheimer, C. Tropospheric Volcanic Aerosol. In Volcanism and the Earth’s Atmosphere; American Geophysical Union: Washington, DC, USA, 2003. [Google Scholar] [CrossRef] [Green Version]
- Surl, L. Modelling the Atmospheric Chemistry of Volcanic Plumes. Ph.D. Thesis, University of East Anglia, Norwich, UK, 2016. [Google Scholar]
- Zelenski, M.; Taran, Y.; Galle, B. High emission rate of sulfuric acid from Bezymianny volcano, Kamchatka. Geophys. Res. Lett. 2015, 42, 7005–7013. [Google Scholar] [CrossRef] [Green Version]
- Roberts, T.; Dayma, G.; Oppenheimer, C. Reaction Rates Control High-Temperature Chemistry of Volcanic Gases in Air. Front. Earth Sci. 2019, 7, 154. [Google Scholar] [CrossRef] [Green Version]
- Tulet, P.; Muro, A.D.; Colomb, A.; Denjean, C.; Duflot, V.; Arellano, S.; Foucart, B.; Brioude, J.; Sellegri, K.; Peltier, A.; Aiuppa, A. First results of the Piton de la Fournaise STRAP 2015 experiment: Multidisciplinary tracking of a volcanic gas and aerosol plume. Atmos. Chem. Phys. 2017, 17, 5355–5378. [Google Scholar] [CrossRef] [Green Version]
- Kroll, J.H.; Cross, E.S.; Hunter, J.F.; Pai, S.; Wallace, L.M.M.; Croteau, P.L.; Wallace, L.M.M.; Croteau, P.L.; Jayne, J.T.; Worsnop, D.R.; et al. Atmospheric evolution of sulfur emissions from Kı̅lauea: Real-time measurements of oxidation, dilution, and neutralization within a volcanic plume. Environ. Sci. Technol. 2015, 49, 4129–4137. [Google Scholar] [CrossRef]
- Mather, T.A. Volcanoes and the environment: Lessons for understanding Earth’s past and future from studies of present-day volcanic emissions. J. Volcanol. Geotherm. Res. 2015, 304, 160–179. [Google Scholar] [CrossRef] [Green Version]
- Sahyoun, M.; Freney, E.; Brito, J.; Duplissy, J.; Gouhier, M.; Colomb, A.; Dupuy, R.; Bourianne, T.; Nowak, J.B.; Yan, C.; et al. Evidence of new particle formation within Etna and Stromboli volcanic plumes and its parametrization from airborne in-situ measurements. J. Geophys. Res. Atmos. 2019, 124, 5650–5668. [Google Scholar] [CrossRef] [Green Version]
- Du, H.; Yu, F. Microphysical Modeling of New Particle Formation and Growth in Tropospheric Volcanic Plumes. In Proceedings of the American Geophysical Union, Fall Meeting, San Francisco, CA, USA, 10–14 December 2007. Abstract id. A13A-0882. [Google Scholar]
- Boulon, J.; Sellegri, K.; Hervo, M.; Laj, P. Observations of nucleation of new particles in a volcanic plume. Proc. Natl. Acad. Sci. USA 2011, 108, 12223–12226. [Google Scholar] [CrossRef] [Green Version]
- Foucart, B.; Sellegri, K.; Tulet, P. New Particle Formation (NPF) within the volcanic plume of Piton de la Fournaise at Maïdo observatory (21.1° S 55.4° E), on La Réunion Island. In Proceedings of the Geophysical Research Abstracts (EGU General Assembly 2017), Vienna, Austria, 23–28 April 2017; Volume 19. [Google Scholar]
- Boulon, J.; Sellegri, K.; Hervo, M.; Picard, D.; Pichon, J.-M.; Fréville, P.; Laj, P. Investigation of nucleation events vertical extent: A long-term study at two different altitude sites. Atmos. Chem. Phys. 2011, 11, 5625–5639. [Google Scholar] [CrossRef] [Green Version]
- Rose, C.; Foucart, B.; Picard, D.; Colomb, A.; Metzger, J.-M.; Tulet, P.; Sellegri, K. New particle formation in the volcanic eruption plume of the Piton de la Fournaise: Specific features from a long-term dataset. Atmos. Chem. Phys. 2019, 19, 13243–13265. [Google Scholar] [CrossRef] [Green Version]
- Bianchi, F.; Aliaga, D.; Zha, Q.; Heikkinen, L.; Andrade, M.; Kulmala, M.T.; Mohr, C. The influence of volcano activity on new particle formation over the Andes. In Proceedings of the American Geophysical Union, Fall Meeting, San Francisco, CA, USA, 9–13 December 2019; Volume 2019. [Google Scholar]
- Spracklen, D.V.; Pringle, K.J.; Carslaw, K.S.; Chipperfield, M.P.; Mann, G.W. A global off-line model of size-resolved aerosol microphysics: I. Model development and prediction of aerosol properties. Atmos. Chem. Phys. 2005, 5, 2227–2252. [Google Scholar] [CrossRef] [Green Version]
- Spracklen, D.V.; Pringle, K.J.; Carslaw, K.S.; Chipperfield, M.P.; Mann, G.W. A global off-line model of size resolved aerosol microphysics: II. Identification of key uncertainties. Atmos. Chem. Phys. 2005, 5, 3233–3250. [Google Scholar] [CrossRef] [Green Version]
- Mann, G.W.; Carslaw, K.S.; Spracklen, D.V.; Ridley, D.A.; Manktelow, P.T.; Chipperfield, M.P.; Pickering, S.J.; Johnson, C.E. Description and evaluation of GLOMAP-mode: A modal global aerosol microphysics model for the UKCA composition-climate model. Geosci. Model. Dev. 2010, 3, 519–551. [Google Scholar] [CrossRef] [Green Version]
- Bellouin, N.; Mann, G.W.; Woodhouse, M.T.; Johnson, C.; Carslaw, K.S.; Dalvi, M. Impact of the modal aerosol scheme GLOMAP-mode on aerosol forcing in the Hadley Centre Global Environmental Model. Atmos. Chem. Phys. 2012, 12, 21437–21479. [Google Scholar] [CrossRef] [Green Version]
- Kulmala, M.; Laaksonen, A.; Pirjola, L. Parameterizations for sulphric acid/water nucleation rates. J. Geophys. Res. Atmos. 1998, 103, 8301–8308. [Google Scholar] [CrossRef] [Green Version]
- Schmidt, A.; Carslaw, K.S.; Mann, G.W.; Rap, A.; Pringle, K.J.; Spracklen, D.V.; Wilson, M.; Forster, P.M. Importance of tropospheric volcanic aerosol for indirect radiative forcing of climate. Atmos. Chem. Phys. 2012, 12, 7321–7339. [Google Scholar] [CrossRef] [Green Version]
- Lac, C.; Chaboureau, J.P.; Masson, V.; Pinty, J.P.; Tulet, P.; Escobar, J.; Leriche, M.; Barthe, C.; Aouizerats, B.; Augros, C.; Aumond, P. Overview of the Meso-NH model version 5.4 and its applications. Geosci. Model. Dev. 2018, 11, 1929–1969. [Google Scholar] [CrossRef] [Green Version]
- Maattanen, A.; Merikanto, J.; Henschel, H.; Duplissy, J.; Makkonen, R.; Ortega, I.K.; Vehkamki, H. New parameterizations for neutral and ion-induced sulfuric acid-water particle formation in nucleation and kinetic regimes. J. Geophys. Res. Atmos. 2018, 123, 1269–1296. [Google Scholar] [CrossRef]
- Pianezze, J.; Tulet, P.; Foucart, B.; Leriche, M.; Liuzzo, M.; Salerno, G.; Colomb, A.; Freney, E.; Sellegri, K. Volcanic plume aging during passive degassing and low eruptive events of Etna and Stromboli volcanoes. J. Geophys. Res. Atmos. 2019, 124, 11389–11405. [Google Scholar] [CrossRef]
- Wexler, A.S.; Lurmann, F.W.; Seinfeld, J.H. Modelling urban and regional aerosols-I. Model development. Atmos. Environ. 1994, 28, 531–546. [Google Scholar] [CrossRef]
- Napari, I.; Noppel, M.; Vehkama¨ki, H.; Kulmala, M. Parametrization of ternary nucleation rates for H2SO4-NH3-H2O vapors. J. Geophys. Res. 2002, 107, 4381. [Google Scholar] [CrossRef]
- Napari, I.; Noppel, M.; Vehkama¨ki, H.; Kulmala, M. An improved model for ternary nucleation of sulfuric acid-ammonia-water. J. Chem. Phys. 2002, 116, 4221–4227. [Google Scholar] [CrossRef]
- Cai, C.; Zhang, X.; Wang, K.; Zhang, Y.; Wang, L.; Zhang, Q.; Duan, F.; He, K.; Yu, S.-C. Incorporation of new particle formation and early growth treatments into WRF/Chem: Model improvement, evaluation, and impacts of anthropogenic aerosols over East Asia. Atmos. Environ. 2016, 124, 262–284. [Google Scholar] [CrossRef] [Green Version]
- Zhang, R.; Khalizov, A.; Wang, L.; Hu, M.; Xu, W. Nucleation and growth of nanoparticles in the atmosphere. Chem. Rev. 2012, 112, 957–2011. [Google Scholar] [CrossRef]
- Wang, M.; Penner, J.E. Aerosol indirect forcing in a global model with particle nucleation. Atmos. Chem. Phys. 2009, 9, 239–260. [Google Scholar] [CrossRef] [Green Version]
- Collins, W.D.; Rasch, P.J.; Boville, B.A.; Hack, J.J.; McCaa, J.R.; Williamson, D.L.; Briegleb, B.P.; Bitz, C.M.; Lin, S.J.; Zhang, M.H. The formulation and atmospheric simulation of the community atmosphere model version 3 (cam3). J. Clim. 2006, 19, 2144–2161. [Google Scholar] [CrossRef] [Green Version]
- Liu, X.H.; Penner, J.E.; Herzog, M. Global modeling of aerosol dynamics: Model description, evaluation, and interactions between sulfate and nonsulfate aerosols. J. Geophys. Res. 2005, 110, D18206. [Google Scholar] [CrossRef] [Green Version]
- Spracklen, D.V.; Carslaw, K.S.; Merikanto, J.; Mann, G.W.; Reddington, C.L.; Pickering, S.; Ogren, J.A.; Andrews, E.; Baltensperger, U.; Weingartner, E.; et al. Explaining global surface aerosol number concentrations in terms of primary emissions and particle formation. Atmos. Chem. Phys. 2010, 10, 4775–4793. [Google Scholar] [CrossRef] [Green Version]
- Makkonen, R.; Asmi, A.; Korhonen, H.; Kokkola, H.; Jarvenoja, S.; Räisänen, P.; Lehtinen, K.E.J.; Laaksonen, A.; Kerminen, V.-M.; Jarvinen, H.; et al. Sensitivity of aerosol concentrations and cloud properties to nucleation and secondary organic distribution in ECHAM5-HAM global circulation model. Atmos. Chem. Phys. 2009, 9, 1747–1766. [Google Scholar] [CrossRef] [Green Version]
- Westervelt, D.M.; Pierce, J.R.; Riipinen, I.; Trivitayanurak, W.; Hamed, A.; Kulmala, M.; Laaksonen, A.; Decesari, S.; Adams, P.J. Formation and growth of nucleated particles into cloud condensation nuclei: Model–measurement comparison. Atmos. Chem. Phys. 2013, 13, 7645–7663. [Google Scholar] [CrossRef] [Green Version]
- Kulmala, M.; Lehtinen, K.E.J.; Laaksonen, A. Cluster activation theory as an explanation of the linear dependence between formation rate of 3 nm particles and sulphuric acid concentration. Atmos. Chem. Phys. 2006, 6, 787–793. [Google Scholar] [CrossRef] [Green Version]
- Sihto, S.-L.; Kulmala, M.; Kerminen, V.-M.; Dal Maso, M.; Petäjä, T.; Riipinen, I.; Korhonen, H.; Arnold, F.; Janson, R.; Boy, M.; et al. Atmospheric sulphuric acid and aerosol formation: Implications from atmospheric measurements for nucleation and early growth mechanisms. Atmos. Chem. Phys. 2006, 6, 4079–4091. [Google Scholar] [CrossRef] [Green Version]
- Kuang, C.; McMurry, P.H.; McCormick, A.V.; Eisele, F.L. Dependence of nucleation rates on sulfuric acid vapor concentration in diverse atmospheric locations. J. Geophys. Res. Atmos. 2008, 113. [Google Scholar] [CrossRef]
- Wang, X.; Boselli, A.; D’Avino, L.; Pisani, G.; Spinelli, N.; Amodeo, A.; Chaikovsky, A.; Wiegner, M.; Nickovic, S.; Papayannis, A.; et al. Volcanic dust characterization by EARLINET during Etna’s eruptions in 2001–2002. Atmos. Environ. 2008, 42, 893–905. [Google Scholar] [CrossRef]
- Diehl, T.; Heil, A.; Chin, M.; Pan, X.; Streets, D.; Schultz, M.; Kinne, S. Anthropogenic, biomass burning, and volcanic emissions of black carbon, organic carbon, and SO2 from 1980 to 2010 for hindcast model experiments. Atmos. Chem. Phys. 2012, 12, 24895–24954. [Google Scholar] [CrossRef] [Green Version]
- Tanguy, J.C.; Condomines, M.; Le Goff, M.; Chillemi, V.; La Delfa, S.; Patanè, G. Mount Etna eruptions of the last 2750 years: Revised chronology and location through archeomagnetic and 226Ra-230Th dating. Bull. Volcanol. 2007, 70, 55–83. [Google Scholar] [CrossRef]
- Calvari, S.; Salerno, G.G.; Spampinato, L.; Gouhier, M.; la Spina, A.; Pecora, E.; Harris, A.J.L.; Labazuy, E.; Boschi, B.E. An unloading foam model to constrain Etna’s 11–13 January 2011 lava fountaining episode. J. Geophys. Res. 2011, 116, B11207. [Google Scholar] [CrossRef]
- Kupc, A.; Bischof, O.; Tritscher, T.; Beeston, M.; Krinke, T.; Wagner, P.E. Laboratory Characterization of a New Nano-Water- Based CPC 3788 and Performance Comparison to an Ultrafine Butanol-Based CPC 3776 Laboratory Characterization of a New Nano-Water-Based CPC 3788 and Performance Comparison to an Ultrafine Butanol-Based CPC 3. Aerosol Sci. Technol. 2013, 47, 183–191. [Google Scholar] [CrossRef]
- Weigel, R.; Hermann, M.; Curtius, J.; Voigt, C.; Walter, S.; Böttger, T.; Lepukhov, B.; Belyaev, G.; Borrmann, S. Experimental characterization of the COndensation PArticle counting System for high altitude aircraft-borne application. Atmos. Meas. Tec. 2009, 2, 243–258. [Google Scholar] [CrossRef] [Green Version]
- Junninen, H.; Ehn, M.; Petäjä, T.; Luosujärvi, L.; Kotiaho, T.; Kostiainen, R.; Rohner, U.; Gonin, M.; Fuhrer, K.; Kulmala, M.; et al. A high-resolution mass spectrometer to measure atmospheric ion composition. Atmos. Meas. Tech. 2010, 3, 1039–1053. [Google Scholar] [CrossRef] [Green Version]
- Copernicus Climate Change Service (C3S): ERA5: Fifth Generation of ECMWF Atmospheric Reanalyses of the Global Climate. Copernicus Climate Change Service Climate Data Store (CDS). 2017. Available online: https://cds.climate.copernicus.eu/cdsapp#!/home (accessed on 10 December 2020).
- Emmons, L.K.; Walters, S.; Hess, P.G.; Lamarque, J.-F.; Pfister, G.G.; Fillmore, D.; Granier, C.; Guenther, A.; Kinnison, D.; Laepple, T.; et al. Description and evaluation of the Model for Ozone and Related chemical Tracers, version 4 (MOZART-4). Geosci. Model. Dev. 2010, 3, 43–67. [Google Scholar] [CrossRef] [Green Version]
- Morrison, H.; Thompson, G.; Tatarskii, V. Impact of cloud microphysics on the development of trailing stratiform precipitation in a simulated squall line: Comparison of one- and two-moment schemes. Mon. Weather Rev. 2009, 137, 991–1007. [Google Scholar] [CrossRef] [Green Version]
- Mlawer, E.J.; Taubman, S.J.; Brown, P.D.; Iacono, M.J.; Clough, S.A. Radiative transfer for inhomogeneous atmospheres: RRTM, a validated correlated-k model for the longwave. J. Geophys. Res. 1997, 102, 16663–16682. [Google Scholar] [CrossRef] [Green Version]
- Dudhia, J. Numerical Study of Convection Observed during the Winter Monsoon Experiment Using a Mesoscale Two-Dimensional Model. J. Atmos. Sci. 1989, 46, 3077–3107. [Google Scholar] [CrossRef]
- Hong, S.Y.; Yign, N.; Jimy, D. A New Vertical Diffusion Package with an Explicit Treatment of Entrainment Processes. Mon. Weather Rev. 2006, 134, 2318–2341. [Google Scholar] [CrossRef] [Green Version]
- Chen, F.; Dudhia, J. Coupling an advanced land-surface/ hydrology model with the Penn State/NCAR MM5 modeling system. Part I: Model description and implementation. Mon. Weather Rev. 2001, 129, 569–585. [Google Scholar] [CrossRef] [Green Version]
- Jiménez, P.A.; Dudhia, J.I. Improving the representation of resolved and unresolved topographic effects on surface wind in the WRF model. J. Appl. Meteorol. Climatol. 2012, 51, 300–316. [Google Scholar] [CrossRef] [Green Version]
- Kain, S. The Kain–Fritsch Convective Parameterization: An Update. J. Appl. Meteorol. 2004, 43, 170–181. [Google Scholar] [CrossRef] [Green Version]
- Carter, W. A Detailed Mechanism for the Gas-Phase Atmospheric Reactions of Organic Compounds. Atmos. Environ. 1990, 24, 481–518. [Google Scholar] [CrossRef]
- Madronich, S. Photo dissociation in the atmosphere: 1. Actinic flux and the effect of ground reflections and clouds. J. Geophys. Res. 1987, 92, 9740–9752. [Google Scholar] [CrossRef]
- Stuefer, M.; Freitas, S.R.; Grell, G.; Webley, P.; Peckham, S.; McKeen, S.A.; Egan, S.D. Inclusion of ash and SO2 emissions from volcanic eruptions in WRF-Chem: Development and some applications. Geosci. Model. Dev. 2013, 6, 457–468. [Google Scholar] [CrossRef] [Green Version]
- Egan, S.D.; Stuefer, M.; Webley, P.W.; Cahill, C.F. WRF-Chem modeling of sulfur dioxide emissions from the 2008 Kasatochi Volcano. Ann. Geophys. 2014, 57, 1–6. [Google Scholar] [CrossRef]
- Egan, S.D.; Stuefer, M.; Webley, P.W.; Lopez, T.; Cahill, C.F.; Hirtl, M. Modeling volcanic ash aggregation processes and related impacts on the April–May 2010 eruptions of Eyjafjallajökull volcano with WRF-Chem. Nat. Hazards Earth Syst. Sci. 2020, 20, 2721–2737. [Google Scholar] [CrossRef]
- Hirtl, M.; Scherllin-Pirscher, B.; Stuefer, M.; Arnold, D.; Baro, R.; Maurer, C.; Mulder, M.D. Extension of the WRF-Chem volcanic emission preprocessor to integrate complex source terms and evaluation for different emission scenarios of the Grimsvötn 2011 eruption. Nat. Hazards Earth Syst. Sci. 2020, 20, 3099–3115. [Google Scholar] [CrossRef]
- Hirtl, M.; Stuefer, M.M.; Arnold, D.; Grell, G.; Maurer, C.; Natali, S.; Scherllin-Pisher, B.; Webley, P. The effects of simulating volcanic aerosol radiative feedbacks with WRF-Chem during the Eyjafjallajökull eruption, April and May 2010. Atmos. Environ. 2019, 198, 194–206. [Google Scholar] [CrossRef]
- Steensen, T.; Stuefer, M.; Webley, P.; Grell, G.; Freitas, S. Qualitative comparison of Mount Redoubt 2009 volcanic clouds using the PUFF and WRF-Chem dispersion models and satellite remote sensing data. J. Volcanol. Geotherm. Res. 2013, 259, 235–247. [Google Scholar] [CrossRef]
- Georgiou, G.K.; Christoudias, T.; Proestos, Y.; Kushta, J.; Hadjinicolaou, P.; Lelieveld, J. Air quality modelling in the summer over the eastern Mediterranean using WRF-Chem: Chemistry and aerosol mechanism intercomparison. Atmos. Chem. Phys. 2018, 18, 1555–1571. [Google Scholar] [CrossRef] [Green Version]
- Mastin, L.G.; Guffanti, M.; Servranckx, R.; Webley, P.; Barsotti, S.; Dean, K.; Durant, A.; Ewert, J.W.; Neri, A.; Rose, W.I.; Schneider, D. A multidisciplinary effort to assign realistic source parameters to models of volcanic ash-cloud transport and dispersion during eruptions. J. Volcanol. Geotherm. Res. 2009, 186, 10–21. [Google Scholar] [CrossRef]
- Aiuppa, A.; Giudice, G.; Gurrieri, S.; Liuzzo, M.; Burton, M.; Caltabiano, T.; McGonigle, A.J.S.; Salerno, H.; Shinohara, H.; Valenza, M. Total volatile flux from Mount Etna. J. Geophys. Res. 2008, 35, 12809–12819. [Google Scholar] [CrossRef]
- Roberts, T.J.; Vignelles, D.; Liuzzo, M.; Giudice, G.; Aiuppa, A.; Coltelli, M.; Salerno, G.; Chartier, M.; Coute, B.; Berthet, G.; et al. The primary volcanic aerosol emission from Mt Etna: Size-resolved particles with SO2 and role in plume reactive halogen chemistry. Geochim. Cosmochim. Acta. 2018, 222, 74–93. [Google Scholar] [CrossRef] [Green Version]
- Zaveri, R.A.; Easter, R.C.; Fast, J.D.; Peters, L.K. Model for Simulating Aerosol Interactions and Chemistry (MOSAIC). J. Geophys. Res. Atmos. 2008, 113. [Google Scholar] [CrossRef]
- Shrivastava, M.; Fast, J.; Easter, R.; Gustafson, W.I.; Zaveri, R.A.; Jimenez, J.L.; Saide, P.; Hodzic, A. Modeling s in a megacity: Comparison of simple and complex representations of the volatility basis set approach. Atmos. Chem. Phys. 2011, 11, 6639–6662. [Google Scholar] [CrossRef] [Green Version]
- Shrivastava, M.; Easter, R.C.; Liu, X.; Zelenyuk, A.; Singh, B.; Zhang, K.; Ma, P.-L.; Chand, D.; Ghan, S.; Jimenez, J.L.; et al. Global transformation and fate of SOA: Implications of low-volatility SOA and gas-phase fragmentation reactions. J. Geophys. Res. Atmos. 2015, 120, 4169–4195. [Google Scholar] [CrossRef] [Green Version]
- Galeazzo, T.; Bekki, S.; Martin, E.; Savarino, J.; Arnold, S.R. Photochemical box modelling of volcanic SO2 oxidation: Isotopic constraints. Atmos. Chem. Phys. 2018, 18, 17909–17931. [Google Scholar] [CrossRef] [Green Version]
- Berndt, T.; Böge, O.; Stratmann, F.; Heintzenberg, J.; Kulmala, M. Rapid Formation of Sulfuric Acid Particles at Near-Atmospheric Conditions. Science 2005, 307, 698–700. [Google Scholar] [CrossRef]
- Calvert, J.G.; Su, F.; Bottenheim, J.W.; Strausz, O.P. Mechanism of the homogeneous oxidation of sulfur dioxide in the troposphere. Atmos. Environ. 1967, 12, 197–226. [Google Scholar] [CrossRef]
- Chen, Q.; Schmidt, J.A.; Shah, V.; Jaeglé, L.; Sherwen, T.; Alexander, B. Sulfate production by reactive bromine: Implications for the global sulfur and reactive bromine budgets. Geophys. Res. Lett. 2017, 44, 7069–7078. [Google Scholar] [CrossRef] [Green Version]
- Brodowsky, C.V.; Sukhodolov, T.; Feinberg, A.; Höpfner, M.; Peter, M.; Stenke, A.; Rozanov, E. Modeling the Sulfate Aerosol Evolution after Recent Moderate Volcanic Activity, 2008-2012. J. Geophys. Res. Atmos. 2021, 126, e2021JD035472. [Google Scholar] [CrossRef]
- Timmreck, C.; Mann, G.W.; Aquila, V.; Hommel, R.; Lee, L.A.; Schmidt, A.; Brühl, C.; Carn, S.; Chin, M.; Dhomse, S.S.; et al. The Interactive Stratospheric Aerosol Model Intercomparison Project (ISA-MIP): Motivation and experimental design. Geosci. Model. Dev. 2018, 11, 2581–2608. [Google Scholar] [CrossRef] [Green Version]
- Sha, T.; Ma, X.; Jia, H.; Tian, R.; Chang, Y.; Cao, F.; Zhang, Y. Aerosol chemical component: Simulations with WRF-Chem and comparison with observations in Nanjing. Atmos. Environ. 2019, 218, 116982. [Google Scholar] [CrossRef]
- Tuccella, P.; Curci, G.; Visconti, G.; Bessagnet, B.; Menut, L.; Park, R.J. Modeling of gas and aerosol with WRF/Chem over Europe: Evaluation and sensitivity study. J. Geophys. Res. Atmos. 2012, 117. [Google Scholar] [CrossRef] [Green Version]
- Burton, M.R.; Sawyer, G.M.; Granieri, D. Deep Carbon Emissions from Volcanoes. Rev. Mineral. Geochem. 2013, 75, 323–354. [Google Scholar] [CrossRef] [Green Version]
- Aiuppa, A.; Federico, C.; Giudice, G.; Gurrieri, S.; Liuzzo, M.; Shinohara, H.; Favara, R.; Valenza, M. Rates of carbon dioxide plume degassing from Mount Etna volcano. J. Geophys. Res. 2006, 111. [Google Scholar] [CrossRef]
- Aiuppa, A.; Federico, C.; Franco, A.; Giudice, G.; Gurrieri, S.; Inguaggiato, S.; Liuzzo, M.; McGonigle, A.J.S.; Valenza, M. Emission of bromine and iodine from Mount Etna volcano. Geophys. Geosystems. 2005, 6. [Google Scholar] [CrossRef] [Green Version]
- Bobrowski, N.; Hönninger, G.; Galle, B.; Platt, U. Detection of bromine monoxide in a volcanic plume. Nature 2003, 423, 273–276. [Google Scholar] [CrossRef] [PubMed]
- Roberts, T.J.; Martin, R.S.; Jourdain, L. Reactive bromine chemistry in Mount Etna’s volcanic plume: The influence of total Br, high-temperature processing, aerosol loading and plume-air mixing. Atmos. Chem. Phys. 2014, 14, 11201–11219. [Google Scholar] [CrossRef] [Green Version]
- Gutmann, A.; Bobrowski, N.; Roberts, T.J.; Rüdiger, J.; Hoffmann, T. Advances in Bromine Speciation in Volcanic Plumes. Front. Earth Sci. 2018, 6, 213. [Google Scholar] [CrossRef]
- Surl, L.; Roberts, T.J.; Bekki, S. Observation and modelling of ozone-destructive halogen chemistry in a passive degassing volcanic plume. Atmos. Chem. Phys. 2021, 21, 12413–12441. [Google Scholar] [CrossRef]
- Gliß, J.; Bobrowski, N.; Vogel, L.; Pöhler, D.; Platt, U. OClO and BrO observations in the volcanic plume of Mt. Etna—Implications on the chemistry of chlorine and bromine species in volcanic plumes. Atmos. Chem. Phys. 2015, 15, 5659–5681. [Google Scholar] [CrossRef] [Green Version]
- Surl, L.; Donohoue, D.; Aiuppa, A.; Bobrowski, N.; von Glasow, R. Quantification of the depletion of ozone in the plume of Mount Etna. Atmos. Chem. Phys. 2015, 15, 2613–2628. [Google Scholar] [CrossRef] [Green Version]
- Kelly, P.J.; Kern, C.; Roberts, T.J.; Lopez, T.; Werner, C.; Aiuppa, A. Rapid chemical evolution of tropospheric volcanic emissions from Redoubt Volcano, Alaska, based on observations of ozone and halogen containing gases. J. Volcanol Geotherm Res. 2013, 259, 317–333. [Google Scholar] [CrossRef]
- Rinaldi, M.; Emblico, L.; Decesari, S.; Fuzzi, S.; Facchini, M.C.; Librando, V. Chemical Characterization and Source Apportionment of Size-Segregated Aerosol Collected at an Urban Site in Sicily. Water Air Soil Pollut. 2007, 185, 311–321. [Google Scholar] [CrossRef]
- Tomasi, C.; Lupi, A. Primary and Secondary Sources of Atmospheric Aerosol, In Atmospheric Aerosols: Life Cycles and Effects on Air Quality and Climate; Wiley-VCH: Hoboken, NJ, USA, 2016; pp. 1–86. [Google Scholar]
- Berndt, T.; Böge, O.; Stratmann, F. Atmospheric H2SO4/H2O Particle Formation: Mechanistic Investigations, In Nucleation and Atmospheric Aerosols; O’Dowd, C.D., Wagner, P.E., Eds.; Springer: Dordrecht, The Netherlands, 2007. [Google Scholar]
- Weber, R.J.; Chen, G.; Davis, D.D.; Mauldin, R.L.; Tanner, D.J.; Eisele, F.L.; Clarke, A.D.; Thornton, D.C.; Bandy, A.R. Measurements of enhanced H2SO4 and 3–4 nm particles near a frontal cloud during the First Aerosol Characterization Experiment (ACE 1). J. Geophys. Res. Atmos. 2001, 106, 24107–24117. [Google Scholar] [CrossRef]
- Asmi, E.; Freney, E.; Hervo, M.; Picard, D.; Rose, C.; Colomb, A.; Sellegri, K. Aerosol cloud activation in summer and winter at puy-de-Dôme high altitude site in France. Atmos. Chem. Phys. 2012, 12, 11589–11607. [Google Scholar] [CrossRef] [Green Version]
- Schmale, J.; Henning, S.; Decesari, S.; Henzing, B.; Keskinen, H.; Sellegri, K.; Ovadnevaite, J.; Pöhlker, M.L.; Brito, J.; Bougiatioti, A.; et al. Long-term cloud condensation nuclei number concentration, particle number size distribution and chemical composition measurements at regionally representative observatories. Atmos. Chem. Phys. 2018, 18, 2853–2881. [Google Scholar] [CrossRef] [Green Version]
- Kerminen, V.M.; Paramonov, M.; Anttila, T.; Riipinen, I.; Fountoukis, C.; Korhonen, H.; Asmi, E.; Laakso, L.; Lihavainen, H.; Swietlicki, E.; et al. Cloud condensation nuclei production associated with atmospheric nucleation: A synthesis based on existing literature and new results. Atmos. Chem. Phys. 2012, 12, 12037–12059. [Google Scholar] [CrossRef] [Green Version]
- Schmidt, A. Modelling Tropospheric Volcanic Aerosol, From Aerosol Microphysical Processes to Earth System Impacts; Springer: Berlin/Heidelberg, Germany, 2013. [Google Scholar]
- O’Dowd, C.D.; Hoffmann, T. Coastal New Particle Formation: A Review of the Current State-Of-The-Art. Environ. Chem. 2005, 2, 245–255. [Google Scholar] [CrossRef]
- Manktelow, P.T.; Carslaw, K.S.; Mann, G.W.; Spracklen, D.V. Variable CCN formation potential of regional sulfur emissions. Atmos. Chem. Phys. 2009, 9, 3253–3259. [Google Scholar] [CrossRef] [Green Version]
- Tang, Y.; Tong, D.Q.; Yang, K.; Lee, P.; Baker, B.; Crawford, A.; Luke, W.; Stein, A.; Campbell, P.C.; Ring, A.; et al. Air quality impacts of the 2018 Mt. Kilauea Volcano eruption in Hawaii: A regional chemical transport model study with satellite-constrained emissions. Atmos. Environ. 2020, 237, 117648. [Google Scholar] [CrossRef]
- Graf, H.F.; Herzog, M.; Oberhuber, J.M.; Textor, C. Effect of environmental conditions on volcanic plume rise. J. Geophys. Res. 1999, 104, 24309–24320. [Google Scholar] [CrossRef] [Green Version]
- Yu, F.; Luo, G.; Bates, T.S.; Anderson, B.; Clarke, A.; Kapustin, V.; Yantosca, R.M.; Wang, Y.; Wu, S. Spatial distributions of particle number concentrations in the global troposphere: Simulations, observations, and implications for nucleation mechanisms. J. Geophys. Res. 2010, 115, D17205. [Google Scholar] [CrossRef]
- Schmidt, A.; Carslaw, K.; Mann, G.; Merikanto, J. The impact of time-averaged volcanic sulfur emissions on the global cloud condensation nuclei budget in the pre-industrial era. In Proceedings of the EGU General Assembly 2010, Vienna, Austria, 2–7 May 2010. [Google Scholar]
- Breen, K.H.; Barahona, D.; Yuan, T.; Bian, H.; James, S.C. Effect of volcanic emissions on clouds during the 2008 and 2018 Kilauea degassing events. Atmos. Chem. Phys. 2021, 21, 7749–7771. [Google Scholar] [CrossRef]
- Mills, M.J.; Schmidt, A.; Easter, R.; Solomon, S.; Kinnison, D.E.; Ghan, S.J.; Neely, R.R., III; Marsh, D.R.; Conley, A.; Bardeen, G.G.; et al. Global volcanic aerosol properties derived from emissions, 1990–2014, using CESM1(WACCM). J. Geophys. Res. Atmos. 2016, 121, 2332–2348. [Google Scholar] [CrossRef] [Green Version]
- Flower, V.J.; Kahn, R.A. The evolution of icelandic volcano emissions, as observed from space in the era of NASA’s earth observing system (EOS). J. Geophys. Res. Atmos. 2020, 125, e2019JD031625. [Google Scholar] [CrossRef]
- Gassó, S. Satellite observations of the impact of weak volcanic activity on marine clouds. J. Geophys. Res. Atmos. 2008, 113, D14S19. [Google Scholar] [CrossRef] [Green Version]
- Pirjola, L.; Kulmala, M.; Wilck, M.; Bischoff, A.; Strat-mann, F.; Otto, E. Formation of sulphuric acid aerosols and cloud condensation nuclei: An expression for significant nucleation and model comprarison. J. Aerosol Sci. 1999, 30, 1079–1094. [Google Scholar] [CrossRef]
Publisher’s Note: MDPI stays neutral with regard to jurisdictional claims in published maps and institutional affiliations. |
© 2021 by the authors. Licensee MDPI, Basel, Switzerland. This article is an open access article distributed under the terms and conditions of the Creative Commons Attribution (CC BY) license (https://creativecommons.org/licenses/by/4.0/).