Article

Driving Factors of Energy Consumption in the Developed Regions of Developing Countries: A Case of Zhejiang Province, China

1
Zhejiang Energy R&D Institute Co., Ltd., Hangzhou 311121, China
2
School of Management and Economics, Beijing Institute of Technology, Beijing 100089, China
*
Authors to whom correspondence should be addressed.
Atmosphere 2021, 12(9), 1196; https://doi.org/10.3390/atmos12091196
Submission received: 16 July 2021 / Revised: 6 September 2021 / Accepted: 9 September 2021 / Published: 15 September 2021
(This article belongs to the Special Issue Greener Energy, Air Quality, and Carbon Neutrality)

Abstract

:
Regional energy development and approaches are significant for China’s overall economic and social development. The GDP in Zhejiang province surpassed 6 trillion yuan in 2019, and its energy consumption reached 200 million tons of standard coal (tce), both of which are at the forefront of China. In order to explore the main factors of the increase in energy consumption in Zhejiang and provide essential references for energy saving and other provinces, this paper analyzes the total energy consumption and industrial sectors on the basis of the logarithmic mean divisia index (LMDI) model. Study results show that the economy’s scale is the most crucial factor affecting Zhejiang’s energy consumption, with a significant growth effect. In 2015, the scale effect increased energy consumption to the highest value of 14 million tce and then reduced it to 13 million tce in 2019. The impact of the population on energy consumption increased by 10 million tce from 2010 to 2019. Energy intensity reduces energy consumption by between 0.05 and 0.15 billion tce per year, which is the main factor in reducing energy consumption. The energy structure generally plays a weak positive role due to the different energy types. The decomposition of the energy consumption per unit of value added in the industrial sector showed that the intensity and structural effect primarily reduce energy consumption, for example, the metal smelting and rolling, textile printing and paper, electric power, heating, and other industries. According to the results, enterprises should enhance the intelligence and efficiency of dispatch management and emergency responses. Zhejiang should also accelerate an international oil and gas trading center and resource allocation base to reach its carbon-neutrality goal.

1. Introduction

The issue of climate change is an important factor restricting the sustainable development of human society that has attracted widespread global attention [1]. Greenhouse gas emissions, mainly carbon dioxide, are the most important cause of global climate change [2]; burning fossil fuels is the most important source of greenhouse gases. China’s total energy consumption surpassed the EU in 2007 and the United States in 2010, becoming the world’s largest energy consumer [3]. In 2019, global fossil-fuel carbon dioxide emissions reached a record high, about 33 billion tons. China’s greenhouse gas emissions accounted for 27% of global emissions [4]. For the world to achieve the goal of “below 2 °C” in the Paris Agreement, carbon dioxide emissions must be drastically reduced, but increasing emissions make this goal more challenging to achieve [5]. In the general debate of the 75th United Nations General Assembly, Chinese President Xi Jinping stated that China would increase its nationally determined contribution and adopt more effective policies and measures to deal with global warming. China aims to reach a peak with its carbon dioxide emissions before 2030 and to achieve carbon neutrality by 2060.
Zhejiang’s GDP has been in the top 5 in the country for a long time, reaching 62,355 billion yuan in 2019 [6]. However, Zhejiang’s 2000 energy consumption of 65.6 million tce increased to 224 million tce in 2019, which was an average annual increase of 6.7% [7]. As an economically developed province in China, Zhejiang also ranks high in energy China’s consumption. In 2019, Zhejiang’s energy consumption was 224 million tce, which is equivalent to South Korea’s energy consumption and surpassing the UK’s energy consumption. In energy consumption, secondary industries accounted for 68.1%, which is an increase of 0.5% over the previous year, among which manufacturing accounted for approximately 66%. In controlling energy consumption, it can achieve effective emission reduction without having too much negative impact on the economic development of Zhejiang [8]. It is necessary to decompose the factors of energy consumption growth in Zhejiang and simultaneously analyze the industrial sector to find the characteristics of energy consumption and development. On the one hand, analysis can provide practical and theoretical support for the government to transform the existing economic development model and achieve carbon emission reduction targets as soon as possible. On the other hand, it can indicate the direction for future energy-saving work and avoid the negative impact of improper energy-saving work on Zhejiang’s economic development.
In terms of methods, it can be divided into Index Decomposition Analysis (IDA) and Structural Decomposition Analysis (SDA) [9,10]. IDA and SDA are commonly used to study energy and environmental issues [11]. These methods are most widely used to decompose energy consumption and carbon emission factors [12,13]. SDA needs to be based on input–output tables, and China usually compiles input–output tables every five years. The data have a certain lag, which is not conducive to in-depth research [14,15]. Ang (2004) used the LMDI decomposition method based on the IDA method to decompose energy consumption into multiple factors and solved residual items [16]. Therefore, the LMDI method is widely used in the establishment and analysis of energy consumption decomposition models.
A large body of previous studies extensively discussed energy consumption and driving factors from the global [17,18,19,20], national [21,22,23,24,25], industry, or sector [26,27,28,29] perspectives (see Table 1). Ang (2005) uses the LMDI method to decompose energy consumption from a national or regional perspective and found that economic growth was the main positive driving factor for energy consumption [21]. Energy intensity is the main negative driving factor. Ramachandra and Shwetmala (2012) analyzed India’s high energy consumption problem and found that low energy efficiency and inappropriate policies are the main factors for the growth of energy consumption [22]. Chong et al. (2015) used LMDI to analyze coal consumption growth in China from 2001 to 2011 and found that per capita GDP is the most crucial positive driving factor, and the improvement of energy conversion efficiency reduces coal consumption [23]. Shao et al. (2016) used an improved LMDI method to study CO2 emission factors in Shanghai and found that the expansion of the industry scale and economic structure adjustment were the main factors to promote and reduce CO2 emissions [24]. Lin and Xu (2019) decomposed the total US carbon emissions from 1997 to 2016 into six factors. The article found that scale effects (population and income) were the main factors in the growth of carbon emissions, and technological effects were the key driving force for emission reduction [25].
From an industrial or sectoral perspective, Andres and Padilla (2015) studied the factors affecting the Spanish road freight vehicles’ energy intensity trend from 1996 to 2012. They found that changes in energy consumption per kilometer mainly caused the decline in energy intensity [26]. Lin and Long (2016) found that factors such as per capita output and industrial economic scale are the most critical factors affecting carbon emissions in the chemical industry [24]. Kim et al. (2017) studied the influencing factors for energy consumption changes in South Korea’s manufacturing industry from 1991 to 2011. The study found that the scale effect increased energy consumption, while the structure and intensity effects reduce energy consumption [28]. Isik et al. (2020) analyzed the CO2 emissions of the Turkish transportation sector from 2010 to 2017. The article found that economic growth and population were the main factors for energy consumption growth, while fuel substitution and energy intensity positively impacted emissions reduction [29]. Scholars use the LMDI method to study energy consumption growth or carbon emission factors (see Table 1).
The above analysis shows that many studies are conducted on factors of energy consumption changes through different angles and methods in the world. However, there are still some shortcomings: (1) in analyzing countries or regions, some scholars did not provide detailed explanations for high-energy-consuming industries or sectors; (2) research on some provinces in countries such as India and China is not yet sufficient. However, these countries or regions are the main contributors to global energy consumption, and it is necessary to establish a more scientific decomposition model to study the problem.
In this paper, we address the following questions. First, we explore the differences between years and sectors in Zhejiang and identify the main sources of future growth in energy consumption emissions. Second, we recognize the effects of population, economic development, energy mix, and energy intensity on energy consumption and time differences. Lastly, we present the contribution of structural and intensity effects to the change in energy consumption per unit of industrial value added and provide insights on which industries should continue to improve energy efficiency and reduce emissions in an effort to achieve carbon peaking.
The main contributions: (1) Through the LMDI model, the article analyzes the main factors of energy consumption (energy structure, energy intensity, economy, population). At the same time, it studies and analyzes key energy-consuming industries and puts forward energy-saving and emission-reduction suggestions from the overall and sector levels. (2) The article quantifies the driving factors of energy consumption, which is a good reference for other energy-intensive provinces in China and practically meaningful to global development.
This paper also has some limitations. There are some missing economic energy data by industry and industry data to explore the internal linkages between regions and industries in Zhejiang. Therefore, this study can be improved by obtaining more detailed data through extensive surveys and machine learning.

2. Data and Method

2.1. Data

The data sources used in the model mainly include the Zhejiang Statistical Yearbook, the 2017 Zhejiang Input–Output Table (referred to as the 2017 Table), and the Wind database. The industrial sector’s energy consumption data come from the 2015–2019 Zhejiang Province Energy Development Report. Since the energy consumption data of various industries above the designated size in 2020 are not yet released, this article uses trend extrapolation to calculate various industries’ energy consumption data in 2020. The 2017 Zhejiang Input–Output Table and the 2015–2019 Zhejiang Province Energy Development Report have different industry classification calibers. Still, the difference is slight and can be ignored; hence, no distinction is made here. The data used in this model are Zhejiang GDP, industrial output value, industrial energy consumption, primary energy consumption, consumption of different energy types, and population.
In the Zhejiang Province Energy Development Report, the textile printing and paper, general purpose, special purpose, transportation equipment manufacturing, and petrochemical industries are aggregated. In the 2017 Table, textiles (07), textiles, clothing, shoes, hats, leather down and products (08), papermaking and printing, and cultural, educational, and sporting goods (10) are split into three industries. Therefore, these three industries need to be merged into the textiles and paper industry. General equipment (16), special equipment (17), and transportation equipment (18) are incorporated into available, memorable, and transportation equipment manufacturing. Petroleum, coking products, processed nuclear fuel products (11), and chemical products (12) are merged into the petrochemical industry.
In industrial sector data, the input–output table is the added value of the whole industry. Simultaneously, the statistical database of Zhejiang provides the energy consumption of enterprises above the designated size. In 2017, industrial energy consumption above the selected size was 125 million tce, and the whole industry was 139 million tce, with a gap of 14 million tce. Although total and industrial energy consumption above the designated size was not much different in quantity, this also impacted the results. This article used each industry’s energy consumption above the fixed scope to allocate each industry’s energy consumption below the designated size in proportion. This method can maintain data consistency.
As shown in Figure 1, the industrial sector’s energy consumption in Zhejiang mainly concentrated on the production and supply of electricity and heat, chemical raw material and chemical product manufacturing, textiles and products, leather, fur, feathers (velvet), and products. The energy consumption of various industries underwent significant changes from 2015 to 2020. For example, metal smelting and calendaring, textile printing, and papermaking saw a decline in energy consumption due to improved energy efficiency and clean energy development. Energy consumption in industries such as the papermaking and printing, cultural, educational, sporting goods, chemical raw materials, and chemical product manufacturing industries has increased.
The data in the 2017 table were calculated on the basis of the producer prices of the current year, and the value-added data needed to be converted into comparable prices. The article decomposes the energy consumption per unit of industrial added value from 2015 to 2020. The research uses the 2015 data as a benchmark and processes the data using the industrial producer ex-factory price index. On the one hand, the ex-factory price index deals with the added value of specific sectors. On the other hand, other sectors are deflated according to the ex-factory price index’s average value.

2.2. Method

2.2.1. Divisia Model

Kaya (1989) proposed the Kaya identity to study the influence of factors such as economic development, population size, and policies on carbon dioxide emissions [34]:
C = C E × E G × G P × P
where C is carbon dioxide emissions,   E represents energy consumption, G denotes the gross production value, and P is population.
On the right-hand side of the equation are four factors: emission factor, energy intensity, GDP per capita, and population.
The decomposition factors of Kaya identities are limited. This article expands it on the basis of the fundamental idea of Kaya identities and constructs an energy consumption relationship:
E t = k E k t = k E k t E t × E t G × G P × P
where E t denotes the total energy consumption in the period t , E k t reflects the category’s energy consumption k in period t ,   G t is the actual GDP in the period t , and P t denotes the period’s population t . S k t = E k t E t symbolizes the energy structure, the proportion of the consumption of different energy varieties in the total energy consumption, I t = E t G t is energy intensity, the energy consumption per unit of GDP, A t = G t P t represents the economic effect, the regional GDP per capita, and P t is the population (see Table 2).
Δ is the change from the base period, Δ E denotes the energy change, E t indicates the energy consumption in the period t , E 0 represents the energy consumption in the base period, Δ E s represents the change in energy structure, Δ E I represents the change in the energy intensity, Δ E A represents the change in the economic effect, and Δ E P represents the change in the population.
Δ E = E t E 0 = k S k t × I t × A t × P t k S k 0 × I 0 × A 0 × P 0 = Δ E S + Δ E I + Δ E A + Δ E P + Δ E r s d
To facilitate the analysis of the results, this paper uses the additive form proposed by Ang (1999) to decompose each factor [35].
Let the W = E k t E k 0 ln ( E k t / E k 0 ) product be:
Δ E S = k W × ln ( S k t S k 0 )
Δ E I = k W × ln ( I k t I k 0 )
Δ E A = k W × ln ( A k t A k 0 )
Δ E P = k W × ln ( P k t P k 0 ) .
Then, the formula can be derived:
Δ E r s d = Δ E ( Δ E S + Δ E I + Δ E A + Δ E P )                                                                                         = E t E 0 k E k t E k 0 ln ( E k t E k 0 ) × ln ( S k t I k t A k t P k t S k 0 I k 0 A k 0 P k 0 )                                                         = E t E 0 k E k t E k 0 ln ( E k t E k 0 ) × ln ( E k t E k 0 ) = 0 .
The final expression of energy consumption is:
Δ E = Δ E S + Δ E I + Δ E A + Δ E P .

2.2.2. Divisia Method of Relative Quantities in the Industrial Sector

The entire industrial sector is divided into n sub-sectors, with t representing the period.
Y t ,   E t , and I t are the value-added, energy consumption, and energy consumption per unit value-added of the industrial sector, respectively; I t = E t Y t , Y i t , E i t , and I i t respectively represent the value-added, energy consumption, and sector intensity of sub-industry I (to distinguish between the expressions, the term “sector intensity” is used here, which is the value-added energy consumption of the unit of the sector), I i t = E i t Y i t .   S i t represents the proportion of the added value of the sector i in the total industrial added value. I i t mainly reflects the technical level and S i t reflects the industrial structure. Change I t can be factorized into the form of a product or accumulation.
The unit value-added energy A of the industrial sector is equal to the weighted average of energy intensity B of each sub-industry, and the weight is the proportion of the added value of each sub-industry to the total industrial value-added [36]:
I t = E t Y t = i E i t Y t = i Y i t I i t Y t = i S i t × I i t .
After differentiating concerning time t on both sides and dividing by I t :
I t ˙ I t = i E i t E t × s i t ˙ s i t + i E i t E t × I i t ˙ I i t .
After integrating both sides, the formula can be obtained:
Γ I t ˙ I t = Γ i E i t E t × s i t ˙ s i t + Γ i E i t E t × I i t ˙ I i t
where Γ is the critical path, representing the curve segment ( S t , I t ) in time interval ( 0 , T ) . According to Hulten (1973), under the linear homogeneous condition (according to the calculation method of unit GDP energy consumption, the formula satisfies this condition), the integral of Equation (13) has nothing to do with the critical path, and the procedure can be obtained as follows [37]:
ln ( I T I 0 ) = 0 T i E i t E t × S i t ˙ S i t   d t + Γ i E i t E t × I i t ˙ I i t   d t .
Therefore, the relative change I t I 0 of energy consumption per unit value-added can be decomposed into two parts: structural effect and intensity effect:
I T I 0 = exp { 0 T i E i t E t × S i t ˙ S i t   d t S t r u c t u r e   e f f e c t   D s t r } exp { 0 T i E i t E t × S i t ˙ S i t   d t I n t e n s i t y   e f f e c t   D i n t }
In practical applications, data are generally discrete. For this reason, by the integral mean value theorem, the integral can be approximately written in discrete form. The Törnqvist (1936) or Sato–Vartia (1976) index method can be used in the research. The article uses the more accurate Sato–Vartia index method [38,39,40].
I T I 0 = D s t r × D i n t × D r e s
where D s t r = e i α i , D i n t = e i β i , D r e s is the residual part. α i and β i represent the contribution of the structural and intensity effect of the sector, respectively. A larger value denotes a greater contribution, and the negative value means that the contribution is negative.
α i = ( E i T E T E i 0 E 0 ) ( l n E i T E T l n E i 0 E 0 ) j [ ( ( E i T E T E i 0 E 0 ) ( l n E j T E T l n E j 0 E 0 ) ) ] × ( l n S i T l n S i 0 )
β i = ( E i T E T E i 0 E 0 ) ( l n E i T E T l n E i 0 E 0 ) j [ ( ( E i T E T E i 0 E 0 ) ( l n E j T E T l n E j 0 E 0 ) ) ] × ( l n I i T l n I i 0 )

2.2.3. Divisia Method of Absolute Quantity in the Industrial Sector

Calculate the line integral from the above formula to obtain:
Γ I t ˙ = Γ i E i t Y t × S i t ˙ S i t + Γ i E i t Y t × I i t ˙ I i t
where Γ is the critical path, representing curve segment ( S t , I t ) in time interval ( 0 , T ) . In the same way, we can obtain:
  I T I 0 = 0 T i E i t Y t d l n S i t S t r u c t u r e   e f f e c t   Δ I s t r + 0 T i E i t Y t d l n I i t I n t e n s i t y   e f f e c t   Δ I i n t .
Similarly, the integral median theorem can be approximately written in discrete form using the Sato–Vartia exponential method.
The absolute change in energy consumption per unit value added of industrial sector   Δ I can be decomposed into the structural effect Δ I s t r and intensity impact Δ e i n t :
Δ I = I T I 0 = Δ I s t r + Δ I i n t + Δ I r s d
among which Δ I s t r = i ω i ,     Δ I i n t = i φ i , and Δ I r s d is the residual value, which is generally close to zero.
The Sato–Vartia index method can be used to obtain:
ω i = ( E i T Y T E i 0 Y 0 ) ( l n E i T Y T l n E i 0 Y 0 ) i [ ( ( E i T Y T E i 0 Y 0 ) ( l n E i T Y T l n E i 0 Y 0 ) ) ] × ( l n S i T l n S i 0 )
φ i = ( E i T Y T E i 0 Y 0 ) ( l n E i T Y T l n E i 0 Y 0 ) i [ ( ( E i T Y T E i 0 Y 0 ) ( l n E i T Y T l n E i 0 Y 0 ) ) ] × ( l n I i T l n I i 0 ) .
The degree of refinement of the division of departments affects the results. Generally speaking, the more detailed the departments’ division is, the better the unit value-added energy consumption of each sub-sector can reflect the technical level, and the more accurate the results are. However, the amount of data required also becomes more demanding.
In order to facilitate the calculation of the contribution of the structural and intensity effects to changes in energy consumption per unit of industrial added value, the following definitions are made.
Contribution of structural effect:
C s t r = Δ I s t r Δ I s t r + Δ I i n t × 100 % .
Contribution of intensity effect:
C i n t = Δ I i n t Δ I s t r + Δ I i n t × 100 % .

3. Results and Discussion

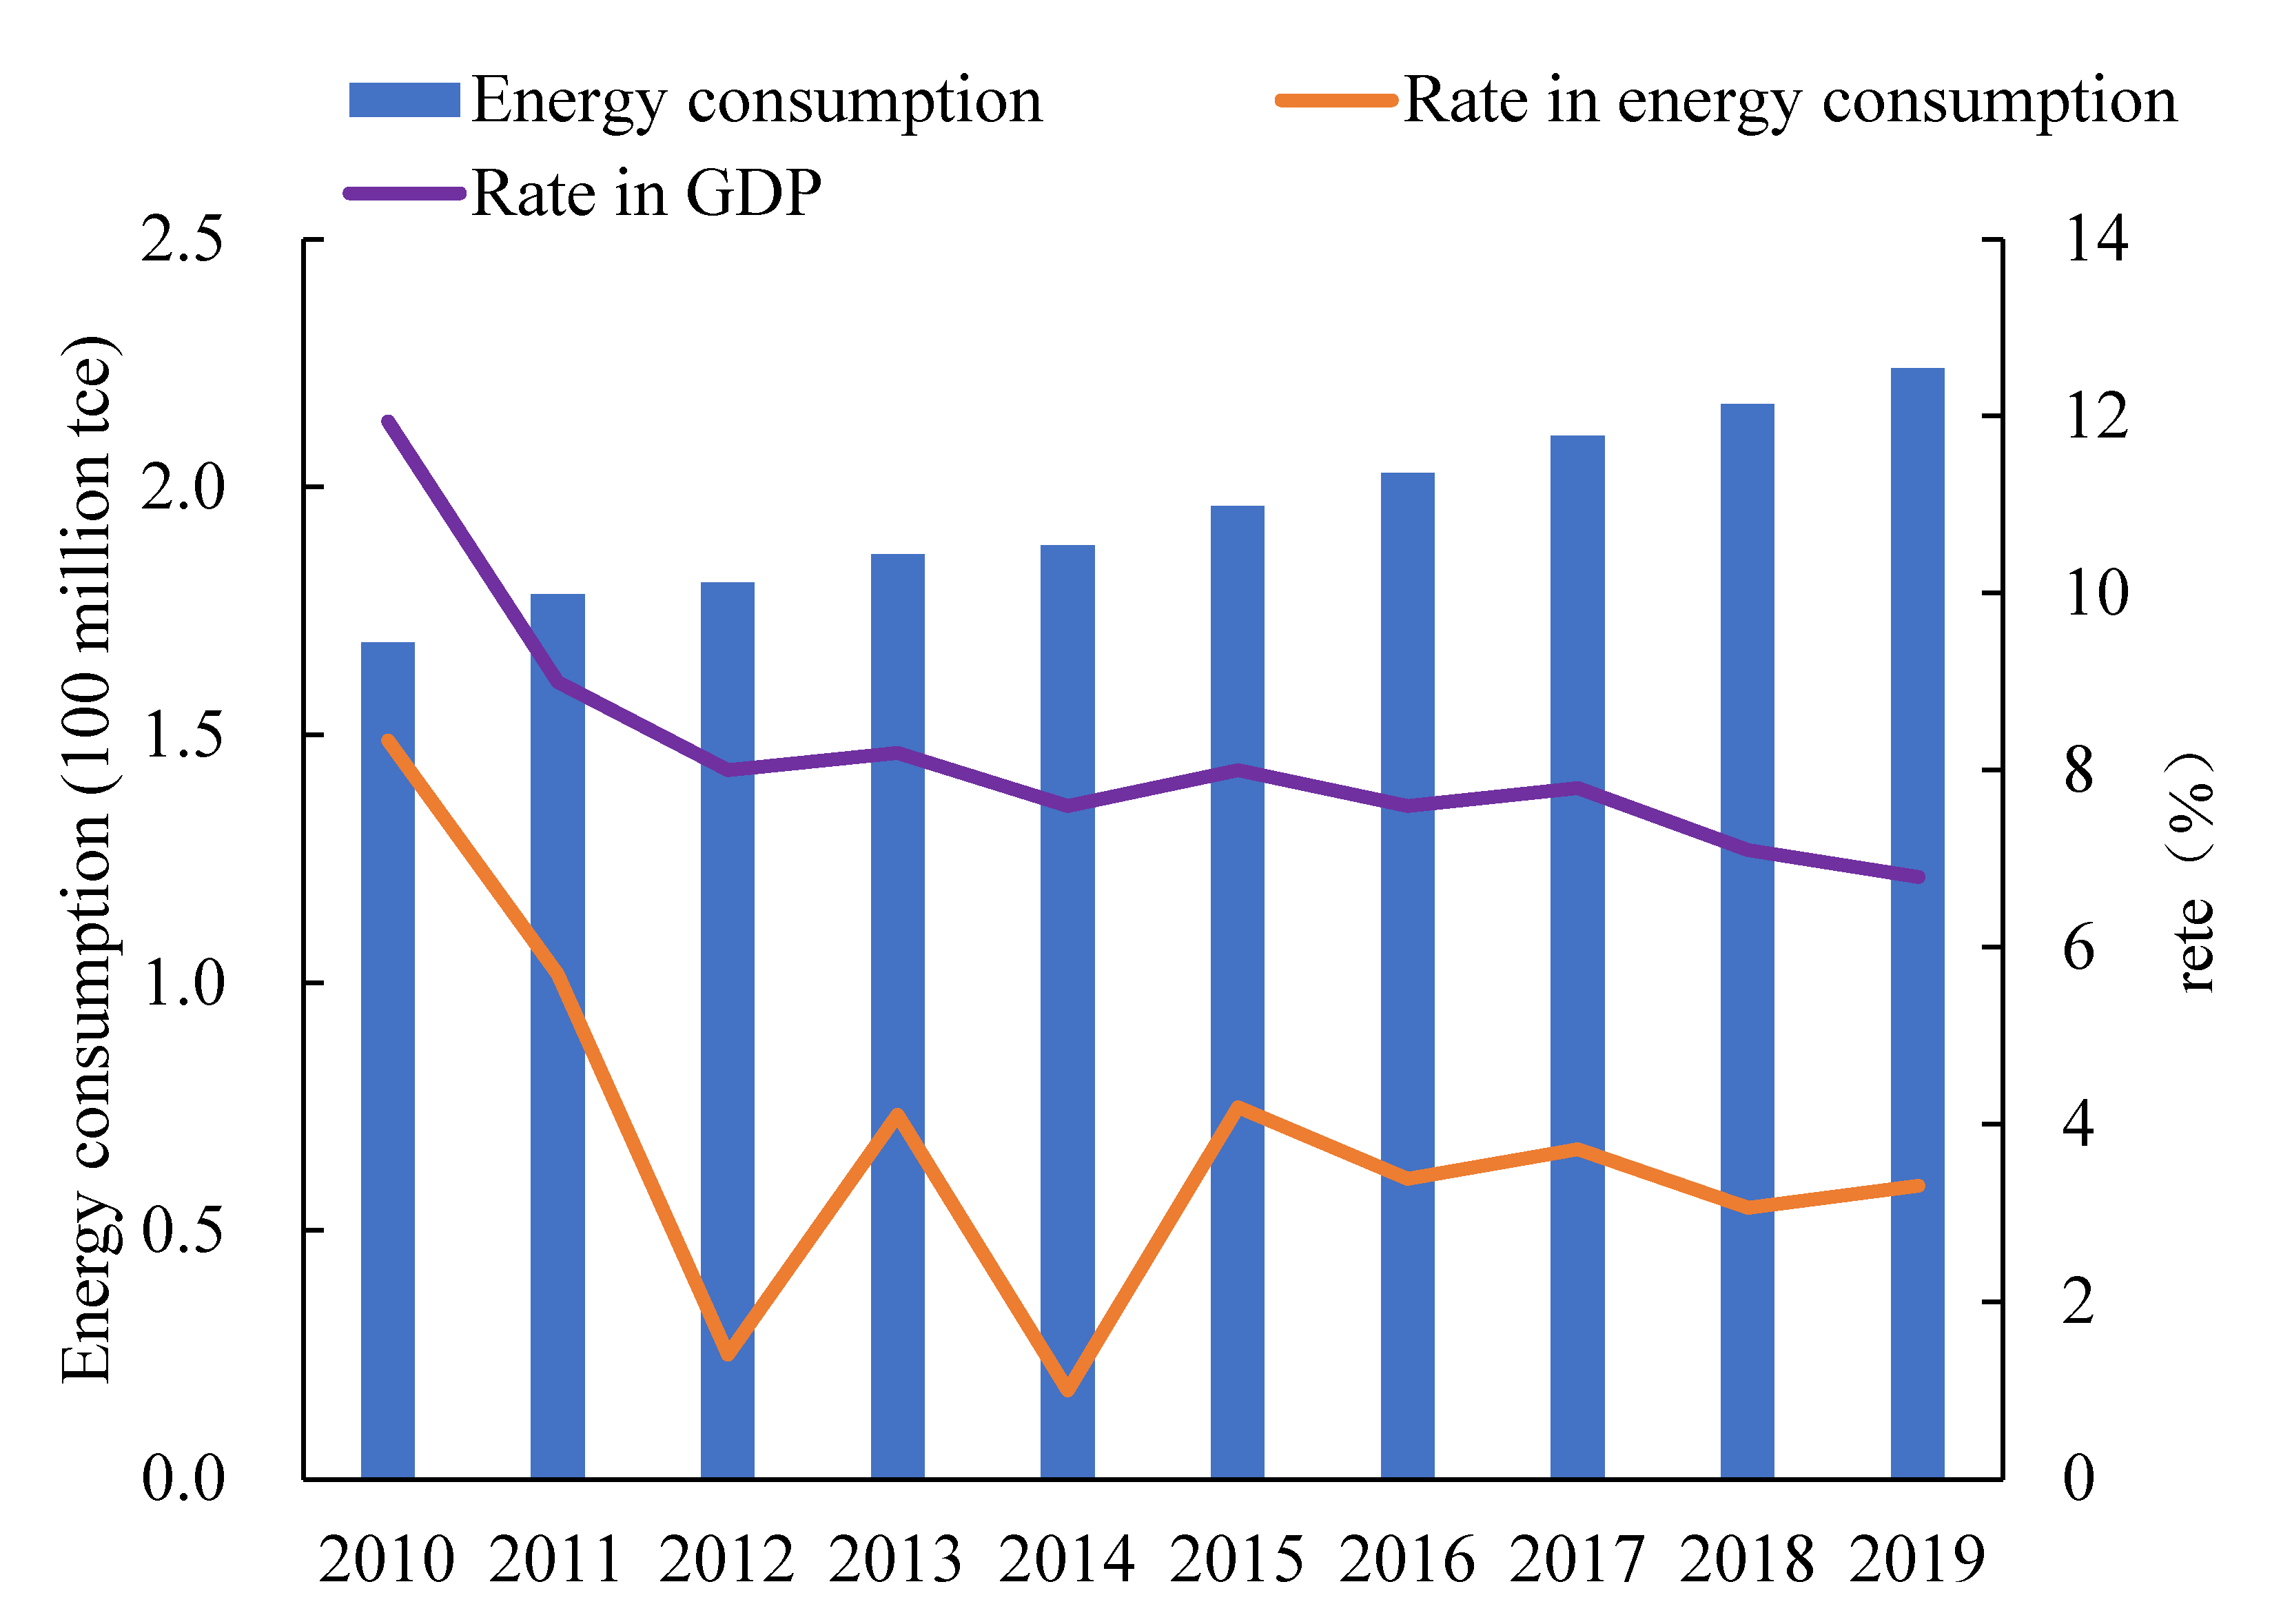
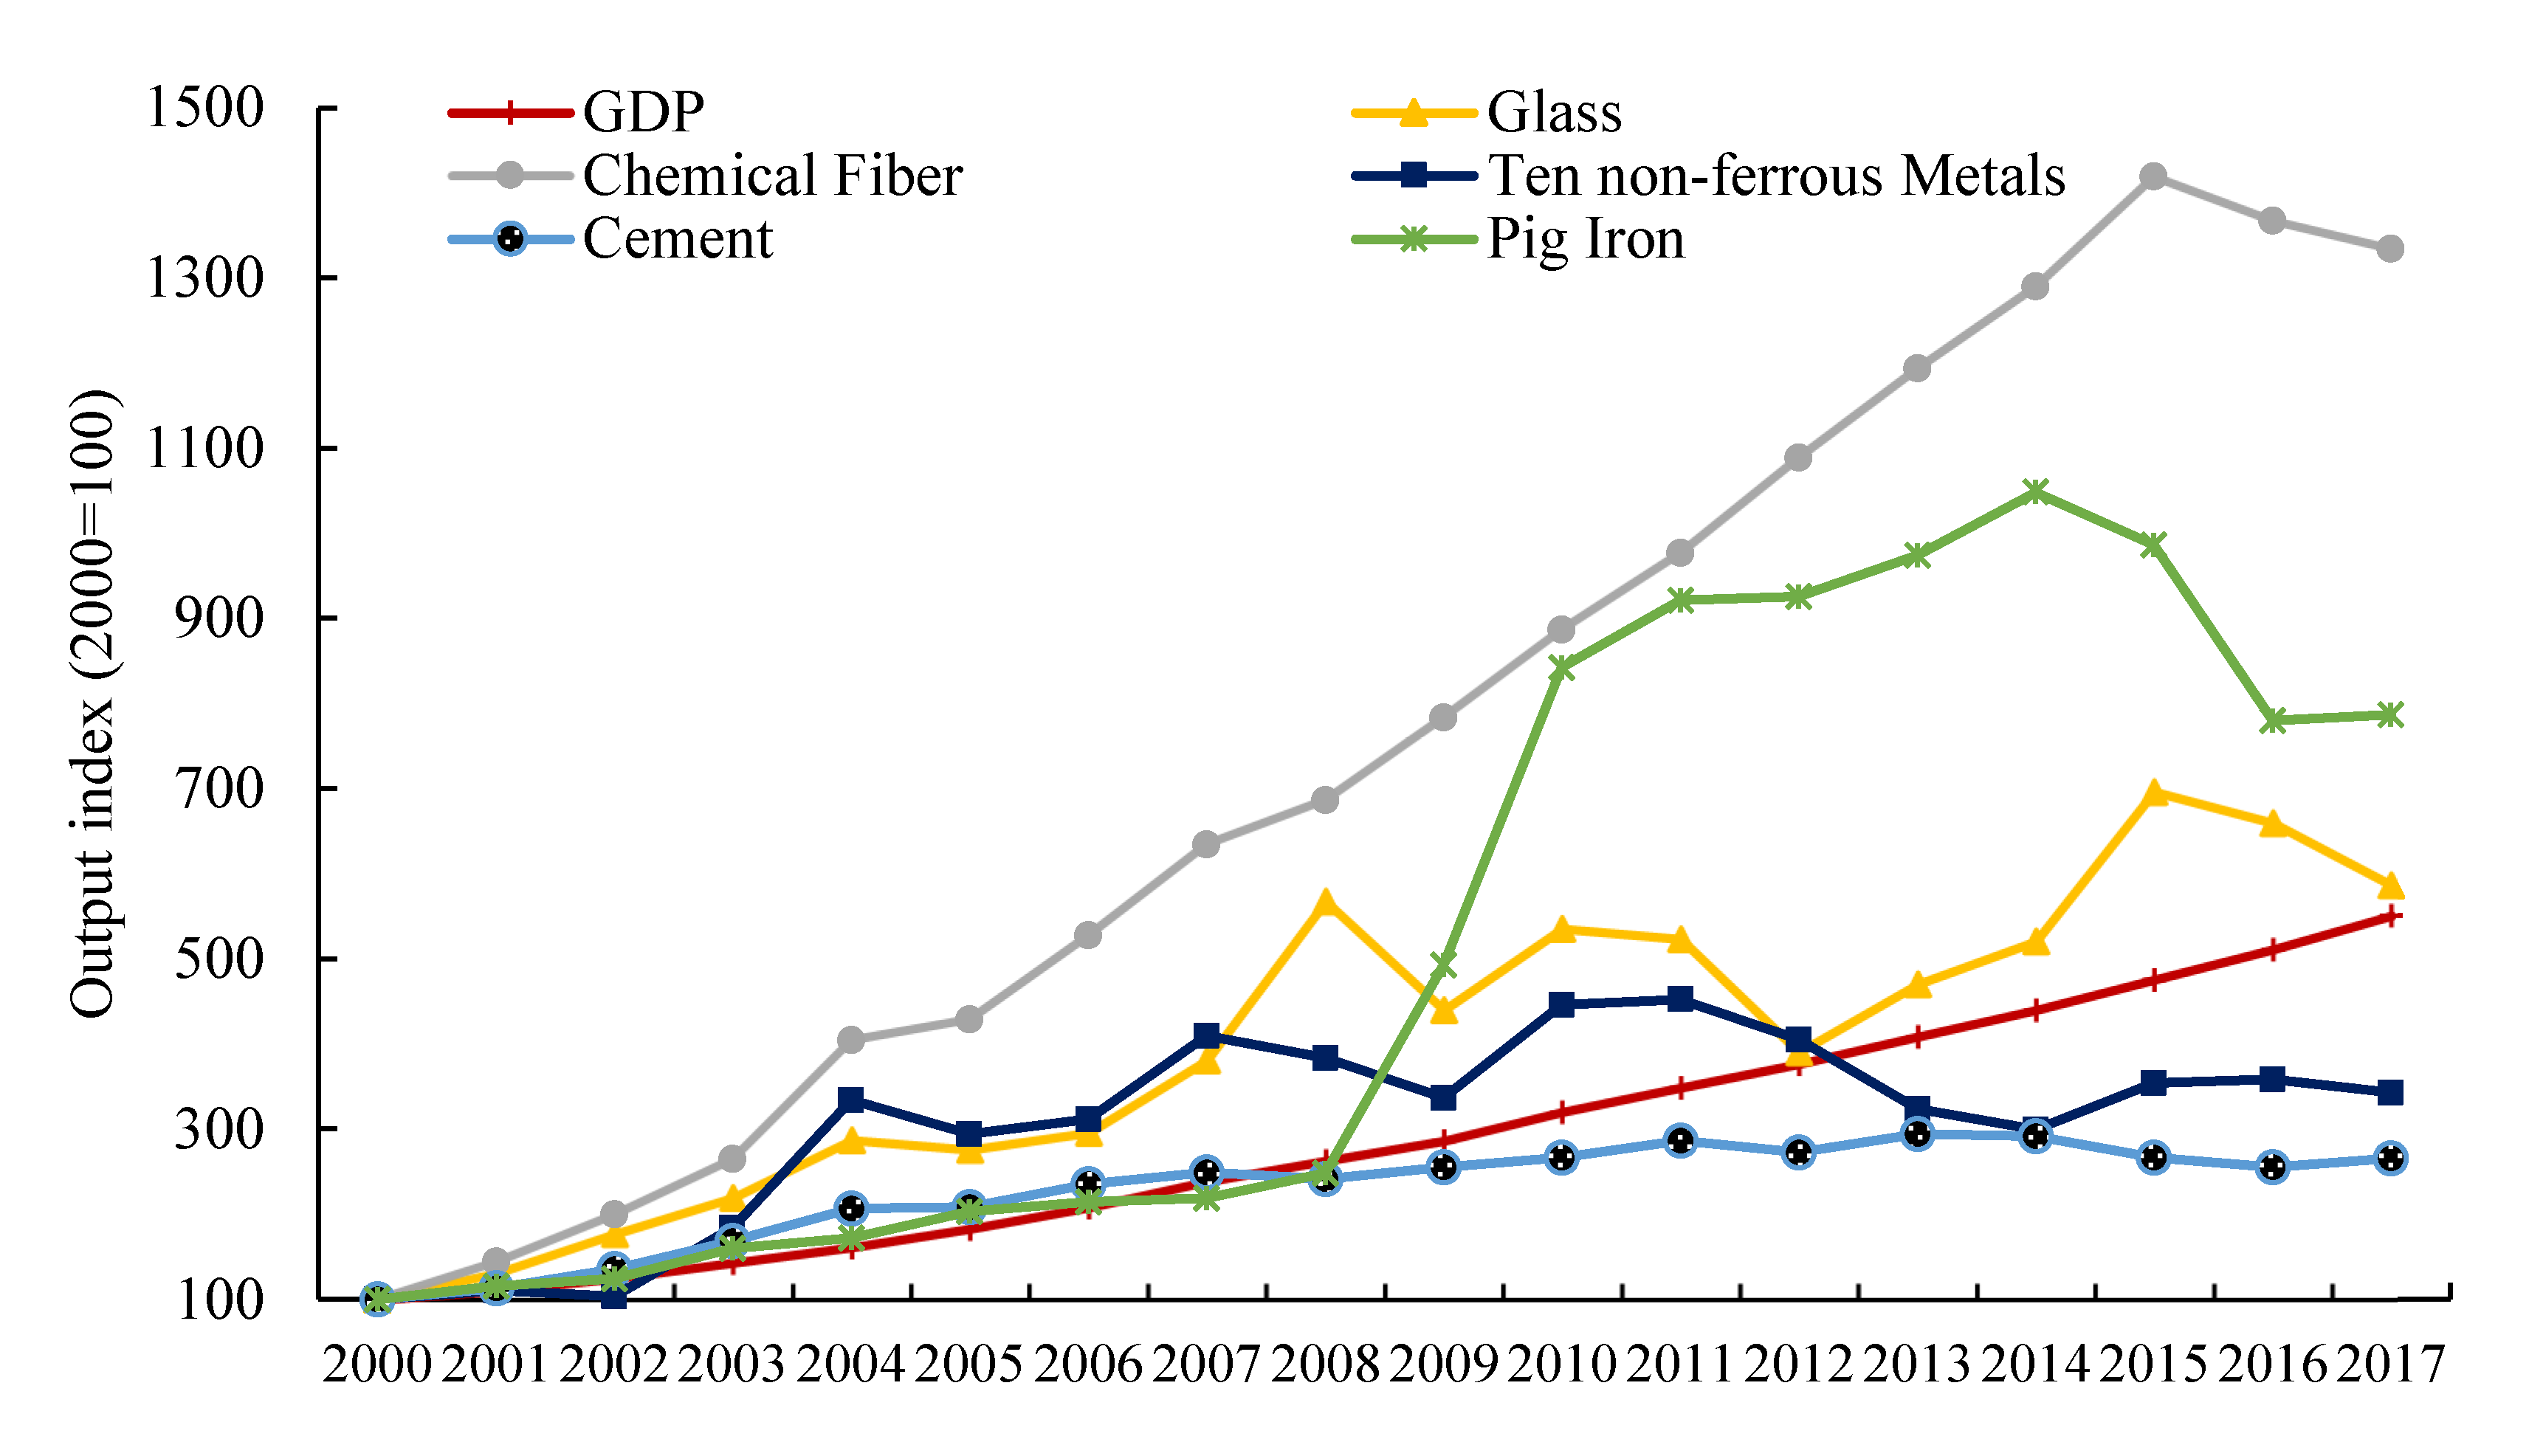
3.1. Total Energy Consumption

From 2010 to 2019, Zhejiang’s energy consumption continued to grow (see Figure 2). Energy efficiency in Zhejiang further improved, energy consumption per unit of industrial added value continued to decrease, and energy growth showed a downward trend.
Since 2000, the output index of Zhejiang’s main industrial energy-consuming products first experienced a rapid increase, which was followed by a slowdown or even a decrease (see Figure 3). High energy-consuming products such as pig iron and chemical fibers reached their peaks around 2015, with average growth rates of 16% and 19%, respectively, which were 10% and 7% higher than the GDP growth rate period. As Zhejiang eliminated outdated production capacity and reduced excess production capacity, various energy-intensive products have declined. For example, the output of pig iron most significantly dropped, and the product indices of cement and 10 non-ferrous metals remained relatively stable. In the future, with the further implementation of the “dual control” goal in Zhejiang, the output of industrial high-energy-consuming products could stabilize and even decline, which would play an essential role in reducing Zhejiang’s energy consumption [41,42,43].

3.2. Decompositon of Energy Consumption

Through the Divisia model, the article decomposes the factors affecting energy consumption in Zhejiang. The decomposition results of energy structure, energy intensity, economic effect, and population are as follows (see Table 3).
The impact of per capita GDP on energy consumption is still the most dominant factor. GDP per capita is a comprehensive measure of per capita production and services in a region. It not only reflects economic growth but also reflects people’s living standards. Zhejiang’s per capita GDP reached 110,000 yuan in 2019, which was an increase of 5.0%. From 2010 to 2019, the impact of economic effect on energy consumption remained relatively high, showing a trend of increasing first and then decreasing. The effect of per capita GDP on energy consumption reached the highest value of 14 million tce in 2015. On the one hand, this may be directly related to the slowdown in Zhejiang’s economic development in recent years. On the other hand, it may be due to the falling dependence of economic growth on energy consumption [44,45].
The impact of population on energy consumption has steadily declined, with a cumulative increase of 10 million tce. From 2010 to 2019, the permanent residents of Zhejiang increased from 54.47 million to 58.5 million, which was an increase of 4.03 million. On the one hand, as the permanent population continues to grow, energy consumption increased. On the other hand, the impact of population on energy consumption shows a low-level increasing trend. This may be due to the low rate of population growth during this period. It is expected that the population of Zhejiang will not change on a large scale. Therefore, the population is a factor in the increase in energy consumption, but it is unlikely to increase the main energy factor.
According to Table 4, the overall impact of energy structure on energy consumption tends to be stable. The energy structure had a relatively small contribution to energy consumption in 2010–2019 and only played a weak positive role. Zhejiang’s energy consumption structure shows a trend of continuous optimization. The proportion of coal and oil consumption gradually decreased, and clean energy continued to increase. Due to the different effects of different energy types within the energy consumption structure, energy consumption is relatively small.
Energy intensity reduces energy consumption. Energy intensity is a measuring unit of energy consumption, reflecting the overall efficiency of energy and economy. When other factors remain the same, a decline in energy intensity reduces energy consumption. The annual reduction in energy consumption by energy intensity is between 5 and 15 million tce, which is the main reduction factor.
The article analyzes the cumulative impact of various factors on Zhejiang’s energy consumption from 2010 to 2019, as shown in Figure 4. From 2010 to 2019, Zhejiang’s energy consumption increased by 55.17 million tce. The population size and economic effect positively impacted energy consumption, while energy intensity reduced energy consumption. Energy structure had little impact on energy consumption. The total impact of economic effect on energy consumption is 120 million tce, accounting for more than 200%, which was the main increasing factor. The effect of population on energy consumption was 10 million tce, accounting for 20%, and its impact on energy consumption was lower than the economic effect. The effect of energy intensity on energy consumption was a reduction of 80 million tce, which was the main factor in reducing energy consumption.

3.3. Industrial Decomposition Results

The structural and intensity effects primarily reduce energy consumption. It can be seen from Figure 5 that the intensity effect of some industries reduces energy consumption, for example, the petrochemical, metal smelting and calendaring, textile printing and papermaking, electric power, and heating industries. Since the “13th Five-Year Plan”, Zhejiang has carried out energy-saving and consumption-reducing work for some high-energy-consuming industries. The energy efficiency of power and other industrial sectors has been significantly improved, and the unit energy consumption level is at the forefront of the country.
From the above analysis, the industries that reduce energy consumption by structural effect include the petrochemical, textile printing, and paper industries. On the one hand, this reflects Zhejiang’s continuous adjustment of industry structure, strict control on high energy-consuming and high-polluting industries, and the elimination of backward production capacity. On the other hand, Zhejiang promotes a clean and low-carbon energy transition to improve energy productivity and comprehensive economic and social benefits. The intensity effect of general-purpose, special-purpose, and transportation equipment manufacturing positively impacts energy consumption. It may be related to the rapid development of transportation industries such as highways and ports in Zhejiang.
The government should reduce the energy consumption of the industrial sector through industrial restructuring and technological advancement. The key path to developing a low-carbon economy and build low-carbon development is to increase technological innovation and reduce energy intensity [46,47]. Population size and economic effects have a significant positive driving effect, so policy makers should consider the greatest possible improvement in energy development strategies without affecting economic development [48].

4. Conclusions and Recommendations

4.1. Conclusions

This work used the 2010–2019 Zhejiang Province Energy Data and the 2017 Zhejiang Input–Output Table to expand the basic idea of Kaya’s identity and establish the LMDI model. The influencing factors of energy consumption change in Zhejiang were analyzed according to Divisia model, and the results of energy structure, energy intensity, economic effect, and population size were obtained. The contribution of structural and intensity effects was calculated regarding the change in energy consumption per unit of industrial value added.
(1).
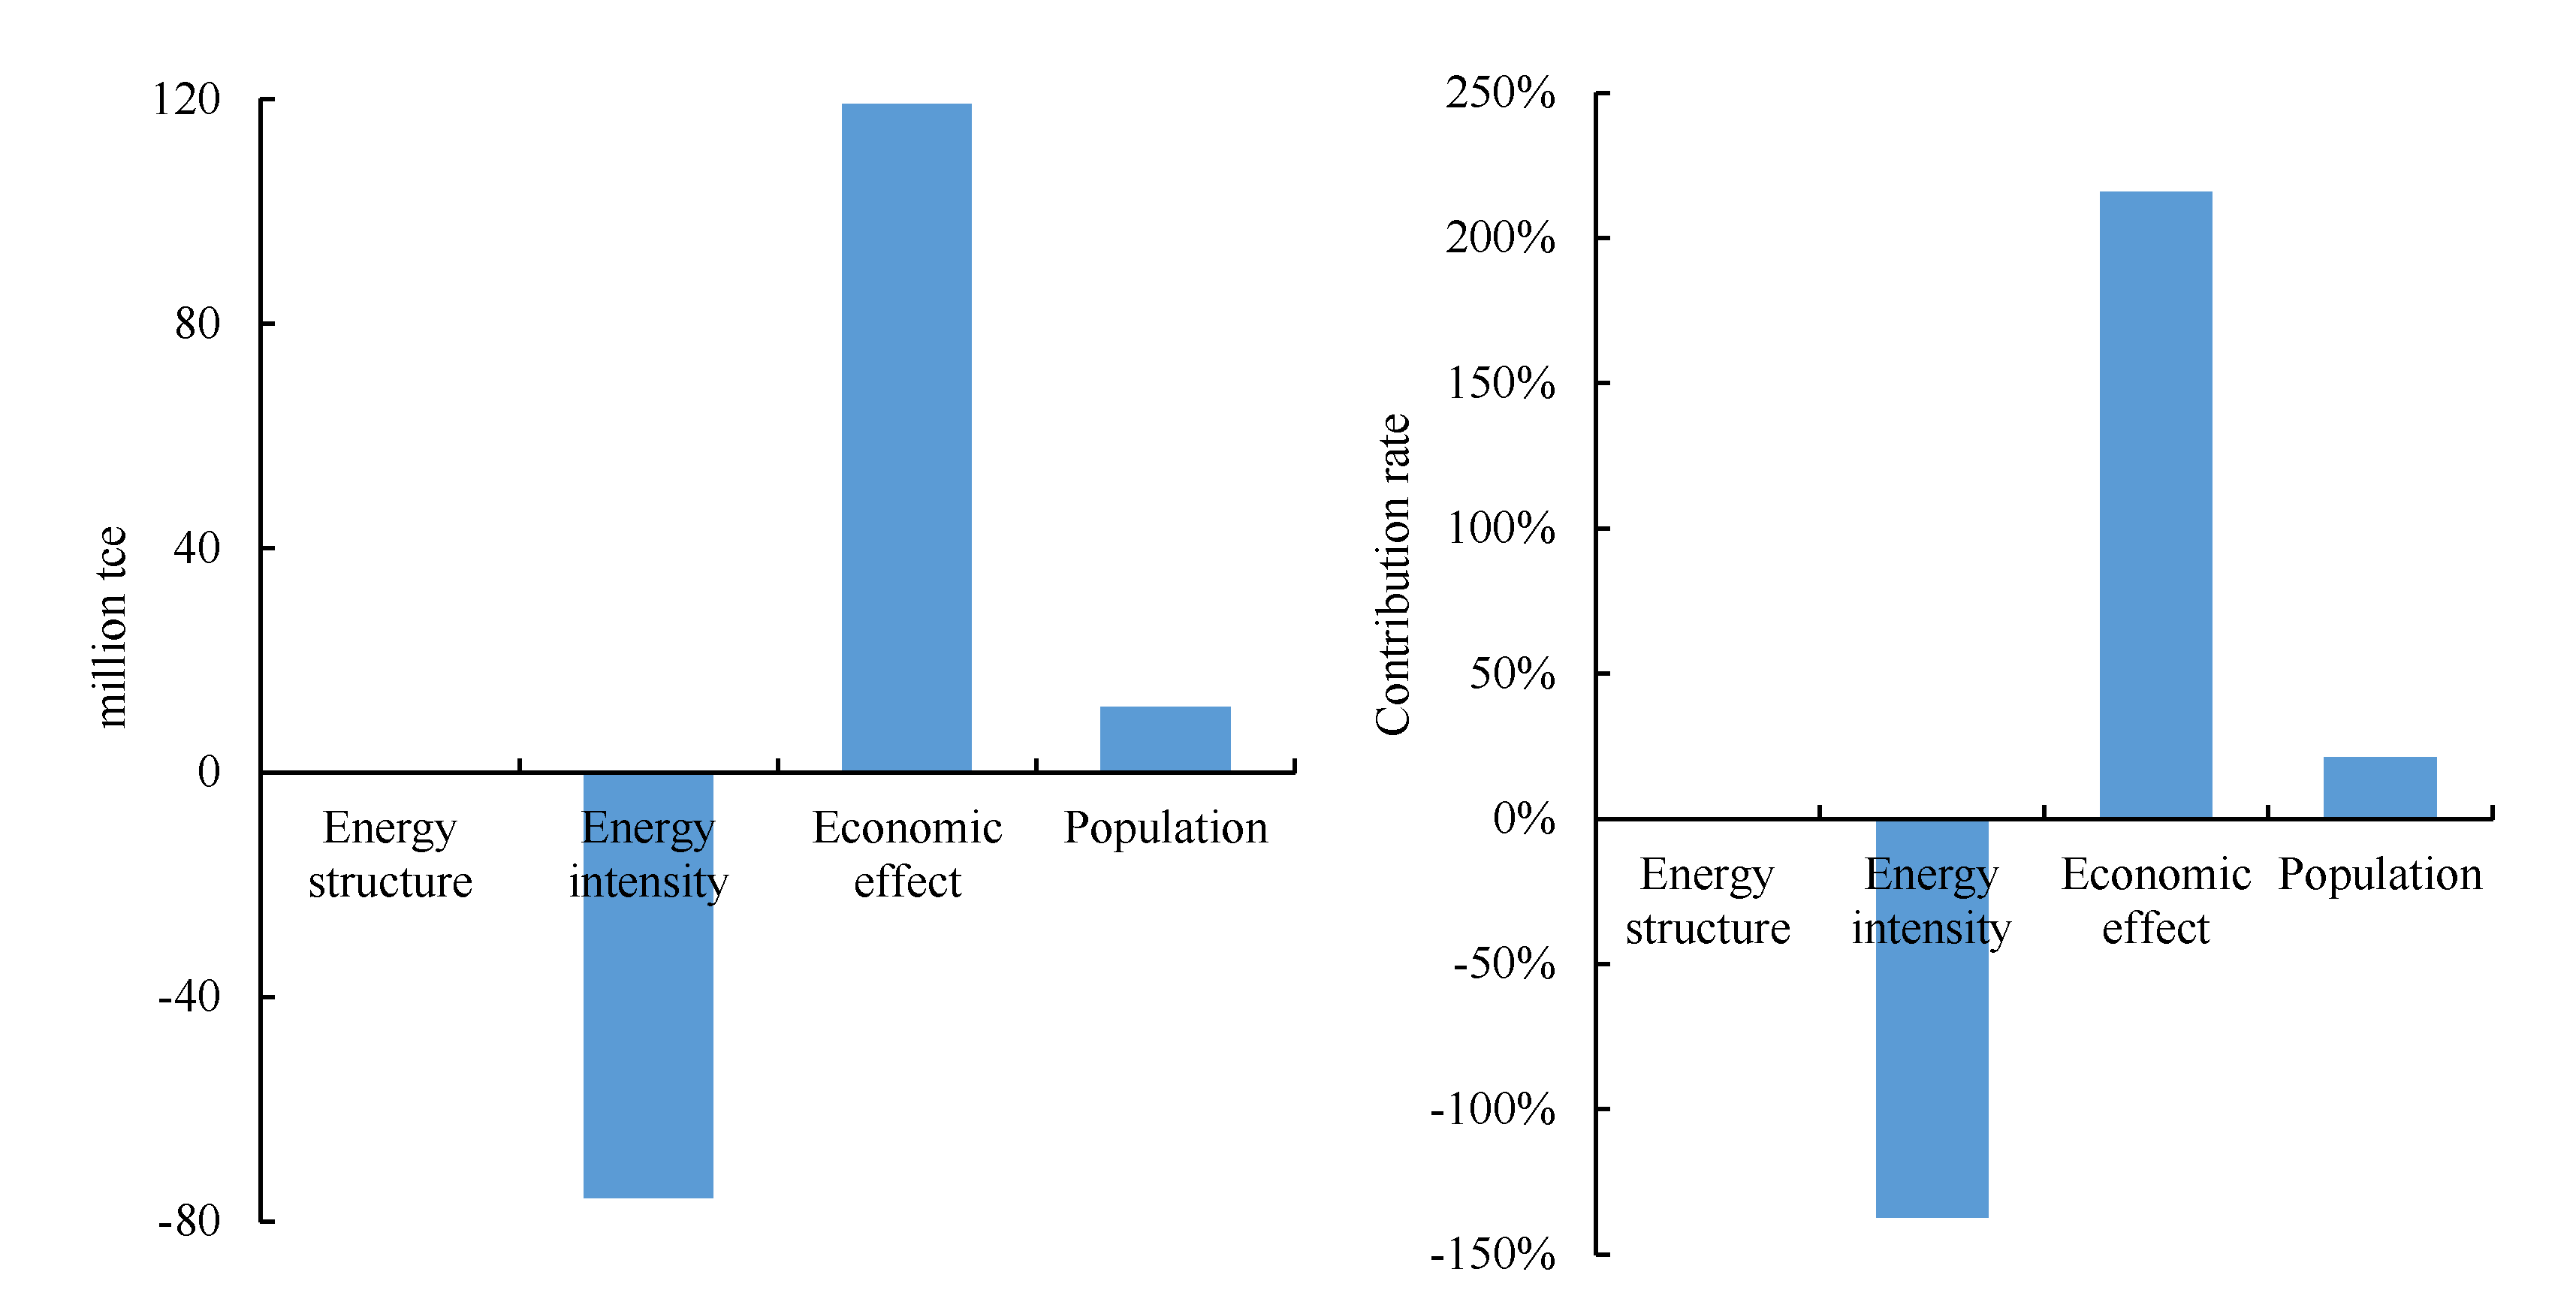
The growth effect of per capita GDP on energy consumption is still the dominant factor compared with other elements. The economic effect from 2010 to 2019 more significantly impacted energy consumption, reaching the highest value of 14 million tce in 2015.
(2).
The effect of population size on energy consumption showed a low-level increasing trend, and the annual increase in energy consumption is between 1 and 2 million tce. Energy structure had a relatively small impact on energy consumption. Energy intensity annually reduced energy consumption between 5 and 15 million tce.
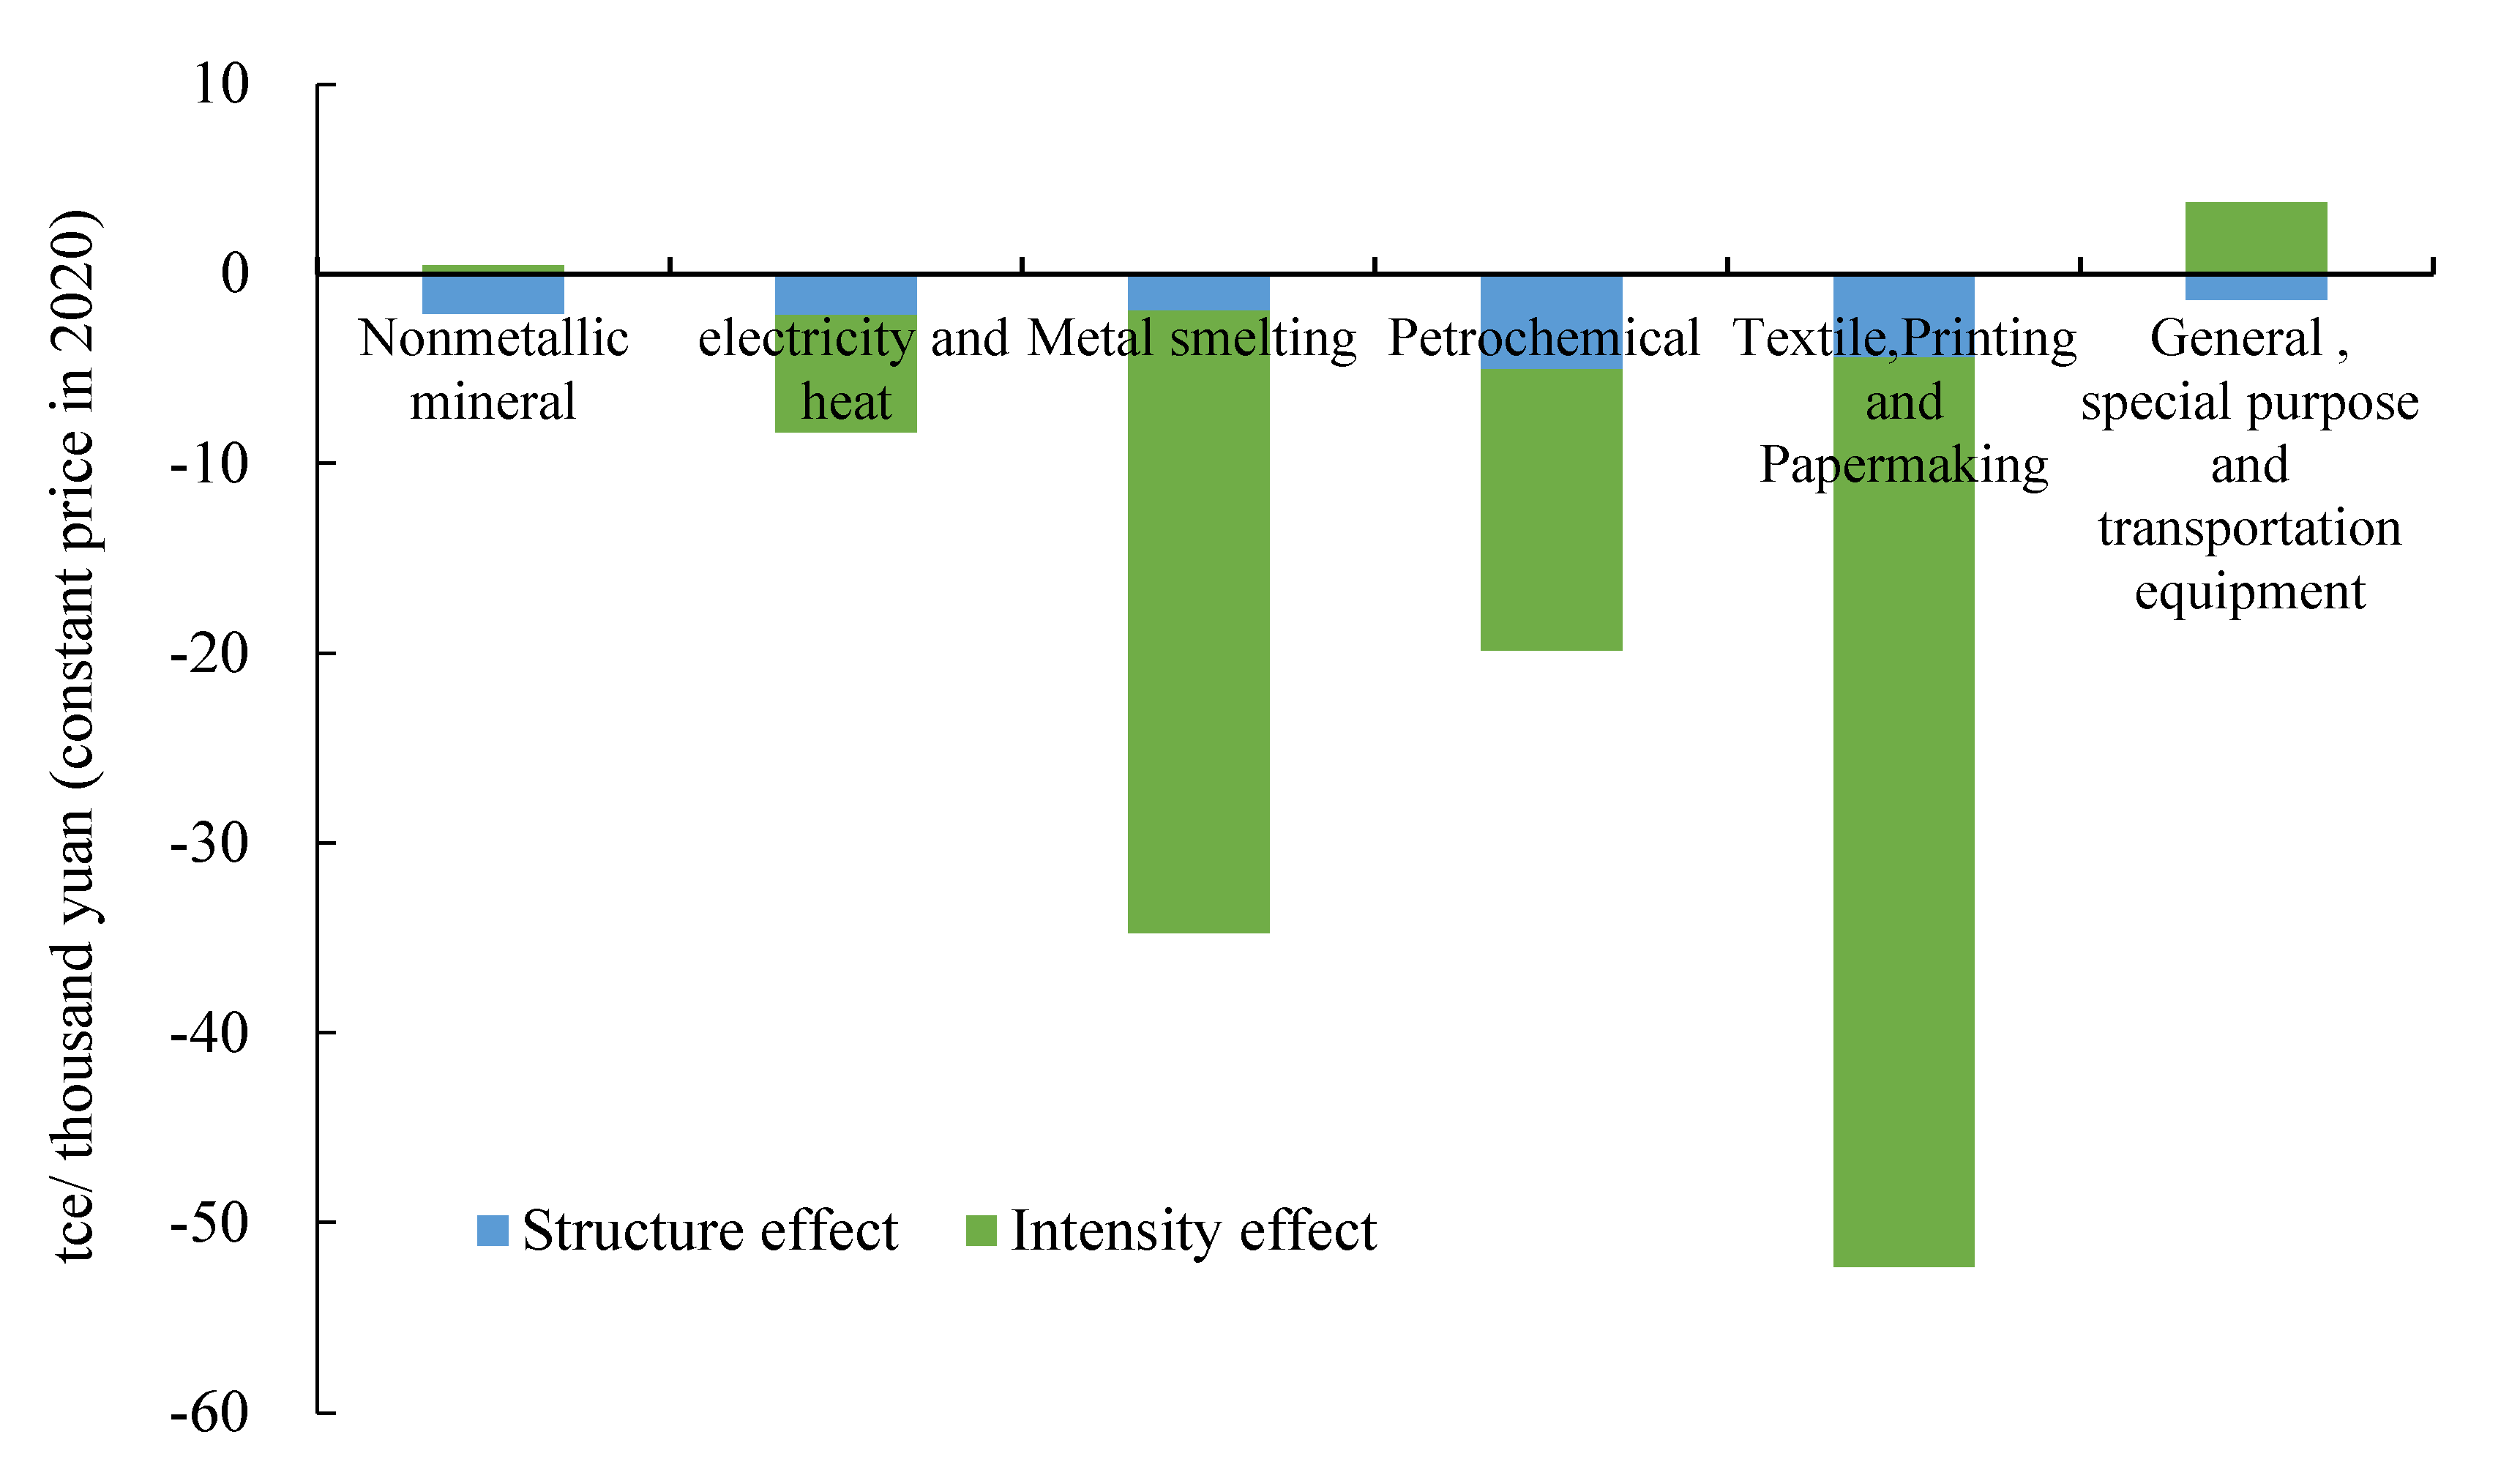
(3).
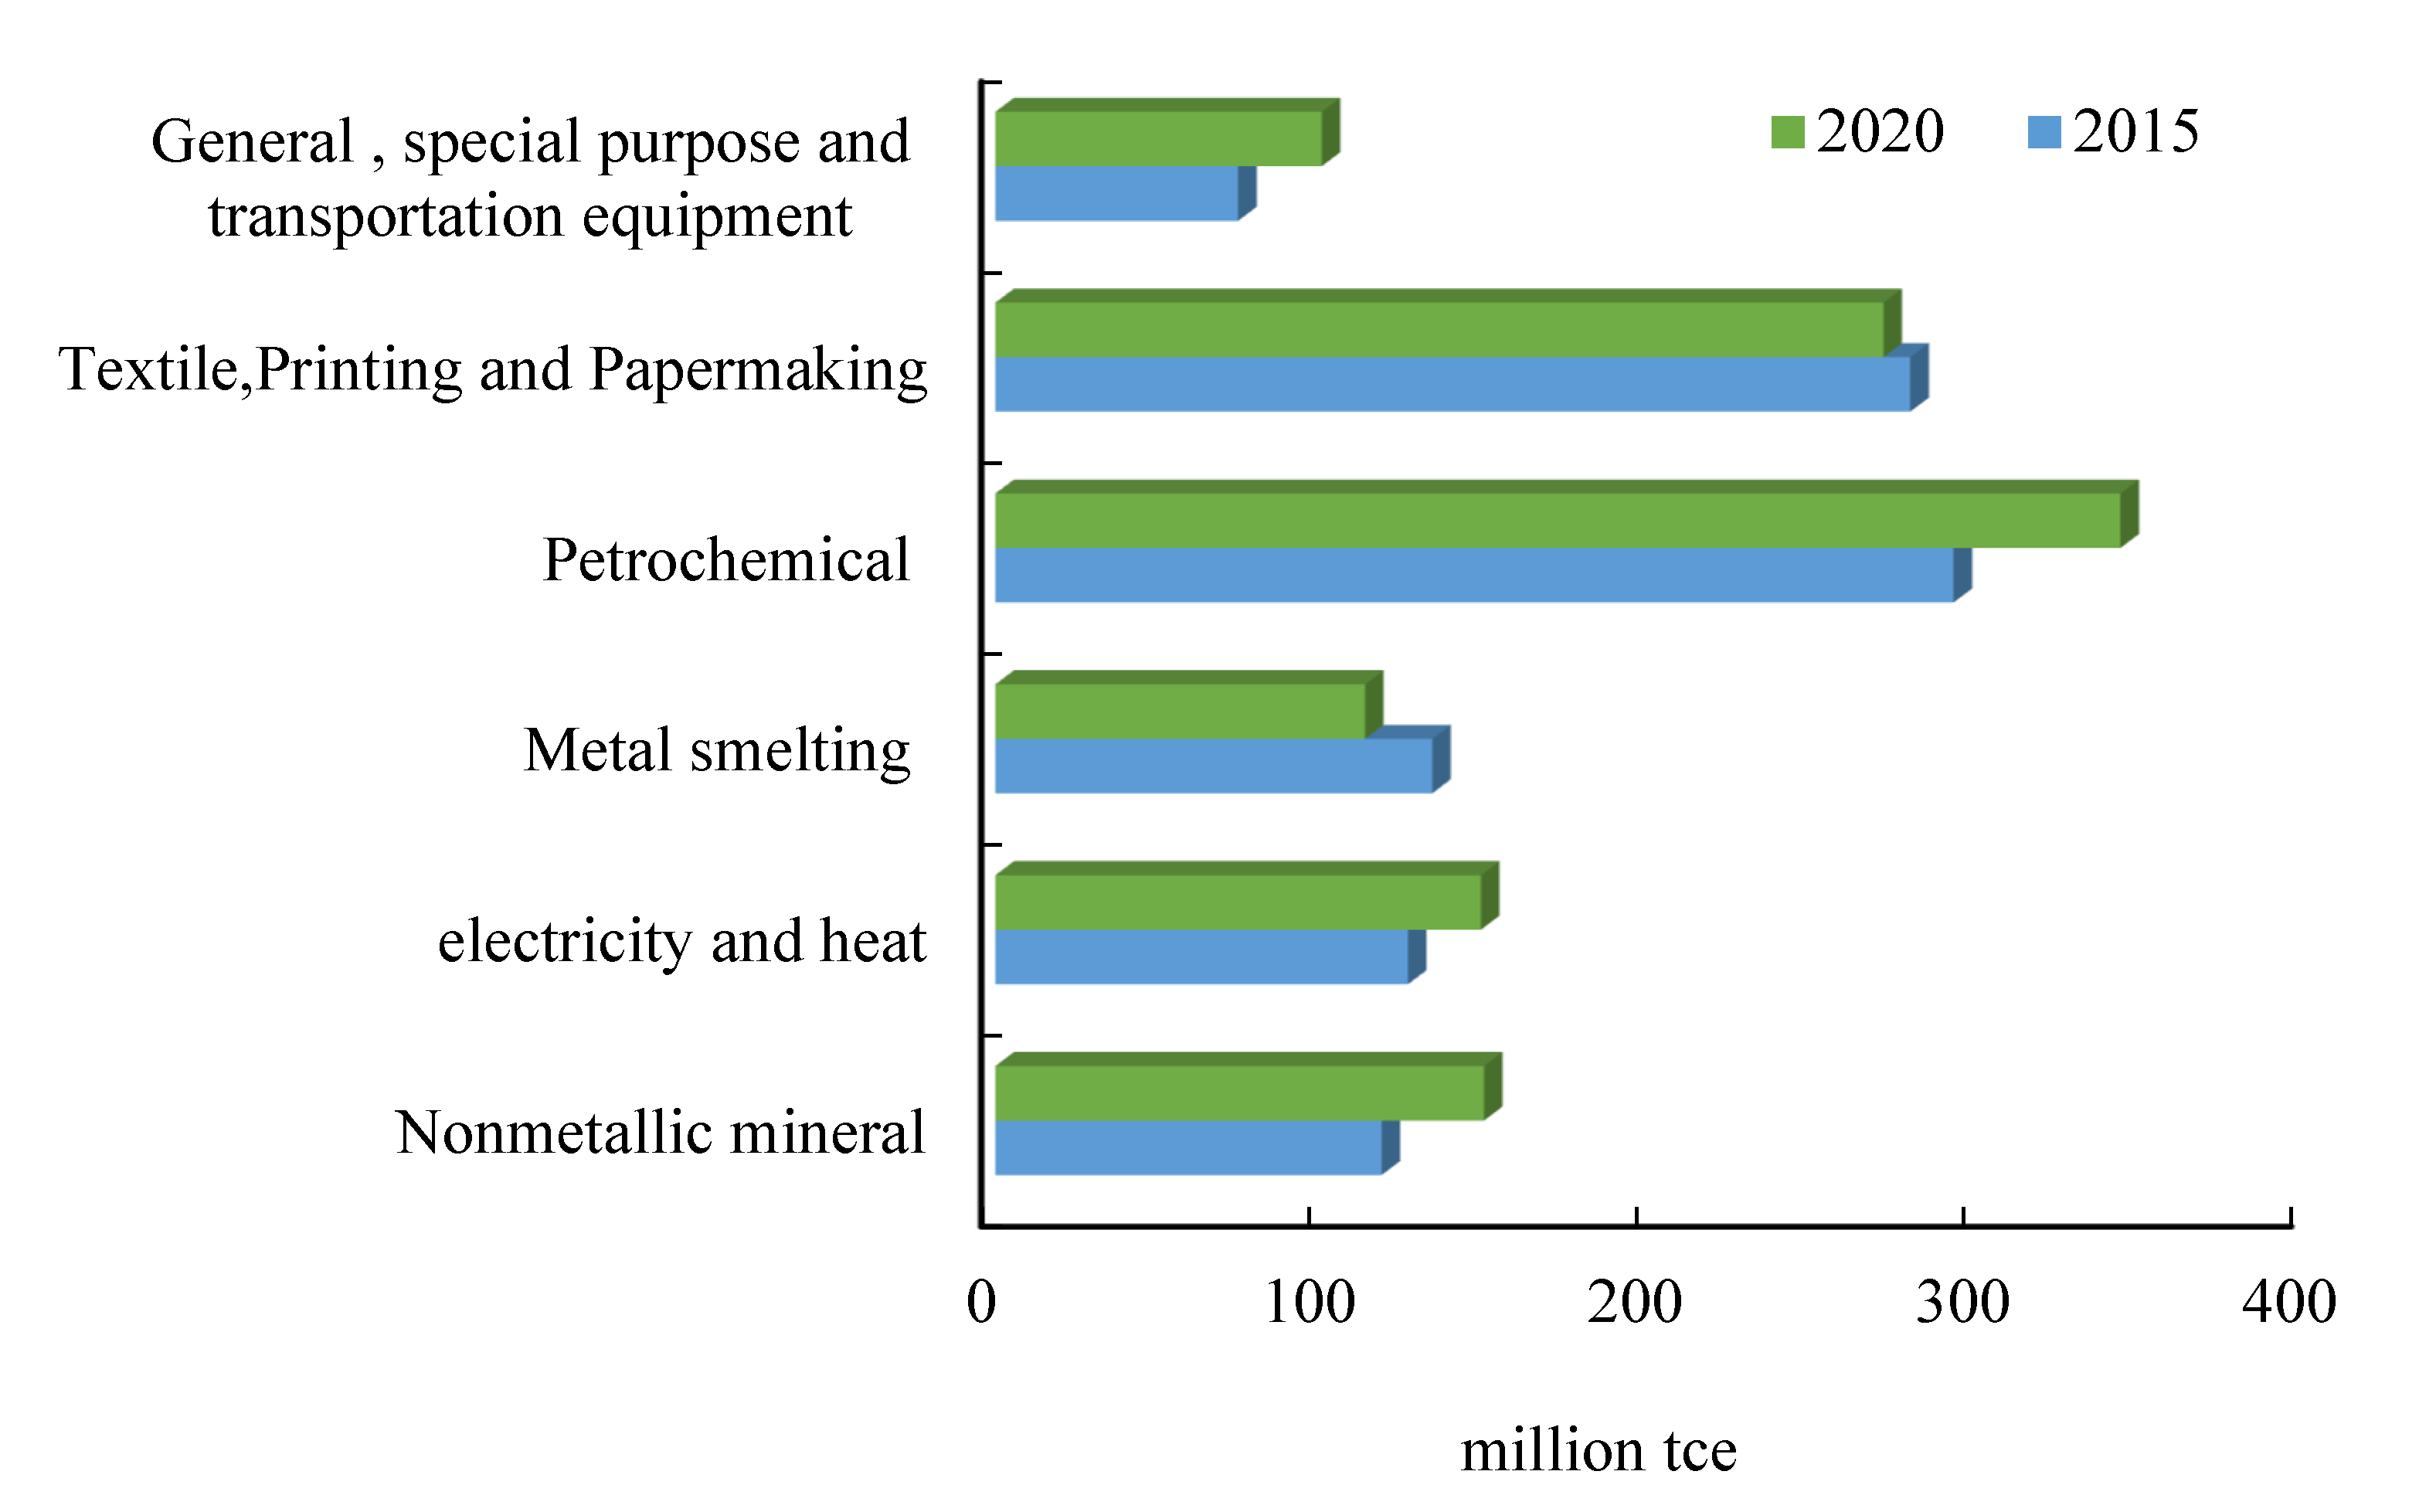
The industrial sector’s structural and intensity effects were decomposed, and the values were primarily negative. The intensity effect on energy-intensive industries was principally adverse, such as the petrochemical, metal smelting, calendering, textile printing and papermaking, and power and heating industries. Industries with adverse structural effects mainly include the petrochemical, textile printing, and paper industries. The intensity effect on the general purpose, special purpose, and transportation equipment manufacturing industry increased energy consumption.

4.2. Policy Implications

(1).
According to the decomposition results for energy consumption, GDP per capita is still the most critical contributing factor. The government must control energy consumption and reduce energy consumption per unit of GDP and carbon emission intensity.
(2).
The government took the opportunity of “carbon peaking” and “carbon neutrality” to promote the transformation of the energy structure and carry out the goal of carbon dioxide peaking in the energy sector.
(3).
Technology effects have a significant negative driving effect on energy consumption Enterprises should enhance the level of intelligence and efficiency of dispatch management and emergency response. Zhejiang should accelerate the establishment of an international oil and gas trading center and resource allocation base.

Author Contributions

G.Q.: Data curation; Y.L.: Methodology; W.H.; Software, Conceptualization; W.W.: Data curation, Methodology; Z.Y.: Data curation; J.W.: Writing—Review; Q.L.: Conceptualization, Methodology; S.J.: Supervision; S.S.; Writing—Review and Editing, Supervision. All authors have read and agreed to the published version of the manuscript.

Funding

This work is supported by funding from Zhejiang Provincial Soft Science Program (Grant No. 2019C35073), Diku–Norwegian Agency for International Cooperation and Quality Enhancement in Higher Education.

Institutional Review Board Statement

Not applicable.

Informed Consent Statement

Not applicable.

Data Availability Statement

The data presented in this study are available on request from the corresponding author.

Conflicts of Interest

The authors declare no conflict of interest.

References

  1. Jansson, J.K.; Hofmockel, K.S. Soil microbiomes and climate change. Nat. Rev. Microbiol. 2020, 18, 35–46. [Google Scholar] [CrossRef]
  2. Schuur, E.A.G.; McGuire, A.D.; Schaedel, C.; Grosse, G.; Harden, J.W.; Hayes, D.J.; Hugelius, G.; Koven, C.D.; Kuhry, P.; Lawrence, D.M.; et al. Climate change and the permafrost carbon feedback. Nature 2015, 520, 171–179. [Google Scholar] [CrossRef]
  3. BP Statistical Review, 2020. BP Statistical Review of World Energy. 2020. Available online: http://www.bp.com/statisticalreview (accessed on 16 July 2021).
  4. IEA, 2020. World Energy Outlook 2020. Executive Summary. Available online: https://www.iea.org/reports/world-energyoutlook-2020#executive-summary (accessed on 16 July 2021).
  5. Jackson, R.B.; Friedlingstein, P.; Andrew, R.M.; Canadell, J.G.; Le Quéré, C.; Peters, G.P. Persistent Fossil Fuel Emissions Threaten the Paris Agreement and Planetary Health. Environ. Res. Lett. 2019, 14, 121001. [Google Scholar] [CrossRef] [Green Version]
  6. China Energy Statistical Yearbook; China Statistics Press: Beijing, China, 2020. Available online: https://data.cnki.net/area/Yearbook/Single/N2021050066?z=D20 (accessed on 16 July 2021).
  7. National Bureau of Statistics of the People’s Republic of China. China Statistical Yearbook. 2020. Available online: http://www.stats.gov.cn/ (accessed on 16 July 2021).
  8. Xia, C.; Li, Y.; Ye, Y.; Shi, Z.; Liu, J. Decomposed Driving Factors of Carbon Emissions and Scenario Analyses of Low-Carbon Transformation in 2020 and 2030 for Zhejiang Province. Energies 2017, 10, 1747. [Google Scholar] [CrossRef] [Green Version]
  9. Su, B.; Ang, B.W. Structural decomposition analysis applied to energy and emissions: Some methodological devel-opments. Energy Econ. 2012, 34, 177–188. [Google Scholar] [CrossRef]
  10. Wang, H.; Ang, B.W.; Su, B. Assessing drivers of economy-wide energy use and emissions: IDA versus SDA. Energy Policy 2017, 107, 585–599. [Google Scholar] [CrossRef]
  11. De Oliveira-De Jesus, P.M.; Galvis, J.J.; Rojas-Lozano, D.; Yusta, J.M. Multitemporal LMDI Index Decomposition Analysis to Explain the Changes of ACI by the Power Sector in Latin America and the Caribbean between 1990–2017. Energies 2020, 13, 2328. [Google Scholar] [CrossRef]
  12. Fujii, H.; Okamoto, S.; Kagawa, S.; Managi, S. Decomposition of toxicity emission changes on the demand and supply sides: Empirical study of the US industrial sector. Environ. Res. Lett. 2017, 12, 2328. [Google Scholar] [CrossRef] [Green Version]
  13. Olanrewaju, O.A. Multiplicative lmdi approach to South Africa’s industrial energy consumption. S. Afr. J. Ind. Eng. 2019, 30, 69–77. [Google Scholar] [CrossRef] [Green Version]
  14. Kharrazi, H.; Zahrai, S.M. Seismic evaluation of self-centering energy dissipating braces using fragility curves. Steel Compos. Struct. 2020, 37, 679–693. [Google Scholar]
  15. Wang, H.; Zhou, P. Assessing Global CO2 Emission Inequality from Consumption Perspective: An Index Decomposition Analysis. Ecol. Econ. 2018, 154, 257–271. [Google Scholar] [CrossRef]
  16. Ang, B.W. Decomposition analysis for policymaking in energy: Which is the preferred method? Energy Policy 2004, 32, 1131–1139. [Google Scholar] [CrossRef]
  17. Fernandez Gonzalez, P.; Landajo, M.; Presno, M.J. Multilevel LMDI decomposition of changes in aggregate energy consumption. A cross country analysis in the EU-27. Energy Policy 2004, 68, 576–584. [Google Scholar] [CrossRef]
  18. Kaltenegger, O.; Loeschel, A.; Pothen, F. The effect of globalisation on energy footprints: Disentangling the links of global value chains. Energy Econ. 2017, 68, 148–168. [Google Scholar] [CrossRef] [Green Version]
  19. Li, H.; Shahbaz, M.; Jiang, H.; Dong, K. Is Natural Gas Consumption Mitigating Air Pollution? Fresh Evidence from National and Regional Analysis in China. Sustain. Prod. Consum. 2021, 27, 325–336. [Google Scholar] [CrossRef]
  20. Pu, Z.; Fu, J.; Zhang, C.; Shao, J. Structure decomposition analysis of embodied carbon from transition economies. Technol. Forecast. Soc. Chang. 2018, 135, 1–12. [Google Scholar] [CrossRef]
  21. Ang, B.W. The LMDI approach to decomposition analysis: A practical guide. Energy Policy 2005, 33, 867–871. [Google Scholar] [CrossRef]
  22. Ramachandra, T.V. Shwetmala, Decentralised carbon footprint analysis for opting climate change mitigation strategies in India. Renew. Sustain. Energy Rev. 2012, 16, 5820–5833. [Google Scholar] [CrossRef]
  23. Chong, C.; Ma, L.; Li, Z.; Ni, W.; Song, S. Logarithmic mean Divisia index (LMDI) decomposition of coal consumption in China based on the energy allocation diagram of coal flows. Energy 2015, 85, 366–378. [Google Scholar] [CrossRef]
  24. Shao, S.; Yang, L.; Gan, C.; Cao, J.; Geng, Y.; Guan, D. Using an extended LMDI model to explore techno-economic drivers of energy-related industrial CO2 emission changes: A case study for Shanghai (China). Renew. Sustain. Energy Rev. 2016, 55, 516–536. [Google Scholar] [CrossRef] [Green Version]
  25. Lin, B.Q.; Xu, M.M. Quantitative assessment of factors affecting energy intensity from sector, region and time perspectives using decomposition method: A case of China’s metallurgical industry. Energy 2019, 189, 116280. [Google Scholar] [CrossRef]
  26. Andres, L.; Padilla, E. Energy intensity in road freight transport of heavy goods vehicles in Spain. Energy Policy 2015, 85, 309–321. [Google Scholar] [CrossRef] [Green Version]
  27. Lin, B.; Long, H. Emissions reduction in China’s chemical industry—Based on LMDI. Renew. Sustain. Energy Rev. 2016, 53, 1348–1355. [Google Scholar] [CrossRef]
  28. Kim, S. LMDI Decomposition Analysis of Energy Consumption in the Korean Manufacturing Sector. Sustainability 2017, 9, 202. [Google Scholar] [CrossRef] [Green Version]
  29. Malla, S. CO2 emissions from electricity generation in seven Asia-Pacific and North American countries: A decomposition analysis. Energy Policy 2010, 38, 6387. [Google Scholar] [CrossRef]
  30. Zhang, M.; Mu, H. Research on the Change of Motorized Passenger Transport Energy Consumption in Selected Chinese Cities Based on LMDI Method. Acta Sci. Nat. Univ. Pekin. 2010, 46, 483–486. [Google Scholar]
  31. Mousavi, B.; Lopez, N.S.A.; Manuel Biona, J.B.; Chiu, A.S.F.; Blesl, M. Driving forces of Iran’s CO2 emissions from energy consumption: An LMDI decomposition approach. Appl. Energy 2017, 206, 804–814. [Google Scholar] [CrossRef]
  32. Moutinho, V.; Madaleno, M.; Inglesi-Lotz, R.; Dogan, E. Factors affecting CO2 emissions in top countries on renewable energies: A LMDI decomposition application. Renew. Sustain. Energy Rev. 2018, 90, 605–622. [Google Scholar] [CrossRef] [Green Version]
  33. Xia, Q.W.; Wang, H.L.; Liu, X.Z.; Pan, X.Z. Drivers of global and national CO2 emissions changes 2000–2017. Climate Policy 2021, 21, 604–615. [Google Scholar] [CrossRef]
  34. Kaya, Y. Impact of Carbon Dioxide Emission Control on GNP Growth: Interpretation of Proposed Scenarios; Intergovernmental Panel on Climate Change/Response Strategies Working Group, 1989; Volume 13, pp. 20–33. [Google Scholar]
  35. Ang, B. Is the energy intensity a less useful indicator than the carbon factor in the study of climate change? Energy Policy 1999, 27, 943–946. [Google Scholar] [CrossRef]
  36. Wei, Y.; Liao, H. China Energy Report; Energy efficiency research; Science Press: Beijing, China, 2010. [Google Scholar]
  37. Hulten, C.R. Divisia Index Numbers. Econometrica 1973, 41, 1017–1025. [Google Scholar] [CrossRef]
  38. Sato, K. The Ideal Log-Change Index Number. Rev. Econ. Stat. 1976, 58, 223–228. [Google Scholar] [CrossRef]
  39. Törnqvist, L. The Bank of Finland’s Consumption Price Index. Bank Finl. Mon. Bull. 1936, 16, 27–32. [Google Scholar]
  40. Vartia, Y.O. Ideal Log-Change Index Numbers. Scand. J. Stat. Theory Appl. 1976, 3, 121–126. [Google Scholar]
  41. Hong, J.; Gu, J.; Liang, X.; Liu, G.; Shen, G.Q.; Tang, M. Spatiotemporal investigation of energy network patterns of agglomeration economies in China: Province-level evidence. Energy 2019, 187, 115998. [Google Scholar] [CrossRef]
  42. Li, H.; Jiang, H.-D.; Dong, K.-Y.; Wei, Y.-M.; Liao, H. A comparative analysis of the life cycle environmental emissions from wind and coal power: Evidence from China. J. Clean. Prod. 2020, 248, 119192. [Google Scholar] [CrossRef]
  43. Xia, H.; Ding, L.; Yang, S.; Wu, A. Socioeconomic factors of industrial air pollutants in Zhejiang Province, China: De-coupling and Decomposition analysis. Environ. Sci. Pollut. Res. 2020, 27, 28247–28266. [Google Scholar] [CrossRef]
  44. Yan, X.; Ge, J.; Lei, Y.; Duo, H. China’s low-carbon economic transition: Provincial analysis from 2002 to 2012. Sci. Total Environ. 2019, 650, 1050–1061. [Google Scholar] [CrossRef] [PubMed]
  45. Zheng, J.; Jiang, P.; Qiao, W.; Zhu, Y.; Kennedy, E. Analysis of air pollution reduction and climate change mitigation in the industry sector of Yangtze River Delta in China. J. Clean. Prod. 2016, 114, 314–322. [Google Scholar] [CrossRef]
  46. Liao, H.; Wang, C.; Liu, Y.; Gao, Y.; Wang, F. Revision on China’s energy data by sector and fuel type at provincial level. Energy Effic. 2018, 12, 849–861. [Google Scholar] [CrossRef]
  47. Warner, K.J.; Jones, G.A. The 21st Century Coal Question: China, India, Development, and Climate Change. Atmosphere 2019, 10, 476. [Google Scholar] [CrossRef] [Green Version]
  48. Taylor, J.; Symonds, P.; Wilkinson, P.; Heaviside, C.; Macintyre, H.; Davies, M.; Mavrogianni, A.; Hutchinson, E. Estimating the Influence of Housing Energy Efficiency and Overheating Adaptations on Heat-Related Mortality in the West Midlands, UK. Atmosphere 2018, 9, 190. [Google Scholar] [CrossRef] [Green Version]
Figure 1. Energy consumption by industry in Zhejiang Province (2015, 2020). Data source: CEIC and author.
Atmosphere 12 01196 g001
Figure 2. Energy consumption of Zhejiang province from 2010 to 2019. Note: Data are calculated on the basis of the 2011–2020 Zhejiang Statistical Yearbook and Zhejiang Statistical Bulletin.
Atmosphere 12 01196 g002
Figure 3. Zhejiang energy-consuming product output and GDP index (2000–2017). Data source: Zhejiang Statistical Database, CEIC, and author.
Atmosphere 12 01196 g003
Figure 4. Cumulative contribution of energy consumption influencing factors in Zhejiang province. Data source: Authors’ calculations.
Atmosphere 12 01196 g004
Figure 5. Decomposition results of energy consumption per unit of added value in major industrial sectors in Zhejiang (2015–2020). Data source: authors’ calculations.
Atmosphere 12 01196 g005
Table 1. LMDI method in the field of energy and environment.
AuthorCountry/RegionSectorResearch
Malla (2009)7 countriesElectricityCO2
Zhang (2010)Some cities in ChinaTrafficEnergy
Fernandez (2014)European UnionAll sectorsEnergy
Andres (2015)SpainTrafficEnergy
Chong (2015)ChinaCoalEnergy
Lin (2016)ChinaChemicalCO2
Shao (2016)ShanghaiAll sectorsCO2
Mousavi (2017)IranAll sectorsCO2
Kim (2017)South KoreaManufacturingCO2
Moutinho (2018) European UnionAll sectorsCO2
Xia (2020)138 countries All sectorsCO2
Data source: Authors’ calculations [17,23,24,26,27,28,29,30,31,32,33].
Table 2. Meaning of the variables in LMDI model.
VariableSymbolMeaning
energy structureSdifferent types of consumption/energy consumption
energy intensityIenergy consumption/GDP
economic effectAGDP/population
populationPpopulation
Table 3. The impact of various factors on energy consumption in Zhejiang Province from 2010 to 2019.
YearFactors (million tce)Total (million tce)
Energy Structure Energy IntensityEconomic EffectPopulation
2010–20110−5.3213.731.219.62
2011–20120−11.3213.130.682.49
2012–20130−8.8313.4110.55.64
2013–20140−11.8512.4612.51.86
2014–20150.01−6.9414.220.567.84
2015–20160−7.9513.071.536.66
2016–20170.01−7.9613.541.967.54
2017–2018 0.01−8.1912.821.816.45
2018–20190−7.3112.771.717.18
Data source: Authors’ calculations. Notes: Column year represents the amount of energy consumption change in two years. For example, 2010–2011 represents the amount of energy consumption change from 2010 to 2011.
Table 4. Decomposition proportions of energy consumption factors in Zhejiang Province from 2010 to 2019.
Year Δ E s Δ E I Δ E A Δ E P
2010–20110.00−0.551.430.13
2011–20120.00−4.555.280.27
2012–20130.00−1.572.380.19
2013–20140.00−6.376.700.67
2014–20150.00−0.891.810.07
2015–20160.00−1.191.960.23
2016–20170.00−1.061.800.26
2017–20180.00−1.271.990.28
2018–20190.00−1.021.780.24
Data source: Authors’ calculations. Notes: Column year represents the proportions of energy change in two years. For example, 2010–2011 represents the proportions of energy consumption change from 2010 to 2011.
Publisher’s Note: MDPI stays neutral with regard to jurisdictional claims in published maps and institutional affiliations.

