Abstract
Current studies report inconsistent results about the impacts of Saharan dust on the development of African Easterly Waves (AEWs), the African Easterly Jet (AEJ), and tropical cyclones (TCs). We present a modeling case study to further elucidate the direct radiative impacts of dust on the early development stage of a TC. We conducted experiments using the Weather Research and Forecasting model coupled with chemistry (WRF-Chem-V3.9.1) to simulate Hurricane Earl (2010) which was influenced by the dusty Saharan Air Layer (SAL). We used the aerosol product from ECMWF MACC-II as the initial and boundary conditions to represent aerosol distribution, along with typical model treatment of its radiative and microphysical effects in WRF. Our simulations at 36-km resolution show that, within the first 36 h, the presence of dust weakens the low-pressure system over North Africa by less than 1 hPa and reduces its mean temperature by 0.03 K. Dust weakens and intensifies the AEJ at its core and periphery, respectively, with magnitudes less than 0.2 m/s. Dust slightly shifts the position of 600 hPa AEW to the south and reduces its intensity prior to impacting the TC. Finally, TC with dust remains weaker.
1. Introduction
Over the eastern Atlantic Ocean, tropical convective systems such as tropical cyclones (TCs), African Easterly Jet (AEJ), and African Easterly Waves (AEWs) interact with each other, and they can be potentially influenced by the Saharan Air Layer (SAL) and its accompanying dust aerosols. SAL is characterized as an elevated layer of warm, dry, and dusty air from North Africa that usually forms from the late Northern Hemisphere spring to early fall. Under the influence of the easterly wind, the air mass from the Saharan desert moves westward off the North African coast and further spans to a large region in the Atlantic Ocean. SAL can interact with AEWs [1] and Atlantic tropical cyclones [2]. Studies have shown that dust particles inside SAL affect the tropical convective systems by direct (radiative) effect and indirect (microphysical) effect.
The radiative forcing of dust varies at different altitudes. Within the dust layer, dust absorbs the incoming shortwave radiation (SW) and heats the atmosphere [3,4,5]. Dust enhances the longwave radiative (LW) cooling within the dust layer because it emits more LW than it absorbs [6]. The total effect of SW and LW is positive in the dust layer [6,7], although it can be negative at some levels. Below the dust layer in the lower atmosphere, the dust LW radiative forcing is positive because dust emits LW downward [6]. At the surface, the dust SW radiative forcing is negative because it scatters and absorbs the SW and reduces the incoming radiation reaching the earth’s surface [8]. At the top of the atmosphere (TOA), dust SW radiative forcing is generally negative over dark surfaces (e.g., ocean) [6,8]. Over a bright surface (e.g., desert, snow, and ice), its effect can be positive [7,9] or negative [9]. As a result, there are some uncertainties about the overall dust direct effect. The refractive index of the dust, the underlying surface albedo, the solar zenith angle, and other factors all impact the sign of this forcing.
Many studies reported that dust has a negative impact on the development of TCs. Firstly, the negative impact is due to the dust radiative effect [2,10,11,12]. As dust absorbs the SW radiation, the low-level temperature inversion in SAL is enhanced. Such increased stability is less favorable to convective development. The warm temperature anomaly also increases the vertical wind shear which suppresses TC development. In addition, the sea-surface temperature (SST) is cooler because dust reduces solar insolation at the ocean surface. Cooler SST is also less favorable to the development of TCs. Secondly, dust microphysical effect can be negative to the development of TCs as well [13,14]. Such negative impacts can be explained by the convective invigoration effect at the outer rainbands of TCs [15].
The dust effect on the development of AEW can be negative or positive in different studies. Some studies showed that dust radiative effect negatively impacts AEWs [16,17]. The mechanism is similar to the dust radiative effect on TCs as explained above. Conversely, some studies revealed that dust positively impacts AEWs. Dust direct effect increases the conversion from zonal and eddy available potential energy to eddy kinetic energy [18], and it increases the barotropic and baroclinic energy conversion [19,20]. Hosseinpour and Wilcox (2014) [21] found that dust aerosol optical depth (AOD) is positively correlated with the downstream AEW and negatively correlated with the upstream waves. Lavaysse et al. (2011) [22] showed that dust can strengthen the west African heat low (part of the wave system) by direct effect and intensify AEW and AEJ by indirect effect. Dust direct radiative effect changes the temperature gradient and shifts AEJ to the north [23], and it strengthens AEJ at the southern edge of the dust layer [24].
In light of the above discussion, the effects of dust on the development of AEW, AEJ, and TC are still not fully understood. Firstly, as shown before, some studies investigate the dust effect on these weather systems separately. However, these weather systems interact with each other. It is possible that dust impact on one system could affect the other. For example, if a TC is developed from AEW, and AEW is triggered by AEJ, it is ideal to study the dust impact on all three systems together. Secondly, some important physical processes were ignored in the models utilized in the previous studies. For example, Zhang et al. (2007) [25] ignored the warmness and dryness features of SAL and assigned a dust distribution and an average sounding profile. In summary, the non-linear interactions between dust, cloud, and tropical systems are complex, and significantly confounds such findings. There are still relatively few papers that focus on the impact of Saharan dust on the early development of TC, including the evolution of AEW and AEJ.
Here, we approach the problem by first addressing a couple of limitations in some previous studies. In particular, we elucidate the impact of dust within SAL on tropical weather systems by (a) using realistic initial and boundary conditions of the atmosphere, which can be obtained from existing global model datasets; and (b) using a meteorological model that is coupled with an online chemistry/aerosol module to treat accordingly the interactions between aerosols and meteorology. Both radiative and microphysical effects are included in the model. However, we especially focus on the dust radiative effect in this study and its first-order impact on AEW, AEJ, and the early development of TC. Particularly, we use Hurricane Earl (2010) at its early stage as our case study. Its early development consists of a disturbance and a surface low-pressure system over North Africa, a closed circulation over the ocean, a tropical depression, and a tropical storm. For convenience, if not specified, we use ‘tropical cyclone’ (TC) as a general term of the system when it moves over the ocean regardless of its intensity. Given that Earl (2010) was relatively weak at the early stage and collocated with dust, we anticipate that dust may have played a bigger role in altering its evolution.
The outline of this paper is as follows: First, in Section 2.1, we describe the coupled meteorological model with chemistry/aerosol (WRF-Chem), including model domain, initial and boundary conditions, and key model schemes (physics, chemistry, and emissions) that we used for this study. In Section 2.2, we describe the datasets and methods used for the model evaluation. We introduce Hurricane Earl and the experimental design in Section 2.3, followed by the model evaluation of simulated meteorology and aerosols in Section 3.1. The dust radiative effects are described in detail in Section 3.2. Section 4 presents our summary and discussion.
2. Materials and Methods
2.1. Model
We used WRF-Chem-V3.9.1 to simulate the development of Hurricane Earl and assess the impact of dust within SAL on Earl. WRF-Chem has been used to study aerosol direct and indirect effects [3,26,27,28]. Our configuration used the ARW dynamical solver [29] and included the treatment of atmospheric chemistry and aerosols [30]. Mineral dust and other aerosols, as well as their interactions with meteorology, are represented in this model. This configuration offered us an opportunity to simulate a 4-D representation of the atmospheric states including physics and chemistry simultaneously, and potentially improve our mechanistic understanding of the coupled nature of meteorological and aerosol processes. Meteorological initial and boundary conditions for the model were taken from NCEP FNL Operational Global Analysis data. The boundary conditions of our simulations derived from FNL data were updated every 6 h in the simulation.
The main model physics options that we used comprised of the following: Rapid Radiative Transfer Model for Global Climate Models (RRTMG) schemes for both longwave and shortwave radiation [31], New Grell cumulus scheme [32], the revised MM5 Monin-Obukhov surface layer scheme [33], the Unified Noah land surface model [34], the Yonsei University (YSU) Planetary Boundary Layer scheme [35], and the Morrison double-moment microphysics scheme [36]. Choosing the Morrison double-moment microphysics scheme was important because it is reported to be capable of representing the mass and number concentrations of hydrometeors [37], which is critical in reasonably accounting for dust microphysics effects.
The CBM-Z chemical mechanism [38] is used for gas-phase chemistry. We also used the Model for Simulating Aerosol Interactions and Chemistry (MOSAIC) for aerosols [39]. MOSAIC is implemented into WRF-Chem [40]. This scheme treats major aerosol species such as sulfate, nitrate, chloride, carbonate, black carbon, primary organic mass, and other inorganic mass (OIN). Dust is considered as OIN in this scheme. The aerosol size distribution in MOSAIC is represented based on a sectional approach. There are 8 bins, and each bin has its upper and lower diameters. They are 0.039~0.078, 0.078~0.156, 0.156~0.312, 0.312~0.625, 0.625~1.25, 1.25~2.5, 2.5~5, 5~10 µm. Each bin is assumed to be internally mixed, which means that all particles in each bin have the same chemical components. WRF-Chem with the MOSAIC 8-bin aerosol scheme has successfully simulated aerosol processes in previous studies [3,27].
The aerosol direct effect is included in the WRF-Chem model. RRTMG radiation scheme has been coupled to the MOSAIC aerosol module to include radiation feedback from aerosols [41]. Each chemical component has a specific refractive index, which depends on the wavelength and the chemical composition. For dust aerosols, the default value of the refractive index for shortwave radiation is used, which is 1.55 + 0.003i. The overall refractive index for a given size bin is calculated by volume averaging all the refractive indices of all the chemical components. By using Mie theory, the aerosol optical properties such as extinction efficiency, scattering efficiency, and intermediate asymmetry factor are then determined and are passed to the radiation scheme to calculate direct forcing [40]. Aerosol–cloud interaction can be studied by connecting MOSAIC and microphysics schemes such as the Morrison double-moment scheme. The aerosol activation and resuspension modules in the model describe aerosol size distribution and composition, which then determine cloud condensation nuclei (CCN) [27].
Dust particles are mobilized by wind. This mobilization is represented in the model using a dust scheme based on Georgia Tech/Goddard Global Ozone Chemistry Aerosol Radiation and Transport (GOCART) [42]. WRF-Chem adopted this scheme for an ‘on-line’ mode calculation [3]. It has been a common practice to tune dust emissions to match the observation through sensitivity experiments. In particular, the constant factor in the dust flux equation can be tuned [3,43]. By conducting a simulation for 54 h in a small domain over North Africa (10° W~10° E, 15~25° N), we found that the simulation with a constant of 0.5 produced the closest match to the dust AOD from MACC-II. Similarly, the emission rate for sea salt can be adjusted in the flux equation. The constant in the flux equation for sea salt is reduced from 1.0 to 0.8 to match the sea salt AOD from MACC-II over the ocean. Other studies also suggested that the WRF-Chem model tends to overestimate sea salt [28].
We used the aerosol output from MACC-II (Monitoring Atmospheric Composition and Climate, version 2) [44] for initial and boundary conditions (IC/BC) of the aerosols in WRF-Chem. MACC-II is a successor of the Global and Regional Earth-System Monitoring using Satellite and in-situ data (GEMS) and MACC [45]. It provides the pre-operational atmospheric environmental service of Copernicus (CAMS) now at ECMWF. MACC-II has two main components. It uses the MOZART chemical transport model (CTM) [46] (version 3.5) as its chemical mechanism coupled with the ECWMF Integrated Forecast System (IFS). The transport and data assimilation of the species (both gases and aerosols such as dust, sea salt, black carbon, organic carbon, and sulfate, among others) take place in IFS, while the whole chemical system is calculated in MOZART [47]. The GEMS version of the aerosol forecast from IFS has been validated against observations from AERONET, MODIS, and CALIPSO [48]. MODIS AOD retrievals were assimilated into the IFS to improve the background and produce a better aerosol forecast [49]. Following GEMS, in MACC, a coupled MOZART-IFS system was built in which IFS and CTM run in parallel exchanging information every hour. IFS has an 80-km horizontal resolution, while the CTM has 1.125° × 1.125° resolution to reduce computing time with the addition of chemistry. Both models have 60 vertical levels up to 0.1 hPa [45]. The model has been validated, and its dust reanalysis has been evaluated over North Africa using AOD from a variety of observations [50]. The modeled AOD shows good agreement with observations spatiotemporally. MACC-II is an updated product of MACC including an improvement of the MODIS bias correction [44]. Some numerical studies have used MACC and MACC-II aerosol output as their model initial and boundary conditions to improve the analysis [51,52,53].
In the reanalysis product from MACC-II, AOD is mainly from dust, sea salt, black carbon, organic carbon, and sulfate. In this study, dust aerosols were converted from 3 bins in MACC-II to MOSAIC 8 bins in WRF-Chem (Figure S1). Black carbon, organic carbon, and sulfate were assumed to follow lognormal distributions in MACC-II [51], and they were re-distributed into MOSAIC 8 bins in WRF-Chem (Table S1). Details on the conversion method can be found in the Supplemental Material. For sea salt, on the other hand, we did not use the output from MACC-II as IC/BC, rather we only used the sea-salt emission parametrization in WRF-Chem. From our preliminary experiments, when the sea salt from MACC-II as IC/BC along with sea salt emissions from the WRF-Chem parametrization are used, the simulations produce significantly higher sea salt AOD compared to the sea salt AOD from MACC-II. Some studies also found that MACC tends to overestimate sea salt [28]. We adopted their approach in our model configuration, in which sea salt IC/BC were excluded from the conversion.
2.2. Datasets
2.2.1. Meteorological Datasets
We used the data (HURDAT2) from the National Hurricane Center (NHC) to verify the performance of our simulations in terms of track and intensity of the cyclone. The datasets contain tropical cyclone center locations, the minimum sea-level pressure, and the maximum surface wind speed. For comparison, the position of the system in our simulation is defined by the location of the minimum sea-level pressure, and then the positions are connected to form the track. We used the definition from NHC to obtain the track forecast error and intensity forecast error of our simulations (see https://www.nhc.noaa.gov/verification/verify2.shtml, accessed on 6 September 2021). We also defined relative error by calculating the percentage change in these errors over the baseline (an experiment we picked as a reference) to normalize the forecast errors using the same formula in [54]. That is,
where is the error of the baseline model and is the error of the forecast being evaluated. A positive number indicates the forecast is better than the baseline. To evaluate the overall skills of the forecast within a forecast period, we averaged the errors within a specified time window for different experiments. We then compared them to evaluate the forecast skills of different simulations.
The vertical profiles from radiosonde measurements in the study region were taken from the University of Wyoming. They are used to verify the vertical structure of the atmosphere in our simulations. The locations of the radiosonde observations are shown in Figure 1a.
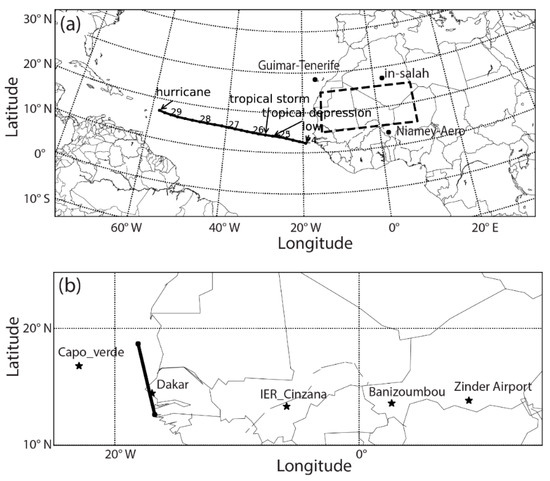
Figure 1.
Panel (a) shows the WRF domain, the best track from the National Hurricane Center in the US (NHC), and the locations of radiosondes. The numbers beside the best track indicate the corresponding dates of the positions of tropical cyclone (TC) in August 2010. The box over North Africa (15~25° N, 15° W~10° E) indicates the area where the horizontal averages of the variables are taken in Section 3. Panel (b) shows the locations of the AERONET sites. The line corresponds to the position of the cross-section at 1400 UTC 23 August 2010, where the modeled AOD is compared with the CALIPSO data.
The FNL Operational Global Analysis data used as the meteorological initial and boundary conditions for the simulations. Its horizontal resolution is 1° × 1°. In addition, it was used to assess the evolution of the AEWs, the AEJ, and the surface low-pressure system in the simulations before a TC was formed because the best track data were not available during that period.
2.2.2. Aerosol Datasets
The NASA Aerosol Robotic Network (AERONET) is a global network of sun/sky radiometers that is monitoring AOD. The version 3 level 2.0 product was used in our study to validate the model forecast of AOD. This product was pre-field and post-field calibrated, cloud-screened, and quality-assured [55]. The uncertainty of the AERONET AOD is estimated to be between 0.01 to 0.02. Figure 1b shows the AERONET sites in this study. Because the model simulates AOD at 550 nm, we interpolated the AERONET AODs at 440 nm and 675 nm to obtain AERONET AOD at 550 nm. We noted that AERONET AOD represents the total AOD from all aerosol contributions. The modeled total AOD was compared to AERONET AOD at every hour as the output frequency of our simulation was 1 h. However, since the observation time of AERONET measurement was not exactly at the 1-h time (0100 UTC, 0200 UTC, etc.), we defined a time window (±30 min) every 1 h. An observation within the time window and closest to the 1-h time was treated as the observation at that 1-h time.
The Moderate Resolution Imaging Spectroradiometer (MODIS) provides aerosol optical thickness and aerosol size parameters over both land and ocean globally [56]. It covers a relatively large area that is appropriate for this study region. Similar to [57], in our study the combined dark target and deep blue product (DB + DT) from Terra/Aqua Level 3 daily joint aerosol/water vapor/cloud product (Collection 6.1) was used to verify the horizontal distribution of modeled AOD. Compared to AERONET, the median bias of this product was −0.014 and the RMSE was 0.11 on a global average [58].
The Cloud-Aerosol Lidar and Infrared Pathfinder Satellite Observation (CALIPSO) combines an active lidar instrument with passive infrared and visible imagers to probe the vertical structure and properties of thin clouds and aerosols over the globe [59]. The retrievals include the extinction coefficient, attenuated backscatter, depolarization ratio, and backscattering color ratio data. It was used in this study to verify the vertical distribution of the aerosol in our model forecast.
2.3. Case Overview and Experimental Design
Earl developed from a tropical wave that departed the west coast of Africa on 23 August 2010, as reported by the NHC [60]. It became a tropical cyclone on the 24th, a tropical depression and a tropical storm on the 25th, and finally a hurricane on the 29th (Figure 1a). While its genesis was well-anticipated, many forecast models produced northward biased forecasts: 377 km to 769 km at 120h [60]. It was under the influence of SAL when it was located in the central and eastern Atlantic [60]. The combined Dry Air/SAL images shown in Figure 2 suggest that the SAL signal was significant on the west African coast. On 24 August 2010, the tropical cyclone was located to the west of the African coast (Figure 2a). At the same time, the SAL was located on its north side. One day later on the 25th, SAL extended further to the west, and it began to wrap around Earl as it moved to the west side of Earl (Figure 2b). On the 26th, the ‘wrap up’ process was intensified as the leading edge of SAL moved to the south side of Earl (Figure 2c). On the 27th, the ‘wrap up’ process weakened as the SAL signal around Earl was weaker, especially on the west and north side (Figure 2d). Despite the weakening signal on the northwest side of Earl, the Saharan dust was observed with the LASE lidar onboard the NASA DC-8 flight in the environment of Earl throughout its life cycle [61]. Thus, it is reasonable to expect that SAL might have impacted the formation and development of Earl.
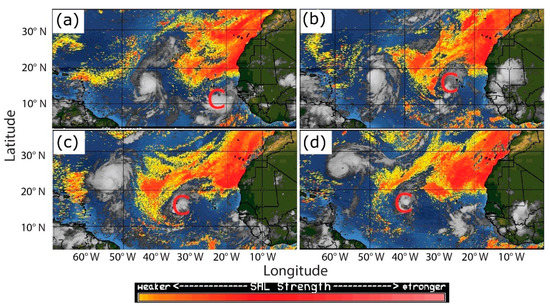
Figure 2.
Dry Air/Saharan Air Layer Product from CIMSS/University of Wisconsin-Madison at (a) 0000 UTC 24, (b) 0000 UTC 25, (c) 0000 UTC 26, (d) 0000 UTC 27 August 2010. The letter ‘C’ in the figure indicates the position of the cyclone.
The model domain is shown in Figure 1a. The model has 57 vertical layers up to 10 hPa. The horizontal grid resolution is 36 km. There are 376 (longitudinal) × 163 (latitudinal) horizontal grid points. This domain covers most of the African continent and the tropical Atlantic basin. Our main purpose was to capture the dust mobilization in the Saharan desert, transport of SAL and dust to the Atlantic, and the life cycle of Hurricane Earl along with the AEWs and AEJ in the region. Since we mainly focused on the dust radiative effect on the low-pressure system, AEW, and AEJ when they are over relatively dry North Africa at the early stage of Earl, this resolution is reasonable. In addition, a 36-km resolution was used for computational expediency given that the spatial domain is relatively large. In a future paper, we will report the results of using a 4-km resolution nested domain when the system moves to the ocean where the dust microphysical effect is thought to dominate.
To conduct our sensitivity tests of the impact of aerosols on the tropical systems, we first carried out a WRF simulation excluding chemistry. The model is the WRF-Chem version with the physics schemes described in Section 2.1, but the chemistry options were turned off. This served as our control experiment. Many previous studies simulated Earl after it became a cyclone at 0000 UTC 24 August 2010 since they mainly investigated its activity at a later stage [62,63,64]. However, in our study, we must initialize the model much earlier to study how dust plays a role in its early development. Since the model performance varies with different initial times, a series of experiments were carried out to choose a suitable initial time for the control experiment. The model was initialized every 12 h from 1200 UTC 19 August to 0000 UTC 23 August. Each simulation ran for 5 days. We noted that better track forecasts over the ocean compared to the best track were generally achieved when the model was initialized later. However, if we initialized the model too late, although the track error might be smaller, we could not analyze whether the modeled dust influences AEW and the surface low-pressure system over North Africa. Conversely, if we initialized the model too early, the simulation may have a large track error over the ocean that is not suitable for studying the impact of dust on TC. We took the average of the track errors and intensity errors across all experiments and found that the errors from the simulation initialized at 1200 UTC 21 were closest to the mean errors of all experiments. At this time, the AEWs and the surface low-pressure system were still over North Africa, and the dust in the model had approximately two days to potentially impact the system. As a result, we chose the model initialized at 1200 UTC on 21st August as our control experiment (ExC) (Table 1).

Table 1.
The configuration of the simulations. Other aerosols include black carbon, organic carbon, sea salt, and sulfate. The values in the start time column indicate day and hour. For example, 2112 indicates at 1200 UTC on 21 August 2010.
Two additional experiments (ExO and ExDO) were based on the control experiment ExC, but the chemistry and aerosol representations were added to the simulation. They were used to study the dust direct effect. Both were initialized at the same time as ExC and ran for 5.5 days until 0000 UTC 27 August 2010. ExO was a WRF-Chem simulation with aerosols (black carbon, organic carbon, sea salt, sulfate, but no dust) included in the model’s initial and boundary conditions. In ExDO, dust and other aerosols mentioned above were all added to the model. By comparing the experiment ExO and ExDO, we can investigate the added effect of dust.
3. Results
3.1. Model Evaluation
Before analyzing the results, the model performance needs to be evaluated. We first compared the model forecasts with the best track. Following the direction of the movement of the cyclone, all three simulations had rightward biases compared to the best track after 0000 UTC 24 August (Figure 3a). We could not find the historical official forecast datasets that included the forecasts that started at the same time as our simulations. Most of the forecasts reported by NHC (OFCL) also show rightward bias tracks from 25 August to 4 September 2010 [60] (Figure S2). We especially note here that this is not a fair comparison as they initialized the forecasts later than ours. At 72 forecast hours, our simulations had smaller errors compared to the OFCL. However, the track errors of our forecasts increased gradually with time. At 96 h, our simulations had larger errors than OFCL. The simulated TCs were stronger compared to the best track data (Figure 3b,c), but the relative errors of maximum wind speed in our forecast at 72, 96, and 120 h show that our intensity forecasts were comparable to the OFCL forecast. Many factors may contribute to this overprediction. For example, interactions between the storm and its environment (including the ocean), and the cumulus parameterization scheme may have triggered too much convection.
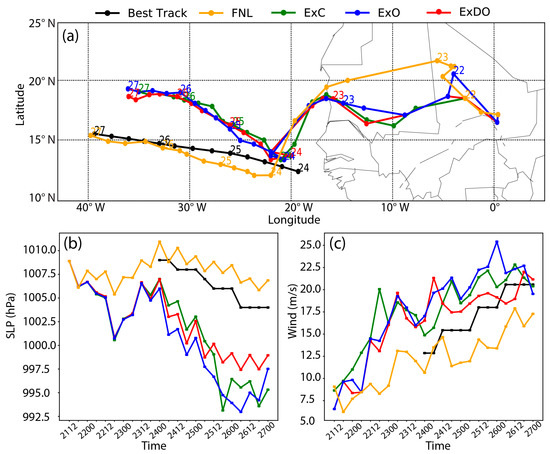
Figure 3.
(a) The tracks, (b) the minimum sea-level pressure (hPa), and (c) the maximum surface wind speed (m/s) of the convective system (including low-pressure system over Africa and tropical cyclone over the ocean) from the simulations (ExC, ExO, ExDO), FNL, and the best track dataset. The numbers nearby the tracks in (a) indicate the corresponding dates of the positions of the systems in August 2010. The labels on the x-axis in (b,c) indicate the times. For example, 2112 means 1200 UTC 21 August 2010. The time interval is 6 h.
Since the best track data is only available after the 24th, we used FNL to evaluate the performance of our simulations before the 24th. As the horizontal resolution of FNL is 1° × 1° and our resolution is 36 km, we also recognize that this is not an ideal comparison. Our simulations produced stronger low-pressure centers and leftward biased tracks before the 24th (Figure 3a). The mean errors of the maximum wind speed in ExC, ExO, and ExDO relative to FNL between 1200 UTC 21 and 1800 UTC 23 are 5 m/s, 4 m/s, and 3.7 m/s, respectively. The mean track errors are 417 km, 430 km, and 415 km, respectively, in the same period. The large track errors are because stronger low-pressure systems developed on the southwest in our simulations relative to the center of the low-pressure system in FNL (Figure S3). The low-pressure system at the surface was part of a complex convective system that had wave patterns at the upper levels. These waves are AEWs that can trigger convective systems over the ocean. They are significant at 600 hPa and 850 hPa levels. The 600 hPa AEWs in our simulation moved ahead of AEW in FNL and were slightly biased to the right (Figure S4b,c), which was opposite to the leftward bias of the low-pressure center at the surface. However, when TC was formed at 0000 UTC 24, the AEW aligned with the low-pressure at the surface and its track continued to be biased to the right. AEJ played a role in providing energy to the growth of AEW. The denser streamlines in ExDO indicate that AEJ was stronger than FNL (Figure S4). The position of the zonal average AEJ in our simulation is similar to FNL (not shown). Overall, the locations and evolutions of the low-pressure system, AEW, and AEJ in our simulations are qualitatively comparable to the FNL reanalysis, however, quantitatively, their intensities are all stronger.
Radiosonde observations from three stations were selected to validate whether the simulation can represent the atmosphere profile. Overall, the simulation produces comparable sounding profiles as the radiosonde observations on dry land (In-Salah station) (Figure S5a,b), relatively moist land (Niamey-Aero station), and over the ocean near the coast (Guimar-Tenerife station) (Figure S5c,d).
To quantify the impact of dust on these weather systems, we first verified that the model can reasonably simulate the aerosol distribution compared to observations. Figure 4 shows the time series of the modeled AOD and AERONET AOD. As shown in Figure 1b, the AERONET sites at Cabo Verde and Darkar are located in the western coastal region capturing mostly the dust outflows (with intermittently high AOD), while the other three sites are located near the Sahel region (around 15° N) where dust mobilization begins. Our results show that the modeled AOD from the ExDO experiment exhibits a similar magnitude as AERONET AOD. The correlation coefficients are high (0.72~0.96) and significant, which indicates reasonable temporal AOD representation in WRF-Chem.
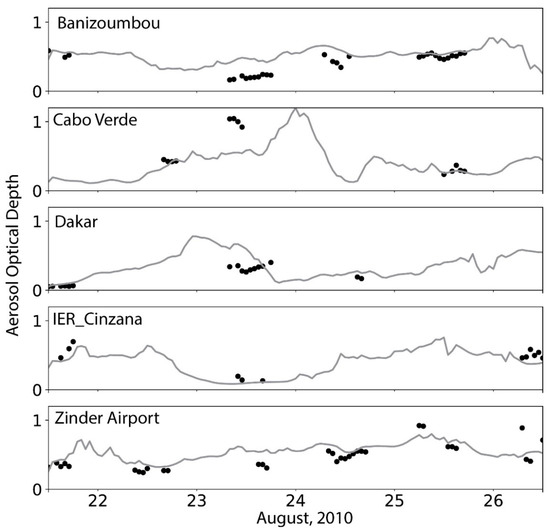
Figure 4.
Aerosol optical depth (AOD) at 550 nm from five AERONET sites (dots) superimposed (lines) by the corresponding simulated AOD from experiment ExDO from 1200 UTC 21 to 0000 UTC 27 August 2010. The locations of these sites are shown in Figure 1b.
The MODIS AOD product can show the horizontal distribution of AOD and the CALIPSO product can show the vertical distribution of the aerosols. The modeled AOD from ExDO at 1400 UTC from 22nd to 24th was selected (Figure 5b,e,h) to compare the MODIS AOD L3 daily product (Figure 5c,f,i). Since the Aqua satellite passed west Africa and the coastal region around 1400 UTC, we mainly focus on the AOD comparison over this region. Dust contributes to most AOD (Figure 5a,d,g). Over the north and west coast of Africa, although the modeled AOD is underestimated, its distribution generally matches the MODIS AOD. Next, we compared the cross-section of the dust aerosol extinction coefficient to the CALIPSO product (Figure S6). The dust aerosol extinction coefficient in the model is approximated by the difference between the total extinction coefficient in ExDO and ExO. It is shown that the vertical distributions of dust and other aerosols from the simulation generally match the CALIPSO data. At 1400 UTC 23, dust reaches 5.5 km height, slightly lower than the CALIPSO data. Other aerosols are concentrated below 2 km, similar to CALIPSO. The cross-sections at other times were also evaluated, and they show similar patterns.
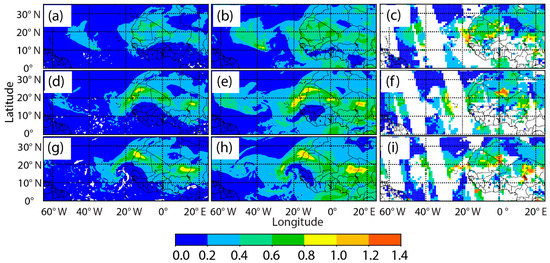
Figure 5.
Difference of AOD at 550 nm (ExDO − ExO) at (a) 1400 UTC 22, (d) 1400 UTC 23, and (g) 1400 UTC 24 August 2010. AOD from experiment ExDO at (b) 1400 UTC 22, (e) 1400 UTC 23, and (h) 1400 UTC 24 August 2010. AOD from MODIS Aqua L3 daily product (combined dark target and deep blue) on (c) 22, (f) 23, and (i) 24 August 2010.
In summary, although the model has errors, it can generally represent the large-scale environment, development of the tropical systems, and the evolution of the aerosols. With the model uncertainty in mind, we will continue to use the results from these simulations to elucidate the dust effects through sensitivity experiments.
3.2. Direct Radiative Effect of Dust
To understand how the dust radiative effect impacts the convective systems, we first analyzed its impact on the low-pressure system. The center of the low-pressure system was located at around (20° N, 0° E) at 1300 UTC 21 (Figure 6a), and then it moved to the coastline at 00UTC 23 (Figure 6g). To understand the dust effects, a specific region (Figure 1a) (15° W~10° E, 15° N~25° N) over North Africa was selected to obtain the domain-time averaged vertical profiles of variables from ExDO and ExO (Figure 7 and Figure 8). The time average was taken from 1300 UTC 21 to 0000 UTC 23 August 2010. We also showed in the Supplemental Material the evolution of these profiles (Figures S7 and S8). The rationale for choosing this region and period was: (1) the main part of the low-pressure system was within this domain from 1300 UTC 21 to 0000 UTC 23 before it moved to the ocean and became a TC; and (2) 15° N is the transition zone between the dry region in the north and moist region in the south, and dust emission source is in the dry region.
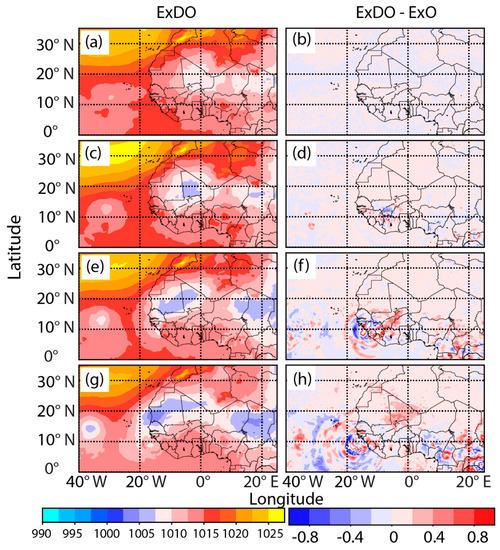
Figure 6.
Sea level pressure (hPa) from ExDO (left column) and the differences (ExDO − ExO) (right column) at (a,b) 1300 UTC 21, (c,d) 0000 UTC 22, (e,f) 1200UTC 22, and (g,h) 0000UTC 23 August 2011.
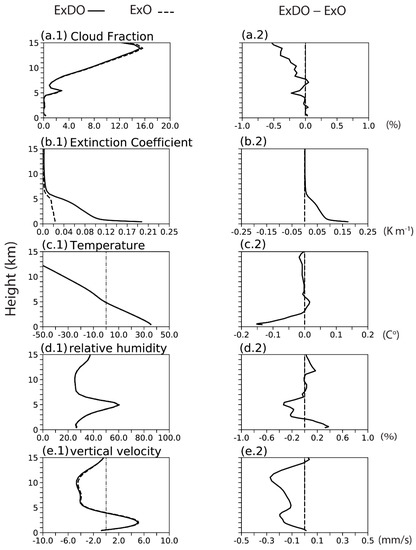
Figure 7.
Time-domain averaged vertical profiles of the cloud fraction (%), the extinction coefficient (km−1), the temperature (°C), the relative humidity (%), and the vertical velocity (mm/s). The domain where the averages are taken is indicated in Figure 1a. The average period is from 1300 UTC 21 to 0000 UTC 23 August 2010. The panels in the left column are from ExDO (solid line) and ExO (dash line). The panels in the right column are their differences (ExDO − ExO).
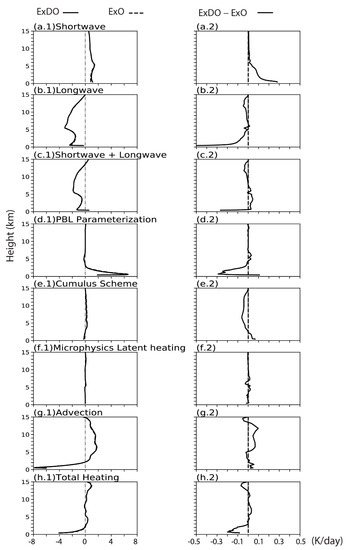
Figure 8.
Same as Figure 7, except they are the heating tendencies (K/day) from different processes: SW radiation, LW radiation, SW + LW radiation, PBL parameterization, cumulus scheme, microphysics latent heat, advection, and the sum of all heating tendencies.
Figure 7a.1 shows that the sky is cloud-free under 4 km. There are some clouds mainly on the south of the domain above 5 km (Figure S9). The extinction coefficient difference between ExDO and ExO (Figure 7b.2) indicates that the dust decreases with height. Firstly, the SW warming rate is stronger when dust is considered in the model (Figure 8a.2) because dust absorbs the SW radiation and heats the atmosphere. The maximum dust heating rate (0.3 K/day) is located at the lowest level, and it drops to almost zero above 10 km. In comparison, Huang et al. (2009) [7] and Zhu et al. (2007) [6] reported that the dust heating reaches a maximum at a higher level between 3~5 km because the dust concentration in their study reaches a maximum in that layer. The heating rates vary in different studies depending on the dust concentrations. For example, Zhao et al. (2010) [3] found an average SW heating rate of 0.5 ± 0.2 K/day in North Africa, while Huang et al. (2009) [7] reported 1~7 K/day in other regions. Secondly, the LW cooling rate becomes stronger when dust is added to the model (Figure 8b.2) because dust emits more LW than it absorbs [6]. The strongest cooling rate by dust is more than 0.5 K/day at the bottom. Increasing LW cooling in the dust layer is also observed in other studies (e.g., [7]). In comparison, the maximum cooling rate is around 0.4 K/day in [6] and 1.5 K/day in [7]. Thirdly, for the combined heating rate from both SW and LW radiation (Figure 8c.2), except at the bottom, the difference of SW + LW heating rate is positive, which indicates that the radiation cooling (SW + LW) is weaker because the SW warming effect by dust is stronger than its LW cooling effect. The maximum heating is around 0.05 K/day. Other studies [6,7,65] also reported such a warming effect by dust. In short, the dust impacts on the SW, LW, and SW + LW heating rates in our study are qualitatively similar to other studies. In terms of magnitudes, they are different because the results are influenced by the location and timing associated with these profiles, as well as the differences in the concentration, height, and refractive index of the dust.
We then analyzed the heating rate due to the boundary layer process. The planetary boundary layer (PBL) and the land surface processes are tied together [66]. PBL scheme computes the vertical transport of heat, water vapor, and momentum due to turbulent mixing [67]. As shown in Figure 8d.1, positive heating produced by the PBL scheme has a depth of around 3 km. The heating is caused by the sensible heat flux from the surface to the boundary layer during the daytime. At nighttime, the temperature change in the boundary layer due to the PBL process is relatively small (Figure S8d.2). When dust is added to the model (Figure 8d.2), the warming effect by the PBL process is reduced by a maximum of 0.3 K/day. This is a result of the reduced sensible heat flux from the surface to the lower atmosphere because of dust. The SW received at the surface is reduced when the dust is added to the model. Such reduction lowers the surface temperature by 0~1 °C in our case. As a result, the sensible heat flux is reduced. Other studies also reported that surface net radiation and sensible heat flux are reduced due to the absorption of SW by dust [68]. The temperature change due to the moisture process is analyzed through the heating rate from the cumulus scheme and microphysics scheme (Figure 8e,f). The heating rates from these schemes are negligible compared to other terms because the air is dry. Figure 8g.1 shows the temperature change due to advection. The advection includes horizontal advection and vertical advection. Horizontal advection will become smaller as the domain size is increased. The vertical advection includes vertical transport of heat (temperature) and the adiabatic cooling [10]. The advection warms the air above 2 km and cools it below. If we consider dust (Figure 8g.2), the difference of the temperature change due to the advection is positive below 3 km and above 5 km.
Total potential temperature tendency in the model includes the heating contributed from the SW, LW, PBL, cumulus convection, microphysical latent heat, and temperature advection. We sum up all these terms and show them in Figure 8h.1. After dust is added, the cooling below 2 km is stronger (Figure 8h.2). The stronger cooling is contributed by the stronger LW cooling and the weaker boundary layer warming after adding dust. The warming effects from other terms cannot compensate for such cooling effects. Above the boundary layer, the total heating rate is slightly increased. The total heating rate change induced by the dust changes the temperature. The air at around 3–6 km height is warmer, and it is cooler under 3 km (Figure 7c.2). Thus, the atmosphere is more stable and the development of convection is inhibited. Consequently, the upward motion is reduced (Figure 7e.2) and the cloud fraction is also decreased (Figure 7a.2). The stabilizing effect of dust is also mentioned in [5], in which dust reduces the downward radiative flux into the desert while increasing the heating in the atmosphere.
The vertical averages of the profiles we analyzed before are shown in Figure 9. When considering dust (Figure 9b,c), the biggest positive force by dust is in the SW, with a warming rate that is stronger by 4%. The LW radiation cooling is stronger by 3% but it cannot compensate for the warming by SW, as SW + LW cooling is weaker by 5%. The boundary heating is weaker by 5%. Advection cooling is weaker by 1%. The forcing caused by the moist process is relatively small compared to the above terms, and dust also causes minor changes. The total effect of adding dust is a reduction of the average temperature by 0.03 K.
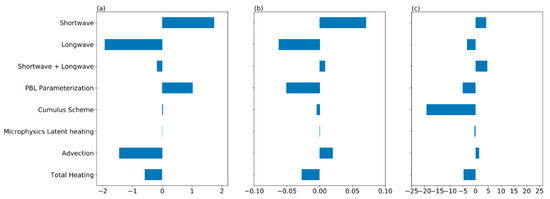
Figure 9.
The heating tendencies (K/day) from different processes, averaging over the domain (indicated in Figure 1a) and vertical levels from 1300 UTC 21 to 0000 UTC 23 August 2010. The heating tendencies are from (a) ExO, (b) the difference (ExDO − ExO), and (c) the percentage difference (100 ∗ (ExDO − ExO)/ExO)).
The sea-level pressure of the system is higher by less than 1 hPa after adding dust (Figure 6, right column). The dust impacts are summarized in Figure 10. During the daytime, dust reduces SW radiation to the surface by scattering and absorbing SW radiation. It leads to the reduction of surface temperature. Less energy received at the surface leads to the reduction of sensible heat flux from the surface to the atmosphere. The positive heating from the PBL process is thus reduced by 4%. At the same time, dust also enhances the LW radiation cooling by 5%. As a result, the mean temperature in the atmosphere is cooler. Meanwhile, negative forcing at the boundary and positive forcing above it stabilize the atmosphere, which contributes to the weakening of the low-pressure system.
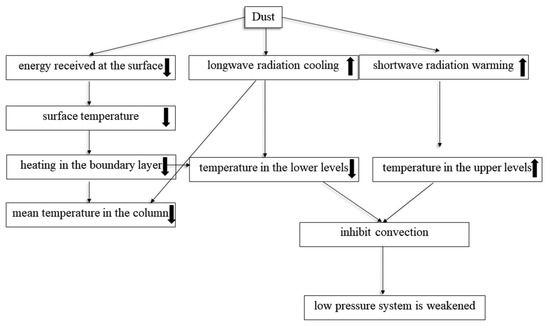
Figure 10.
A conceptual diagram to explain how the dust impacts the intensity of the low-pressure system over North Africa.
Hurricane Earl developed from an AEW disturbance. The origins of the AEW disturbances are believed to be generated by the instability of the AEJ over North Africa [69]. AEJ provides energy for the growth of AEW when AEW is over Africa. Therefore, any changes in AEJ caused by dust may potentially change AEW. When the zonal wind is averaged between 15° W and 10° E from 1300 UTC 21 to 0000 UTC 23, the AEJ core can be identified around 600 hPa and 12–15° N, with maximum wind speeds larger than 18 m/s (Figure 11a,b). After adding dust, AEJ is weakened at the core while it is intensified at its periphery (Figure 11c). The changes are less than 0.2 m/s. The horizontal potential temperature gradient is strongly positive below 600 hPa south of 22° N and slightly negative above 600 hPa (Figure 11d,e). Because of the thermal wind balance, there is strong vertical wind shear and thus AEJ is present at around 600 hPa. Looking at the difference in potential temperature (Figure 11f), there is a cooling region north of 15° N below 700 hPa. Thus, the positive temperature gradient is weakened below 700 hPa due to dust, which may explain the weakening of AEJ at the core. We compared our results with other studies. Real et al. (2011) [23] used the NASA GEOS-5 model to study the impact of aerosols (mainly dust) on AEJ. They observed that adding aerosols increases the temperature north of 22° N and enhances the positive temperature gradient, which leads to the northward and upward shift of AEJ (their Figure 9). Tao et al. (2018) [24] found that AEJ is intensified on the southern edge of the dust layer by considering the dust radiative effect. Both studies observed a warmer layer and an increase of the temperature gradient between 950 hPa and 600 hPa (Figure 9 in [23] and Figure 11 in [24]) after considering dust radiative effect. In contrast, the layer between 950 hPa and 600 hPa has a cooling region below and a warming region above in our simulations. The change of temperature gradient is not significant. The uncertainties in the dust radiative effect can contribute to the change of temperature. They can include the size distribution, mass, composition, refractive index of the dust, the underlying surface albedo, the solar zenith angle, the distribution of the dust, etc. These factors are different in our model than their models. It possibly explains why we observed a different change of temperature and then the AEJ.
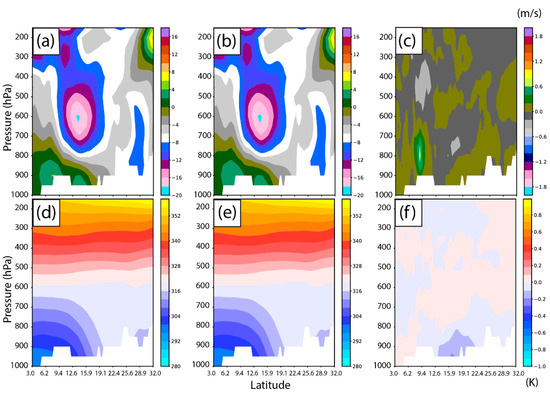
Figure 11.
Averaged (from 1300 UTC 21 to 0000 UTC 23) vertical meridional cross-sections of zonal wind (15° W to 10° E, m/s) from (a) ExDO, (b) ExO, and (c) the difference (ExDO − ExO). Cross-sections (d–f) are similar to (a,c) but are for the temperature (K).
Past studies have shown that, under suitable conditions, the AEW can grow by drawing energy from the AEJ (e.g., [69,70]). Hurricane Earl can be traced back to the disturbances at 600 hPa and 850 hPa over the continent (Figure 12). The AEW disturbance at 600 hPa is traced by following its trough which can be identified as the local maximum in the relative vorticity field. The trough is located at (2° E, 9° N) at 1200 UTC 21 (black dot in Figure 12a). AEJ can be observed by identifying the dense streamline at 600 hPa around 15° N. The position of the maximum wind (indicating the intensity of AEJ) around the trough is marked by the green dot. AEW at 850 hPa has a circulation center around 2° E, 15° N just beneath the AEJ (Figure 12b). The circulation center at 850 hPa is located to the north of AEW at 600 hPa, and they move together to the west. This is a typical pattern observed in this region [71,72,73]. AEW can grow as a consequence of both barotropic and baroclinic instability [70]. The AEW at 850 hPa is positioned to the north of AEJ, which shows its baroclinic nature because the strong meridional temperature gradient over Sahara interacts with positive meridional potential vorticity above [71]. Finally, we observe that once AEW moves over the ocean, the vertical alignment of the trough of AEW at 600 hPa and the center at 850 hPa occurs, similar to what other studies have observed.
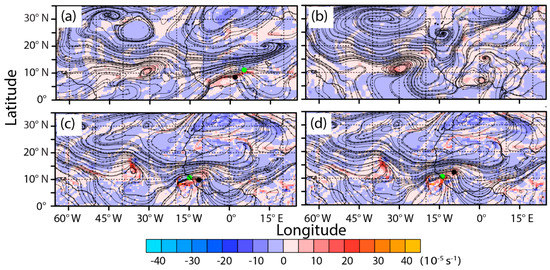
Figure 12.
Streamline and relative vorticity (shading, 10−5 s −1) from ExDO at (a) 600 hPa and (b) 850 hPa at 1200 UTC 21 August 2010. Same fields from (c) ExDO and (d) ExO at 600 hPa at 000 UTC 23 August 2010. The black dots indicate the positions of the local maximum relative vorticity at the trough at 600 hPa, and the green dots indicate the positions of the local maximum wind around the trough at 600 hPa.
Figure 13 shows the intensity of the AEWs at 600 hPa and 850 hPa. The maximum relative vorticity is obtained at the trough of AEW (black dots in Figure 12) while the maximum wind is obtained near the trough (green dots in Figure 12). Prior to 0600 UTC 23, the relative vorticity values suggest that the AEW at 600 hPa initially grows and then decays gradually before it moves to the ocean. After 0600 UTC 23, its intensity has an upward trend, indicating that the wave is growing by gaining significant energy from the latent heat over the ocean. The intensity of the AEW at 850 hPa (measured by the maximum wind speed) generally increases as it moves to the west. Dust has a relatively small effect on the waves in the early period (before 0900 UTC 22). The positions of the circulation center and the maximum wind speed at 850 hPa are also similar between the two experiments (not shown). However, starting from 0900 UTC 22, the wave amplitudes and their positions in the two experiments begin to show more differences. From 1200 UTC 22 to 1200 UTC 23, the position of maximum relative vorticity at 600 hPa in ExDO is mainly in the south of the position in ExO (black dots in Figure 12c,d). In terms of the intensity of AEW at 600 hPa and 850 hPa, before 1500 UTC 23 the wave intensity in ExDO can be stronger and weaker than ExO depending on the time. After 1500 UTC 23, the intensity of the systems is weaker in ExDO, indicating that dust reduces the intensity of AEW just before it becomes a TC at 0000UTC 24. Since the AEW and low pressure are part of the same convective system, we think the mechanism that explains why dust weakens the low-pressure system can also explain the weakening of the AEW. Some previous studies showed that dust negatively impacts the intensity of AEW [16,17], while some reported positive impacts ([18,20]). There is a difference between the dust vertical distribution over the eastern Atlantic and North Africa. Such differences may contribute to the contradictions in the literature [20]. Dust may also have different impacts on different stages of the AEW [20]. In our study, we focused on the dust impact on the early stage of the AEW. The uncertainties include the characteristics of the dust in the model (dust vertical distribution, size distribution, etc.) and the stages of AEW.
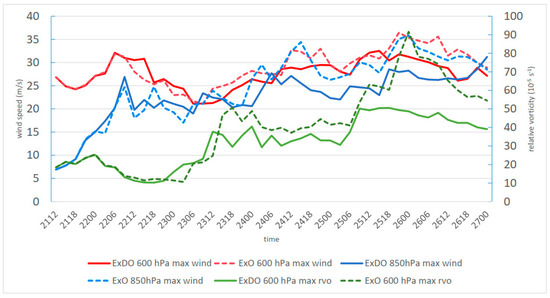
Figure 13.
Time series of the maximum wind speed (m/s) at 600 hPa and 850 hPa, and the maximum relative vorticity (10−5 s −1) at 600 hPa from ExDO and ExO. The Y-axis on the left indicates the wind speed, and the Y-axis on the right indicates the relative vorticity.
After the AEW moves to the ocean, it becomes a TC at 0000 UTC 24. The TC with dust is still slightly weaker than the TC without dust (Figure 1b,c). The track forecast of the TC in ExDO is slightly better than ExO (Figure 1a). We note that there are some studies focused on the impact of other aerosols on the TCs over the Pacific [74,75,76] and the Indian ocean [77] which could serve as points of comparison (albeit not on the same weather system). They all found that aerosols have a negligible impact on the track. A possible reason why they saw smaller changes than our case is that they started the forecast at a later stage than ours. Because the large-scale environment flow plays an important role in controlling the track of a storm [54], we assume that aerosols play a minor role in changing the track forecast in their cases. In contrast, we started our forecast when the system was still a wave over the continent. The aerosol may play a bigger role to influence the track of a weaker system. Furthermore, the cumulative effect may contribute to a larger impact in our case since the dust aerosols have already influenced the AEW and the low-pressure system for several days before they develop into a cyclone. For intensity in our simulations, adding other aerosols (without dust) increases the intensity error, while further adding dust reduces the intensity error, suggesting that with such competing effects of aerosols, it is critically important to represent them accordingly in model simulations. For comparison, most of the studies in the past found a weaker cyclone after aerosols (including dust) were added to the system. As a result, for the effect of dust, our result is consistent with these studies, but for the effect of other aerosols, our result suggests the opposite. On the contrary, Jiang et al. (2016) [75] did not find an obvious change in the intensity and track of a typhoon after adding aerosols to the model. We assumed dust might play a bigger role in altering weaker storms. However, we need to conduct additional sensitivity experiments to further support this assumption. For example, we can artificially weaken the storm by some methods, then add the same amount of dust in the simulation. Compared to the original storm, if the weaker storm is influenced more by dust, we may support this argument. This is worth trying in our future studies. Finally, we need to be careful about the conclusion we found here. Because the simulated tracks in our experiments have rightward biases compared to the best track, the simulated tropical cyclone is closer to the dusted SAL than reality. The impact of dust on the track and intensity might be exaggerated in our case.
4. Conclusions and Discussion
This study was motivated by the disagreements from the literature regarding the impact of Saharan dust aerosols on the surface low-pressure system, African Easterly Waves (AEWs), the African Easterly Jet (AEJ), and the early development of tropical cyclones. We revisit this issue by using a reasonable model experimental framework to simulate Hurricane Earl in its early stage when dust can potentially impact all these systems. It was shown that our simulations can generally represent the synoptic meteorology and the aerosol evolution and the distribution horizontally and vertically. When the systems move to the ocean from the African coast and become a TC, the simulations produce rightward biased tracks and stronger systems compared to the best track. The forecast errors in our study are within a reasonable range compared to official forecast errors from the models mentioned in the NHC report.
Dust radiative effect is analyzed when a low-pressure system is still over land. Adding dust in the simulation reduces the SW radiation reaching the surface. The surface temperature is thus reduced, and the sensible heating rate at the boundary layer is 5% weaker. Dust also increases the LW radiation cooling rate by 3%. Although dust absorbs SW radiation and increases the heating rate by 4%, it cannot compensate for the total effect of its negative forcing in LW radiation and boundary layer heating. Hence, overall dust cools the atmosphere by 0.03 K on average. In addition, the reduction of the boundary layer heating and the strengthening of the LW cooling by dust reduces the temperature below 2km, while the atmosphere just above is warmer mainly due to dust SW heating. As a result, the atmosphere is more stable, which contributes to the weakening of the low-pressure system by less than 1 hPa before it develops into a TC.
AEJ is generated and maintained by the horizontal temperature gradient due to thermal wind balance. In the presence of dust, the temporal-zonal averaged AEJ is weakened at its core, while it is intensified at its periphery by less than 0.2 m/s. This is possibly due to the weakening of the temperature gradient below 700 hPa. The AEW at 600 hPa shifts to the south slightly after adding dust. Adding dust can enhance or weaken the AEW at different times in the beginning. Around 9 h before AEW triggers the TC, AEW with dust becomes weaker. Finally, the AEW and low-pressure system align together over the ocean and trigger TC, and the TC with dust remains weaker.
The change of AEJ by dust in our study is different from other studies. The uncertainties in the dust radiative effect might contribute to the different changes in temperature. Then by thermal wind balance, the change of AEJ is also different. In the literature, dust can intensify or weaken AEW. In our case, dust weakens AEW. The uncertainties in the dust radiative effect and the stage of AEW are possible causes for the discrepancy between studies. In terms of the dust impact on TCs, our studies agree with most other studies that dust weakens them.
Many previous studies have focused on how dust impacts the tropical cyclone over the ocean. However, from this study, we can see that the impact of dust on the tropical cyclone begins earlier when a low-pressure system is located over North Africa and AEWs are present above. To fully investigate how dust changes the behavior of the convective system, it is better to study its impact during the lifetime of the systems. While we can see that the influence of dust on the convective system can be complicated, we also recognize several limitations of this study. Firstly, the tropical cyclones in our simulation are biased to the right compared to the best track. Since they are closer to the dust layer than reality, the impact of dust on the tropical cyclone may be magnified. Secondly, we analyzed dust impacts by comparing two forecasts (with dust and without dust). To determine whether the differences due to dust are significant, we suggest conducting ensemble forecasts for two groups: with dust and without dust. As a result, we note some caution in generalizing conclusions drawn from this study to other cases, as we recognize limitations of model representation of key processes and insufficient statistics from one single case. We suggest selecting more cases in the future for a more comprehensive investigation of the dust impact on these systems at different stages.
Supplementary Materials
The following are available online at https://www.mdpi.com/article/10.3390/atmos12091181/s1, Figure S1: The bin sizes of the dust in MACC-II model and WRF-Chem MOSAIC 8 bins model. Figure S2: Official NHC and interpolated model track forecasts for Earl every 6 h from 0000 UTC 26 August to 0000 UTC 30. Figure S3: Sea level pressure from ExDO and FNL at 0000 UTC 23 August 2010. Figure S4: The streamlines and the relative vorticity at 600 hPa from FNL and ExDO. Figure S5: The Skew-T plots from ExDO at In-Salah station and Guimar-Tenerife station, in comparison with the Skew-T plots from the radiosonde observations at the corresponding stations. Figure S6: Comparison of the aerosol extinction coefficient from the ExDO and the aerosol subtypes in CALIPSO at 1400 UTC 23 August 2010. Figure S7: Evolution of the domain-averaged (15°~25° N, 15° W~10° E) vertical profiles of the variables from ExDO and the difference (ExDO − ExO). Figure S8: Evolution of the domain-averaged (15°~25° N, 15° W~10° E) vertical profiles of the heating tendencies from difference processes from ExDO and the difference (ExDO − ExO). Figure S9: The cloud fraction (%) at 6.0 km and 14.6 km at 0000UTC 23 August 2010 from experiment ExDO. Table S1: Bulk aerosol parameters used in the calculation of surface area.
Author Contributions
Conceptualization, J.L. and Y.C.; methodology, J.L. and Y.C.; software, J.L.; validation, J.L., Y.C. and A.F.A.; formal analysis, J.L.; investigation, J.L., Y.C., A.F.A. and A.A.M.; resources, Y.C. and A.F.A.; data curation, J.L.; writing—original draft preparation, J.L.; writing—review and editing, J.L., Y.C., A.F.A. and A.A.M.; visualization, J.L.; supervision, Y.C. and A.F.A.; project administration, Y.C.; funding acquisition, Y.C. All authors have read and agreed to the published version of the manuscript.
Funding
This research was funded by the Natural Sciences and Engineering Research Council of Canada (NSERC) under the project entitled ‘Predicting Rapid Intensity Change of Hurricanes’.
Institutional Review Board Statement
Not applicable.
Informed Consent Statement
Not applicable.
Data Availability Statement
The Dry Air/Saharan Air Layer images are available at http://tropic.ssec.wisc.edu/archive/. The radiosonde data are available at http://weather.uwyo.edu/upperair/sounding.html. The CALIPSO data are available at https://www-calipso.larc.nasa.gov/tools/data_avail/index.php?d=2010. The MODIS data are available at https://modis.gsfc.nasa.gov/. The AERONET is available at https://aeronet.gsfc.nasa.gov/. The best track data from NHC are available at https://www.nhc.noaa.gov/data/#hurdat. The NCEP FNL dataset can be found here: https://rda.ucar.edu/datasets/ds083.2/. The MACC-II reanalysis is at https://apps.ecmwf.int/datasets/data/macc-reanalysis/levtype=sfc/. MACC-II now is replaced by CAMS: https://apps.ecmwf.int/datasets/data/cams-nrealtime/levtype=pl/. Some of the figures are produced by NCL and provided by NCAR: http://dx.doi.org/10.5065/D6WD3XH5. All the above links are accessed on 6 September 2021.
Acknowledgments
We would like to acknowledge the high-performance computing support from the Mammoth parallel II supercomputer sponsored by the Calcul Québec and Compute Canada. The authors are thankful to the colleagues in the research group at York University: Sangay Tshering Bhutia, Mahtab Majdzadeh, and Zhengqi Wang for giving suggestions. We thank Zhiquan Liu from NCAR for supporting the first author in conducting part of the research in NCAR. We thank Chun Zhao from the University of Science and Technology of China for the advice on the WRF-Chem configuration. This paper benefited from valuable comments and suggestions from Leiming Zhang from Environment and Climate Change Canada.
Conflicts of Interest
The authors declare no conflict of interest.
References
- Karyampudi, V.M.; Carlson, T.N. Analysis and Numerical Simulations of the Saharan Air Layer and Its Effect on Easterly Wave Disturbances. J. Atmos. Sci. 1988, 45, 3102–3136. [Google Scholar] [CrossRef]
- Dunion, J.P.; Velden, C.S. The impact of the Saharan Air Layer on Atlantic tropical cyclone activity. Bull. Am. Meteorol. Soc. 2004, 85, 353–365. [Google Scholar] [CrossRef]
- Zhao, C.; Liu, X.; Leung, L.R.; Johnson, B.; McFarlane, S.A.; Gustafson, W.I.; Fast, J.D.; Easter, R. The spatial distribution of mineral dust and its shortwave radiative forcing over North Africa: Modeling sensitivities to dust emissions and aerosol size treatments. Atmos. Chem. Phys. 2010, 10, 8821–8838. [Google Scholar] [CrossRef]
- Mamun, A.; Chen, Y.; Liang, J. Radiative and cloud microphysical effects of the Saharan dust simulated by the WRF-Chem model. J. Atmos. Sol.-Terr. Phys. 2021, 219, 105646. [Google Scholar] [CrossRef]
- Carlson, T.N.; Benjamin, S.G. Radiative Heating Rates for Saharan Dust. J. Atmos. Sci. 1980, 37, 193–213. [Google Scholar] [CrossRef]
- Zhu, A.; Ramanathan, V.; Li, F.; Kim, D. Dust plumes over the Pacific, Indian, and Atlantic oceans: Climatology and radiative impact. J. Geophys. Res. Atmos. 2007, 112, 1–20. [Google Scholar] [CrossRef]
- Huang, J.; Fu, Q.; Su, J.; Tang, Q.; Minnis, P.; Hu, Y.; Yi, Y.; Zhao, Q. Taklimakan dust aerosol radiative heating derived from CALIPSO observations using the Fu-Liou radiation model with CERES constraints. Atmos. Chem. Phys. 2009, 9, 4011–4021. [Google Scholar] [CrossRef]
- Seinfeld, J.H.; Pandis, S.N. Atmospheric Chemistry and Physics: From Air Pollution to Climate Change, 2nd ed.; John Wiley & Sons, Inc.: Hoboken, NJ, USA, 2006; ISBN 978-0-471-72017-1. [Google Scholar]
- Aoki, T.; Tanaka, T.Y.; Uchiyama, A.; Chiba, M.; Mikami, M.; Yabuki, S.; Key, J.R. Sensitivity experiments of direct radiative forcing caused by mineral dust simulated with a chemical transport model. J. Meteorol. Soc. Jpn. 2005, 83, 315–331. [Google Scholar] [CrossRef]
- Chen, D.; Liu, Z.; Davis, C.; Gu, Y. Dust radiative effects on atmospheric thermodynamics and tropical cyclogenesis over the Atlantic Ocean using WRF-Chem coupled with an AOD data assimilation system. Atmos. Chem. Phys. 2017, 17, 7917–7939. [Google Scholar] [CrossRef]
- Reale, O.; Lau, K.M.; Da Silva, A.; Matsui, T. Impact of assimilated and interactive aerosol on tropical cyclogenesis. Geophys. Res. Lett. 2014, 41, 3282–3288. [Google Scholar] [CrossRef]
- Strong, J.D.O.; Vecchi, G.A.; Ginoux, P. The Climatological Effect of Saharan Dust on Global Tropical Cyclones in a Fully Coupled GCM. J. Geophys. Res. Atmos. 2018, 123, 5538–5559. [Google Scholar] [CrossRef]
- Cotton, W.R.; Zhang, H.; McFarquhar, G.M.; Saleeby, S.M. Should we Consider Polluting Hurricanes to Reduce their Intensity? J. Weather Modif. 2007, 39, 70–73. [Google Scholar]
- Zhang, H.; McFarquhar, G.M.; Cotton, W.R.; Deng, Y. Direct and indirect impacts of Saharan dust acting as cloud condensation nuclei on tropical cyclone eyewall development. Geophys. Res. Lett. 2009, 36, 1–6. [Google Scholar] [CrossRef]
- Rosenfeld, D.; Woodley, W.L.; Khain, A.; Cotton, W.R.; Carrió, G.; Ginis, I.; Golden, J.H. Aerosol effects on microstructure and intensity of tropical cyclones. Bull. Am. Meteorol. Soc. 2012, 93, 987–1001. [Google Scholar] [CrossRef]
- Jury, M.R.; Santiago, M.J. Composite analysis of dust impacts on African easterly waves in the Moderate Resolution Imaging Spectrometer era. J. Geophys. Res. Atmos. 2010, 115, 1–11. [Google Scholar] [CrossRef]
- Reale, O.; Lau, W.K.; Kim, K.-M.; Brin, E. Atlantic Tropical Cyclogenetic Processes during SOP-3 NAMMA in the GEOS-5 Global Data Assimilation and Forecast System. J. Atmos. Sci. 2009, 66, 3563–3578. [Google Scholar] [CrossRef][Green Version]
- Ma, P.L.; Zhang, K.; Shi, J.J.; Matsui, T.; Arking, A. Direct radiative effect of mineral dust on the development of African easterly waves in late summer, 2003-07. J. Appl. Meteorol. Climatol. 2012, 51, 2090–2104. [Google Scholar] [CrossRef]
- Grogan, D.F.P.; Nathan, T.R.; Chen, S.-H. Saharan Dust and the Nonlinear Evolution of the African Easterly Jet–African Easterly Wave System. J. Atmos. Sci. 2017, 74, 27–47. [Google Scholar] [CrossRef]
- Grogan, D.F.P.; Nathan, T.R.; Chen, S.-H. Effects of Saharan Dust on the Linear Dynamics of African Easterly Waves. J. Atmos. Sci. 2016, 73, 891–911. [Google Scholar] [CrossRef]
- Hosseinpour, F.; Wilcox, E.M. Aerosol interactions with African/Atlantic climate dynamics. Environ. Res. Lett. 2014, 9, 075004. [Google Scholar] [CrossRef]
- Lavaysse, C.; Chaboureau, J.P.; Flamant, C. Dust impact on the west african heat low in summertime. Q. J. R. Meteorol. Soc. 2011, 137, 1227–1240. [Google Scholar] [CrossRef]
- Reale, O.; Lau, K.M.; da Silva, A. Impact of Interactive Aerosol on the African Easterly Jet in the NASA GEOS-5 Global Forecasting System. Weather Forecast. 2011, 26, 504–519. [Google Scholar] [CrossRef]
- Tao, Z.; Braun, S.A.; Shi, J.J.; Chin, M.; Kim, D.; Matsui, T.; Peters-Lidard, C.D. Microphysics and radiation effect of dust on Saharan air layer: An HS3 case study. Mon. Weather Rev. 2018, 146, 1813–1835. [Google Scholar] [CrossRef]
- Zhang, H.; McFarquhar, G.M.; Saleeby, S.M.; Cotton, W.R. Impacts of Saharan dust as CCN on the evolution of an idealized tropical cyclone. Geophys. Res. Lett. 2007, 34, 1–6. [Google Scholar] [CrossRef]
- Baró, R.; Jiménez-Guerrero, P.; Balzarini, A.; Curci, G.; Forkel, R.; Grell, G.; Hirtl, M.; Honzak, L.; Langer, M.; Pérez, J.L.; et al. Sensitivity analysis of the microphysics scheme in WRF-Chem contributions to AQMEII phase 2. Atmos. Environ. 2015, 115, 620–629. [Google Scholar] [CrossRef]
- Chapman, E.G.; Gustafson, W.I.; Easter, R.C.; Barnard, J.C.; Ghan, S.J.; Pekour, M.S.; Fast, J.D. Coupling aerosol-cloud-radiative processes in the WRF-Chem model: Investigating the radiative impact of elevated point sources. Atmos. Chem. Phys. 2009, 9, 945–964. [Google Scholar] [CrossRef]
- Saide, P.E.; Spak, S.N.; Carmichael, G.R.; Mena-Carrasco, M.A.; Yang, Q.; Howell, S.; Leon, D.C.; Snider, J.R.; Bandy, A.R.; Collett, J.L.; et al. Evaluating WRF-chem aerosol indirect effects in southeast pacific marine stratocumulus during VOCALS-REx. Atmos. Chem. Phys. 2012, 12, 3045–3064. [Google Scholar] [CrossRef]
- Skamarock, W.C.; Klemp, J.B.; Dudhia, J.B.; Gill, D.O.; Barker, D.M.; Duda, M.G.; Huang, X.-Y.; Wang, W.; Powers, J.G. A Description of the Advanced Research WRF Version 3. 2008. Available online: https://opensky.ucar.edu/islandora/object/technotes:500 (accessed on 6 September 2021).
- Grell, G.A.; Peckham, S.E.; Schmitz, R.; McKeen, S.A.; Frost, G.; Skamarock, W.C.; Eder, B. Fully coupled “online” chemistry within the WRF model. Atmos. Environ. 2005, 39, 6957–6975. [Google Scholar] [CrossRef]
- Iacono, M.J.; Delamere, J.S.; Mlawer, E.J.; Shephard, M.W.; Clough, S.A.; Collins, W.D. Radiative forcing by long-lived greenhouse gases: Calculations with the AER radiative transfer models. J. Geophys. Res. Atmos. 2008, 113. [Google Scholar] [CrossRef]
- Grell, G.A.; Dévényi, D. A generalized approach to parameterizing convection combining ensemble and data assimilation techniques. Geophys. Res. Lett. 2002, 29, 38-1–38-4. [Google Scholar] [CrossRef]
- Jiménez, P.A.; Dudhia, J.; González-Rouco, J.F.; Navarro, J.; Montávez, J.P.; García-Bustamante, E. A revised scheme for the WRF surface layer formulation. Mon. Weather Rev. 2012, 140, 898–918. [Google Scholar] [CrossRef]
- Tewari, M.; Chen, F.; Wang, W.; Dudhia, J.; LeMone, M.A.; Mitchell, K.; Ek, M.; Gayno, G.; Wegiel, J.; Cuenca, R.H. Implementation and Verification of the Unified Noah Land Surface Model in the WRF Model. In Proceedings of the 20th Conference on Weather Analysis and Forecasting/16th Conference on Numerical Weather Prediction, Seattle, WA, USA, 14 January 2004. [Google Scholar]
- Hong, S.Y.; Noh, Y.; Dudhia, J. A new vertical diffusion package with an explicit treatment of entrainment processes. Mon. Weather Rev. 2006, 134, 2318–2341. [Google Scholar] [CrossRef]
- Morrison, H.; Thompson, G.; Tatarskii, V. Impact of cloud microphysics on the development of trailing stratiform precipitation in a simulated squall line: Comparison of one- and two-moment schemes. Mon. Weather Rev. 2009, 137, 991–1007. [Google Scholar] [CrossRef]
- Morrison, H.; Curry, J.A.; Khvorostyanov, V.I. A new double-moment microphysics parameterization for application in cloud and climate models. Part I: Description. J. Atmos. Sci. 2005, 62, 1665–1677. [Google Scholar] [CrossRef]
- Zaveri, R.A.; Peters, L.K. A new lumped structure photochemical mechanism for large-scale applications. J. Geophys. Res. Atmos. 1999, 104, 30387–30415. [Google Scholar] [CrossRef]
- Zaveri, R.A.; Easter, R.C.; Fast, J.D.; Peters, L.K. Model for Simulating Aerosol Interactions and Chemistry (MOSAIC). J. Geophys. Res. Atmos. 2008, 113, 1–29. [Google Scholar] [CrossRef]
- Fast, J.D.; Gustafson, W.I.; Easter, R.C.; Zaveri, R.A.; Barnard, J.C.; Chapman, E.G.; Grell, G.A.; Peckham, S.E. Evolution of ozone, particulates, and aerosol direct radiative forcing in the vicinity of Houston using a fully coupled meteorology-chemistry-aerosol model. J. Geophys. Res. Atmos. 2006, 111, 1–29. [Google Scholar] [CrossRef]
- Zhao, C.; Liu, X.; Leung, L.R.; Hagos, S. Radiative impact of mineral dust on monsoon precipitation variability over West Africa. Atmos. Chem. Phys. 2011, 11, 1879–1893. [Google Scholar] [CrossRef]
- Ginoux, P.; Chin, M.; Tegen, I.; Prospero, J.M.; Holben, B.; Dubovik, O.; Lin, S.-J. Sources and distributions of dust aerosols simulated with the GOCART model. J. Geophys. Res. 2001, 106, 20255–20273. [Google Scholar] [CrossRef]
- Parajuli, S.P.; Stenchikov, G.L.; Ukhov, A.; Kim, H. Dust Emission Modeling Using a New High-Resolution Dust Source Function in WRF-Chem With Implications for Air Quality. J. Geophys. Res. Atmos. 2019, 124, 10109–10133. [Google Scholar] [CrossRef]
- Engelen, R.; Peuch, V.-H.; Agusti-Panareda, A.; Benedetti, A.; Calnan, R.; Crepulja, M.; Flemming, J.; Inness, A.; Jones, L.; Massart, S.; et al. Final Report MACC-II Monitoring Atmospheric Composition and Climate—Interim Implementation. 2014, pp. 1–137. Available online: https://atmosphere.copernicus.eu/sites/default/files/repository/MACCII_FinalReport_0.pdf (accessed on 6 September 2021).
- Inness, A.; Baier, F.; Benedetti, A.; Bouarar, I.; Chabrillat, S.; Clark, H.; Clerbaux, C.; Coheur, P.; Engelen, R.J.; Errera, Q.; et al. The MACC reanalysis: An 8 yr data set of atmospheric composition. Atmos. Chem. Phys. 2013, 13, 4073–4109. [Google Scholar] [CrossRef]
- Emmons, L.K.; Walters, S.; Hess, P.G.; Lamarque, J.F.; Pfister, G.G.; Fillmore, D.; Granier, C.; Guenther, A.; Kinnison, D.; Laepple, T.; et al. Description and evaluation of the Model for Ozone and Related chemical Tracers, version 4 (MOZART-4). Geosci. Model Dev. 2010, 3, 43–67. [Google Scholar] [CrossRef]
- Stein, O.; Schultz, M.; Jülich, F.; Flemming, J.; Inness, A.; Kaiser, J.; Jones, L.; Benedetti, A.; Morcrette, J.-J. Macc global air quality services—Technical documentation. In MACC Project Deliverable D_G-RG_3; Monitoring Atmospheric Composition and Climate: Reading, UK, 2011; pp. 1–12. [Google Scholar]
- Morcrette, J.-J.; Boucher, O.; Jones, L.; Salmond, D.; Bechtold, P.; Beljaars, A.; Benedetti, A.; Bonet, A.; Kaiser, J.W.; Razinger, M.; et al. Aerosol analysis and forecast in the European Centre for Medium-Range Weather Forecasts Integrated Forecast System: Forward modeling. J. Geophys. Res. 2009, 114, D06206. [Google Scholar] [CrossRef]
- Benedetti, A.; Morcrette, J.J.; Boucher, O.; Dethof, A.; Engelen, R.J.; Fisher, M.; Flentje, H.; Huneeus, N.; Jones, L.; Kaiser, J.W.; et al. Aerosol analysis and forecast in the European Centre for Medium-Range Weather Forecasts integrated forecast system: 2. data assimilation. J. Geophys. Res. Atmos. 2009, 114. [Google Scholar] [CrossRef]
- Cuevas, E.; Camino, C.; Benedetti, A.; Basart, S.; Terradellas, E.; Baldasano, J.M.; Morcrette, J.J.; Marticorena, B.; Goloub, P.; Mortier, A.; et al. The MACC-II 2007-2008 reanalysis: Atmospheric dust evaluation and characterization over northern Africa and the Middle East. Atmos. Chem. Phys. 2015, 15, 3991–4024. [Google Scholar] [CrossRef]
- Archer-Nicholls, S.; Lowe, D.; Utembe, S.; Allan, J.; Zaveri, R.A.; Fast, J.D.; Hodnebrog, Ø.; van der Denier Gon, H.; McFiggans, G. Gaseous chemistry and aerosol mechanism developments for version 3.5.1 of the online regional model, WRF-Chem. Geosci. Model Dev. 2014, 7, 2557–2579. [Google Scholar] [CrossRef]
- Archer-Nicholls, S.; Lowe, D.; Darbyshire, E.; Morgan, W.T.; Bela, M.M.; Pereira, G.; Trembath, J.; Kaiser, J.W.; Longo, K.M.; Freitas, S.R.; et al. Characterising Brazilian biomass burning emissions using WRF-Chem with MOSAIC sectional aerosol. Geosci. Model Dev. 2015, 8, 549–577. [Google Scholar] [CrossRef]
- Giordano, L.; Brunner, D.; Flemming, J.; Hogrefe, C.; Im, U.; Bianconi, R.; Badia, A.; Balzarini, A.; Baró, R.; Chemel, C.; et al. Assessment of the MACC reanalysis and its influence as chemical boundary conditions for regional air quality modeling in AQMEII-2. Atmos. Environ. 2015, 115, 371–388. [Google Scholar] [CrossRef]
- Liu, B.; Xie, L. A scale-selective data assimilation approach to improving tropical cyclone track and intensity forecasts in a limited-area model: A case study of Hurricane Felix (2007). Weather Forecast. 2012, 27, 124–140. [Google Scholar] [CrossRef]
- Giles, D.M.; Sinyuk, A.; Sorokin, M.G.; Schafer, J.S.; Smirnov, A.; Slutsker, I.; Eck, T.F.; Holben, B.N.; Lewis, J.R.; Campbell, J.R.; et al. Advancements in the Aerosol Robotic Network (AERONET) Version 3 database—Automated near-real-time quality control algorithm with improved cloud screening for Sun photometer aerosol optical depth (AOD) measurements. Atmos. Meas. Tech. 2019, 12, 169–209. [Google Scholar] [CrossRef]
- Remer, L.A.; Kaufman, Y.J.; Tanré, D.; Mattoo, S.; Chu, D.A.; Martins, J.V.; Li, R.-R.; Ichoku, C.; Levy, R.C.; Kleidman, R.G.; et al. The MODIS Aerosol Algorithm, Products, and Validation. J. Atmos. Sci. 2005, 62, 947–973. [Google Scholar] [CrossRef]
- Xian, P.; Reid, J.S.; Hyer, E.J.; Sampson, C.R.; Rubin, J.I.; Ades, M.; Asencio, N.; Basart, S.; Benedetti, A.; Bhattacharjee, P.S.; et al. Current state of the global operational aerosol multi-model ensemble: An update from the International Cooperative for Aerosol Prediction (ICAP). Q. J. R. Meteorol. Soc. 2019, 145, 176–209. [Google Scholar] [CrossRef]
- Sayer, A.M.; Munchak, L.A.; Hsu, N.C.; Levy, R.C.; Bettenhausen, C.; Jeong, M.J. Modis collection 6 aerosol products: Comparison between aqua’s e-deep blue, dark target, and “merged” data sets, and usage recommendations. J. Geophys. Res. 2014, 119, 13.965–13.989. [Google Scholar] [CrossRef]
- Vaughan, M.A.; Young, S.A.; Winker, D.M.; Powell, K.A.; Omar, A.H.; Liu, Z.; Hu, Y.; Hostetler, C.A. Fully automated analysis of space-based lidar data: An overview of the CALIPSO retrieval algorithms and data products. In Laser Radar Techniques for Atmospheric Sensing; Singh, U.N., Ed.; SPIE: Bellingham, WA, USA, 2004; Volume 5575, p. 16. [Google Scholar]
- Cangialosi, J.P. Tropical Cyclone Report Hurricane Earl (AL072010). National Hurricane Center 2011, 1–29. Available online: https://www.nhc.noaa.gov/data/tcr/AL072010_Earl.pdf (accessed on 6 September 2021).
- Braun, S.A.; Kakar, R.; Zipser, E.; Heymsfield, G.; Albers, C.; Brown, S.; Durden, S.L.; Guimond, S.; Halverson, J.; Heymsfield, A.; et al. NASA’s Genesis and Rapid Intensification Processes (GRIP) Field Experiment. Bull. Am. Meteorol. Soc. 2013, 94, 345–363. [Google Scholar] [CrossRef]
- Hazelton, A.T.; Harris, L.; Lin, S.-J. Evaluation of Tropical Cyclone Structure Forecasts in a High-Resolution Version of the Multiscale GFDL fvGFS Model. Weather Forecast. 2018, 33, 419–442. [Google Scholar] [CrossRef]
- Judt, F.; Chen, S.S. Predictability and Dynamics of Tropical Cyclone Rapid Intensification Deduced from High-Resolution Stochastic Ensembles. Mon. Weather Rev. 2016, 144, 4395–4420. [Google Scholar] [CrossRef]
- Zhang, J.A.; Marks, F.D.; Sippel, J.A.; Rogers, R.F.; Zhang, X.; Gopalakrishnan, S.G.; Zhang, Z.; Tallapragada, V. Evaluating the Impact of Improvement in the Horizontal Diffusion Parameterization on Hurricane Prediction in the Operational Hurricane Weather Research and Forecast (HWRF) Model. Weather Forecast. 2018, 33, 317–329. [Google Scholar] [CrossRef]
- Otto, S.; De Reus, M.; Trautmann, T.; Thomas, A.; Wendisch, M.; Borrmann, S. Atmospheric radiative effects of an in situ measured Saharan dust plume and the role of large particles. Atmos. Chem. Phys. 2007, 7, 4887–4903. [Google Scholar] [CrossRef]
- Stensrud, D.J. Parameterization Schemes: Keys to Understanding Numerical Weather Prediction Models; Cambridge University Press: New York, NY, USA, 2007; ISBN 9780521126762. [Google Scholar]
- Kalverla, P.C.; Duine, G.J.; Steeneveld, G.J.; Hedde, T. Evaluation of the weather research and forecasting model in the durance valley complex terrain during the KASCADE field campaign. J. Appl. Meteorol. Climatol. 2016, 55, 861–882. [Google Scholar] [CrossRef]
- Alamirew, N.K.; Todd, M.C.; Ryder, C.L.; Marsham, J.H.; Wang, Y. The early summertime Saharan heat low: Sensitivity of the radiation budget and atmospheric heating to water vapour and dust aerosol. Atmos. Chem. Phys. 2018, 18, 1241–1262. [Google Scholar] [CrossRef]
- Burpee, R.W. The Origin and Structure of Easterly Waves in the Lower Troposphere of North Africa. J. Atmos. Sci. 1972, 29, 77–90. [Google Scholar] [CrossRef]
- Thorncroft, C.D.; Hoskins, B.J. An Idealized Study of African Easterly Waves. I: A Linear View. Q. J. R. Meteorol. Soc. 1994, 120, 953–982. [Google Scholar] [CrossRef]
- Pytharoulis, I.; Thorncroft, C. The Low-Level Structure of African Easterly Waves in 1995. Mon. Weather Rev. 1999, 127, 2266–2280. [Google Scholar] [CrossRef]
- Thorncroft, C.; Hodges, K. African easterly wave variability and its relationship to Atlantic tropical cyclone activity. J. Clim. 2001, 14, 1166–1179. [Google Scholar] [CrossRef]
- Ross, R.S.; Krishnamurti, T.N. Low-Level African Easterly Wave Activity and Its Relation to Atlantic Tropical Cyclogenesis in 2001. Mon. Weather Rev. 2007, 135, 3950–3964. [Google Scholar] [CrossRef]
- Cotton, W.R.; Krall, G.M.; Carrió, G.G. Potential Indirect Effects of Aerosol on Tropical Cyclone Intensity. Trop. Cyclone Res. Rev. 2012, 1, 293–306. [Google Scholar] [CrossRef]
- Jiang, B.; Huang, B.; Lin, W.; Xu, S. Investigation of the effects of anthropogenic pollution on typhoon precipitation and microphysical processes using WRF-Chem. J. Atmos. Sci. 2016, 73, 1593–1610. [Google Scholar] [CrossRef]
- Shen, X.; Jiang, X.; Liu, D.; Zu, F.; Fan, S. Simulations of Anthropogenic Aerosols Effects on the Intensity and Precipitation of Typhoon Fitow (1323) Using WRF-Chem Model. Chin. J. Atmos. Sci. 2017, 41, 960–974. [Google Scholar] [CrossRef]
- Hazra, A.; Mukhopadhyay, P.; Taraphdar, S.; Chen, J.-P.; Cotton, W.R. Impact of aerosols on tropical cyclones: An investigation using convection-permitting model simulation. J. Geophys. Res. Atmos. 2013, 118, 7157–7168. [Google Scholar] [CrossRef]
Publisher’s Note: MDPI stays neutral with regard to jurisdictional claims in published maps and institutional affiliations. |
© 2021 by the authors. Licensee MDPI, Basel, Switzerland. This article is an open access article distributed under the terms and conditions of the Creative Commons Attribution (CC BY) license (https://creativecommons.org/licenses/by/4.0/).