Abstract
The immersion freezing ability of soot particles has in previous studies been reported in the range of low/insignificant to very high. The aims of this study were to: (i) perform detailed physico-chemical characterisation of freshly produced soot particles with very different properties, (ii) investigate the immersion freezing ability of the same particles, and (iii) investigate the potential links between physico-chemical particle properties and ice-activity. A miniCAST soot generator was used to produce eight different soot samples representing a wide range of physico-chemical properties. A continuous flow diffusion chamber was used to study each sample online in immersion mode over the temperature (T) range from −41 to −32 °C, at a supersaturation of about 10% with respect to liquid water. All samples exhibited low to no heterogeneous immersion freezing. The most active sample reached ice-activated fractions (AF) of 10−3 and 10−4 at temperatures of 1.7 and 1.9 K , respectively, above the homogeneous freezing temperature. The samples were characterized online with respect to a wide range of physico-chemical properties including effective particle density, optical properties, particle surface oxidation and soot maturity. We did observe indications of increasing immersion freezing ice-activity with increasing effective particle density and increasing particulate PAH fraction. Hence, those properties, or other properties co-varying with those, could potentially enhance the immersion freezing ice-activity of the studied soot particle types. However, we found no significant correlation between the physico-chemical properties and the observed ice-nucleating ability when the particle ensemble was extended to include previously published results including more ice-active biomass combustion soot particles. We conclude that it does not appear possible in general and in any straightforward way to link observed soot particle physico-chemical properties to the ice-nucleating ability using the online instrumentation included in this study. Furthermore, our observations support that freshly produced soot particles with a wide range of physico-chemical properties have low to insignificant immersion freezing ice-nucleating ability.
Keywords:
ice nucleation; immersion freezing; miniCAST; SPIN; soot; black carbon; brown carbon; aerosol 1. Introduction
Soot particles are known to influence climate significantly through direct interaction with radiation [1], and indirectly via acting as cloud condensation nuclei (CCN) [2]. However, it is highly uncertain to which extent soot particles may affect cloud properties and thus climate indirectly through facilitating heterogeneous freezing of cloud droplets. Yun et al. [3] estimated that the radiative forcing due to heterogeneous ice nucleation caused by anthropogenic soot particles in mixed-phase clouds could potentially be as high as ∼1 W/m2. A significant reason for the pronounced uncertainties in such modelling studies is the high uncertainty of the ice-nucleating ability of ambient soot particles.
Soot particles are a type of carbonaceous material made up of aggregates of smaller spheroids referred to as primary particles with a wide range of physical and chemical properties [4]. Soot is formed through the incomplete combustion of hydrocarbons, for example biomass and fossil fuels, and properties such as soot maturity and primary particle diameter depend on fuel composition and combustion conditions. A higher level of soot maturity is associated with a decrease in hydrogen-to-carbon fraction [5,6], and a progression from more amorphous to more graphitic structures [7,8]. Major sources of soot particles include combustion of fossil fuels in transportation, open burning of biomass and combustion of solid fuels for industrial and residential use [9]. There have been several studies performed in recent years examining the immersion freezing ability of soot particles [10,11,12,13,14,15,16].
The ice-nucleating ability of freshly produced soot particles have inconsistently been reported to range from undetectable or low, up to very high. Studies reporting high ice-nucleating ability in immersion mode include the following three: (1) DeMott [17] reported soot particles from the exhaust of an acetylene burner to facilitate immersion freezing of cloud droplets for temperatures up to −24 °C; (2) Diehl and Mitra [18] reported soot particles from the exhaust of a kerosene-burner to be active in immersion freezing for temperatures up to −20 °C; and (3) Gorbunov et al. [19] reported soot particles from combustion of toluene and benzene to facilitate immersion freezing at temperatures up to −10 °C. The results of DeMott [17] and Diehl and Mitra [18] comprised the foundation for an immersion freezing parameterisation of soot particles with a high ice-active site density [20].
On the other hand, several studies report modest or undetectable ice-nucleating abilities of soot particles. Schill et al. [10] reported no detection of immersion freezing ice nucleation at −30 °C for freshly emitted and aged soot particles from a diesel engine. Chou et al. [11] observed immersion freezing in a couple of cases for T = −35 °C, but not at −30 °C for freshly emitted and aged soot particles from wood combustion and a diesel engine. Levin et al. [12] reported relatively low concentrations of immersion freezing ice nucleating particles (INPs) in biomass burning emissions, but a fraction of the INPs disappeared by removal of black carbon particles. The immersion freezing ice-nucleating ability of two soot types generated with a miniCAST burner was recently reported to be insignificant [16]. Korhonen et al. [13] reported soot particles from biomass combustion to facilitate immersion freezing very close to the homogeneous freezing temperature near −38 °C, with only a couple of exceptions. Their most active soot sample facilitated immersion freezing for temperatures up to about −32 °C. In some of the studies reporting undetectable heterogeneous immersion freezing of soot particles, parameterisations based on the upper potential ice active site density could be estimated based on the detection limit [10,14,15]. The large variety in experimental results have led to considerable differences in the existing parameterisations of the immersion freezing ice-nucleating ability of soot particles [14]. Depending on the ice-nucleating ability of soot particles, they may comprise about 5% [21] or 23% [22] of global INPs relevant for mixed-phase clouds.
The various experimental studies of the immersion freezing ice-nucleating ability of soot particles have been based on very different types of particles in terms of sources and their physico-chemical properties. In most studies, a detailed characterisation of the soot particles has not been carried out, so it is largely unclear which soot particle properties are important for the immersion freezing potential.
The current study focuses on measurements of the immersion freezing ice-nucleating ability of a range of soot particle types generated with a miniCAST burner [23,24] under controlled laboratory conditions. We carried out a detailed physico-chemical characterisation of the studied soot particles with the aim of investigating any potential relationship between soot particle properties and immersion freezing.
2. Materials and Methods
2.1. Set-Up Overview
A schematic of the experimental set-up used to examine the generated soot particles with respect to ice nucleation, fragmental mass spectra, light attenuation and effective density can be seen in Figure 1. The principle of the set-up was to (1) generate a distribution of soot particles, (2) select the largest mobility equivalent diameter (referred to as mobility diameter) with reasonable number concentrations and (3) distribute the diluted aerosol flow to the various aerosol instruments.
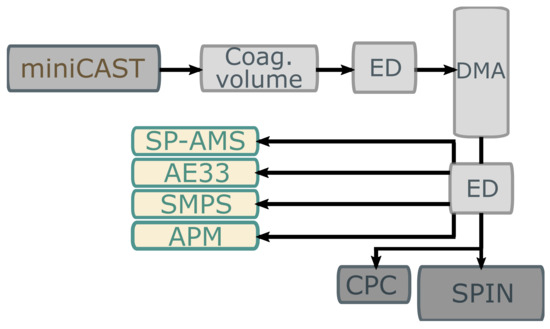
Figure 1.
Experimental set-up for this study. DMA: Differential Mobility Analyser, ED: Ejector diluter, SP-AMS: Soot-Particle Aerosol Mass Spectrometer, AE33: Aethalometer, SMPS: Scanning Mobility Particle Sizer, APM: Aerosol Particle Mass Analyser, CPC: Condensation Particle Counter and SPIN; SPectrometer for Ice Nuclei.
The soot particles were generated with a miniature combustion aerosol standard soot generator (miniCAST, model 5201C; Jing ltd., Zollikofen, Switzerland). The miniCAST produces particles by means of burning propane in a controlled flame located inside the instrument. The combustion conditions, and consequently also the soot particle properties for this flame, can be modified in the instrument via four parameters, (i) propane gas fuel flow, (ii) N2 gas flow for mixing with the fuel pre-combustion, (iii) oxidation air flow, and (iv) N2 gas flow for quenching the flame. A parameter for internal air flow dilution was also available, primarily to control particle number concentrations. In these experiments, we explored eight different configurations of these parameters, representing different levels of soot maturity and chemical composition. Internal dilution was utilised for two of these configurations, which exhibited comparatively high number concentrations. The configurations are summarized in Table 1. The soot properties were altered in two different ways. Experiments denoted OP (operation point) used settings defined by the miniCAST manufacturer, and SP (set point) used settings defined by Ess et al. [25]. In both sets of experiments, the oxidation air flow was decreased with increasing OP-number (OP#) or increasing SP-number (SP#). In addition to this, for the OP#-experiments, an N2 gas flow for mixing with the fuel pre-combustion was introduced and increased for increasing experiment number. From here on, any miniCAST setting is generally referred to as a setpoint, and when relevant its type will be explicitly stated (OP/SP).

Table 1.
The different miniCAST settings used. OP-numbered settings are sourced from the manufacturer, while SP-numbered settings are sourced from Ess et al. [25]. Lower OP numbering relates to, according to previous studies, a higher level of soot maturity [26,27]. Settings OP2 and OP4 additionally used the internal dilution flow of the miniCAST in order to lower particle concentrations.
The generated particles were drawn directly from the miniCAST output, and transported through one to two stainless steel cylinders, with volumes of approximately 800 and 3000 cm−3, acting as coagulation volumes with the purpose of shifting the generated soot distributions towards larger sizes. A Differential Mobility Analyzer (DMA Model 3081; TSI Inc., Shoreview, MN, USA) was connected down-line through approximately four meters of quarter-inch stainless steel piping. The particle mobility diameter for a given experiment was chosen as the largest possible size while maintaining a reasonable number concentration. We studied particles with mobility diameters of 200–500 nm at typical number concentrations of 300–3700 cm−3. This variation between samples was due to the different particle size distributions each miniCAST operation gave rise to. The motivations for choosing relatively large particles from the size distributions were (i) that it resulted in a minimal contribution of multiply charged particles, and (ii) that larger particles are more likely to act as CCN (for detection of immersion freezing) and also as INPs. The potential impact of different particle mobility diameters and different particle number concentrations between experiments will be discussed below after the presentation of the ice nucleation results.
An ejector diluter (Dekati Inc., Kangasala, Finland) with multiple outputs and a dilution ratio of 4–10 was situated approximately two meters downstream of the DMA. From this, all included instruments collected the sample aerosol, with the exception of the SPIN continuous flow diffusion chamber (CFDC) and the associated condensation particle counter (CPC), which shared a collection line.
2.2. SPIN CFDC Set-Up & Data Analysis
The SPectrometer for Ice Nuclei (SPIN; Droplet Measurement Technologies, Longmont, CO, USA) used in this study has previously been described in the literature [28,29], so only a brief description is included here. The SPIN is a CDFC instrument used to examine ice nucleation properties of aerosol particles in real-time by exposing them to controlled RH and temperature conditions. It consists of a chamber with two parallel aluminium plates separated by 1.0 cm. The upper part comprises the main chamber, where ice nucleation may occur, and the lower part represents the evaporation section. In the current study, the temperatures measured by the uppermost 13 thermocouple pairs were used in the data analysis, as they represent the main chamber conditions [28]. A sample flow of 1.0 standard litres per minute (SLPM) was injected in between two clean air sheath flows of 4.5 SLPM each, along the aluminium chamber plates. We will refer to the ideal sample flow pathway through the main part of the chamber as the ’lamina’ in this study. The particle residence time in the ’lamina’ is approximately 10 s in the main section, and approximately 2 s in the evaporation section.
The chamber plates were coated with thin layers of ice and cooled down to different sub-zero temperatures, causing a gradient in temperature and partial water vapour pressure. From the non-linear relationship between temperature and saturation vapour pressure, this led to supersaturation with respect to ice in the lamina. The sample aerosol is exposed to isothermal conditions in the evaporation section, which is sub-saturated with respect to liquid water, but not with respect to ice crystals, causing any aqueous liquid particles to start evaporating. In the current study, the evaporation section temperature was set to follow the average lamina temperature. The particles are counted at the exit of the evaporation section with a size and polarization resolved optical particle counter (OPC), for diameters larger than about 0.5 μm. The SPIN CFDC has a relatively short evaporation section compared to some other similar CFDC instruments, with the consequence that ice crystals and cloud droplets co-exist under a larger range of operation conditions. To compensate for this, the SPIN OPC polarization data can be used as additional parameters for identification of ice particles if necessary.
The SPIN OPC measures size-resolved number concentrations of particles with a time resolution of 1 s. Since this version of the SPIN instrument OPC could not fully discern between droplet and ice particles with its polarization data, a size threshold of 5 μm was used for identification of ice mode particles. For the operation conditions applied in the current study, we have previously found that liquid droplets did not grow to sizes larger than 5 μm for a wide range of samples including hygroscopic aerosols [13]. The SPIN data are in our analysis averaged over 10 s to improve counting statistics, and chamber conditions do not change substantially over such short time intervals. The total number concentration from the condensation particle counter (CPC; Airmodus model A20) operated in parallel was averaged over the matching 10 s time intervals by compensating for the particle residence time in the SPIN. The ice-activated fraction () was then defined as the number of background corrected ice crystals against the total particle number concentration; for a given temperature. This may be biased for a number of reasons, which are discussed in more detail in the results Section 3.2 below.
In the experiments, we scanned a lamina temperature range from −41 to −32 °C at a constant supersaturation of approximately 10% with respect to liquid water. A typical complete scan took approximately 28 min, and consisted of a low-to-high and high-to-low temperature scan of approximately 10 min each as well as background measurements before and after the up-scans with a duration of about 2–3 min each. Only low-to-high temperature scans were used in the data analysis, since those scans have a high degree of temperature control [13]. was corrected for the linearly interpolated background in each scan. A homogeneous freezing reference was obtained for the same SPIN operation as described above using quasi-monodisperse ammonium sulfate (AS) particles with a dry mobility diameter of 350 nm and a number concentration of about 150 cm−3. The AS particles were generated from an aqueous solution with a nebulizer. The particles were dried with a diffusion dryer (RH < 10 %) before size selection with a DMA. Inside SPIN, the AS particles focused in the lamina acted as cloud condensation nuclei facilitating formation of super-micron sized dilute droplets for which the freezing temperature was determined. The homogeneous freezing reference may be biased low by about 0.1 °C due to the dissolved ammonium sulfate and the associated water activity based on similar considerations as Ignatius et al. [30].
2.3. SP-AMS Set-Up & Data Analysis
The Soot-Particle Aerosol Mass Spectrometer (SP-AMS; Aerodyne Research Inc., Billerica, MA, USA) [31] is a further development of the Aerodyne Aerosol Mass Spectrometer (AMS) [32]. It utilizes an intra-cavity laser, which enables vaporisation of highly refractory light absorbing particle material such as refractory black carbon (rBC). The instrument also contains a heated tungsten vaporiser (600 °C), which vaporizes non-refractory particulate matter, and while this tungsten vaporiser is always active, the intra-cavity laser can be turned on or off. The resulting vaporisation products are exposed to 70 eV electron ionization and positively charged ions are detected with a time-of-flight mass spectrometer. The SP-AMS calibration procedures used for this study are analogous to the ones described in detail by Malmborg et al. [33].
Two parameters based on refractory fragments intensity were derived from the SP-AMS data with intra-cavity laser on: (1) C3O2+ to C3+ signal ratio, (2) midcarbon (C6−29+) to all carbon (C1−59+) signal ratio, denoted as and , respectively. The C3O2+ to C3+ parameter was used for information related to refractory oxygen species such as surface oxides from the rBC cores, where C3O2+ is a marker for surface oxides only detected when the intra-cavity laser is on. The to ratio has been shown to correlate with fringe length, and can thus be related to the carbon nanostructure of the primary particles [33].
Additionally, concentrations of particle phase polycyclic aromatic hydrocarbons (PAHs) were quantified from the high resolution mass spectra, assuming a relative ionization efficiency of 1.4 and a collection efficiency of 1.0. We attributed the PAH signal using parent ions as detailed by Herring et al. [34]. Parent ions were estimated to account for 25% of the true PAH signal [35].
The current study extends the results presented by Malmborg et al. [33] and Török et al. [26] by extending the range of miniCAST setpoints, particularly by contrasting two different ways to alter soot properties (OP vs. SP series). While methodology and comparisons are made between this study and Malmborg et al. [33], it should be noted that Malmborg et al. [33] studied polydisperse soot populations, whereas this study examined quasi-monodisperse populations.
2.4. APM Set-Up & Data Analysis
We used an Aerosol Particle Mass analyser (APM model 3600; Kanomax, Osaka, Japan) to infer the effective density of the mobility size-selected soot particles. The APM principle utilizes the balance of electrostatic and centrifugal forces to select particles of a specific mass-to-charge ratio [36]. The APM consists of a centrifuge made up of one outer and one inner slightly smaller electrode cylinder, in-between which the aerosol particles pass. A voltage is supplied between the electrodes, and thus particles are exposed to both an electrostatic and a centrifugal force. The mass-selected particles are then counted with a CPC.
In our experiments, we varied the rotation speed of the APM in each scan, while the voltage between the electrodes were kept constant to obtain a distribution of particle number concentration as a function of the particle mass. The particle effective density was calculated from the relationship in Equation (1),
where is the geometric mean particle mass of a normal fit over the obtained mass-number distribution data; the mobility equivalent particle diameter.
2.5. Aethalometer Set-Up & Data Analysis
An aethalometer (model AE33; Magee Sci., Berkeley, CA, USA) was used to evaluate equivalent black carbon (eBC) concentrations, and absorption Angstrom exponent (AAE) for each soot sample [26]. The AAE was calculated by performing a least-squares logarithmic fit of the relationship in Equation (2) for wavelengths 370, 470, 520, 590, 660, and 880 nm,
where is wavelength, is the absorption coefficient at wavelength , and a wavelength-independent constant.
It should be noted that the aethalometer may be cross-sensitive to particle scattering artifacts for particles with single scattering albedo (SSA) close to 1 [37], thus may be overestimated and AAE may be biased high. According to the DMA-APM analysis all miniCAST setpoints except SP3 were consistent with soot agglomerates of small primary particles for which the SSA is ≪1, and thus such bias is negligible. The SP3 results were consistent with compact particles ( = 240 nm) that may have a higher SSA, which may possibly result in a weak bias of the AAE measurements due to particle scattering artifacts.
The measured eBC concentrations were compared to filter-based elemental carbon measurements for mature soot from a diesel engine in connection to this campaign. A correction factor of 2.8 was applied to the measured eBC concentration as described by Gren et al. [38]. It should be noted that this correction factor is not used for the Korhonen et al. [13] dataset, which is shown together with the data of this study.
3. Results and Discussion
3.1. Soot Characterization
The physico-chemical properties for the eight studied soot particle samples are presented in Figure 2. The presented properties are the Angstrom exponent, effective density, three parameters based on the AMS and SP-AMS mass spectra: /, C3O2+/C3+, PAH/eBC, and finally the mean mobility diameter from the quasi-monodisperse particle population. The samples represent the miniCAST setpoints listed in Table 1, and in Figure 2, they are arranged on the x-axis by order of setpoint numbering. There is a tendency of increasing , , /, PAH/eBC and decreasing C3O2+/C3+ with increasing OP# and SP#, respectively. The overall trends in the reported properties agree well with less complete combustion and less mature soot particles with increasing OP# or SP#, respectively, as could be expected from the settings in Table 1. In the following paragraphs, the different presented properties will be addressed in more detail. The values and uncertainties presented in Figure 2 are available in Table S1.
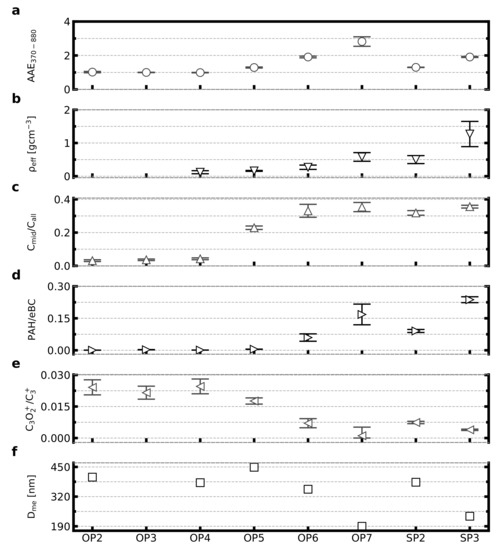
Figure 2.
Physico-chemical properties of the eight studied samples (Table 1). From top to bottom: (a) absorption Angstrom exponent for wavelengths 370–880 nm, (b) particle effective density, (c) SP-AMS midcarbon to all carbon signal ratio, (d) SP-AMS concentration of particle phase polycyclic aromatic hydrocarbons normalised to aethalometer black carbon concentration, (e) SP-AMS C3O2+ to C3+ signal ratio, and (f) mean mobility equivalent diameter for each miniCAST setpoint sample. The sample setpoints on the x-axis are ordered by setpoint series and numbering. Effective density is omitted for OP2 due to low APM data quality, and effective density and mobility diameter is omitted for OP3 due to SMPS size distribution data not being monodisperse over the measurement period. A correction factor of 2.8 was used for the eBC data from this study. Uncertainties presented are of one standard deviation from the variability in recorded data during sampling. A point corresponds to 5–10 min of data collection.
Increasing OP# correlates with a higher AAE370–880, i.e., increasingly less mature soot particles, and is in relatively good agreement with previous measurements on polydisperse size distributions with an AAE370–880 for OP7 at around 3 [26]. The same increasing trend is seen for the SP samples, although with AAE values of 1.3 and 1.9. The samples OP2–OP4 have AAE of 1.0, in agreement with mature soot.
It is not straightforward to compare the effective densities directly, since there is typically a significant decrease in effective density with increasing mobility diameter for soot particles [23,39,40]. However, a few things can be noted: all samples except SP3 have an effective density below 0.65 gcm−3, which are typical values for soot agglomerates with mobility diameters above 150 nm. In contrast, the effective density for the SP3 particles of about 1.3 gcm−3 is indicative of more compact particles most likely with a significant fraction of organic species as reported by Ess et al. [25]. The SP3 particles are thus substantially different from the soot agglomerates produced with the OP-settings in this respect. It can also be pointed out that the SP2 sample has significantly higher effective density compared to OP6 (0.50 and 0.27 gcm−3, respectively), even if the mobility diameter of SP2 is slightly larger (383 and 352 nm, respectively). Consequently, both SP samples are associated with higher effective density (rounder particles) compared to the OP samples at similar particle sizes. The effective density could not be obtained for OP2 and OP3. OP2 measurements suffered from low APM data quality, and during OP3 measurements the SMPS size distribution data was not monodisperse over the APM measurement period, leading to the APM data being unreliable.
The SP-AMS soot maturity marker has elevated values (>0.2) for all samples with AAE370–880 > 1.2 (OP5–OP7 and SP2–SP3). / correlates with AAE370–880 up to OP6, after which the signal remains at around 0.30–0.35, including for the SP samples. It deserves to be pointed out that has a high value of about 0.3 for SP2 soot even if the is as low as 1.3. has been shown to correlate with the fraction of refractory organic carbon from thermal optical analysis [33,41], and SP2 soot has been shown to consist of as much as 50% OC [25], which may possibly explain the results. In comparison, OP3 particles consist of <5% OC and OP5 particles consist of about 20% OC [26]. The results indicate that there are also additional contributors to the AAE that are not related to , for example increased fractions of semi-volatile organic compounds including PAHs, which absorb light in the UV-spectrum and increase the AAE370–880 [26]. The PAH/eBC ratio was substantially higher for the samples with AAE370–880≥ 1.3 (OP6–7 and SP2–3) compared to the samples with AAE370–880 = 1.0 (OP2–OP4). Based on the above results we conclude that OP2–4 represent mature soot with AAE370–880 = 1.0 and soot maturity marker below 0.042. OP5–7 and SP2–3 all have AAE370–880> 1.2 and soot maturity markers > 0.2, and thus we consider these to represent partially mature soot. In the Supplemental Material Figure S1, we provide a correlation matrix overview of all measured parameters for all studied soot particle samples in this study, as well as in Figure S2a an equivalent correlation matrix overview for the partially mature soot subset.
As shown in Figure S1 the two different markers of surface oxidation CO2+/C3+ [42] and C3O2+/C3+ are highly correlated with each other (r = 0.95). In the main analysis in this paper, we focus on the C3O2+/C3+ parameter as marker of soot surface oxidation. This parameter increases with increasing soot maturity levels for both the SP and OP series. The surface oxidation parameter was highly correlated with decreasing PAH/BC ratios and also increased values of the soot maturity marker (/) as shown in Figure S1. It is possible that the observed decrease in the soot oxidation marker with increasing OP# and SP# is due to reduced combustion temperatures for these cases leading to inefficient oxidation of the soot [43].
It can be seen that the PAH/eBC ratio is in general higher for the SP samples compared to the OP samples. For example, SP2 has a higher PAH/eBC ratio compared to OP6 (at similar mobility diameters) even if the AAE370–880 is lower for SP2. Notably, the OP6 and SP3 particles have almost identical values in terms of , C3O2+/C3+, and similar in terms of AAE while showing a large difference in PAH/eBC ratio and effective density. This suggests similarities in the maturity of the soot core, and a difference in the concentration of semi-volatile organic compounds. Subsequently, this implies that there are some key differences in the particle properties when either varying the combustion conditions in the miniCAST by controlling just the global air-to fuel ratio (SP setpoints), or by mainly controlling the combustion conditions by diluting the fuel with inert gas (OP setpoints).
In summary, we have studied a range of soot particles with significantly different physico-chemical properties. The more black samples with AAE370–880 = 1.0 (OP2–4) are mature soots in many respects similar to soot particles emitted from diesel engines. The partially matured soot (more brown particles OP5–7, SP2–3) are more representative of soot particles generated from less-complete flaming combustion, associated with oxygen-starved combustion and increased PAH emissions [41]. These may be more commonly found in biomass combustion emissions [44], with the main difference that the organic aerosol in biomass combustion emissions are often dominated by other species. For example, anhydrous sugars and methoxy phenols among others are added to biomass combustion emissions [45].
The soot maturity marker , AAE and PAH/BC are all strongly correlated with each other, and all show increased values as the combustion process is altered towards less complete combustion and reduced combustion temperatures for both OP and SP cases. There were also strong anti-correlations between these markers and the surface oxidation parameter. As described above, these are all expected trends from past research. Any correlation found between ice nucleation ability and these parameters may be from causality, but because several parameters are closely correlated with each other, it is hard to ensure such causality.
3.2. Soot Ice Nucleation Properties
Results of the ice-activated fraction in the immersion mode for the temperature range −41 to −32 °C at a constant supersaturation of approximately 10% with respect to liquid water are presented in Figure 3. Each data point represents an average over 10 s of measurements. In Figure 3a, the ‘raw’ inferred as described above, and in Figure 3b the linearly corrected of the same data is presented. The values and uncertainties of the the ‘raw’ is available in Tables S2 and S3. We observed an overall low immersion-mode ice nucleation activity in our experiments. Before discussing the implications of those results, we will discuss potential biases. It is noteworthy that the maximum in the ‘raw’ AF is below 0.2 for an average lamina temperature of −41 °C for all samples. For such a low average lamina temperature, we would expect the vast majority of formed cloud droplets in the lamina to be frozen, so ideally an AF close to 1 would be expected. There are several reasons for non-ideal behaviour of CFDCs in general, which are discussed in more detail by Garimella et al. [46], DeMott et al. [29] and Korhonen et al. [13]. In the current study, we use an identical operation procedure and the same SPIN instrument as Korhonen et al. [13], who provide a more detailed discussion about biases and corrections to the AF as inferred in this study. Thus, in the following paragraph, we provide a short summary of the relevant biases.
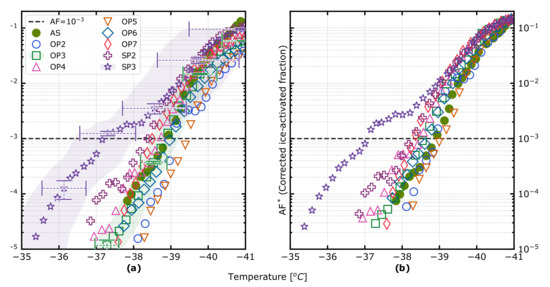
Figure 3.
(a) Ice-activated fraction () as a function of temperature for each setpoint sample, as detected by the SPIN. Uncertainties are presented for the OP3 and SP3 cases as one standard deviation in each dimension. (b) Corrected ice-activated fraction () as a function of temperature for each setpoint sample, where low-biased samples are normalised with respect to the ammonium sulfate homogeneous freezing reference (denoted AS in the legend) for the lowest temperatures at which all droplets are assumed to have been frozen. The dashed line denotes the threshold for which was chosen.
With the applied operation conditions, we expect the ‘raw’ AF most likely to be biased low by a factor of 3–5 for an average lamina temperature of about −33 °C with the correction factor approaching 5–10 for an average lamina temperature of about −40 °C [13]. Those correction estimates are based on two effects: (i) only a fraction of the sample being located in the lamina [46,47], and (ii) a fraction of the ice mode particles being present with optical diameters below our ice threshold of 5 μm, with the latter correction factor being temperature dependent in the investigated interval [13]. In the current study, we need to consider an additional effect. The CCN activity of MiniCAST samples have been reported to be undetectable to extremely low [23]. Hence, a significant fraction of the very hydrophobic soot particles were unlikely to act as CCN inside SPIN preventing subsequent immersion freezing, which biased the AF low. That bias is the most likely explanation for the lower AF at −41 °C for several of the soot samples relative to the homogenous freezing reference.
In other words, the reported immersion freezing ’raw’ AF may be biased significantly low reflecting the particles being hydrophobic rather than necessarily having a low ice-nucleating ability. Thus, the results presented in Figure 3a reflect the total effect of (i) CCN activity, and (ii) immersion freezing ability. In Figure 3b, the same INP spectra for the soot samples have been linearly scaled to coincide with the homogeneous freezing reference at −41 °C as a mean to correct for the low to extremely low CCN activity for those samples, allowing for a more direct comparison of the immersion freezing ability alone. In case the small fraction of detected INPs is representative of the ensemble sample, then the scaled AF (AF*) gives a reasonable estimate of the immersion freezing ability in comparison to the other samples. In case the CCN active and subsequently frozen droplets were facilitated by a subset of relatively larger particles, then the AF* can be considered an upper estimate. The second scenario appears more likely—so we consider the scaled AFs presented in Figure 3b as upper estimates for the soot samples. Based on the sample particle number concentrations (Table S1) and the work by Levin et al. [12], we consider it unlikely that pronounced water vapour depletion occurred inside SPIN. However, if water vapour depletion did to some extent bias the AF low, then the AF* can still be considered an upper estimate.
Regardless of whether the results presented in Figure 3a,b are considered, the general relative findings between the soot samples appear robust considering that potential correction factors are associated with some uncertainty.
The most immersion freezing ice-active sample appears to be SP3, with an at a temperature of T = −37.2 °C, and an at −36.0 °C, representing temperatures of around 1.7 and 1.9 K higher than for homogeneous freezing, respectively. The other soot samples appear to facilitate immersion freezing very close to and up to about 1.0 K higher than the homogeneous freezing reference. The range in the average lamina temperature that a given sample was exposed to was comparable to those reported by Korhonen et al. [13], typically around ±0.4 °C for a given point in a scan. The random uncertainties in the AF were derived as described by Korhonen et al. [13] based on error propagation involving the random errors on (i) the CPC measurements, (ii) the ice crystal counts detected with the SPIN OPC and (iii) the SPIN internal background. The largest relative random errors are associated with the lowest AFs due to the relative random error on the counts of ice crystals increasing with decreasing ice crystal counts. We have chosen to include only a subset of those error-ranges in the figure in order to improve readability—and because such random errors can be misleading, considering that systematic errors often are significantly more pronounced for CFDCs—though not well-constrained. If we assume a reproducibility of about ±0.2 K or less for average lamina ice-onset temperature between different scans on a given sample, as typically reported by Korhonen et al. [13] for the same SPIN operation, then it seems reasonable to argue that also the SP2, OP4 and OP7 samples appear to facilitate heterogeneous freezing for temperatures slightly but consistently above the homogeneous freezing reference for T > −39.0 °C. The overall low immersion mode ice activation observed under water-saturated conditions for all the samples is in agreement with previous studies, which also found freshly produced soot particles to be inefficient ice-nucleators in the immersion mode [10,11,12,14].
It is noteworthy that the AF of the SP3 sample overlaps with the AFs for the SP2 and OP7 for T < −38.5 °C, while the SP3 is relatively more ice-active for T > −38.5 °C. It could potentially be due to a minor sub-population of particles with different physico-chemical characteristics promoting ice nucleation for the SP3 sample. It is unclear how much particle properties potentially varied within a single sample in the current study since our measurement approaches characterized full ensemble (average) properties. However, we cannot rule out that multiply charged particles may have played a role for the SP3 AF in this context.
Much of the literature supports the view that the ice-nucleating ability should increase with aerosol particle size as it correlates with available surface area, and thus number of possible nucleation sites (e.g., [17,48]). Ideally, the results presented in Figure 3 should be normalised to the respective particle surface areas. However, we did not measure particle surface area in the current study, and the conversion from mobility diameter to surface area may be significantly different for the different samples investigated. It is worth noting that some of the more ice-active samples, such as the partially matured soot SP3 and OP7 samples, have significantly smaller mobility diameters than the more mature soot samples. Hence, in terms of the ice-active site density, the differences between the partially matured soot samples relative to the more mature samples are most likely more pronounced than what is visible from the results in Figure 3. Despite the lack of an optimal way to intercompare the ice-nucleating ability of the different samples, we still find it relevant to compare the differences in the ice nucleation onset temperature to the corresponding physico-chemical particle properties, as we expect most relative differences in ice nucleation onset temperature to remain robust or to be enhanced if normalisation to particle surface area was carried out.
The ice-activity in terms of the average lamina temperatures for an () has been compared to all the physico-chemical properties presented in Figure 2. In Figure 4, we present three examples of such comparisons as scatter plots in (a) with all samples included, and in (b) with only the partially matured soot particle samples included. The relevant correlation coefficients are included in the subfigures. Correlation matrices for cases a and b, including all parameters used in this study, can be seen in Figures S1 and S2a, respectively. Significant correlations are observed between and the as well as the PAH/eBC for the entire ensemble as well as for the partially matured subset of soot particles. Hence, for the these soot samples, a higher relative fraction of organics and PAHs may enhance the immersion freezing ice-activity. However, it should be kept in mind that this dataset is limited in terms of variability in ice-activity.
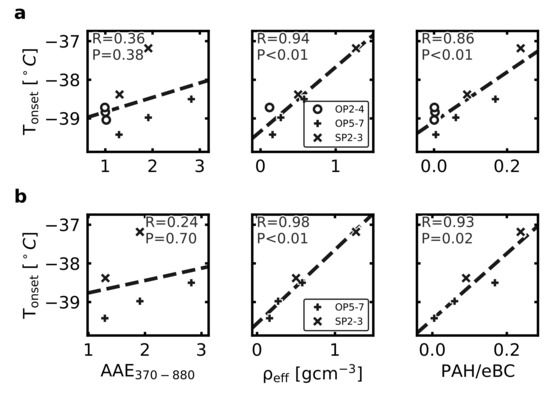
Figure 4.
Pearson correlation plots for (a) both mature (OP2–4) and partially matured (OP5–7, SP2–3) soot particle experiments, and (b) partially matured soot particle experiments only (OP5–7, SP2–3), between onset temperature derived from data (Figure 3b) and the AAE, and PAH/eBC parameters examined in this study. Presented in each panel is correlation coefficient R and associated p-value. Significant correlations for and PAH/eBC could be seen for the full particle ensemble as well as for the partially matured soot subgroup. Distinction is made in the plots between setpoints OP2–4 marked with circles, OP5–7 marked with pluses, and SP2–3 marked with crosses.
In addition, those apparently significant correlations should be considered with precaution for several reasons. Firstly, it is a small ensemble with only modest differences from homogeneous freezing temperatures, so it cannot be ruled out that the correlation to some extent is linked to the particle CCN activity influencing the number fraction of formed droplets for subsequent homogenous freezing. Secondly, the is typically size dependent for soot particles, and if identical mobility diameters had been studied for those samples—the picture would likely change from what is depicted in Figure 4b. Thirdly, the observed correlations may not necessarily be due to a direct causality. The combustion conditions favouring relatively higher and PAH fractions may also favour the presence of other components, potentially improving the immersion freezing ice-nucleating ability. In order to extend the analysis to include a few more ice-active soot samples, we include the five biomass combustion samples investigated with identical instrumentation and approaches by Korhonen et al. [13]. This more extensive inter-comparison is presented in Figure 5. A correlation matrix overview for all soot particles in this study as well as the soot particles from the Korhonen et al. [13] study, including all parameters used by this study, can be found in Figure S2b. Parameters AAE370–880, , , C3O2+/C3+, and were taken directly from the Korhonen et al. [13] study, while the PAH/eBC parameter was inferred for this study specifically. Still, we do not observe any clear link between ice-activity and the studied physico-chemical soot properties.
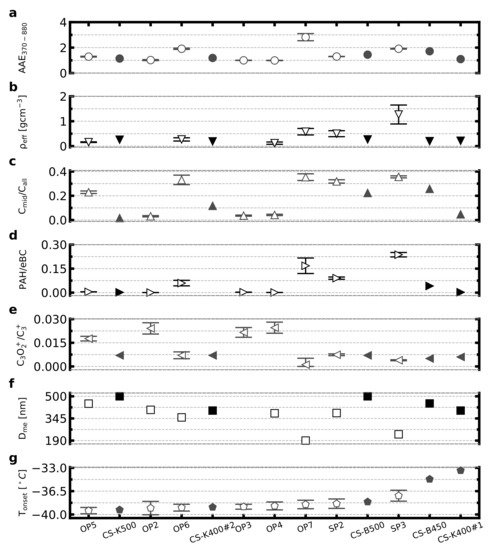
Figure 5.
From top to bottom: (a) absorption Angstrom exponent for wavelengths 370 to 880 nm, (b) particle effective density, (c) SP-AMS midcarbon to all carbon signal ratio, (d) SP-AMS concentration of particle phase polycyclic aromatic hydrocarbons normalised to aethalometer black carbon concentration, (e) SP-AMS C3O2+ to C3+ signal ratio, (f) mean mobility equivalent diameter, and (g) onset temperature derived from data (Figure 3b), for each miniCAST setpoint sample (presented as white markers in the figure). The sample setpoints on the x-axis are in order of increasing onset temperature. Results of Korhonen et al. [13] for immersion mode IN from forced draft gasifiers burning spruce/pine-mixture pellets are included (presented as black markers and prefixed with CS on the x-axis), with the exception of two experiments where AMS data did not allow for inferring PAH levels. Effective density is omitted for OP2 due to low APM data quality, and effective density and mobility diameter is omitted for OP3 due to SMPS size distribution data not being monodisperse over the measurement period. A correction factor of 2.8 was used for the eBC data from this study. Uncertainties presented are of one standard deviation from the variability in recorded data during sampling. A point represents 5–10 min of data collection.
It is noteworthy that the two most ice-active soot samples do not appear to have elevated levels of , PAH/eBC and AAE, within this extended sample ensemble. Hence, while we cannot rule out that it may be possible to identify links between physico-chemical properties and immersion freezing ice-activity for certain soot-type subgroups, it appears challenging to identify general relations. These observations support the conclusion from Korhonen et al. [13], that it does not appear straightforward to link the ice-nucleating ability of these types of freshly produced soot particles to their physico-chemical properties studied here, at least not in any simple manner. In general, these observations raise the question as to whether it may be possible in general, to identify the ice-nucleating ability of freshly produced soot particles based on their physico-chemical properties obtained from ensemble online methods. Further detailed studies including a larger number of ice-active soot samples are needed to fully address that question.
4. Conclusions
Mobility size-selected soot samples generated with a miniCAST burner at eight different settings representing a large matrix of soot maturity and particle properties were studied. These samples were characterized with respect to their effective density, optical properties, soot surface oxidation, PAH levels and fragmentation related to particle nano-structure. The different samples represented a wide range of different physico-chemical properties. The soot maturity was controlled in two different ways, by altering the global air to fuel ratio (SP settings) and by a combination of reducing the oxidation air flow and simultaneously diluting the fuel with an inert gas (OP settings). The two ways to alter the soot properties showed similar results for many parameters, but clear differences in particle morphology and the PAH/eBC ratio were found. The samples were also examined for immersion mode ice-activated fraction with the SPIN continuous flow diffusion chamber, for −41 < T < −32 °C and a constant supersaturation of 10% with respect to liquid water. Out of the eight studied soot samples, only one exhibited clearly discernible heterogeneous immersion mode freezing patterns, while indications of heterogeneous freezing for temperatures slightly above the homogeneous freezing reference was observed for another three samples. The freezing patterns were very similar to the homogeneous freezing reference for the rest of the studied samples when corrections for poor CCN activity were carried out. The results indicate that these types of freshly produced, partially matured to mature soot particles have low-to-insignificant immersion freezing ice-nucleating ability.
Attempts were made to link the ice-nucleating ability to the physico-chemical particle properties. There are indications that increasing levels of organics and PAHs may enhance the ice-activity slightly for the generated soot particles. When the inter-comparison between ice-activity and physico-chemical properties was extended to include similar results presented by Korhonen et al. [13] for biomass combustion soot particles, then no clear correlations could be observed. Hence, it is highly questionable whether ice-active soot particles in general can be identified based on their physico-chemical properties measured with the online instrumentation methods used by this study.
Supplementary Materials
The following are available online at https://www.mdpi.com/article/10.3390/atmos12091173/s1, Figure S1: Pearson correlation matrices for the partially matured particle data points of this study including all the parameters presented in this study, including the CO2+/C3+ surface oxidation marker [42]. Figure S2: Pearson correlation matrices for all of the soot particle data of this study, as well as the Korhonen et al. [13] study, for all physico-chemical parameters investigated in this study, including the CO2+/C3+ surface oxidation marker [42]. Table S1: All physico-chemical particle parameters used in this study, including associated one standard deviation values. Table S2: Ice-activated fraction as a function of SPIN mean lamina temperature for soot particles OP2–5 investigated in this study, including associated one standard deviation values. Table S3: Ice-activated fraction as a function of SPIN mean lamina temperature for soot particles OP6–7, SP2–3 and ammonium sulfate homogeneous freezing reference investigated in this study, including associated one standard deviation values.
Author Contributions
Conceptualization: T.B.K., J.F., K.K., B.S., V.B.M. and J.P.; methodology: J.F., T.B.K., V.B.M., J.P., L.G. and P.K.; software: J.F. and T.B.K.; validation: all authors; formal analysis: J.F., T.B.K., J.P., V.B.M. and A.C.E.; investigation: J.F., T.B.K., K.K. and V.B.M.; resources: B.S., J.P., P.K., L.M., P.-E.B. and A.V.; data curation: J.F., T.B.K., V.B.M. and A.C.E.; writing—original draft preparation: J.F. and T.B.K.; writing—review and editing: all authors; visualization: J.F. and T.B.K.; supervision: T.B.K., B.S., J.P. and A.V.; funding acquisition and project administration: J.P., T.B.K. and B.S. All authors have read and agreed to the published version of the manuscript.
Funding
This project was funded by Formas (grant number 2015-00992), Swedish Research Council VR (grant number 2017-05016; J.P., V.M., A.E. and L.G. were funded by grant number 2018-04200).
Data Availability Statement
The data presented in this study are available in supplementary materials.
Acknowledgments
We are very grateful for the Lund University mechanical engineering personnel who assisted in peripheral matters during the measurement campaign. We are grateful for the stimulating scientific discussions with Erik Thompson and other members within the strategic research area MERGE.
Conflicts of Interest
The authors declare no conflict of interest. The funders had no role in the design of the study; in the collection, analyses, or interpretation of data; in the writing of the manuscript, or in the decision to publish the results.
References
- Ramanathan, V.; Carmichael, G. Global and regional climate changes due to black carbon. Nat. Geosci. 2008, 1, 221–227. [Google Scholar] [CrossRef]
- Koehler, K.A.; DeMott, P.J.; Kreidenweis, S.M.; Popovicheva, O.B.; Petters, M.D.; Carrico, C.M.; Kireeva, E.D.; Khokhlova, T.D.; Shonija, N.K. Cloud condensation nuclei and ice nucleation activity of hydrophobic and hydrophilic soot particles. Phys. Chem. Chem. Phys. 2009, 11, 7906. [Google Scholar] [CrossRef]
- Yun, Y.; Penner, J.E.; Popovicheva, O. The effects of hygroscopicity on ice nucleation of fossil fuel combustion aerosols in mixed-phase clouds. Atmos. Chem. Phys. 2013, 13, 4339–4348. [Google Scholar] [CrossRef]
- Michelsen, H.A.; Colket, M.B.; Bengtsson, P.E.; D’Anna, A.; Desgroux, P.; Haynes, B.S.; Miller, J.H.; Nathan, G.J.; Pitsch, H.; Wang, H. A Review of Terminology Used to Describe Soot Formation and Evolution under Combustion and Pyrolytic Conditions. ACS Nano 2020, 14, 12470–12490. [Google Scholar] [CrossRef] [PubMed]
- Tree, D.R.; Svensson, K.I. Soot processes in compression ignition engines. Prog. Energy Combust. Sci. 2007, 33, 272–309. [Google Scholar] [CrossRef]
- Falco, G.D.; Sirignano, M.; Commodo, M.; Merotto, L.; Migliorini, F.; Dondè, R.; Iuliis, S.D.; Minutolo, P.; D’Anna, A. Experimental and numerical study of soot formation and evolution in co-flow laminar partially premixed flames. Fuel 2018, 220, 396–402. [Google Scholar] [CrossRef]
- Apicella, B.; Pré, P.; Alfè, M.; Ciajolo, A.; Gargiulo, V.; Russo, C.; Tregrossi, A.; Deldique, D.; Rouzaud, J. Soot nanostructure evolution in premixed flames by High Resolution Electron Transmission Microscopy (HRTEM). Proc. Combust. Inst. 2015, 35, 1895–1902. [Google Scholar] [CrossRef]
- Botero, M.L.; Chen, D.; González-Calera, S.; Jefferson, D.; Kraft, M. HRTEM evaluation of soot particles produced by the non-premixed combustion of liquid fuels. Carbon 2016, 96, 459–473. [Google Scholar] [CrossRef]
- Bond, T.C.; Doherty, S.J.; Fahey, D.W.; Forster, P.M.; Berntsen, T.; DeAngelo, B.J.; Flanner, M.G.; Ghan, S.; Kärcher, B.; Koch, D.; et al. Bounding the role of black carbon in the climate system: A scientific assessment. J. Geophys. Res. Atmos. 2013, 118, 5380–5552. [Google Scholar] [CrossRef]
- Schill, G.P.; Jathar, S.H.; Kodros, J.K.; Levin, E.J.T.; Galang, A.M.; Friedman, B.; Link, M.F.; Farmer, D.K.; Pierce, J.R.; Kreidenweis, S.M.; et al. Ice-nucleating particle emissions from photochemically aged diesel and biodiesel exhaust. Geophys. Res. Lett. 2016, 43, 5524–5531. [Google Scholar] [CrossRef]
- Chou, C.; Kanji, Z.A.; Stetzer, O.; Tritscher, T.; Chirico, R.; Heringa, M.F.; Weingartner, E.; Prévôt, A.S.H.; Baltensperger, U.; Lohmann, U. Effect of photochemical ageing on the ice nucleation properties of diesel and wood burning particles. Atmos. Chem. Phys. 2013, 13, 761–772. [Google Scholar] [CrossRef]
- Levin, E.J.T.; McMeeking, G.R.; DeMott, P.J.; McCluskey, C.S.; Carrico, C.M.; Nakao, S.; Jayarathne, T.; Stone, E.A.; Stockwell, C.E.; Yokelson, R.J.; et al. Ice-nucleating particle emissions from biomass combustion and the potential importance of soot aerosol. J. Geophys. Res. Atmos. 2016, 121, 5888–5903. [Google Scholar] [CrossRef]
- Korhonen, K.; Kristensen, T.B.; Falk, J.; Lindgren, R.; Andersen, C.; Carvalho, R.L.; Malmborg, V.; Eriksson, A.; Boman, C.; Pagels, J.; et al. Ice-nucleating ability of particulate emissions from solid-biomass-fired cookstoves: An experimental study. Atmos. Chem. Phys. 2020, 20, 4951–4968. [Google Scholar] [CrossRef]
- Vergara-Temprado, J.; Holden, M.A.; Orton, T.R.; O’Sullivan, D.; Umo, N.S.; Browse, J.; Reddington, C.; Baeza-Romero, M.T.; Jones, J.M.; Lea-Langton, A.; et al. Is Black Carbon an Unimportant Ice-Nucleating Particle in Mixed-Phase Clouds? J. Geophys. Res. Atmos. 2018, 123, 4273–4283. [Google Scholar] [CrossRef]
- Ullrich, R.; Hoose, C.; Möhler, O.; Niemand, M.; Wagner, R.; Höhler, K.; Hiranuma, N.; Saathoff, H.; Leisner, T. A New Ice Nucleation Active Site Parameterization for Desert Dust and Soot. J. Atmos. Sci. 2017, 74, 699–717. [Google Scholar] [CrossRef]
- Kanji, Z.A.; Welti, A.; Corbin, J.C.; Mensah, A.A. Black Carbon Particles Do Not Matter for Immersion Mode Ice Nucleation. Geophys. Res. Lett. 2020, 47, e2019GL086764. [Google Scholar] [CrossRef]
- DeMott, P.J. An Exploratory Study of Ice Nucleation by Soot Aerosols. J. Appl. Meteorol. 1990, 29, 1072–1079. [Google Scholar] [CrossRef]
- Diehl, K.; Mitra, S. A laboratory study of the effects of a kerosene-burner exhaust on ice nucleation and the evaporation rate of ice crystals. Atmos. Environ. 1998, 32, 3145–3151. [Google Scholar] [CrossRef]
- Gorbunov, B.; Baklanov, A.; Kakutkina, N.; Windsor, H.; Toumi, R. Ice nucleation on soot particles. J. Aerosol Sci. 2001, 32, 199–215. [Google Scholar] [CrossRef]
- Murray, B.J.; O’Sullivan, D.; Atkinson, J.D.; Webb, M.E. Ice nucleation by particles immersed in supercooled cloud droplets. Chem. Soc. Rev. 2012, 41, 6519–6554. [Google Scholar] [CrossRef]
- Schill, G.P.; DeMott, P.J.; Emerson, E.W.; Rauker, A.M.C.; Kodros, J.K.; Suski, K.J.; Hill, T.C.J.; Levin, E.J.T.; Pierce, J.R.; Farmer, D.K.; et al. The contribution of black carbon to global ice nucleating particle concentrations relevant to mixed-phase clouds. Proc. Natl. Acad. Sci. USA 2020, 117, 22705–22711. [Google Scholar] [CrossRef] [PubMed]
- Hoose, C.; Kristjánsson, J.E.; Chen, J.P.; Hazra, A. A Classical-Theory-Based Parameterization of Heterogeneous Ice Nucleation by Mineral Dust, Soot, and Biological Particles in a Global Climate Model. J. Atmos. Sci. 2010, 67, 2483–2503. [Google Scholar] [CrossRef]
- Moore, R.H.; Ziemba, L.D.; Dutcher, D.; Beyersdorf, A.J.; Chan, K.; Crumeyrolle, S.; Raymond, T.M.; Thornhill, K.L.; Winstead, E.L.; Anderson, B.E. Mapping the Operation of the Miniature Combustion Aerosol Standard (Mini-CAST) Soot Generator. Aerosol Sci. Technol. 2014, 48, 467–479. [Google Scholar] [CrossRef]
- Mamakos, A.; Khalek, I.; Giannelli, R.; Spears, M. Characterization of Combustion Aerosol Produced by a Mini-CAST and Treated in a Catalytic Stripper. Aerosol Sci. Technol. 2013, 47, 927–936. [Google Scholar] [CrossRef]
- Ess, M.; Ferry, D.; Kireeva, E.; Niessner, R.; Ouf, F.X.; Ivleva, N. In situ Raman microspectroscopic analysis of soot samples with different organic carbon content: Structural changes during heating. Carbon 2016, 105, 572–585. [Google Scholar] [CrossRef]
- Török, S.; Malmborg, V.B.; Simonsson, J.; Eriksson, A.; Martinsson, J.; Mannazhi, M.; Pagels, J.; Bengtsson, P.E. Investigation of the absorption Ångström exponent and its relation to physicochemical properties for mini-CAST soot. Aerosol Sci. Technol. 2018, 52, 757–767. [Google Scholar] [CrossRef]
- Maricq, M.M. Examining the Relationship Between Black Carbon and Soot in Flames and Engine Exhaust. Aerosol Sci. Technol. 2014, 48, 620–629. [Google Scholar] [CrossRef]
- Garimella, S.; Kristensen, T.B.; Ignatius, K.; Welti, A.; Voigtländer, J.; Kulkarni, G.R.; Sagan, F.; Kok, G.L.; Dorsey, J.; Nichman, L.; et al. The SPectrometer for Ice Nuclei (SPIN): An instrument to investigate ice nucleation. Atmos. Meas. Tech. 2016, 9, 2781–2795. [Google Scholar] [CrossRef]
- DeMott, P.J.; Möhler, O.; Cziczo, D.J.; Hiranuma, N.; Petters, M.D.; Petters, S.S.; Belosi, F.; Bingemer, H.G.; Brooks, S.D.; Budke, C.; et al. The Fifth International Workshop on Ice Nucleation phase 2 (FIN-02): Laboratory intercomparison of ice nucleation measurements. Atmos. Meas. Tech. 2018, 11, 6231–6257. [Google Scholar] [CrossRef]
- Ignatius, K.; Kristensen, T.B.; Järvinen, E.; Nichman, L.; Fuchs, C.; Gordon, H.; Herenz, P.; Hoyle, C.R.; Duplissy, J.; Garimella, S.; et al. Heterogeneous ice nucleation of viscous secondary organic aerosol produced from ozonolysis of α-pinene. Atmos. Chem. Phys. 2016, 16, 6495–6509. [Google Scholar] [CrossRef]
- Onasch, T.B.; Trimborn, A.; Fortner, E.C.; Jayne, J.T.; Kok, G.L.; Williams, L.R.; Davidovits, P.; Worsnop, D.R. Soot Particle Aerosol Mass Spectrometer: Development, Validation, and Initial Application. Aerosol Sci. Technol. 2012, 46, 804–817. [Google Scholar] [CrossRef]
- DeCarlo, P.F.; Kimmel, J.R.; Trimborn, A.; Northway, M.J.; Jayne, J.T.; Aiken, A.C.; Gonin, M.; Fuhrer, K.; Horvath, T.; Docherty, K.S.; et al. Field-Deployable, High-Resolution, Time-of-Flight Aerosol Mass Spectrometer. Anal. Chem. 2006, 78, 8281–8289. [Google Scholar] [CrossRef]
- Malmborg, V.B.; Eriksson, A.C.; Török, S.; Zhang, Y.; Kling, K.; Martinsson, J.; Fortner, E.C.; Gren, L.; Kook, S.; Onasch, T.B.; et al. Relating aerosol mass spectra to composition and nanostructure of soot particles. Carbon 2019, 142, 535–546. [Google Scholar] [CrossRef]
- Herring, C.L.; Faiola, C.L.; Massoli, P.; Sueper, D.; Erickson, M.H.; McDonald, J.D.; Simpson, C.D.; Yost, M.G.; Jobson, B.T.; VanReken, T.M. New Methodology for Quantifying Polycyclic Aromatic Hydrocarbons (PAHs) Using High-Resolution Aerosol Mass Spectrometry. Aerosol Sci. Technol. 2015, 49, 1131–1148. [Google Scholar] [CrossRef]
- Malmborg, V.B.; Eriksson, A.C.; Shen, M.; Nilsson, P.; Gallo, Y.; Waldheim, B.; Martinsson, J.; Andersson, O.; Pagels, J. Evolution of In-Cylinder Diesel Engine Soot and Emission Characteristics Investigated with Online Aerosol Mass Spectrometry. Environ. Sci. Technol. 2017, 51, 1876–1885. [Google Scholar] [CrossRef] [PubMed]
- Ehara, K.; Hagwood, C.; Coakley, K.J. Novel method to classify aerosol particles according to their mass-to-charge ratio—Aerosol particle mass analyser. J. Aerosol Sci. 1996, 27, 217–234. [Google Scholar] [CrossRef]
- Drinovec, L.; Močnik, G.; Zotter, P.; Prévôt, A.S.H.; Ruckstuhl, C.; Coz, E.; Rupakheti, M.; Sciare, J.; Müller, T.; Wiedensohler, A.; et al. The “dual-spot” Aethalometer: An improved measurement of aerosol black carbon with real-time loading compensation. Atmos. Meas. Tech. 2015, 8, 1965–1979. [Google Scholar] [CrossRef]
- Gren, L.; Malmborg, V.B.; Falk, J.; Markula, L.; Novakovic, M.; Shamun, S.; Eriksson, A.C.; Kristensen, T.B.; Svenningsson, B.; Tunér, M.; et al. Effects of renewable fuel and exhaust aftertreatment on primary and secondary emissions from a modern heavy-duty diesel engine. J. Aerosol Sci. 2021, 156, 105781. [Google Scholar] [CrossRef]
- Rissler, J.; Messing, M.E.; Malik, A.I.; Nilsson, P.T.; Nordin, E.Z.; Bohgard, M.; Sanati, M.; Pagels, J.H. Effective Density Characterization of Soot Agglomerates from Various Sources and Comparison to Aggregation Theory. Aerosol Sci. Technol. 2013, 47, 792–805. [Google Scholar] [CrossRef]
- Kristensen, T.B.; Falk, J.; Lindgren, R.; Andersen, C.; Malmborg, V.B.; Eriksson, A.C.; Korhonen, K.; Carvalho, R.L.; Boman, C.; Pagels, J.; et al. Properties and emission factors of cloud condensation nuclei from biomass cookstoves—Observations of a strong dependency on potassium content in the fuel. Atmos. Chem. Phys. 2021, 21, 8023–8044. [Google Scholar] [CrossRef]
- Malmborg, V.; Eriksson, A.; Gren, L.; Török, S.; Shamun, S.; Novakovic, M.; Zhang, Y.; Kook, S.; Tunér, M.; Bengtsson, P.E.; et al. Characteristics of BrC and BC emissions from controlled diffusion flame and diesel engine combustion. Aerosol Sci. Technol. 2021, 55, 769–784. [Google Scholar] [CrossRef]
- Corbin, J.C.; Lohmann, U.; Sierau, B.; Keller, A.; Burtscher, H.; Mensah, A.A. Black carbon surface oxidation and organic composition of beech-wood soot aerosols. Atmos. Chem. Phys. 2015, 15, 11885–11907. [Google Scholar] [CrossRef]
- Gallo, Y.; Malmborg, V.B.; Simonsson, J.; Svensson, E.; Shen, M.; Bengtsson, P.E.; Pagels, J.; Tunér, M.; Garcia, A.; Öivind, A. Investigation of late-cycle soot oxidation using laser extinction and in-cylinder gas sampling at varying inlet oxygen concentrations in diesel engines. Fuel 2017, 193, 308–314. [Google Scholar] [CrossRef]
- Eriksson, A.C.; Nordin, E.Z.; Nyström, R.; Pettersson, E.; Swietlicki, E.; Bergvall, C.; Westerholm, R.; Boman, C.; Pagels, J.H. Particulate PAH Emissions from Residential Biomass Combustion: Time-Resolved Analysis with Aerosol Mass Spectrometry. Environ. Sci. Technol. 2014, 48, 7143–7150. [Google Scholar] [CrossRef] [PubMed]
- Mazzoleni, L.R.; Zielinska, B.; Moosmüller, H. Emissions of Levoglucosan, Methoxy Phenols, and Organic Acids from Prescribed Burns, Laboratory Combustion of Wildland Fuels, and Residential Wood Combustion. Environ. Sci. Technol. 2007, 41, 2115–2122. [Google Scholar] [CrossRef] [PubMed]
- Garimella, S.; Rothenberg, D.A.; Wolf, M.J.; David, R.O.; Kanji, Z.A.; Wang, C.; Rösch, M.; Cziczo, D.J. Uncertainty in counting ice nucleating particles with continuous flow diffusion chambers. Atmos. Chem. Phys. 2017, 17, 10855–10864. [Google Scholar] [CrossRef]
- DeMott, P.J.; Prenni, A.J.; McMeeking, G.R.; Sullivan, R.C.; Petters, M.D.; Tobo, Y.; Niemand, M.; Möhler, O.; Snider, J.R.; Wang, Z.; et al. Integrating laboratory and field data to quantify the immersion freezing ice nucleation activity of mineral dust particles. Atmos. Chem. Phys. 2015, 15, 393–409. [Google Scholar] [CrossRef]
- Welti, A.; Lüönd, F.; Stetzer, O.; Lohmann, U. Influence of particle size on the ice nucleating ability of mineral dusts. Atmos. Chem. Phys. 2009, 9, 6705–6715. [Google Scholar] [CrossRef]


Publisher’s Note: MDPI stays neutral with regard to jurisdictional claims in published maps and institutional affiliations. |
© 2021 by the authors. Licensee MDPI, Basel, Switzerland. This article is an open access article distributed under the terms and conditions of the Creative Commons Attribution (CC BY) license (https://creativecommons.org/licenses/by/4.0/).