Abstract
Gaseous emissions are the main loss pathways of nutrients during dairy slurry storage. In this study, we compiled published data on cumulative ammonia (NH3), nitrous oxide (N2O) and methane (CH4) emissions from dairy slurry storage and evaluated the integrated effects of slurry pH, total solids (TS), ambient temperature (T) and length of storage (LOS) on emissions using linear mixed effects models. Results showed that the average nitrogen (N) loss by NH3 volatilization from slurry storage was 12.5% of total nitrogen (TN), while the loss by N2O emissions only accounted for 0.05–0.39% of slurry TN. The NH3–N losses were highly related to slurry pH, lowering slurry pH leading to significant decrease of emissions. Temperature also affected NH3–N losses, with higher losses from slurry storage under warm conditions than cold conditions. No significant relationship was observed between NH3–N losses and slurry TS contents within a range from 21–169 g kg−1. The losses of N2O–N from dairy slurry storage were less affected by slurry pH, TS contents and temperature. The carbon (C) loss as CH4 emissions varied from 0.01–17.2% of total carbon (TC). Emissions of CH4–C presented a significant positive relationship with temperature, a negative relationship with slurry TS contents and no significant relationship with slurry pH ranging from 6.6–8.6. Length of storage (more than 30 days) had no significant influence on cumulative gas emissions from slurry storage. This study provides new emission factors of NH3, N2O and CH4 in the percentage of TN or TC from dairy slurry storage. Our results indicate the potential interactive effects of slurry characteristics and storage conditions on gaseous emissions from slurry storage. Farm-scale measurements are needed to accurately estimate nutrient losses from liquid manure storage.
1. Introduction
Liquid manure storage is known to represent an important source of ammonia (NH3) and methane (CH4) emissions [1,2]. These gas emissions not only lower the fertilizer value of liquid manure but also pose a threat to environmental quality. It was reported by Oenema et al. [3] that almost 30% of the excreted nitrogen (N) was lost during storage, approximately 19% of the excreted N via NH3 emissions. The CH4 emissions from stored dairy manure accounted for 8% to 15% of total CH4 emissions from cows [4] and was estimated as the second largest source of CH4 emissions (after enteric fermentation) on European dairy farming [5]. Due to high global warming potential, more attention has also been paid to nitrous oxide (N2O) emissions from dairy slurry storage, since high fiber content in cow feces is more likely to form surface crust, creating intermittent aerobic and anaerobic environments for N2O production [6].
A considerable number of studies have been conducted to measure NH3, N2O and CH4 emissions from dairy slurry storage but the emission values were expressed in a wide variety of units. It was reported by Vigan et al. [7] that the number of units used in literatures to report emission values from manure storage were 45, 31, 48 for NH3, N2O and CH4 emissions, respectively. Standardization of the emission data is very important for comparing and compiling emission values from different studies, which could benefit emission inventories of livestock manure management systems.
A few recent studies on emissions from storage of liquid dairy manure provide flow-based gas emission factors in the percentage of total ammonium nitrogen (TAN) for NH3 and N2O or the percentage of volatile solids (VS) for CH4 [8,9]. These studies provide updated information for gas emission factors and contribute to more accurate national or regional emission inventories. However, few studies compiled these gaseous losses from dairy slurry storage in the percentage of total nitrogen or total carbon (% of TN or TC) that can be used to estimate carbon and nitrogen flows along manure management chains and to evaluate nutrient use efficiency in dairy farming systems. Therefore, one of the objectives of this paper is to collect measured NH3–N, N2O–N and CH4–C losses during storage of liquid dairy manure and to update information on gaseous losses in the percentage of TN or TC.
Besides the units used to express gas emission factors, the magnitude of gas emissions from liquid manure storage varied from negligible to one of the largest sources in dairy farms, highly depending on manure characteristics, environmental conditions, and storage management practices. The independent influence of slurry characteristics, environmental conditions, and management practices on gas emissions from liquid manure storage has been investigated. For example, van der Weerden et al. [10,11] demonstrated inverse logarithmic relationships between slurry total solids (TS) contents and NH3 and CH4 emissions. Sawamoto et al. [12] revealed the effects of temperature and length of storage on CH4 emissions from dairy slurry storage. Misselbrook et al. [13] and Sommer et al. [14] found lowering slurry pH by acidification can reduce emissions of NH3 and CH4.
However, the integrated and interactive effects of these variables on gas emissions were rarely investigated due to a large effort in labor and costs. Based on accompanying parameters (e.g., slurry pH, TS contents, TN contents, TC contents, temperature, etc.) in published studies, a more advanced analysis on integrated effects of these variables on flow-based gaseous losses can help to identify the interactive effects and contribute to improving methods for calculating gas emission factors from liquid dairy manure storage.
Overall, the aims of this review are: (i) to provide quantitative information on flow-based losses of NH3–N, N2O–N and CH4–C during storage of liquid dairy manure; (ii) to assess the integrated effects of slurry characteristics, temperature, and storage length on gaseous losses.
2. Materials and Methods
2.1. Data Source
We searched published literatures in English using the electronic databases: CAB Abstracts via Ovid, Web of Science and Scopus, by combining specific keywords covering cow, slurry or liquid manure, storage, and gas emissions (e.g., NH3, N2O, and CH4). Articles were selected on the basis of the following criteria: (i) the research focused on gas emissions from storage of liquid dairy manure, including raw slurry, liquid slurry after separation, anaerobically digested slurry and anaerobically digested slurry after separation; emissions from other livestock manure storage (e.g., pig slurry) were not included. (ii) The emission values were measured at laboratory, pilot or farm scales; data from published reviews or models were excluded; (iii) storage tanks did not have any physical barriers (e.g., covers or roofs), but tanks with natural crusts were included; (iv) the study reported at least one of the NH3, N2O and CH4 gases; (v) cumulative gas emissions were reported; (vi) the storage period should be not less than 30 days; (vii) the reported various units of gas emissions from articles could be converted into an uniform unit in the percentage of initial TN for NH3–N and N2O–N losses and in the percentage of initial TC for CH4–C loss. The unit conversion of emission data is shown in Supplemental Table S1. Data that were only graphically presented were digitized using the software WebPlotDigitizer [15].
2.2. Data Extraction
A total of 12 publications were selected to extract data. Detailed information of selected literatures is given in Table 1. Gas emissions, including NH3–N, N2O–N and CH4–C, from dairy slurry storage in selected literatures were collected. Potential variables influencing gas emissions were also recorded, including initial slurry pH, the TS content, TN content, TC content, average air temperature (T) during storage and length of storage (LOS). For studies without reporting air temperature, we extracted slurry temperature as a surrogate for air temperature [16].

Table 1.
Detailed information of the 12 selected articles for extracting data.
2.3. Data Analysis
Based on measurements that simultaneously reporting gas emissions, slurry characteristics, air temperature, and storage duration, we investigated the relationships among gaseous losses of N or C and potential influencing factors by linear mixed effects models using the lme4 package in R language [28]. We firstly used cor () function to check correlations between influencing variables. Variables whose pairwise correlation coefficients were greater than 0.7 were not included simultaneously in one model. In this way, the slurry pH, TS content, T and LOS were selected as main explanatory variables of NH3–N, N2O–N and CH4–C losses because of collinearity (correlation coefficients > 0.7) existing among TS content, TN content and TC content (Supplemental Tables S2–S4). Selected explanatory variables as main fixed effects and literatures were considered to be random effects in fitted linear mixed effects models (Table 2). Outliers that had significant effects on fitted results were removed using the function romr.fnc () from package LMERConvenienceFunctions [29]. The number of extracted outliers were 5, 0 and 3 for datasets of NH3–N, N2O–N and CH4–C, respectively (Table 2). Relationships between gas emissions and influencing factors were visualized using visreg () function based on the results of linear mixed effects models. All statistical analyses were performed using R statistical software (version 3.6.1) [30].
Table 2.
The composition of fitted models to investigate the effects of slurry pH, TS content, T and LOS on gas emissions from dairy slurry storage.
3. Results and Discussion
3.1. Gas Emissions from Dairy Slurry Storage
A total of 39 measurements on NH3–N losses from dairy slurry storage, 28 measurements on N2O–N losses and 25 measurements on CH4–C losses were collected from selected publications. Descriptive statistics for reported NH3–N, N2O–N and CH4–C emissions from studies conducted at laboratory, pilot and farm scales are shown in Table 3. Studies on quantifying flow-based gas emissions from dairy slurry storage were mainly conducted at laboratory and pilot scales, with few measurements at farm scale. The minimum and maximum gas emission values differ by one to several orders of magnitude for all gases. Average NH3–N loss from dairy slurry storage was 12.5% of initial TN with a higher emission from laboratory scale studies than from pilot studies. The emissions of N2O–N from slurry storage were relatively small, with an average value of 0.05% of TN. Laboratory-scale studies reported smaller N2O–N emissions than pilot-scale studies. Average CH4–C emission from slurry storage was about 2.04% of initial TC. Larger CH4–C emissions from farm-scale studies were observed than pilot and laboratory studies.
Table 3.
Reported NH3–N, N2O–N and CH4–C emissions from dairy slurry storage from studies conducted at laboratory, pilot and farm scales.
The NH3–N loss is the main loss pathway of N during slurry storage, significantly larger than N2O–N loss. Sommer et al. [31] estimated that the NH3–N losses from slurry storage varied from 6% to 30% of TN in stored slurry, which is in the range of reported NH3–N losses in this study. The default value recommended by the Intergovernmental Panel on Climate Change [32] for NH3 and NOX emissions is 30% of TN for dairy slurry storage with natural crusts and 48% of TN for slurry storage without natural crusts. Vigan et al. [7] reported that the NH3–N losses from dairy slurry storage ranged from 3.6–43.2% of TN stored with an average value of 28.8%. These values are considerably larger than the mean NH3–N emission factor found in this study. The large variability of NH3–N emission factors in different publications indicates that emissions are affected by multiple factors and one simple estimated emission factors might not fit all slurry storage situations.
The N2O emissions mainly occur in slurry storage with natural crusts, and the amount is very small [33]. IPCC [32] estimated that the average N2O–N loss from slurry storage with natural crusts is 0.5% of TN stored, with an uncertainty range of 0.25–1% of TN, and there is no N2O–N loss from slurry storage without natural crusts. The range of N2O–N losses in this study (0–0.39% of TN) basically corresponds to the default values of N2O–N emission factors in IPCC [32]. However, the average N2O–N emission factor is only one tenth of the default value of IPCC [32]. Vigan et al. [7] and Kupper et al. [9] reported the average N2O–N loss from cattle slurry storage in published articles with 0.2% and 0.13% of TN, respectively, which are two to four times higher than the mean value of this study. The distribution of reported N2O–N losses in this study is left skewed by low values, with the maximum value five times higher than the median. Among selected studies, most studies reported the N2O–N losses less than 0.1% of TN and only three studies reported the values higher than 0.1% of TN [20,24,26].
Methane emissions from slurry storage are highly related to volatile solids content of slurry [34]. Most publications reported CH4 emission factors based on g CH4 per kg volatile solids [12,25,35]. Studies on carbon flow based CH4 emissions are limited, which prevents us from comparing the results with other studies.
3.2. Effects of Slurry pH, TS Content, Temperature and Storage Duration on NH3–N Emissions
A total of 29 measurements from seven publications were used to analyze relationships among NH3–N emissions and slurry pH, TS content, ambient temperature, and length of storage (Table 4). Results showed that these influencing factors (i.e., fixed effects) explained about 51% of variance (marginal R2) and 49% of variance was caused by selected publications (i.e., references) and residual error, of which variance of references accounting for 52%. Among references, measurements of NH3–N emissions from studies of Dinuccio et al. [19] and van der Weerden et al. [10] were relatively higher than measurements from studies of Fangueiro et al. [18] and Le Riche et al. [23] (Supplemental Figure S1).
Table 4.
Parameter estimates of linear mixed effects model for NH3–N emissions from slurry storage (lmer (NH3–N ~ pH + TS + T + LOS + (1|Reference))).
3.2.1. Slurry pH
A significant positive relationship between slurry pH and NH3–N emissions from slurry storage was observed (Figure 1a). This result is in accordance with previous studies that demonstrated that lowering dairy slurry pH by acidification could effectively reduce NH3–N emissions, with mitigation efficiencies varying from 20% to more than 90% [13,14,22]. Ammonia emissions depend on the dynamic equilibrium between ammonium (NH4+) and NH3 in aqueous systems, which is highly determined by slurry pH. When slurry pH is higher than seven, the release of NH3 takes place, and at pH values above 11, all of the ammoniacal nitrogen is in the form of free NH3 [36]. When the pH is less than seven, NH3 volatilization decreases, and all of the ammoniacal nitrogen is in the form of non-volatile NH4+ when pH values near to six [36,37].
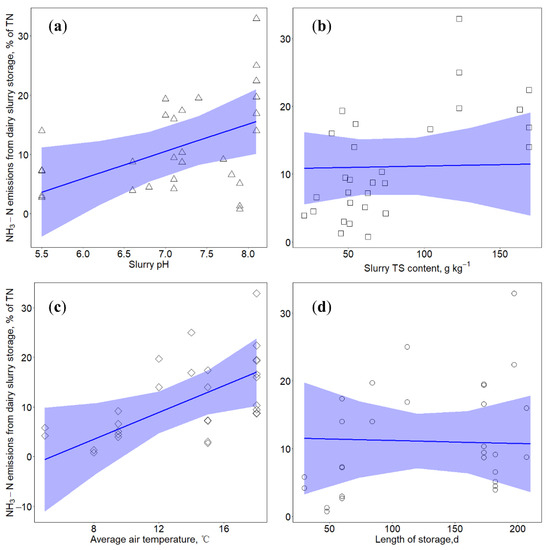
Figure 1.
Relationships between NH3–N emissions from dairy slurry storage with (a) slurry pH (in triangle), (b) total solids (TS) content (in square), (c) air temperature (in diamond) and (d) length of storage (in circle). Blue lines indicate prediction lines based on results of linear mixed effects model: lmer (NH3–N ~ pH + TS + T + LOS + (1|Reference)). Blue shadows represent model predicted results with 95% confidence interval.
3.2.2. Total Solids
Results of linear mixed effects model showed that when slurry TS contents varied from 21 to 169 g kg−1, there was no significant relationship between NH3–N emissions and the TS contents (Figure 1b). The study of Wood et al. [38] reported that NH3 emissions increased linearly with slurry TS contents varying from 3 to 95 g kg−1. Van der Weerden et al. [10] found the inverse logarithmic relationships between cumulative NH3 emissions versus the TS contents ranging from 76 to 399 g kg−1. These results from different studies indicated that the relationship between NH3–N emissions and slurry TS contents highly depends on the investigated range of TS contents. Slurry TS content is an indicator of substrate availability for NH3 emissions and is related to crust formation [38]. When the TS content of slurry is low, the availability of mineralized NH4+ from organic N is small, which lead to the reduced potential for reactive N to be lost [31,38]. When the TS content increases, the available N content increases, but high TS content will contribute to the formation of natural crust, acting as a physical barrier against gas exchange [11,39]. Misselbrook et al. [40] presented that the formation of a natural crust could reduce NH3 emissions by approximately 50%. The thickness and nature of crust played an important role in mitigating NH3 emissions. It was expected that the resistance of gas emission rates would increase with increasing crust thickness and with decreasing moisture content of crust [40]. The trade-off between availability of substrate N for NH3–N production and the crust formation in regulating gas emissions from slurry storage finally influences the relationship between NH3–N emissions and slurry TS contents.
3.2.3. Temperature
Temperature showed a positive relationship with NH3–N emissions from slurry storage (Figure 1c), but the relationship was only significant at a 0.1 significance level. Previous studies also demonstrated that the N loss from slurry storage in summer (average air temperature 21.4 °C) was much greater than storage in winter (average air temperature 6.5 °C) [41]. Ammonia release from a slurry storage tank is a combination of diffusion and convective movements over the slurry surface, which could be parameterized by the dissociation constant and the overall mass transfer coefficient [31,42,43]. Increased liquid temperature enhances ionic activity, which ultimately increases the dissociation of ammonium ions [43,44,45]. Most studies reported ambient temperature during measurement periods instead of slurry temperature, which might lead to significant relationships between temperature and NH3–N emissions only at a 0.1 significance level. Additionally, the interactions between temperature and other potential influencing factors might complicate the relationship between temperature and NH3–N emissions.
3.2.4. Length of Storage
Length of storage did not significantly influence NH3–N emissions from slurry storage (Figure 1d). The storage duration of all selected measurements in this study are longer than 30 days. Ammonia volatilization losses from manure are most intensive at the initial stage of storage [46] and decrease with storage time [47]. This agrees with rapid hydrolysis of urea that is generally considered to be the major source of NH3 emissions [48]. It was reported that during the initial 10 days of manure storage, the loss of urinary–N was significant, accounting for 90% of NH3–N loss, while the contribution of fecal–N was relatively low [46]. Therefore, extending storage duration did not have a significant effect on NH3–N losses. In order to reduce nitrogen loss from manure storage, mitigation practices should be used and workable at the early stage of storage.
3.3. Effects of Slurry pH, TS Content, Temperature and Storage Duration on N2O–N Emissions
Results of the linear mixed effects model showed that the N2O–N emissions from slurry storage were less affected by slurry pH, TS content, temperature, and storage duration (Table 5). Errors of estimates of the model were mainly from reported literatures (marginal R2 = 0.00 and conditional R2 = 0.99 in Table 5). The minimum N2O–N emission was reported by Rodhe et al. [21], who measured the N2O–N losses from stored undigested and digested dairy slurry. The low TS contents of slurry (33–79 g kg−1) did not benefit the formation of surface crusts, resulting in negligible N2O emissions. Wood et al. [20] measured the maximum N2O–N emission from slurry storage with a value of 0.21% of TN. The TS content of the stored slurry was 117 g kg−1, leading to the formation of natural crust on the slurry surface. Besides, the high air temperature (15 °C) mutually contributed to the persisting dry natural crust, resulting in the higher N2O–N emissions. This also highlights the potential interactive effects of variables on N2O–N emissions from slurry storage.
Table 5.
Parameter estimates of linear mixed effects model for N2O–N emissions from slurry storage (lmer (N2O–N ~ pH + TS + T + LOS + (1|Reference))).
3.3.1. Slurry pH
Due to the limited N2O emissions from slurry storage, the effect of slurry pH on N2O emissions was less investigated. The insignificant relationship between N2O–N emissions and slurry pH in this study agrees with the result of Sommer et al. [14] who presented no significant effect of lowering slurry pH on N2O emissions.
3.3.2. Total Solids
Previous studies demonstrated that the slurry TS content is an important indicator for N2O emissions. High TS contents benefited the formation of thick surface crusts, which created intermittent environment of aerobic and anaerobic and promoted nitrification and denitrification, producing N2O gas [49]. However, there is little knowledge about the extent of N2O emissions from slurry crusts. Hansen et al. [50] found that the dry organic crusts had higher potential for emitting more N2O gas, because there was deeper oxygen penetration in dry crusts than in wet crusts, which promoted dissolved NH4+ to be oxidized to the nitrogen oxides (NO2− and NO3−), leading to higher emissions of N2O under anoxic conditions. Besides, the thickness of natural crusts influences the amount of N2O production. The N2O emissions from young and thin natural crusts were usually lower than old and thick natural crusts [51]. This was because in well-developed and thick natural crusts there was high O2 penetration due to the relatively long distance from the surface to the free slurry interface [51]. The effect of TS contents on N2O–N emissions is complexed by the formation and characteristics of surface crusts, which resulted in the insignificant relationship (Figure 2b).
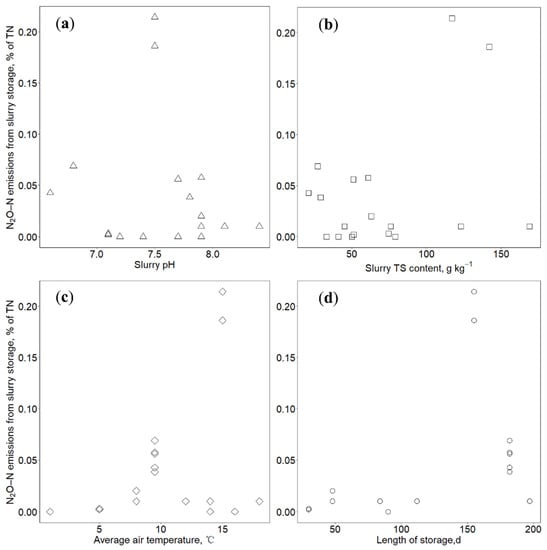
Figure 2.
Relationships between N2O–N emissions from slurry storage with (a) slurry pH (in triangle), (b) total solids (TS) content (in square), (c) air temperature (in diamond) and (d) length of storage (in circle).
3.3.3. Temperature
We did not observe a significant effect of ambient temperature on N2O–N emissions (Figure 2c). Sommer et al. [52] also found that there was no relation between N2O emissions and air or slurry temperature. Pereira et al. [53] compared the N2O emissions from cattle slurry at 5, 15, 25 and 35 °C, finding the amount of N2O released did not vary significantly with temperature. However, Petersen et al. [54] observed a significant increase of N2O emissions from pig slurry storage with natural crusts when temperature was higher than 10 °C. Temperature might be not the only one influencing factor for N2O–N emissions. As previous discussed, the intermittent environment of aerobic and anaerobic in surface crusts is an essential prerequisite for N2O emissions from slurry storage. At a high storage temperature, a crust might more easily form, thereby creating conditions for N2O production [55]. However, the high temperature will also promote NH3–N emissions and reduce the availability of NH4+ for nitrification, consequently resulting in smaller N2O–N emissions [53]. Therefore, the relationship between N2O emissions and slurry storage temperature remains unclear and need to be investigated further.
3.3.4. Length of Storage
Storage duration did not directly influence N2O–N emissions from slurry storage (Figure 2d). Van der Weerden [11] found an increasing tendency of N2O emissions from slurry storage when storage length extended from three months to seven months. It was speculated that the increase of N2O emissions was because, during the late stage of storage, the mineralization of organic matter provided more substrate (i.e., NH4+, NO3−, NO2−) for nitrification and denitrification. The extending storage length also benefited the formation of thick and dry surface crusts, enhancing N2O emissions. Previous studies observed that the N2O emissions started after several weeks of the formation of slurry crusts [38,52]. It is difficult to come into a coherent conclusion based on limited data in this study. There is a need to measure N2O emissions at farm scale, and to better understand relationships among gas emissions and slurry characteristics and storage conditions.
3.4. Effects of Slurry pH, TS Content, Temperature and Storage Duration on CH4–C Emissions
There were 21 measurements of CH4–C emissions from five publications used for linear mixed effects model after removing three outliers from the dataset (Table 6). Results showed that all influencing factors explained 41.4% of variance (marginal R2) and variance caused by references accounted for 20% of total error variance (Table 6).
Table 6.
Parameter estimates of linear mixed effects model for CH4–C emissions from slurry storage (lmer (CH4–C ~ pH + TS + T + LOS + (1|Reference))).
3.4.1. Slurry pH
No significant relationship between slurry pH and CH4–C losses from slurry storage was observed (Figure 3a). The optimal pH of methanogen is near 7.0 and the CH4 gas will be emitted in the range of pH values from 6.6 to 7.6 [56]. Previous studies showed that lowering slurry pH by acidification could reduce CH4–C losses, with mitigation efficiencies from 63% to 90% [13,14,57]. Acidification could inhibit the growth and activity of methanogen, thereby leading to the reduction of CH4 production [57]. In this study, the range of slurry pH was 6.6–8.6, the small range of pH resulting in no significant changes in CH4–C emissions from slurry storage.
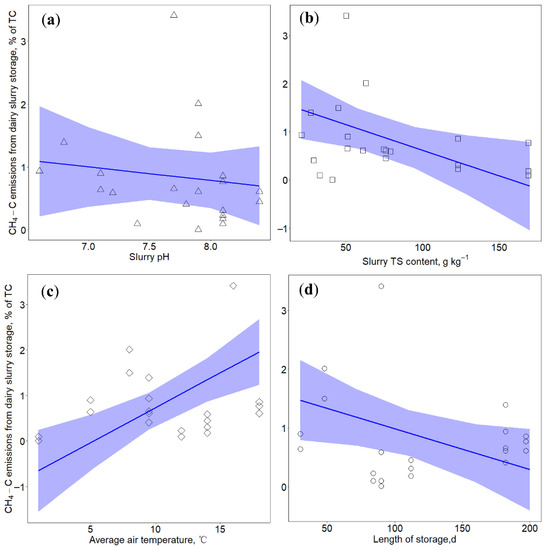
Figure 3.
Relationships between CH4–C emissions from slurry storage with (a) slurry pH (in triangle), (b) total solids (TS) content (in square), (c) air temperature (in diamond) and (d) length of storage (in circle). Blue lines indicate prediction lines based on results of linear mixed effects model: lmer (CH4–C ~ pH + TS + T + LOS + (1|Reference)). Blue shadows represent model predicted results with 95% confidence interval.
3.4.2. Total Solids
A negative effect of TS contents on CH4–C losses from slurry storage was observed (Figure 3b), which agrees with the study of van der Weerden et al. [10] that observed an inverse logarithmic relationship between CH4–C emissions and slurry TS contents. The liquid-based systems with low TS contents could promote an oxygen-free environment and anaerobic decomposition. Moreover, high water content is required for methanogen bacteria cell production and metabolism, thereby leading to larger CH4–C emissions [56]. The increase of TS content is likely to increase the aeration status, which directly inhibits the activity of methanogen [11,58,59]. Besides, the increase of TS content benefits the formation of natural crust, in which CH4 oxidation may occur due to the presence of methanotrophic bacteria [60,61], thus leading to reduced CH4–C emissions.
3.4.3. Temperature
Temperature had a significant influence on CH4–C emissions from slurry storage (Figure 3c), with increasing temperature leading to the increase of CH4–C emissions. Previous studies demonstrated that temperature was the primary and dominant factor for CH4 production [12]. High temperature could lead to a high degradation rate of volatile solids and high CH4 production [26,34]. Seasonal variations of CH4 emissions further demonstrated the effect of temperature on CH4 emissions. Jayasundara et al. [33] and Cardenas et al. [62] presented that the CH4 emissions from liquid manure stored in warm seasons were considerably higher than in cold seasons. Temperature could influence the microbial activity and community development in the manure [63]. Low ambient temperature prevents the start of the methanogenesis process that optimally takes place at approximately 20 °C [34,64,65]. Decreasing temperature might result in the abundance of psychrophilic methanogens and the decrease of mesophilic methanogens that have a higher CH4 production rate than psychrophilic methanogens [66], thereby affecting the total amount of CH4 gas emitted.
3.4.4. Length of Storage
It is well known that storage duration of liquid manure plays a decisive role in the production of CH4 [34]. Previous studies demonstrated that extending slurry storage time could significantly increase the CH4 emissions [4,11]. This is because that the long storge duration could contribute to the establishment of sufficient methanogenic population [38], thereby leading to more CH4 gas. However, we did not observe the significant influence of length of storage on CH4–C losses from slurry storage at 0.05 significant level (Table 6 and Figure 3d). In practical conditions, the CH4 emissions might be complexed by multiple factors, the influence of which could be compensated. Temperature might be a more decisive factor in determining CH4–C emissions from slurry storage than storage duration. Cardenas et al. [62] presented that when the temperature was above 15 °C, even a short storage period could result in the emission of substantial amounts of CH4 gas, while longer storage period under cold winter conditions emitted little CH4 gas. These findings can be useful for designing CH4 mitigation strategies, such as prolonging winter storage, shortening summer storage, cooling of slurry in the barn.
4. Conclusions
Flow-based gas emission factors of slurry storage presented a large range and varied a lot among laboratory, pilot and farm scale studies. Slurry composition and storage conditions importantly define carbon and nitrogen transformations, and the resulting emissions of NH3–N, N2O–N and CH4–C. Ammonia emissions were highly related to slurry pH. Lowering slurry pH significantly reduced NH3–N losses. Ambient temperature also influenced NH3–N losses. Storing slurry in warm seasons emitted more NH3 than storing in cold seasons. No significant effect of TS contents on NH3–N emissions was observed when slurry TS contents varied from 21–169 g kg−1. Storing slurry for more than 30 days did not significantly affect NH3–N losses because NH3–N emissions from slurry were most intensive at the initial stage of storage. The N2O–N losses from slurry storage accounted for 0–0.39% of slurry TN and were less affected by slurry pH, TS content, temperature, and length of storage. Methane emissions from slurry storage presented a significantly positive correlation with storage temperature, whereas the emissions decreased with the increasing of slurry TS content. Slurry pH ranging from 6.6–8.6 and length of storage had no significant influence on CH4–C emissions. These information about relationships among gas emissions and slurry characteristics and storage conditions are useful for avoiding pollution swapping of mitigation strategies (e.g., acidification, additives, and separation, etc.). Our results indicate that the inventory of gas emissions from slurry storage should consider the influence of temperature on emission estimates. More measurements on flow-based gas emission factors at farm scale are needed to better estimate carbon, nitrogen flows and cycles and nutrients use efficiency in dairy farming systems.
Supplementary Materials
The following are available online at https://www.mdpi.com/article/10.3390/atmos12091156/s1, Table S1: Unit conversions of gas emissions data in selected literatures, Table S2: Pearson correlation coefficients among explanatory variables of NH3–N losses from dairy slurry storage (number of measurements = 34), Table S3: Pearson correlation coefficients among explanatory variables of N2O–N losses from dairy slurry storage (number of measurements = 24), Table S4: Pearson correlation coefficients among explanatory variables of CH4–C losses from dairy slurry storage (number of measurements = 24), Figure S1: Estimates of random intercepts of linear mixed effects model: lmer (NH3–N ~ pH + TS + T + LOS + (1|Reference)).
Author Contributions
Conceptualization, Q.Q. and K.Z.; methodology, Q.Q.; formal analysis, Q.Q.; data curation, Q.Q.; writing—original draft preparation, Q.Q. and K.Z.; writing—review and editing, Q.Q. and K.Z.; supervision, K.Z.; project administration, K.Z.; funding acquisition, K.Z. All authors have read and agreed to the published version of the manuscript.
Funding
This research was funded by “the National Key Research and Development Program of China, grant numbers 2018YFD0800100” and “China Agriculture Research System of MOF and MARA, and the Cooperative Sino-Dutch PhD Program between Chinese Academy of Agricultural Science and Wageningen University & Research, grant numbers MOE11NL1A20151701N”.
Institutional Review Board Statement
Not applicable.
Informed Consent Statement
Not applicable.
Data Availability Statement
The data presented in this study are available in supplementary material.
Conflicts of Interest
The authors declare no conflict of interest.
References
- Chadwick, D.; Sommer, S.G.; Thorman, R.; Fangueiro, D.; Cardenas, L.; Amon, B.; Misselbrook, T. Manure management: Implications for greenhouse gas emissions. Anim. Feed Sci. Tech. 2011, 166–167, 514–531. [Google Scholar] [CrossRef]
- Smith, K.; Cumby, T.; Lapworth, J.; Misselbrook, T.; Williams, A. Natural crusting of slurry storage as an abatement measure for ammonia emissions on dairy farms. Biosyst. Eng. 2007, 97, 464–471. [Google Scholar] [CrossRef]
- Oenema, O.; Oudendag, D.; Velthof, G.L. Nutrient losses from manure management in the European Union. Livest. Sci. 2007, 112, 261–272. [Google Scholar] [CrossRef]
- Külling, D.R.; Dohme, F.; Menzi, H.; Sutter, F.; Lischer, P.; Kreuzer, M. Methane emissions of differently fed dairy cows and corresponding methane and nitrogen emissions from their manure during storage. Environ. Monit. Assess. 2002, 79, 129–150. [Google Scholar] [CrossRef] [PubMed]
- Sneath, R.W.; Beline, F.; Hilhorst, M.A.; Peu, P. Monitoring GHG from manure stores on organic and conventional dairy farms. Agric. Ecosyst. Environ. 2006, 112, 122–128. [Google Scholar] [CrossRef]
- Petersen, S.O.; Sommer, S.G. Ammonia and nitrous oxide interactions: Roles of manure organic matter management. Anim. Feed Sci. Tech. 2011, 166–167, 503–513. [Google Scholar] [CrossRef]
- Vigan, A.; Hassouna, M.; Guingand, N.; Brame, C.; Edouard, N.; Eglin, T.; Espagnol, S.; Eugène, M.; Génermont, S.; Lagadec, S.; et al. Development of a Database to Collect Emission Values for Livestock Systems. J. Environ. Qual. 2019, 48, 1899–1906. [Google Scholar] [CrossRef] [Green Version]
- Sommer, S.G.; Webb, J.; Hutchings, N.D. New emission factors for calculation of ammonia volatilization from European livestock manure management systems. Front. Sustain. Food Syst. 2019, 3, 101. [Google Scholar] [CrossRef] [Green Version]
- Kupper, T.; Häni, C.; Neftel, A.; Kincaid, C.; Bühler, M.; Amon, B.; VanderZaag, A. Ammonia and greenhouse gas emissions from slurry storage—A review. Agric. Ecosyst. Environ. 2020, 300, 106963. [Google Scholar] [CrossRef]
- van der Weerden, T.J.; Luo, J.; Dexter, M. Addition of straw or sawdust to mitigate greenhouse gas emissions from slurry produced by housed cattle: A field incubation study. J. Environ. Qual. 2014, 43, 1345–1355. [Google Scholar] [CrossRef] [PubMed]
- van der Weerden, T.J.; Luo, J.; Dexter, M.; Rutherford, A.J. Nitrous oxide, ammonia and methane emissions from dairy cow manure during storage and after application to pasture. N. Z. J. Agric. Res. 2014, 57, 354–369. [Google Scholar] [CrossRef] [Green Version]
- Sawamoto, T.; Nakamura, M.; Nekomoto, K.; Hoshiba, S.; Minato, K.; Nakayama, M.; Osada, T. The cumulative methane production from dairy cattle slurry can be explained by its volatile solid, temperature and length of storage. Anim. Sci. J. 2016, 87, 827–834. [Google Scholar] [CrossRef]
- Misselbrook, T.; Hunt, J.; Perazzolo, F.; Provolo, G. Greenhouse gas and ammonia emissions from slurry storage: Impacts of temperature and potential mitigation through covering (pig slurry) or acidification (cattle slurry). J. Environ. Qual. 2016, 45, 1520–1530. [Google Scholar] [CrossRef] [PubMed]
- Sommer, S.G.; Clough, T.J.; Balaine, N.; Hafner, S.D.; Cameron, K.C. Transformation of organic matter and the emissions of methane and ammonia during storage of liquid manure as affected by acidification. J. Environ. Qual. 2017, 46, 514–521. [Google Scholar] [CrossRef] [PubMed]
- Burda, B.U.; O’Connor, E.A.; Webber, E.M.; Redmond, N.; Perdue, L.A. Estimating data from figures with a Web-based program: Considerations for a systematic review. Res. Synth. Methods 2017, 8, 258–262. [Google Scholar] [CrossRef] [PubMed]
- Rodhe, L.; Ascue, J.; Nordberg, Å. Emissions of greenhouse gases (methane and nitrous oxide) from cattle slurry storage in Northern Europe. IOP Conf. Ser. Earth Environ. Sci. 2009, 8, 012019. [Google Scholar] [CrossRef] [Green Version]
- Kröber, T.F.; Külling, D.R.; Menzi, H.; Sutter, F.; Kreuzer, M. Quantitative effects of feed protein reduction and methionine on nitrogen use by cows and nitrogen emission from slurry. J. Dairy Sci. 2000, 83, 2941–2951. [Google Scholar] [CrossRef]
- Fangueiro, D.; Coutinho, J.; Chadwick, D.; Moreira, N.; Trindade, H. Effect of cattle slurry separation on greenhouse gas and ammonia emissions during storage. J. Environ. Qual. 2008, 37, 2322–2331. [Google Scholar] [CrossRef]
- Dinuccio, E.; Berg, W.; Balsari, P. Effects of mechanical separation on GHG and ammonia emissions from cattle slurry under winter conditions. Anim. Feed Sci. Tech. 2011, 166–167, 532–538. [Google Scholar] [CrossRef] [Green Version]
- Wood, J.D.; VanderZaag, A.C.; Wagner-Riddle, C.; Smith, E.L.; Gordon, R.J. Gas emissions from liquid dairy manure: Complete versus partial storage emptying. Nutr. Cycl. Agroecosys. 2014, 99, 95–105. [Google Scholar] [CrossRef]
- Rodhe, L.K.K.; Ascue, J.; Willen, A.; Persson, B.V.; Nordberg, A. Greenhouse gas emissions from storage and field application of anaerobically digested and non-digested cattle slurry. Agric. Ecosyst. Environ. 2015, 199, 358–368. [Google Scholar] [CrossRef]
- Regueiro, I.; Coutinho, J.; Fangueiro, D. Alternatives to sulfuric acid for slurry acidification: Impact on slurry composition and ammonia emissions during storage. J. Clean. Prod. 2016, 131, 296–307. [Google Scholar] [CrossRef]
- Le Riche, E.L.; VanderZaag, A.C.; Wood, J.D.; Wagner-Riddle, C.; Dunfield, K.; Ngwabie, N.M.; McCabe, J.; Gordon, R.J. Greenhouse gas emissions from stored dairy slurry from multiple farms. J. Environ. Qual. 2016, 45, 1822–1828. [Google Scholar] [CrossRef] [PubMed]
- Le Riche, E.L.; Vanderzaag, A.; Wagner-Riddle, C.; Dunfield, K.E.; Sokolov, V.K.; Gordon, R. Do volatile solids from bedding materials increase greenhouse gas emissions for stored dairy manure? Can. J. Soil Sci. 2017, 97, 512–521. [Google Scholar] [CrossRef] [Green Version]
- Holly, M.A.; Larson, R.A.; Powell, J.M.; Ruark, M.D.; Aguirre-Villegas, H. Greenhouse gas and ammonia emissions from digested and separated dairy manure during storage and after land application. Agric. Ecosyst. Environ. 2017, 239, 410–419. [Google Scholar] [CrossRef]
- Baral, K.R.; Jego, G.; Amon, B.; Bol, R.; Chantigny, M.H.; Olesen, J.E.; Petersen, S.O. Greenhouse gas emissions during storage of manure and digestates: Key role of methane for prediction and mitigation. Agric. Syst. 2018, 166, 26–35. [Google Scholar] [CrossRef]
- Maldaner, L.; Wagner-Riddle, C.; VanderZaag, A.C.; Gordon, R.; Duke, C. Methane emissions from storage of digestate at a dairy manure biogas facility. Agric. For. Meteorol. 2018, 258, 96–107. [Google Scholar] [CrossRef]
- Bates, D.; Maechler, M.; Bolker, B.; Walker, S. Fitting Linear Mixed-Effects Models Using lme4. J. Stat. Softw. 2015, 67, 1–48. [Google Scholar] [CrossRef]
- Tremblay, A.; Ransijn, J. LMER Convenience Functions: Model Selection and Post-Hoc Analysis for (G) LMER Models, R Package Version 2.10. 2015. Available online: https://CRAN.R-project.org/package=LMERConvenienceFunctions (accessed on 14 April 2019).
- R Core Team. R: A Language and Environment for Statistical Computing. 2017. Available online: https://www.R-project.org/ (accessed on 5 July 2019).
- Sommer, S.G.; Zhang, G.Q.; Bannink, A.; Chadwick, D.; Misselbrook, T.; Harrison, R.; Hutchings, N.J.; Menzi, H.; Monteny, G.J.; Ni, J.Q.; et al. Algorithms determining ammonia emission from buildings housing cattle and pigs and from manure stores. Adv. Agron. 2006, 89, 261–335. [Google Scholar] [CrossRef]
- Intergovernmental Panel on Climate Change. Chapter 10: Emissions from livestock and manure management. In 2019 Refinement to the 2006 IPCC Guidelines for National Greenhouse Gas Inventories; Intergovernmental Panel on Climate Change: Geneva, Switzerland, 2019. [Google Scholar]
- Jayasundara, S.; Ranga Niroshan Appuhamy, J.A.D.; Kebreab, E.; Wagner-Riddle, C. Methane and nitrous oxide emissions from Canadian dairy farms and mitigation options: An updated review. Can. J. Anim. Sci. 2016, 96, 306–331. [Google Scholar] [CrossRef] [Green Version]
- Sommer, S.G.; Petersen, S.O.; Moller, H.B. Algorithms for calculating methane and nitrous oxide emissions from manure management. Nutr. Cycl. Agroecosys. 2004, 69, 143–154. [Google Scholar] [CrossRef]
- Holly, M.A.; Larson, R.A. Effects of manure storage additives on manure composition and greenhouse gas and ammonia emissions. Trans. ASABE 2017, 60, 449–456. [Google Scholar] [CrossRef]
- Neerackal, G.M.; Ndegwa, P.M.; Joo, H.S.; Harrison, J.H. Manure-pH management for mitigating ammonia emissions from dairy barns and liquid manure storages. Appl. Eng. Agric. 2017, 33, 235–242. [Google Scholar] [CrossRef]
- Vaddella, V.K.; Ndegwa, P.M.; Joo, H.S. Ammonia loss from simulated post-collection storage of scraped and flushed dairy-cattle manure. Biosyst. Eng. 2011, 110, 291–296. [Google Scholar] [CrossRef]
- Wood, J.D.; Gordon, R.J.; Wagner-Riddle, C.; Dunfield, K.E.; Madani, A. Relationships between dairy slurry total solids, gas emissions, and surface crusts. J. Environ. Qual. 2012, 41, 694–704. [Google Scholar] [CrossRef]
- Olesen, J.E.; Sommer, S.G. Modelling effects of wind speed and surface cover on ammonia volatilization from stored pig slurry. Atmos. Environ. Part A. Gen. Top. 1993, 27, 2567–2574. [Google Scholar] [CrossRef]
- Misselbrook, T.H.; Brookman, S.K.E.; Smith, K.A.; Cumby, T.; Williams, A.G.; McCrory, D.F. Crusting of stored dairy slurry to abate ammonia emissions: Pilot-scale studies. J. Environ. Qual. 2005, 34, 411–419. [Google Scholar] [CrossRef]
- Perazzolo, F.; Mattachini, G.; Riva, E.; Provolo, G. Nutrient losses during winter and summer storage of separated and unseparated digested cattle slurry. J. Environ. Qual. 2017, 46, 879–888. [Google Scholar] [CrossRef]
- Ni, J. Mechanistic models of ammonia release from liquid manure: A review. J. Agric. Eng. Res. 1999, 72, 1–17. [Google Scholar] [CrossRef]
- Koirala, K.; Ndegwa, P.M.; Joo, H.S.; Frear, C.; Stockle, C.O.; Harrison, J.H. Effects of suspended solids characteristics and concentration on ammonia emission process from liquid dairy manure. Trans. ASABE 2014, 57, 661–668. [Google Scholar] [CrossRef]
- Vaddella, V.K.; Ndegwa, P.M.; Ullman, J.L.; Jiang, A.P. Mass transfer coefficients of ammonia for liquid dairy manure. Atmos. Environ. 2013, 66, 107–113. [Google Scholar] [CrossRef]
- Montes, F.; Rotz, C.A.; Chaoui, H. Process modeling of ammonia volatilization from ammonium solution and manure surfaces: A review with recommended models. Trans. ASABE 2009, 52, 1707–1719. [Google Scholar] [CrossRef]
- Lee, C.; Hristov, A.N.; Cassidy, T.; Heyler, K. Nitrogen isotope fractionation and origin of ammonia nitrogen volatilized from cattle manure in simulated storage. Atmosphere 2011, 2, 256–270. [Google Scholar] [CrossRef] [Green Version]
- Külling, D.R.; Menzi, H.; Sutter, F.; Lischer, P.; Kreuzer, M. Ammonia, nitrous oxide and methane emissions from differently stored dairy manure derived from grass- and hay-based rations. Nutr. Cycl. Agroecosys. 2003, 65, 13–22. [Google Scholar] [CrossRef]
- Bussink, D.W.; Oenema, O. Ammonia volatilization from dairy farming systems in temperate areas: A review. Nutr. Cycl. Agroecosys. 1998, 51, 19–33. [Google Scholar] [CrossRef]
- Schmithausen, A.J.; Trimborn, M.; Büscher, W. Sources of nitrous oxide and other climate relevant gases on surface area in a dairy free stall barn with solid floor and outside slurry storage. Atmos. Environ. 2018, 178, 41–48. [Google Scholar] [CrossRef]
- Hansen, R.R.; Nielsen, D.A.; Schramm, A.; Nielsen, L.P.; Revsbech, N.P.; Hansen, M.N. Greenhouse gas microbiology in wet and dry straw crust covering pig slurry. J. Environ. Qual. 2009, 38, 1311–1319. [Google Scholar] [CrossRef] [PubMed] [Green Version]
- Nielsen, D.A.; Nielsen, L.P.; Schramm, A.; Revsbech, N.P. Oxygen distribution and potential ammonia oxidation in floating, liquid manure crusts. J. Environ. Qual. 2010, 39, 1813–1820. [Google Scholar] [CrossRef] [PubMed]
- Sommer, S.O.; Petersen, S.O.; Segaard, H.T. Greenhouse gas emission from stored livestock slurry. J. Environ. Qual. 2000, 29, 744–751. [Google Scholar] [CrossRef]
- Pereira, J.; Misselbrook, T.H.; Chadwick, D.R.; Coutinho, J.; Trindade, H. Effects of temperature and dairy cattle excreta characteristics on potential ammonia and greenhouse gas emissions from housing: A laboratory study. Biosyst. Eng. 2012, 112, 138–150. [Google Scholar] [CrossRef]
- Petersen, S.O.; Blanchard, M.; Chadwick, D.; Del Prado, A.; Edouard, N.; Mosquera, J.; Sommer, S.G. Manure management for greenhouse gas mitigation. Animal 2013, 7, 266–282. [Google Scholar] [CrossRef] [Green Version]
- Wang, Y.; Dong, H.M.; Zhu, Z.P.; Li, L.L.; Zhou, T.L.; Jiang, B.; Xin, H.W. CH4, NH3, N2O and NO emissions from stored biogas digester effluent of pig manure at different temperatures. Agric. Ecosyst. Environ. 2016, 217, 1–12. [Google Scholar] [CrossRef]
- United States Environmental Protection Agency. International Anthropogenic Methane Emissions: Estimates for 1990; United States Environmental Protection Agency: Washington, DC, USA, 1994.
- Habtewold, J.; Gordon, R.; Sokolov, V.; VanderZaag, A.; Wagner-Riddle, C.; Dunfield, K. Reduction in methane emissions from acidified dairy slurry is related to inhibition of Methanosarcina species. Front. Microbiol. 2018, 9, 2806. [Google Scholar] [CrossRef] [PubMed]
- Yamulki, S. Effect of straw addition on nitrous oxide and methane emissions from stored farmyard manures. Agric. Ecosyst. Environ. 2006, 112, 140–145. [Google Scholar] [CrossRef]
- Rotz, C.A. Modeling greenhouse gas emissions from dairy farms. J. Dairy Sci. 2018, 101, 6675–6690. [Google Scholar] [CrossRef] [PubMed]
- Ambus, P.; Petersen, S.O. Oxidation of 13C-labeled methane in surface crusts of pig- and cattle slurry. Isot. Environ. Health Stud. 2005, 41, 125–133. [Google Scholar] [CrossRef] [PubMed]
- Petersen, S.O.; Amon, B.; Gattinger, A. Methane oxidation in slurry storage surface crusts. J. Environ. Qual. 2005, 34, 455–461. [Google Scholar] [CrossRef] [PubMed]
- Cardenas, A.; Ammon, C.; Schumacher, B.; Stinner, W.; Herrmann, C.; Schneider, M.; Weinrich, S.; Fischer, P.; Amon, T.; Amon, B. Methane emissions from the storage of liquid dairy manure: Influences of season, temperature and storage duration. Waste Manag. 2021, 121, 393–402. [Google Scholar] [CrossRef]
- Rennie, T.J.; Gordon, R.J.; Smith, W.N.; VanderZaag, A.C. Liquid manure storage temperature is affected by storage design and management practices–A modelling assessment. Agric. Ecosyst. Environ. 2018, 260, 47–57. [Google Scholar] [CrossRef]
- Elsgaard, L.; Olsen, A.B.; Petersen, S.O. Temperature response of methane production in liquid manures and co-digestates. Sci. Total Environ. 2016, 539, 78–84. [Google Scholar] [CrossRef]
- Huste, S. Seasonal Variation in Methane Emission from Stored Slurry and Solid Manure. J. Environ. Qual. 1994, 23, 585–592. [Google Scholar] [CrossRef]
- Im, S.; Petersen, S.O.; Lee, D.; Kim, D.H. Effects of storage temperature on CH4 emissions from cattle manure and subsequent biogas production potential. Waste Manag. 2020, 101, 35–43. [Google Scholar] [CrossRef] [PubMed]
Publisher’s Note: MDPI stays neutral with regard to jurisdictional claims in published maps and institutional affiliations. |
© 2021 by the authors. Licensee MDPI, Basel, Switzerland. This article is an open access article distributed under the terms and conditions of the Creative Commons Attribution (CC BY) license (https://creativecommons.org/licenses/by/4.0/).