Article

Precipitation Trends in the Ganges-Brahmaputra-Meghna River Basin, South Asia: Inconsistency in Satellite-Based Products

1
Department of Geography, Planning, and Environment, East Carolina University, Greenville, NC 27858, USA
2
Lt Col James B. Near, Jr., USAF, ’77 Center for Climate Studies, The Citadel, Charleston, NC 29409, USA
*
Author to whom correspondence should be addressed.
Atmosphere 2021, 12(9), 1155; https://doi.org/10.3390/atmos12091155
Submission received: 28 July 2021 / Revised: 1 September 2021 / Accepted: 2 September 2021 / Published: 8 September 2021
(This article belongs to the Special Issue Asian Summer Monsoon Variability, Teleconnections and Projections)

Abstract

:
The Ganges-Brahmaputra-Meghna (GBM) river basin is the world’s third largest. Literature show that changes in precipitation have a significant impact on climate, agriculture, and the environment in the GBM. Two satellite-based precipitation products, Precipitation Estimation from Remotely Sensed Information using Artificial Neural Networks-Climate Data Record (PERSIANN-CDR) and Multi-Source Weighted-Ensemble Precipitation (MSWEP), were used to analyze and compare precipitation trends over the GBM as a whole and within 34 pre-defined hydrological sub-basins separately for the period 1983–2019. A non-parametric Modified Mann-Kendall test was applied to determine significant trends in monsoon (June–September) and pre-monsoon (March–May) precipitation. The results show an inconsistency between the two precipitation products. Namely, the MSWEP pre-monsoon precipitation trend has significantly increased (Z-value = 2.236, p = 0.025), and the PERSIANN-CDR monsoon precipitation trend has significantly decreased (Z-value = −33.071, p < 0.000). However, both products strongly indicate that precipitation has recently declined in the pre-monsoon and monsoon seasons in the eastern and southern regions of the GBM river basin, agreeing with several previous studies. Further work is needed to identify the reasons behind inconsistent decreasing and increasing precipitation trends in the GBM river basin.

1. Introduction

Precipitation is one of the most important climatic variables [1,2] and has a direct connection to the economy, natural ecosystems, and human well-being [3]. People living in the Ganges-Brahmaputra-Meghna (GBM) river basin depend highly on the river system for agricultural, industrial, and domestic purposes [4]. Changes in precipitation have a huge impact on agriculture, economy, and appropriate water resources planning for countries in the GBM [5]. For instance, 80% of the population in Bangladesh [6] and Nepal [7] depend on rain-fed agriculture, and agriculture contributes about 20% of the gross domestic product in India [8]. The amount of precipitation during the pre-monsoon (March–May) is gradually increasing in Bangladesh over the time period of 1958–2007 [6], and India [9] during 1970–2015. Alamgir [10] found that the pre-monsoon maximum rain rate is larger than the summer and winter monsoon (December–February) in Bangladesh using four years (2000–2003) of precipitation data. Rahman and Lateh [11] reported that rainfall during pre-monsoon and post-monsoon (October–November) is unpredictable in Bangladesh. Unpredictable rainfall and extreme events affect land productivity, agriculture, food security, water availability, and livelihood [6]. Moreover, changes in precipitation cause many natural hazards, such as landslides, drought, flood, and riverbank erosion in GBM [3,12,13]. Therefore, it is essential to study precipitation trends based on spatial and temporal patterns for a better understanding of regional water balances, risks of natural hazards, sustainable rural and forest development, and effective management of water resources [2,3,13,14,15,16].
Precipitation trend analysis can help to better interpret changes in hydrology and ecosystem services for countries within the GBM [17]. According to Gajbhiye et al. [18], it is essential to study long-term precipitation trends in India because food supply and economic well-being are based on rain-fed agriculture. Ahmad et al. [19] mention that a precise precipitation trend analysis can be useful to improve the future economy in Pakistan because of their rain-fed agriculture. Scholars have conducted various studies to estimate precipitation trend analysis over the years in river basins within the GBM [4,20,21,22,23,24]. Mirza et al. [4] studied the trends and persistence in precipitation in the GBM river basin and found that the Ganges river basin has a stable precipitation trend, but Meghna and Brahmaputra basins show contrasting results for upstream and downstream. Sharma et al. [20] analyzed precipitation trends using historical Climate Research Unit (CRU) monthly precipitation gridded data in the GBM river basin for four distinct seasons. The results show that the precipitation trend is decreasing in most places during the monsoon season (June–September), whereas the precipitation trend was slightly increasing in most of the regions during the pre-monsoon season. The study reported no such change for winter, and only negligible precipitation trend was seen in post-monsoon season. A study by Khandu et al. [21] showed that precipitation in the high rainfall regions of northeast India, Bhutan, Nepal, and Bangladesh decreased up to 39 mm per decade in the monsoon season from 1998 to 2013.
Various statistical methods such as parametric, non-parametric, and Bayesian methods have been used to detect trends. Many researchers have used the Mann-Kendall test to estimate precipitation trends in different parts of the world [2,4,21,25,26,27]. A Mann-Kendall trend test is a non-parametric test which Mann [28] and Kendall [29] used to identify trends in time series data. The null hypothesis of Mann-Kendall trend test considers that data are independent and randomly distributed. The Mann-Kendall test ignores the autocorrelation in the data [30]. To overcome this problem, modified Mann-Kendall trend test could be used which takes autocorrelation into account [30].
The study of precipitation trends requires reliable and long-term precipitation data sets. However, reliable rain gauge data is still a significant challenge in developing countries [31] and remote areas like high mountains and deserts [32]. Likely, rain gauge station data are limited in the GBM due to the steep topography, climatic conditions, and lack of funding. Limited numbers of rain gauges make spatial averaging more difficult. The number of satellite-based data sets has grown in the past several decades as an alternative to rain gauge data.
Beck et al. [33] provide one of the most comprehensive global-scale evaluations of satellite precipitation records. They found that the recently developed Multi-Source Weighted-Ensemble Precipitation (MSWEP) [34] was superior in the tropics with the highest agreement between rainfall-simulated and observed river discharge. However, they only compared satellite products over catchments <50,000 km2 due to concerns over spatial averaging in the model. Furthermore, no catchments were analyzed in the GBM due to data limitations. Interestingly, the closest catchment to the GBM, located in southwestern China, showed the Precipitation Estimation from Remotely Sensed Information using Artificial Neural Networks-Climate Data Record (PERSIANN-CDR) [35] as the superior product (see [33] Figure 3). PERSAINN-CDR has had a track record of success in estimating rainfall in South Asia [36,37,38,39,40].
With this motivation, we analyze precipitation trends within the GBM with MSWEP and PERSIANN-CDR. Other studies have compared MSWEP to PERSIANN-CDR (e.g., [41]), but this is the first study to compare MSWEP and PERSIANN-CDR products specifically within the GBM river basin. MSWEP and PERSIANN-CDR are also two long global satellite records, allowing precipitation trend detection over a period of 37 years from 1983 to 2019. We perform trend detection on monsoon and pre-monsoon precipitation over the entire GBM river basin, but also within 34 pre-defined hydrological sub-basins of the GBM separately. There is a lack of research in precipitation trend analysis in hydrological sub-basins of the GBM, even though these spatial units are critical for water management. Furthermore, soil erosion is often examined at the catchment scale [3,42], and soil erosion by water (riverbank erosion) is a significant contributor to land degradation and declining crop productivity [3]. Therefore, precipitation trends within river basins should have a more meaningful relationship to trends in ecosystem services and overall sustainability [3,16,42]. In fact, this study is part of a larger project to assess drivers of riverbank erosion at the outlet of the Meghna in the Bangladesh delta.

2. Materials and Methods

2.1. Study Area

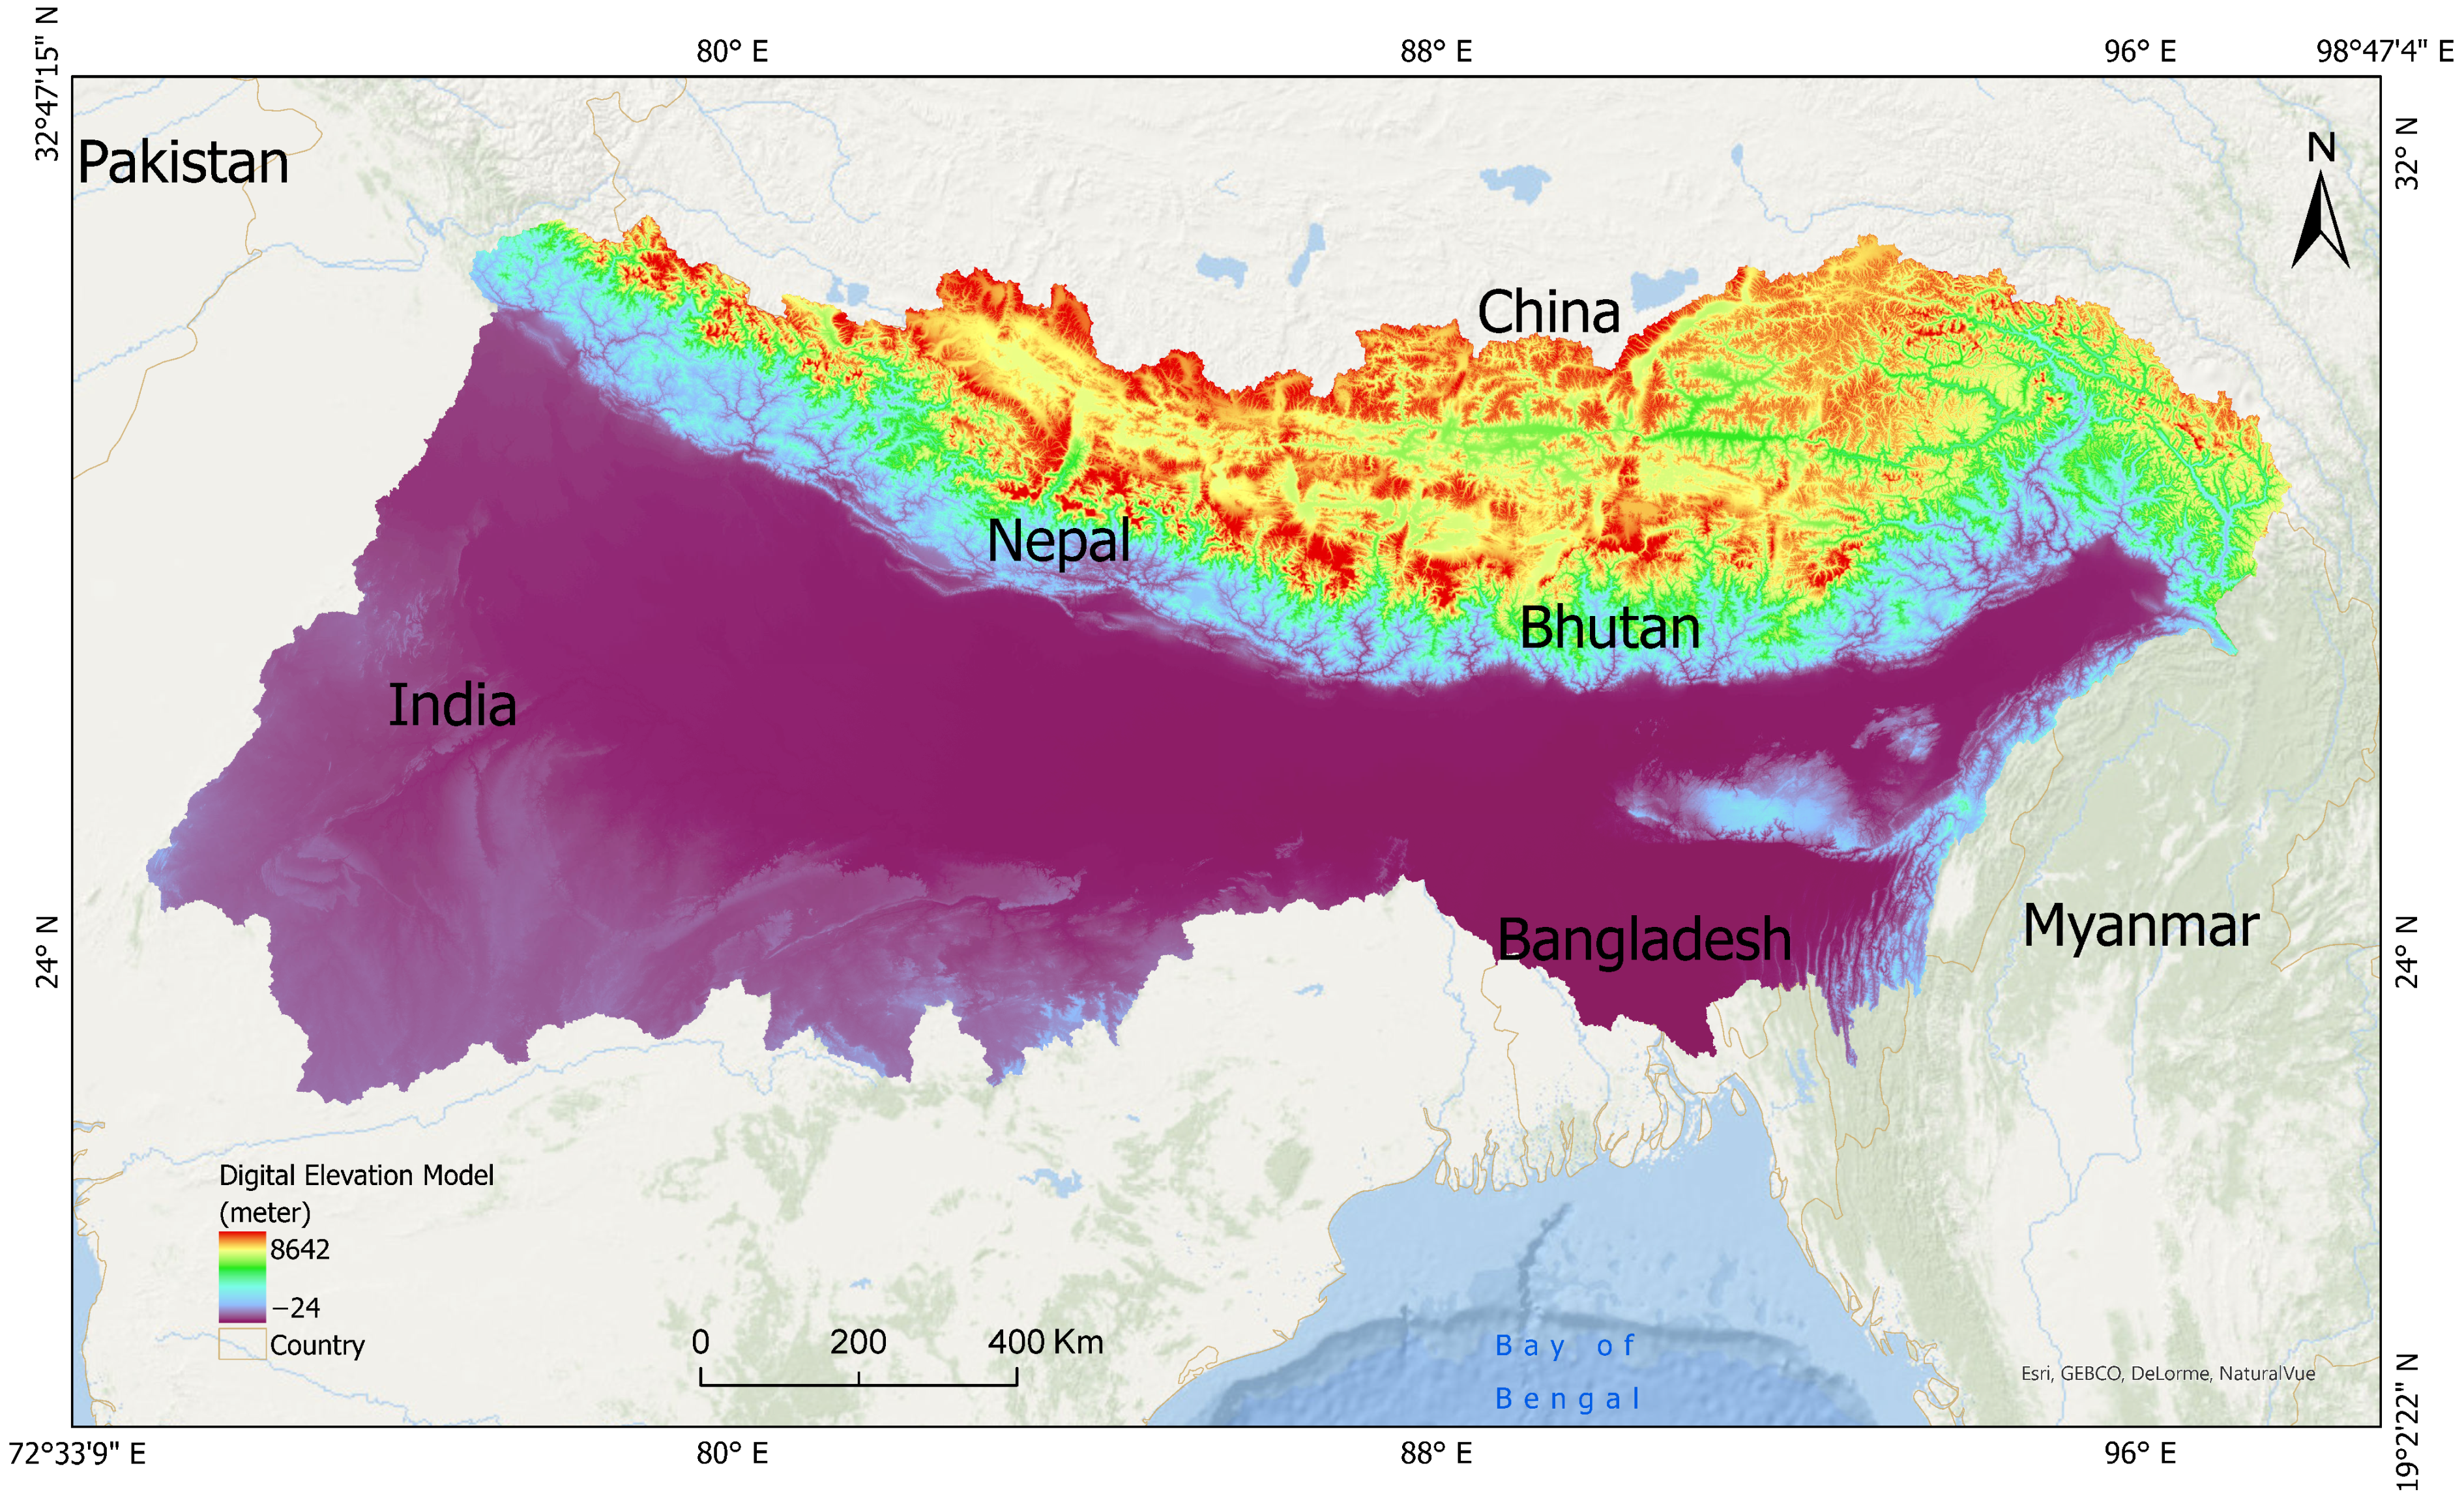
The GBM River Basin is the world’s third-largest river basin after Amazon and Congo river basins [43]. It covers approximately 1.75 million km2 [4], and is home to 630 million people [44]. GBM is a transboundary river basin [44] comprised of India (64%), China (18%), Nepal (9%), Bangladesh (7%), and Bhutan (3%) [20,44]. Nepal and Bhutan are located entirely within the Ganges and Brahmaputra river basins, respectively. Whereas, India and Bangladesh share areas with all three rivers basins, and China is part of only the Ganges and Brahmaputra basins [44] (Figure 1a).
The GBM elevation ranges from −24 to 8642 m above sea level, as shown in Figure 1b, prepared using hydrological data and maps based on the SHuttle Elevation Derivatives at multiples Scales (HydroSHEDS) data layer in ArcGIS. The GBM river basin is elongated from the higher mountainous region to the Bay of Bengal and has a unique climatic and physiographic feature that leads to four seasons: pre-monsoon, monsoon, post-monsoon, and winter [44]. This study only focuses on pre-monsoon and monsoon seasonal precipitation trend analysis in the GBM river basin. Among the four seasons, more than 80% of the 1500 mm of GBM annual rainfall [44] accumulates in the monsoon season between June to September [44] and the remaining 20% to 30% in the dry season. Less precipitation occurs in the Ganges compared to the Brahmaputra and Meghna river basins [4]. The three rivers meet in Bangladesh’s Chandpur district and flow into the Bay of Bengal as the Meghna river [45], comprising the world’s third-largest freshwater system [46].

2.2. Satellite-Based Precipitation Products

Satellite-based precipitation products have rapidly developed over the past few decades and are highly applicable for estimating precipitation at regional and global scales. More importantly, these products are useful for developing countries where long-term gauge-based data are not available. In addition to PERSIANN-CDR and MSWEP, Tropical Rainfall Measuring Mission (TRMM) Multi-satellite Precipitation Analysis (TMPA) [47], Climate Prediction Center morphing technique (CMORPH) [48], Precipitation Estimation from Remotely Sensed Information Using Artificial Neural Networks (PERSIANN) [49], and Integrated Multi-satellite Retrievals for Global Precipitation Measurements (IMERG) [50] are some of the commonly used satellite-based precipitation products. MSWEP has a 0.1-degree resolution and PERSIANN-CDR has a 0.25-degree resolution. We analyze and compare the trend patterns of pre-monsoon and monsoon precipitation in the GBM river basin for the period of 1983–2019. Both products provide long-term precipitation data sets, and PERSIANN-CDR has been used frequently in the countries of the GBM river basin [36,38,51,52,53,54].

2.2.1. Precipitation Estimation from Remotely Sensed Information Using Artificial Neural Networks-Climate Data Record (PERSIANN-CDR)

The PERSIANN-CDR precipitation product [36] was developed at the Center for Hydrometeorology and Remote Sensing (CHRS) at the University of California, Irvine (Table 1). The bias-corrected final product uses a modified PERSIANN algorithm that adjusts gridded satellite infrared data (GridSat-B1) by the Global Precipitation Climatology Project (GPCP) monthly products to estimate global daily precipitation with 0.25 × 0.25 degree spatial resolution [35]. It covers latitudes between 60° S and 60° N and provides rainfall data every 3 h from 1983 to the present [35]. It uses the long-wave infrared images from geosynchronous satellites to measure rainfall rate. These characteristics make the PERSIANN-CDR a reliable and useful satellite-based product for global climate studies and extreme weather events [35]. It has been used continuously for different studies throughout the world by researchers in climate change, hydrology, water resources management, and natural hazards [55].

2.2.2. Multi-Source Weighted Ensemble Precipitation (MSWEP)

MSWEP is a newly developed global precipitation product with 0.1-degree spatial resolution [34] that provides rainfall data at 3 h temporal resolution from 1979 to the present (Table 1). It uses gauges (WorldClim, Global Historical Climatology Network-Daily (GHCN-D), Global Summary of the Day (GSOD), and others), satellites (CMORPH, GridSat, Global Satellite Mapping of Precipitation (GSMaP), and TRMM Multi-satellite Precipitation Analysis (TMPA) 3B42RT], and reanalysis-based products (European Centre for Medium-Range Weather Forecasts (ECMWF) interim reanalysis (ERA-Interim), Japanese 55-year Reanalysis (JRA-55), and National Centers for Environmental Prediction-Climate Forecast System Reanalysis (NCEP-CFSR)] to estimate precipitation over the entire globe [56]. Compared to other precipitation products, MSWEP is more accurate in estimating precipitation over mountainous regions. It also uses a precipitation gauge correction approach at daily time scale to improve time mismatching [34]. All these quality enhancements maximize the reliability of this product [57]. However, there is a lack of scientific research using MSWEP.

2.3. Method

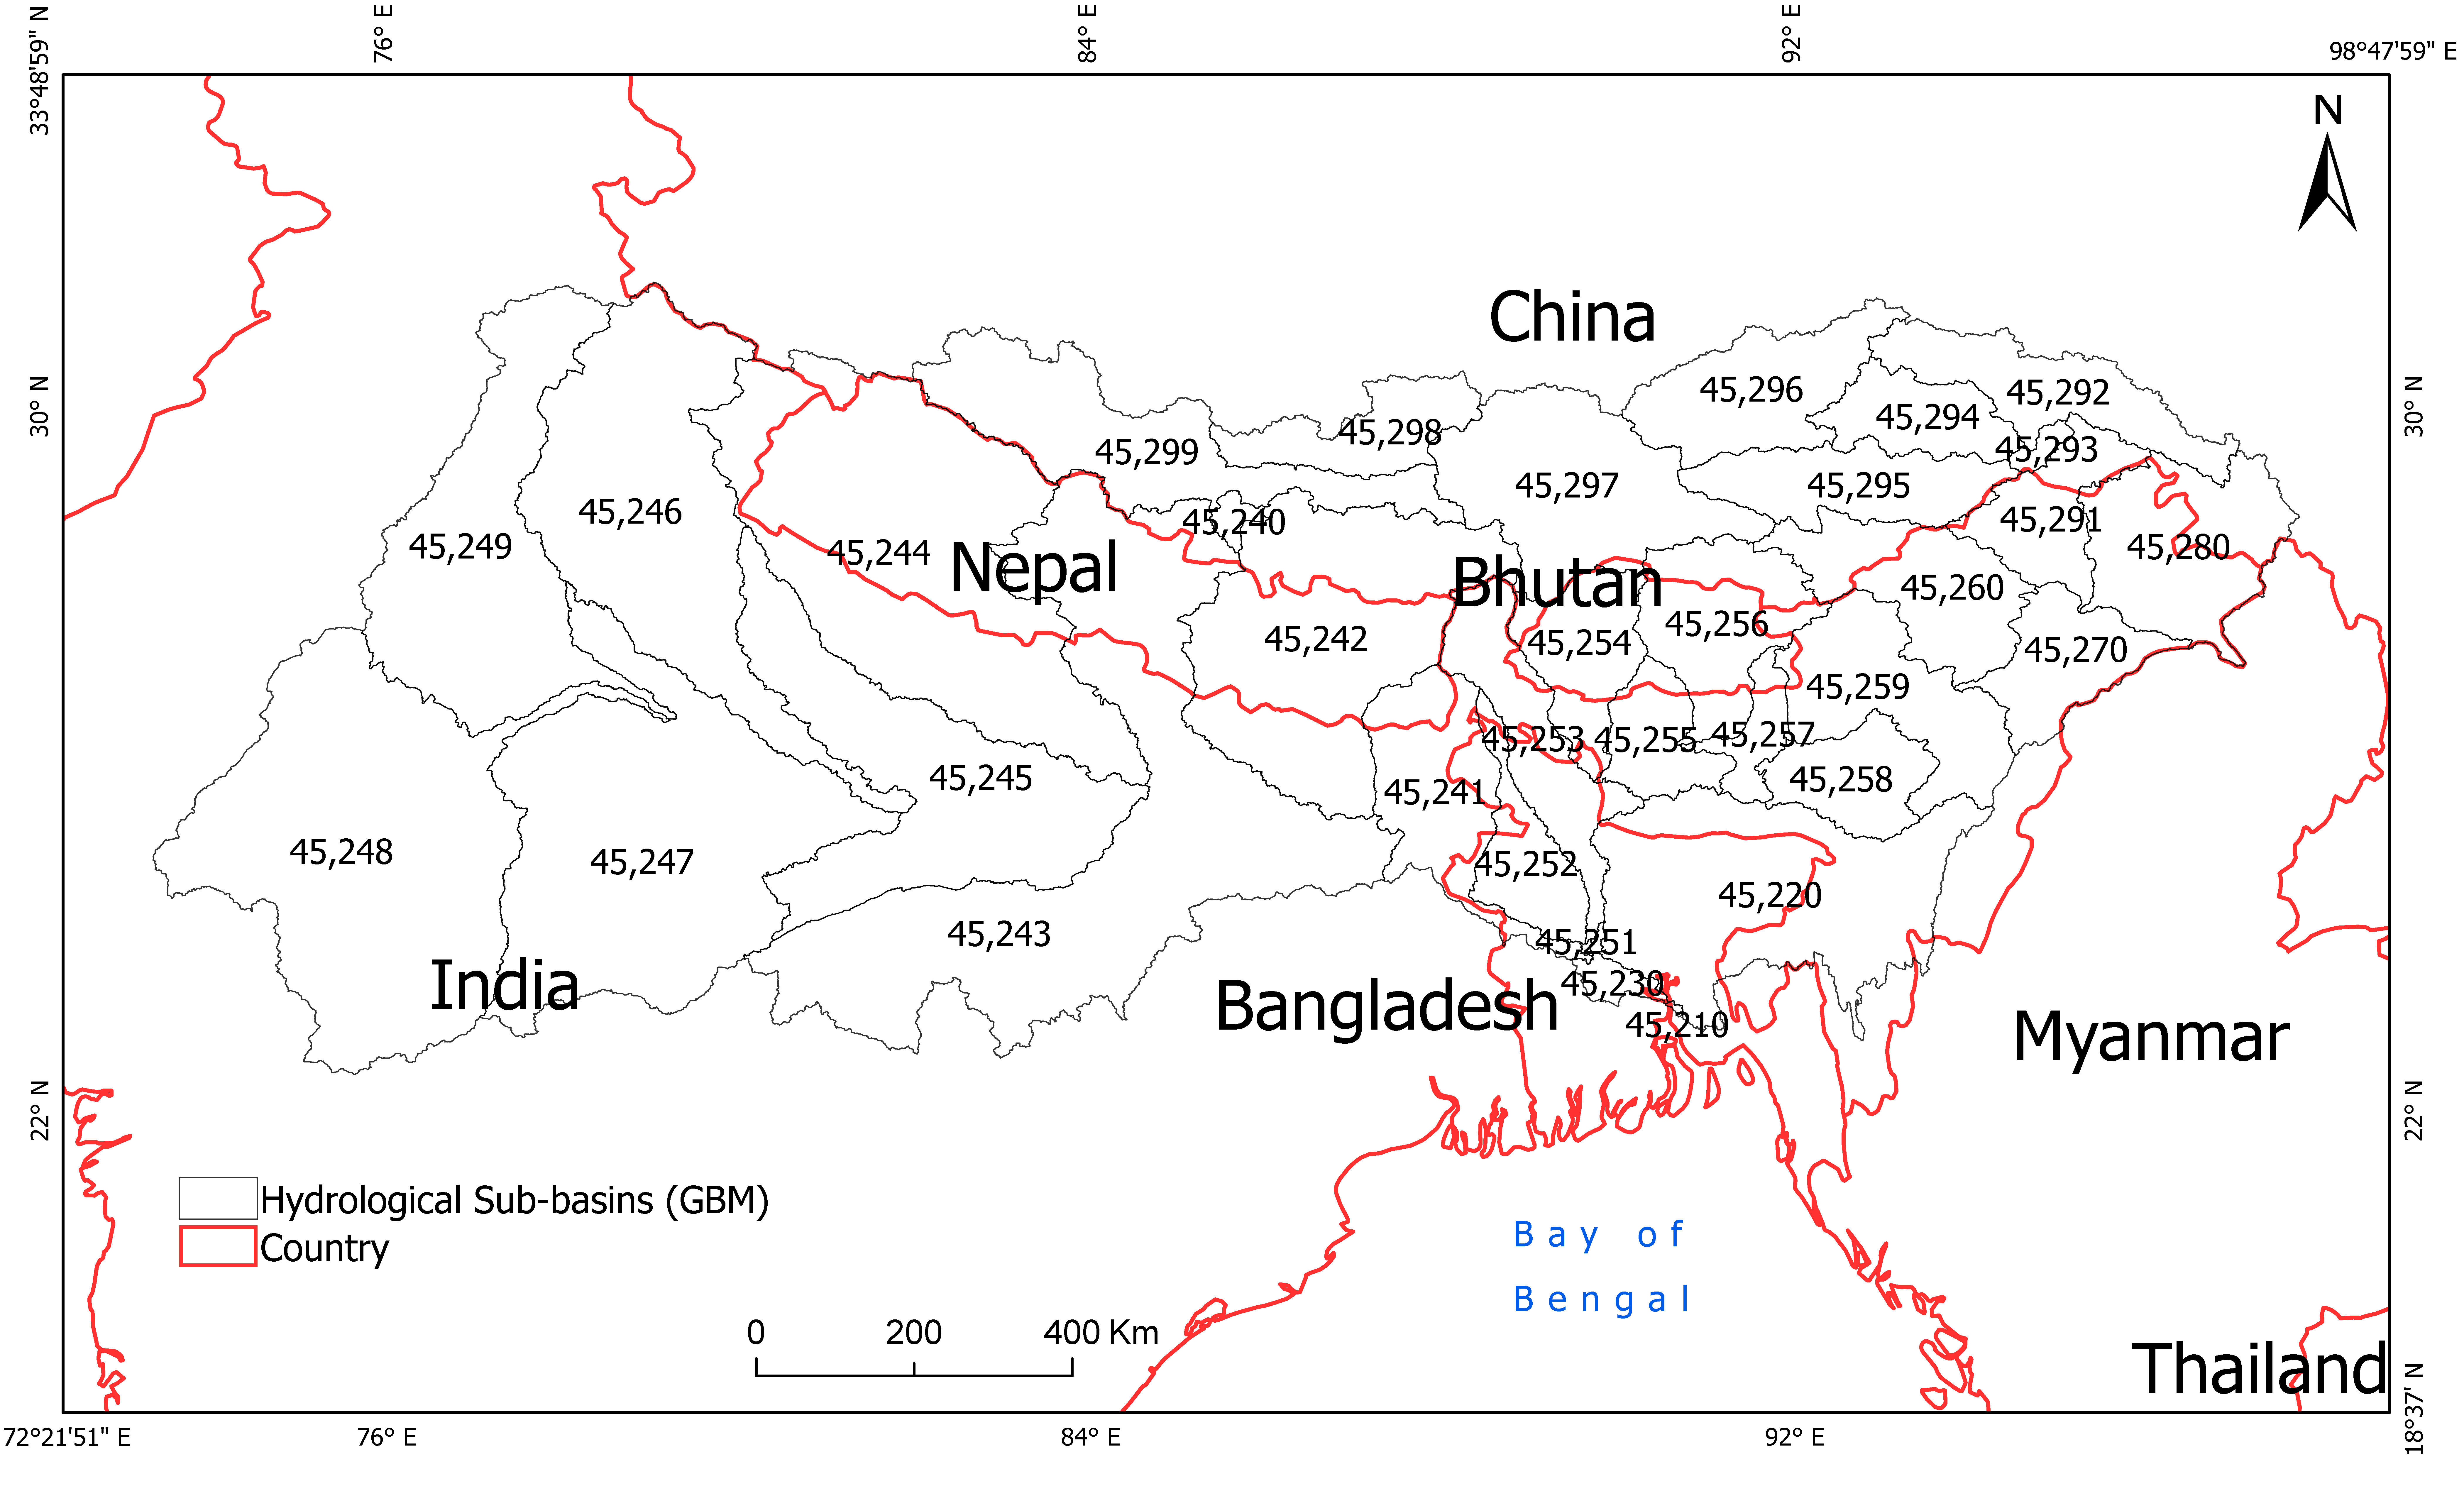
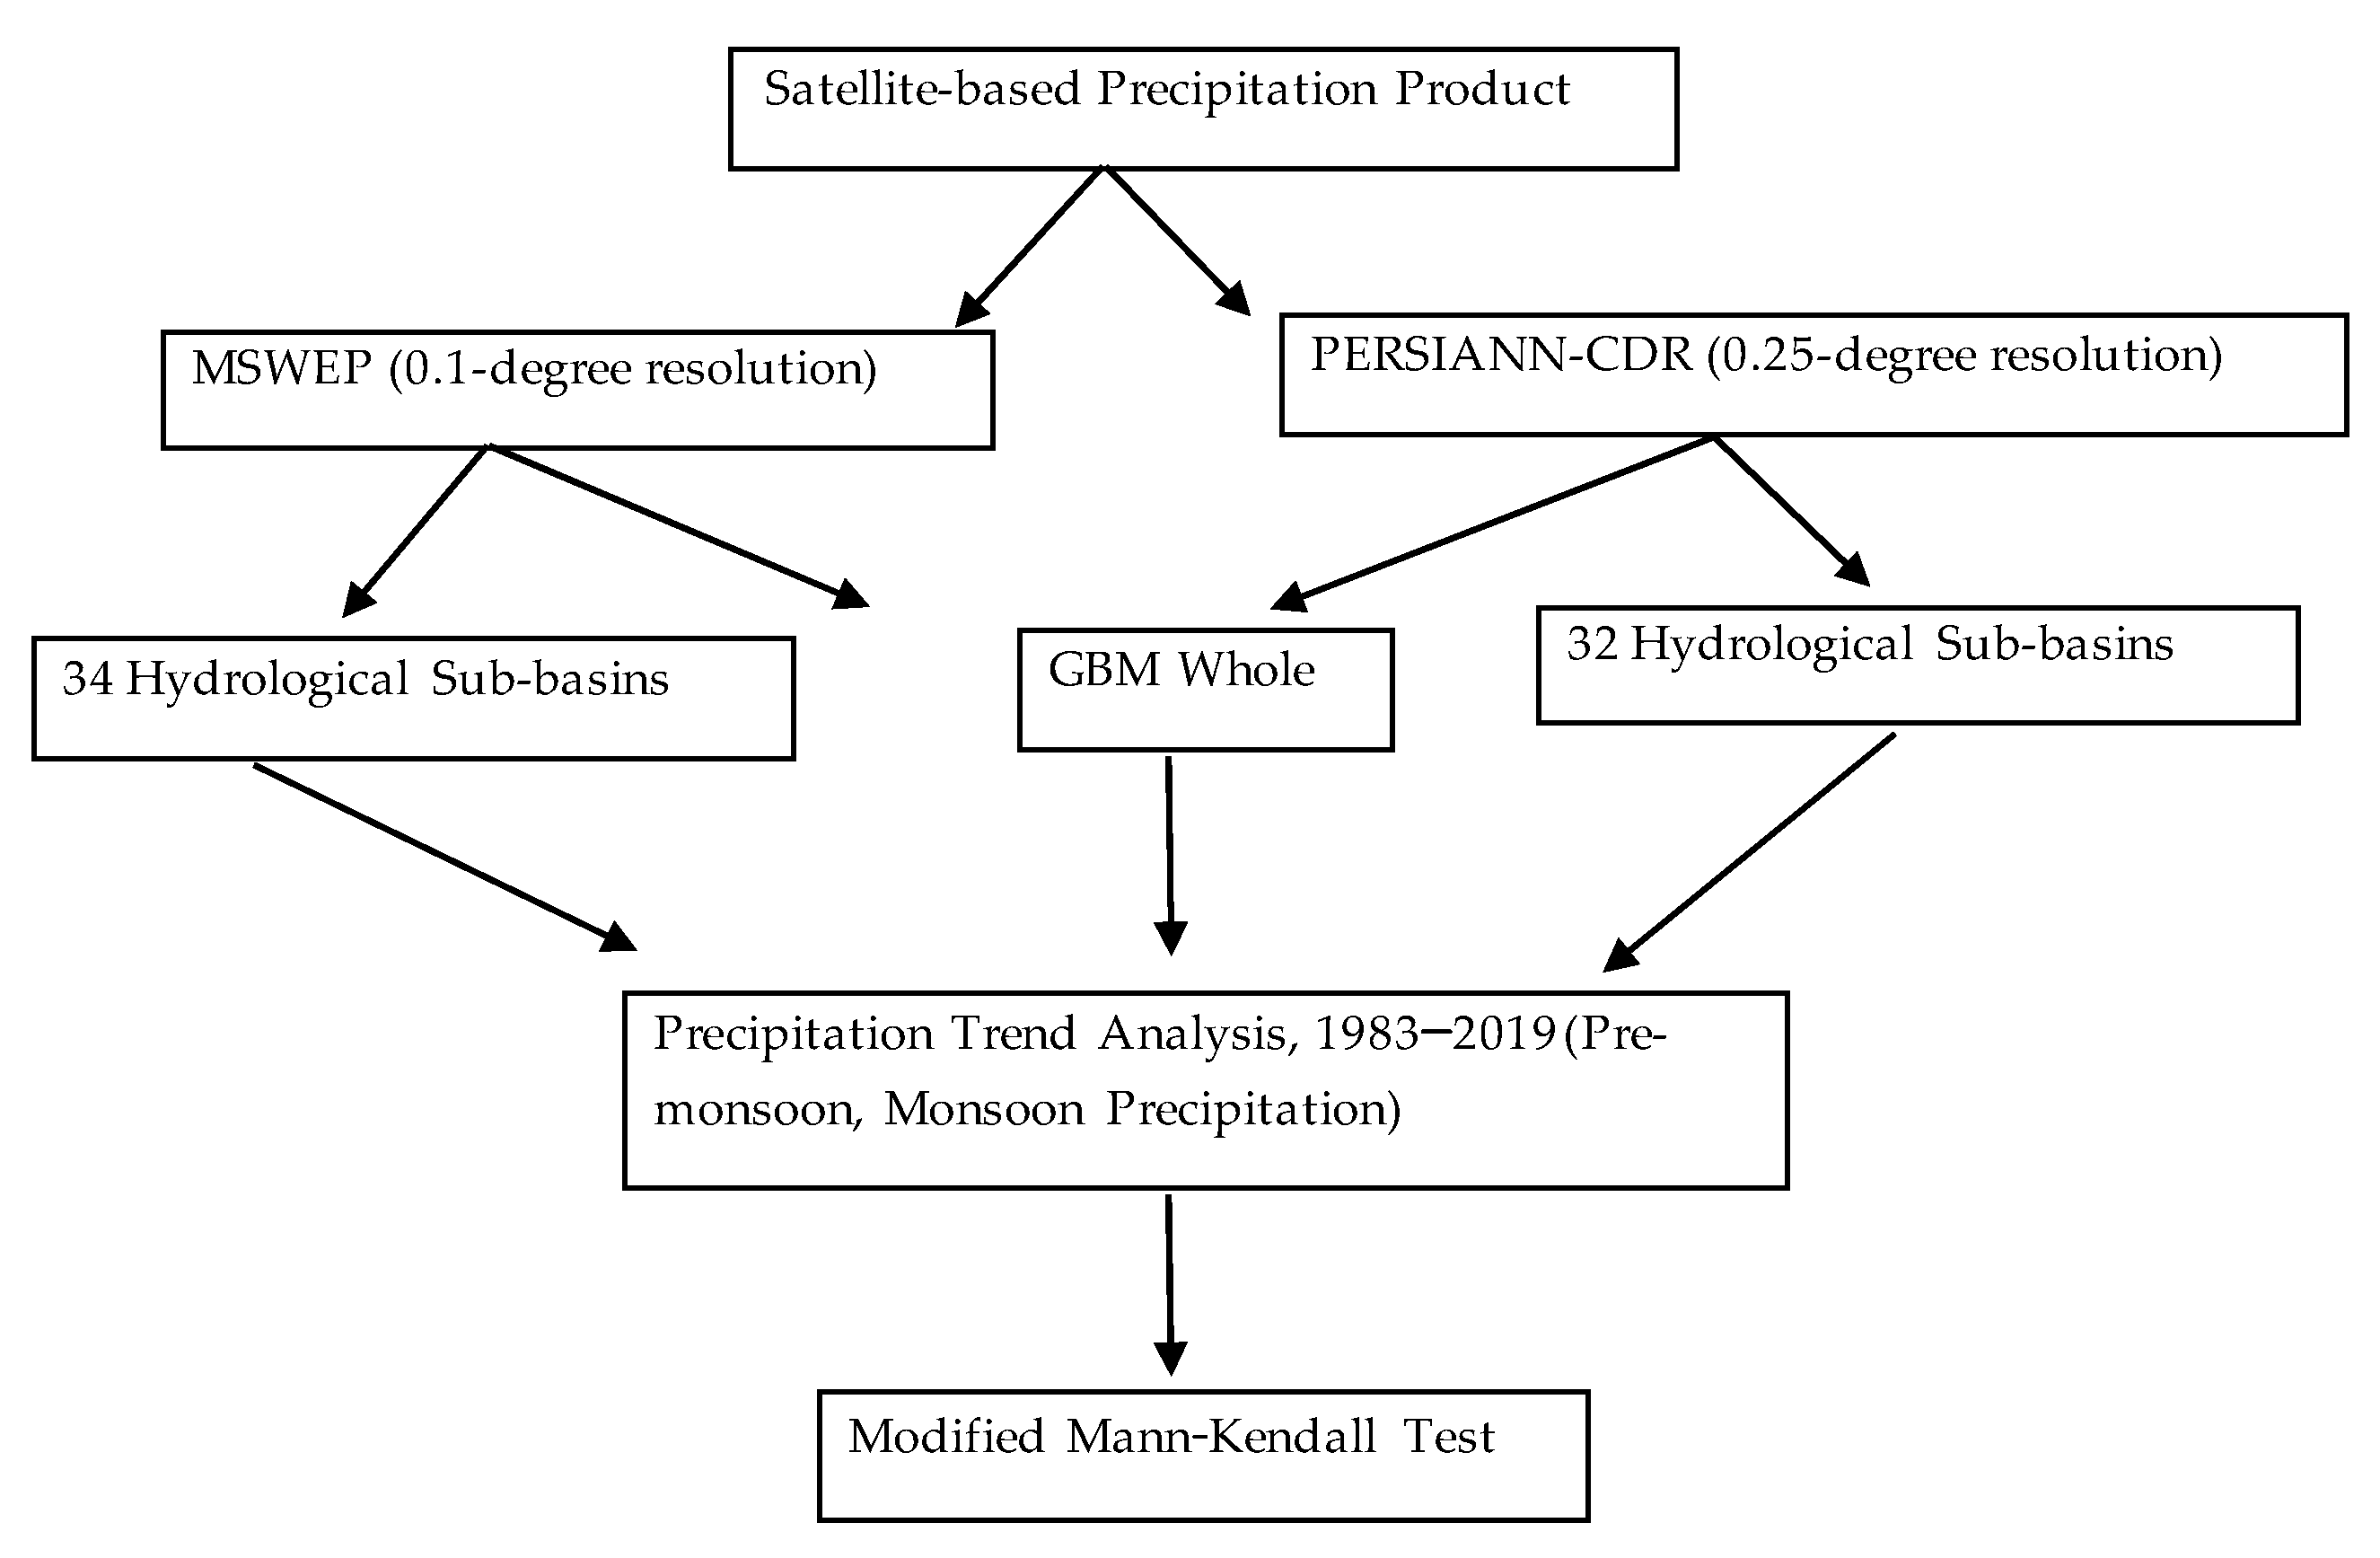
Both MSWEP and PERSIANN-CDR monthly precipitation data were averaged over the pre-monsoon and monsoon seasons for the entire GBM river basin and within 34 pre-defined hydrological sub-basins of the GBM separately. The sub-basin boundaries correspond to the HydroBASIN GIS layer from the World Wildlife Fund [58]. Figure 2 shows the Pfafstetter level-05 sub-basins’ boundaries of the GBM obtained from the World Wildlife Fund (Gland, Switzerland). The Pfafstetter coding system was developed by Otto Pfafstetter in 1989 and is widely used for the description of watersheds or basins. It assigns ID numbers based on the topology of the land surface to describe watersheds as either basin, inter-basin, or internal basin. Pfafstetter level-05 corresponds to inter-basin due to the contribution of additional water to the main stem [59]. Here, the coding number of each sub-basin’s increments from downstream to the upstream, containing 34 hydrological sub-basins. This study only considered 32 pre-defined hydrological sub-basins among the total of 34 when using PERSIANN-CDR. We excluded two smallest sub-basins that were not covered by the 0.25-degree grid resolution of PERSIANN-CDR. Then, the Modified Mann-Kendall test was applied to quantify and compare the trend pattern of the long-term time series of PERSIANN-CDR and MSWEP seasonal precipitation. The ‘modifiedmk’ package was used in R to write the algorithm for the non-parametric modified Mann-Kendall trend test, and ArcGIS Pro 2.8.1 was used to create maps for this study. The methodology is described in Figure 3.

2.3.1. Mann-Kendall Test

Mann-Kendall test is one of the statistical methods developed by Mann [28] and Kendall [29] as a non-parametric test of trend. It is frequently used to study spatial variation and temporal trends of hydro-climatic time series [60]. The null hypothesis of the MannKendall trend test assumes that there is no trend in the data. The statistical method is briefly discussed below.
The Mann-Kendall statistic Mann [28] and Kendall [29] is given as:
S = i = 1 n 1 j = i + 1 n s g n ( x j x i )
where,
n = number of data points,
xi = data value in time series I,
i = 1, 2, …, n − 1,
xj = data value in time series j (where j > i),
j = i + 1, i + 2, …, n,
sgn (xixj) is the sign function.
S g n ( x j x i ) = { + 1 ,   i f ( x j x i ) > 0 0 ,   i f ( x j x i ) = 0 1 ,   i f ( x j x i ) < 0
The variance is computed as:
V a r ( S ) = n ( n 1 ) ( 2 n + 5 ) i = 1 m t i ( t i 1 ) ( 2 t i + 5 ) 18
where,
n = number of data points,
m = number of tied groups,
ti = number of ties of extent i (a tied group is a set of sample data having the same value).
The standard normal test statistics Z is computed using Equation (4):
Z = { S 1 v a r ( S ) ,   i f   S > 0 0 ,   i f   S = 0 S + 1 v a r ( S ) , i f   S < 0
Positive values of Z indicate increasing trends, while negative Z-values indicate decreasing trends. Testing trends is based on the specific α significance level of 0.05. The null hypothesis is rejected if the ǀZǀ value is greater than 1.96, which corresponds to the 95% significance level based on a look-up table.

2.3.2. Modified Mann-Kendall Test

The Mann-Kendall test failed to address autocorrelation in the time series data. Therefore, the Modified Mann-Kendall (MMK) test is used to resolve this concern. The modification of the test improves the accuracy rate of the significance levels and decreases the chance of a nonexistent trend [30]. This study used Modified Mann-Kendall test based on the variance (S) correction approach introduced by [30].
The modified variance (S) is given by:
V a r ( S ) = n ( n 1 ) ( 2 n + 5 ) 18 n n S *
where
n n S * = 1 + 2 n ( n 1 ) ( n 2 ) × i = 1 n 1 ( n i ) ( n i 1 ) ( n i 2 ) ρ S ( i )
n = actual number of observations,
ρ S ( i ) = autocorrelation function of the ranks of the observations,
n n S * = represents a correction due to the autocorrelation in the data.

3. Results

3.1. Precipitation Trend of Ganges-Brahmaputra-Meghna River Basin

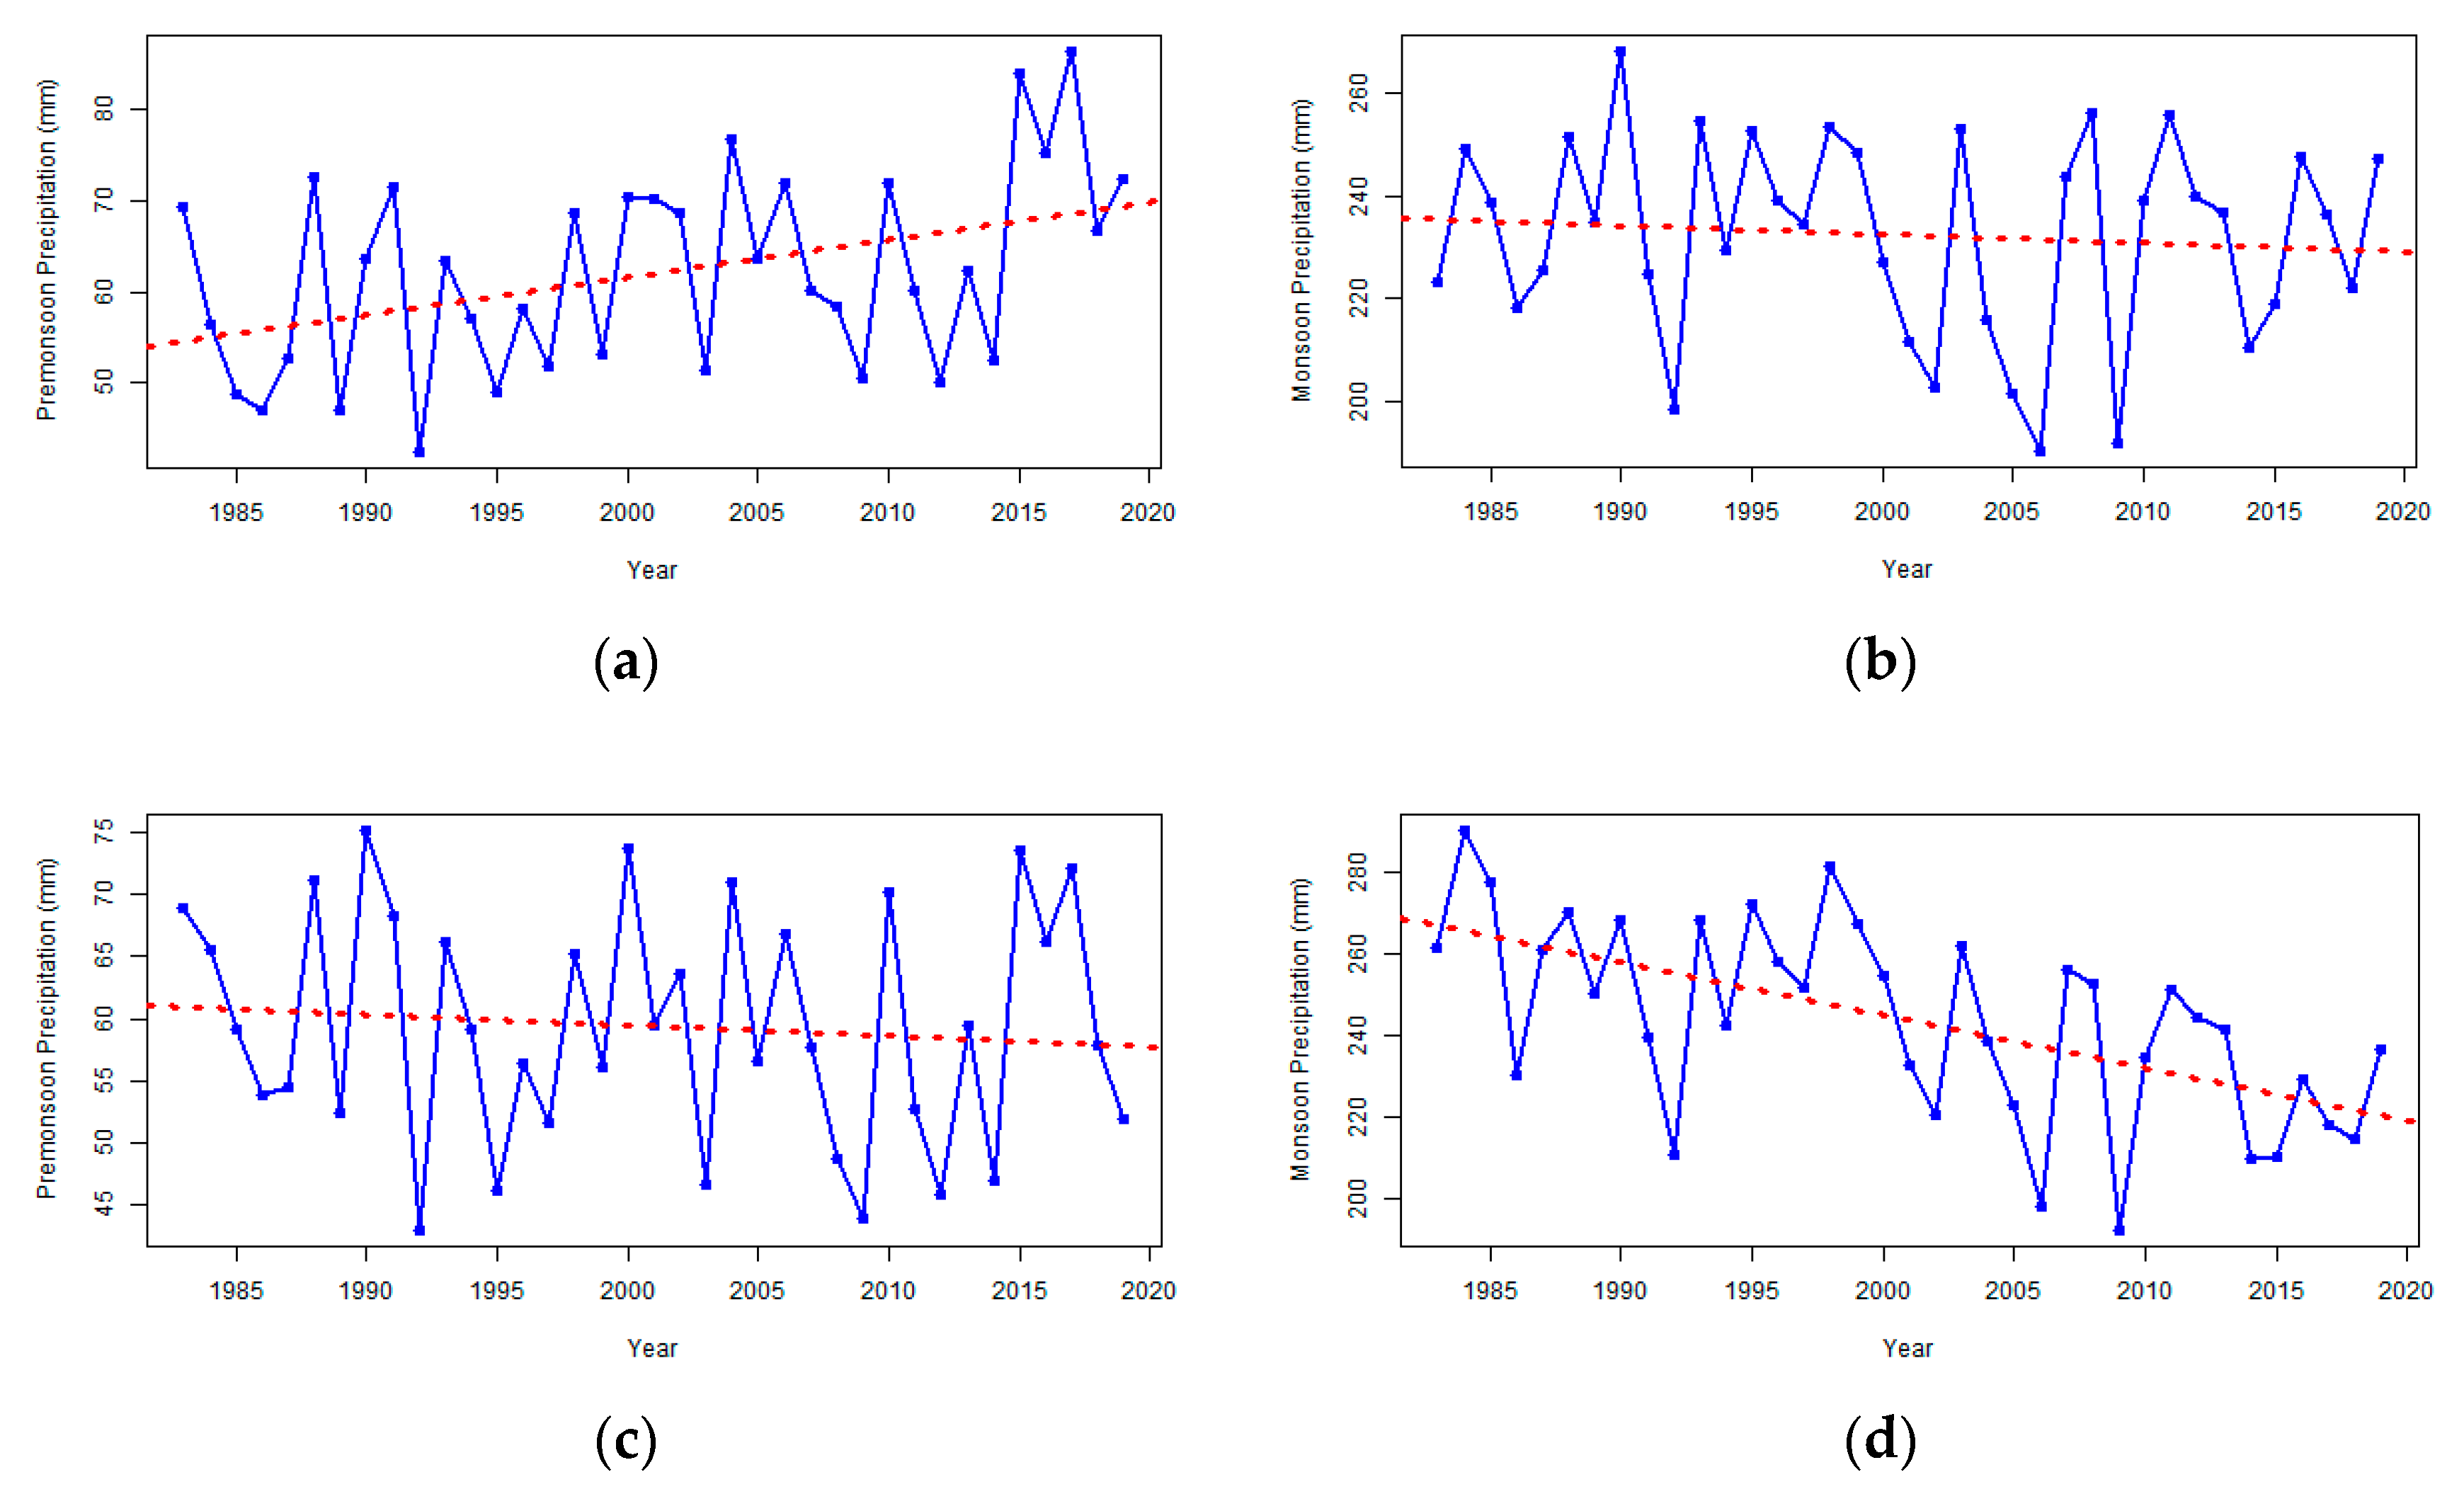
The precipitation trend test results for both MSWEP and PERSIANN-CDR are shown in Figure 4, and all the Z-values and p-values for the Modified Mann-Kendall trend test are shown in Table 2. This study found that MSWEP pre-monsoon precipitation has a significant positive trend at the 95% significance level, whereas no significant trend was detected for the PERSIANN-CDR precipitation.
The Z-value of the MSWEP pre-monsoon precipitation trend was 2.236 and that of PERSIANN-CDR was −0.5362. On the contrary, a strong significant negative precipitation trend was detected in the PERSIANN-CDR monsoon precipitation with the Z-value of −33.07, while no significant precipitation trend was seen in the MSWEP. The Z-value using MSWEP was −0.554. The correlations between the time series are highly positive and significant for the pre-monsoon (R = 0.79) and monsoon (R = 0.78) seasons.

3.2. Precipitation Trends of Pre-Defined Hydrological Sub-Basins of the GBM River Basin

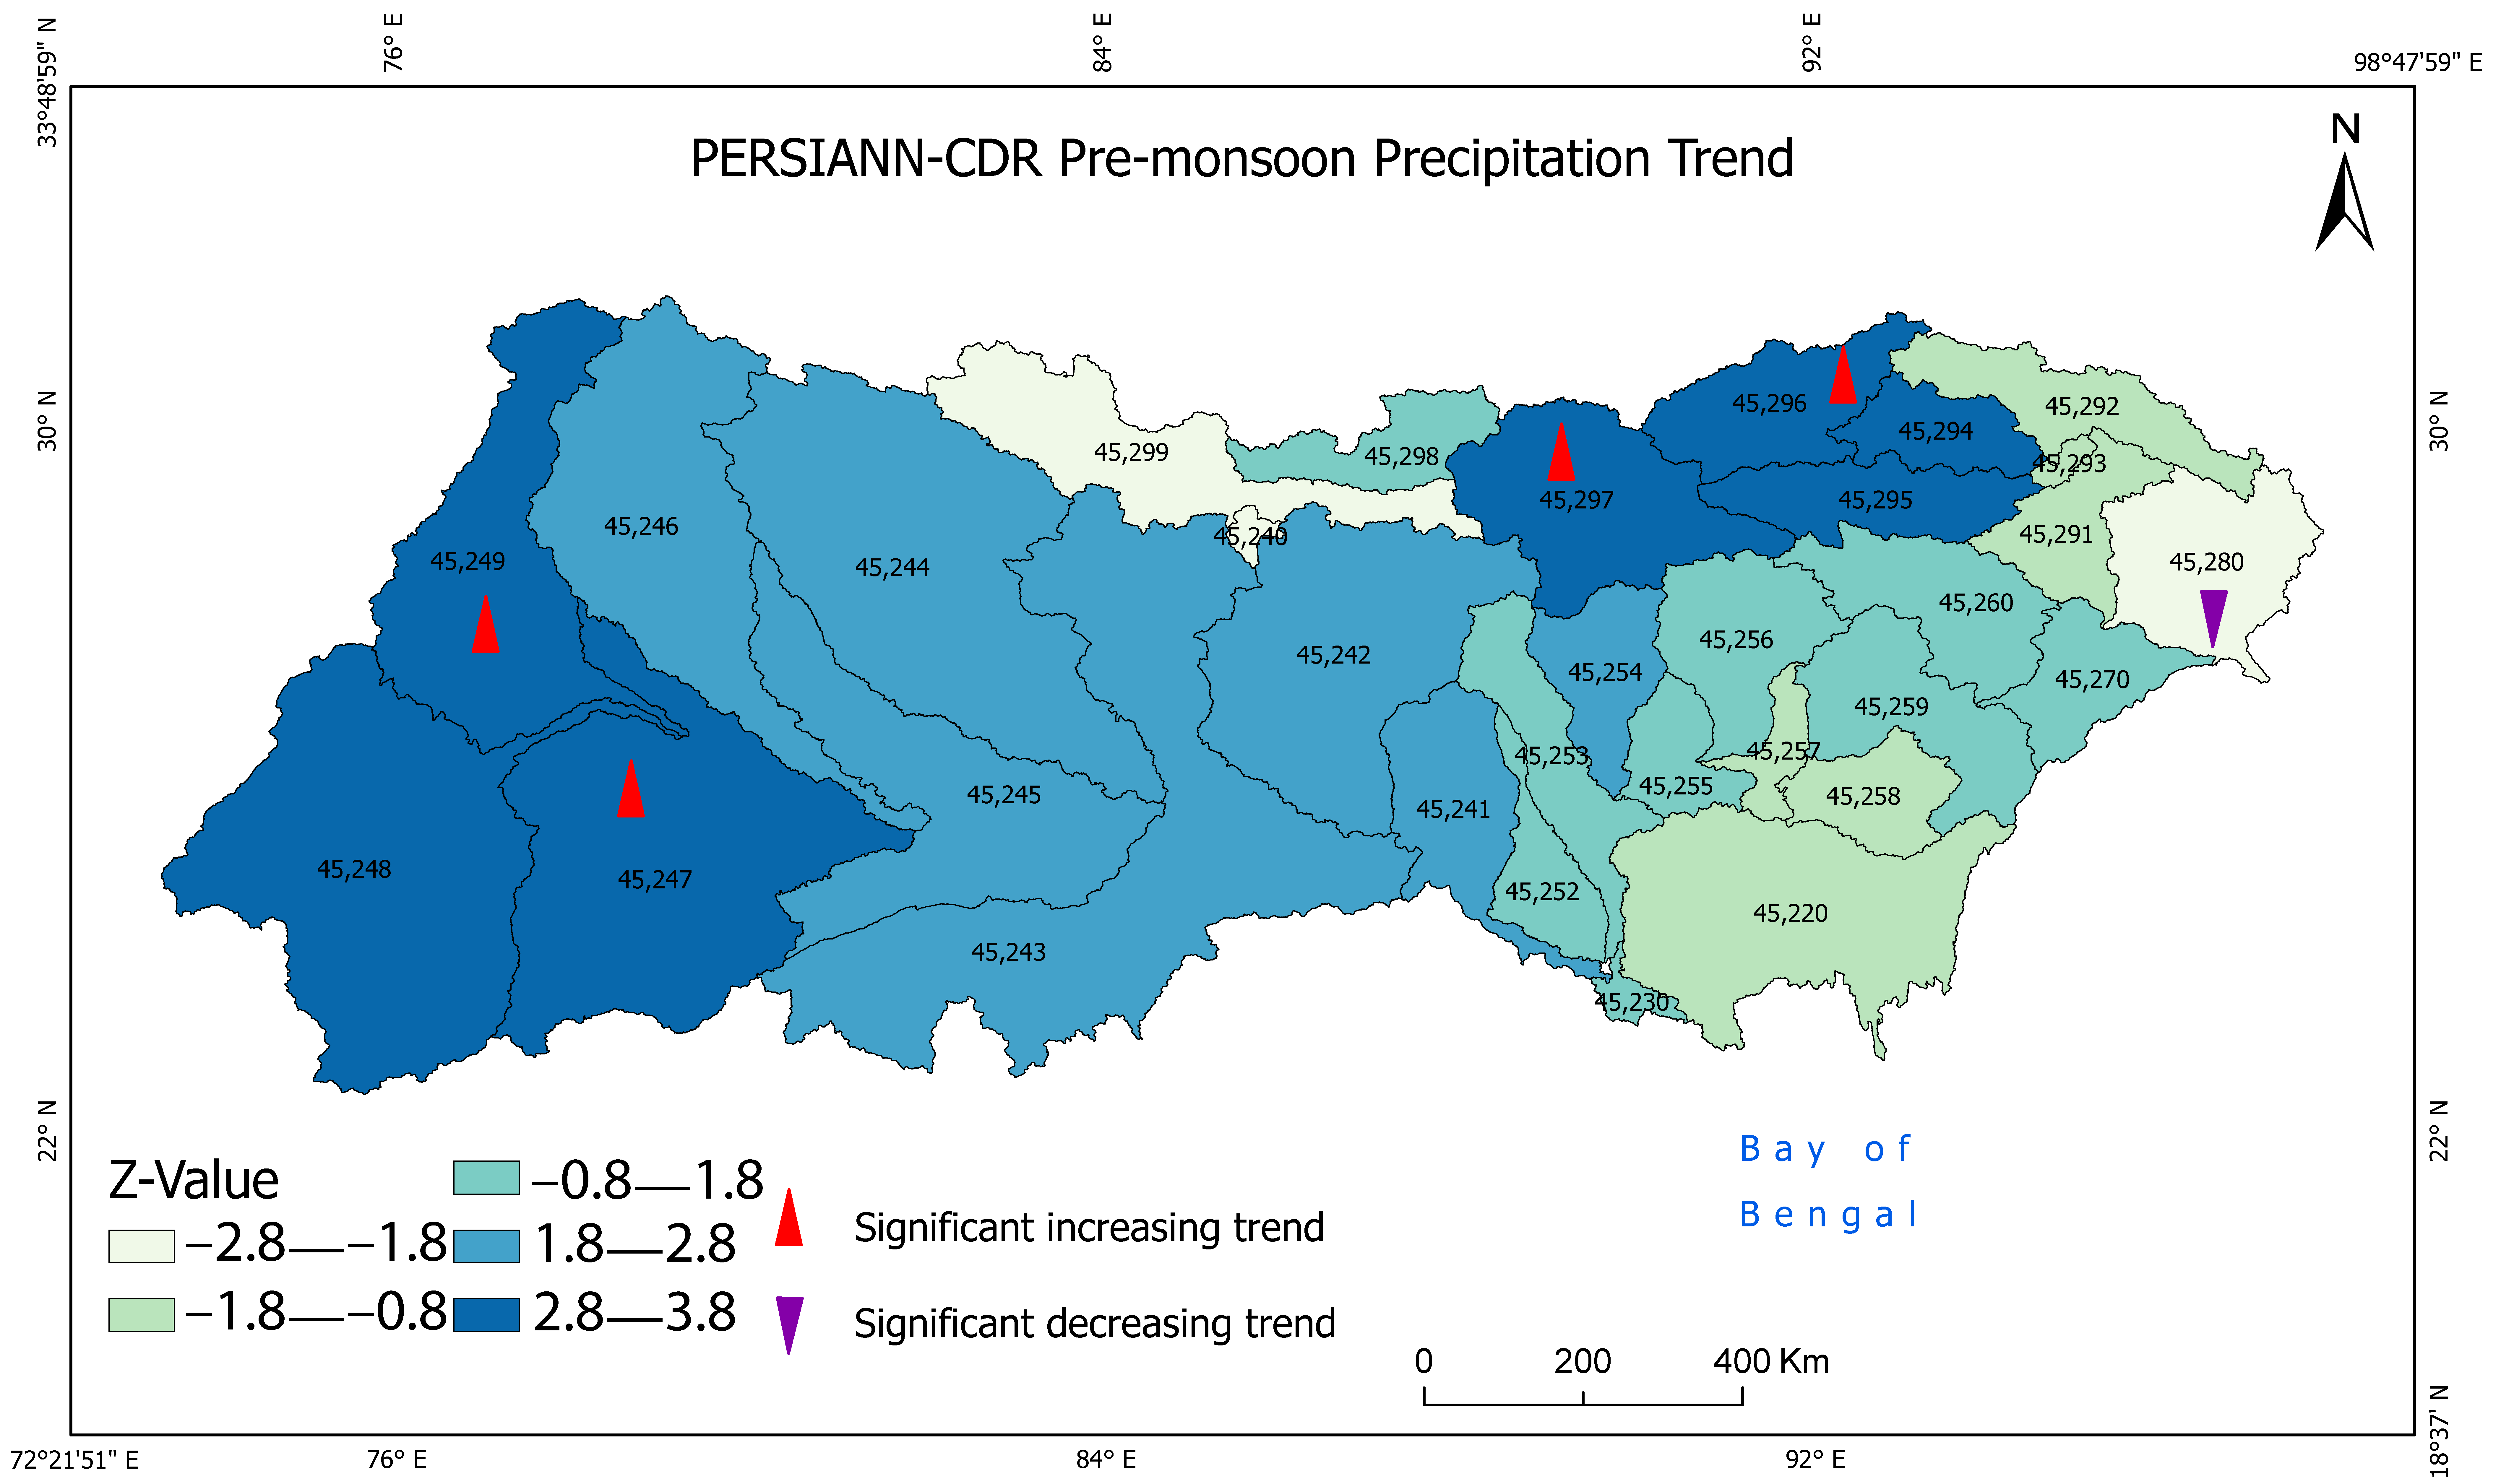
The MSWEP pre-monsoon precipitation had a significant positive trend in 13 sub-basins. In contrast, only four sub-basins had a significant positive trend in PERSIANN-CDR precipitation. Significant positive precipitation trends were mostly found in the central, far north, and western region of the basin as shown in Figure 5a,b. Among the 34 hydrological sub-basins, only six sub-basins in MSWEP showed negative Z-values but none were significant. Meanwhile, for PERSIANN-CDR, 22 hydrological sub-basins showed negative Z-values, and only sub-basin 45,280, situated in the eastern region, showed a significant negative precipitation trend.
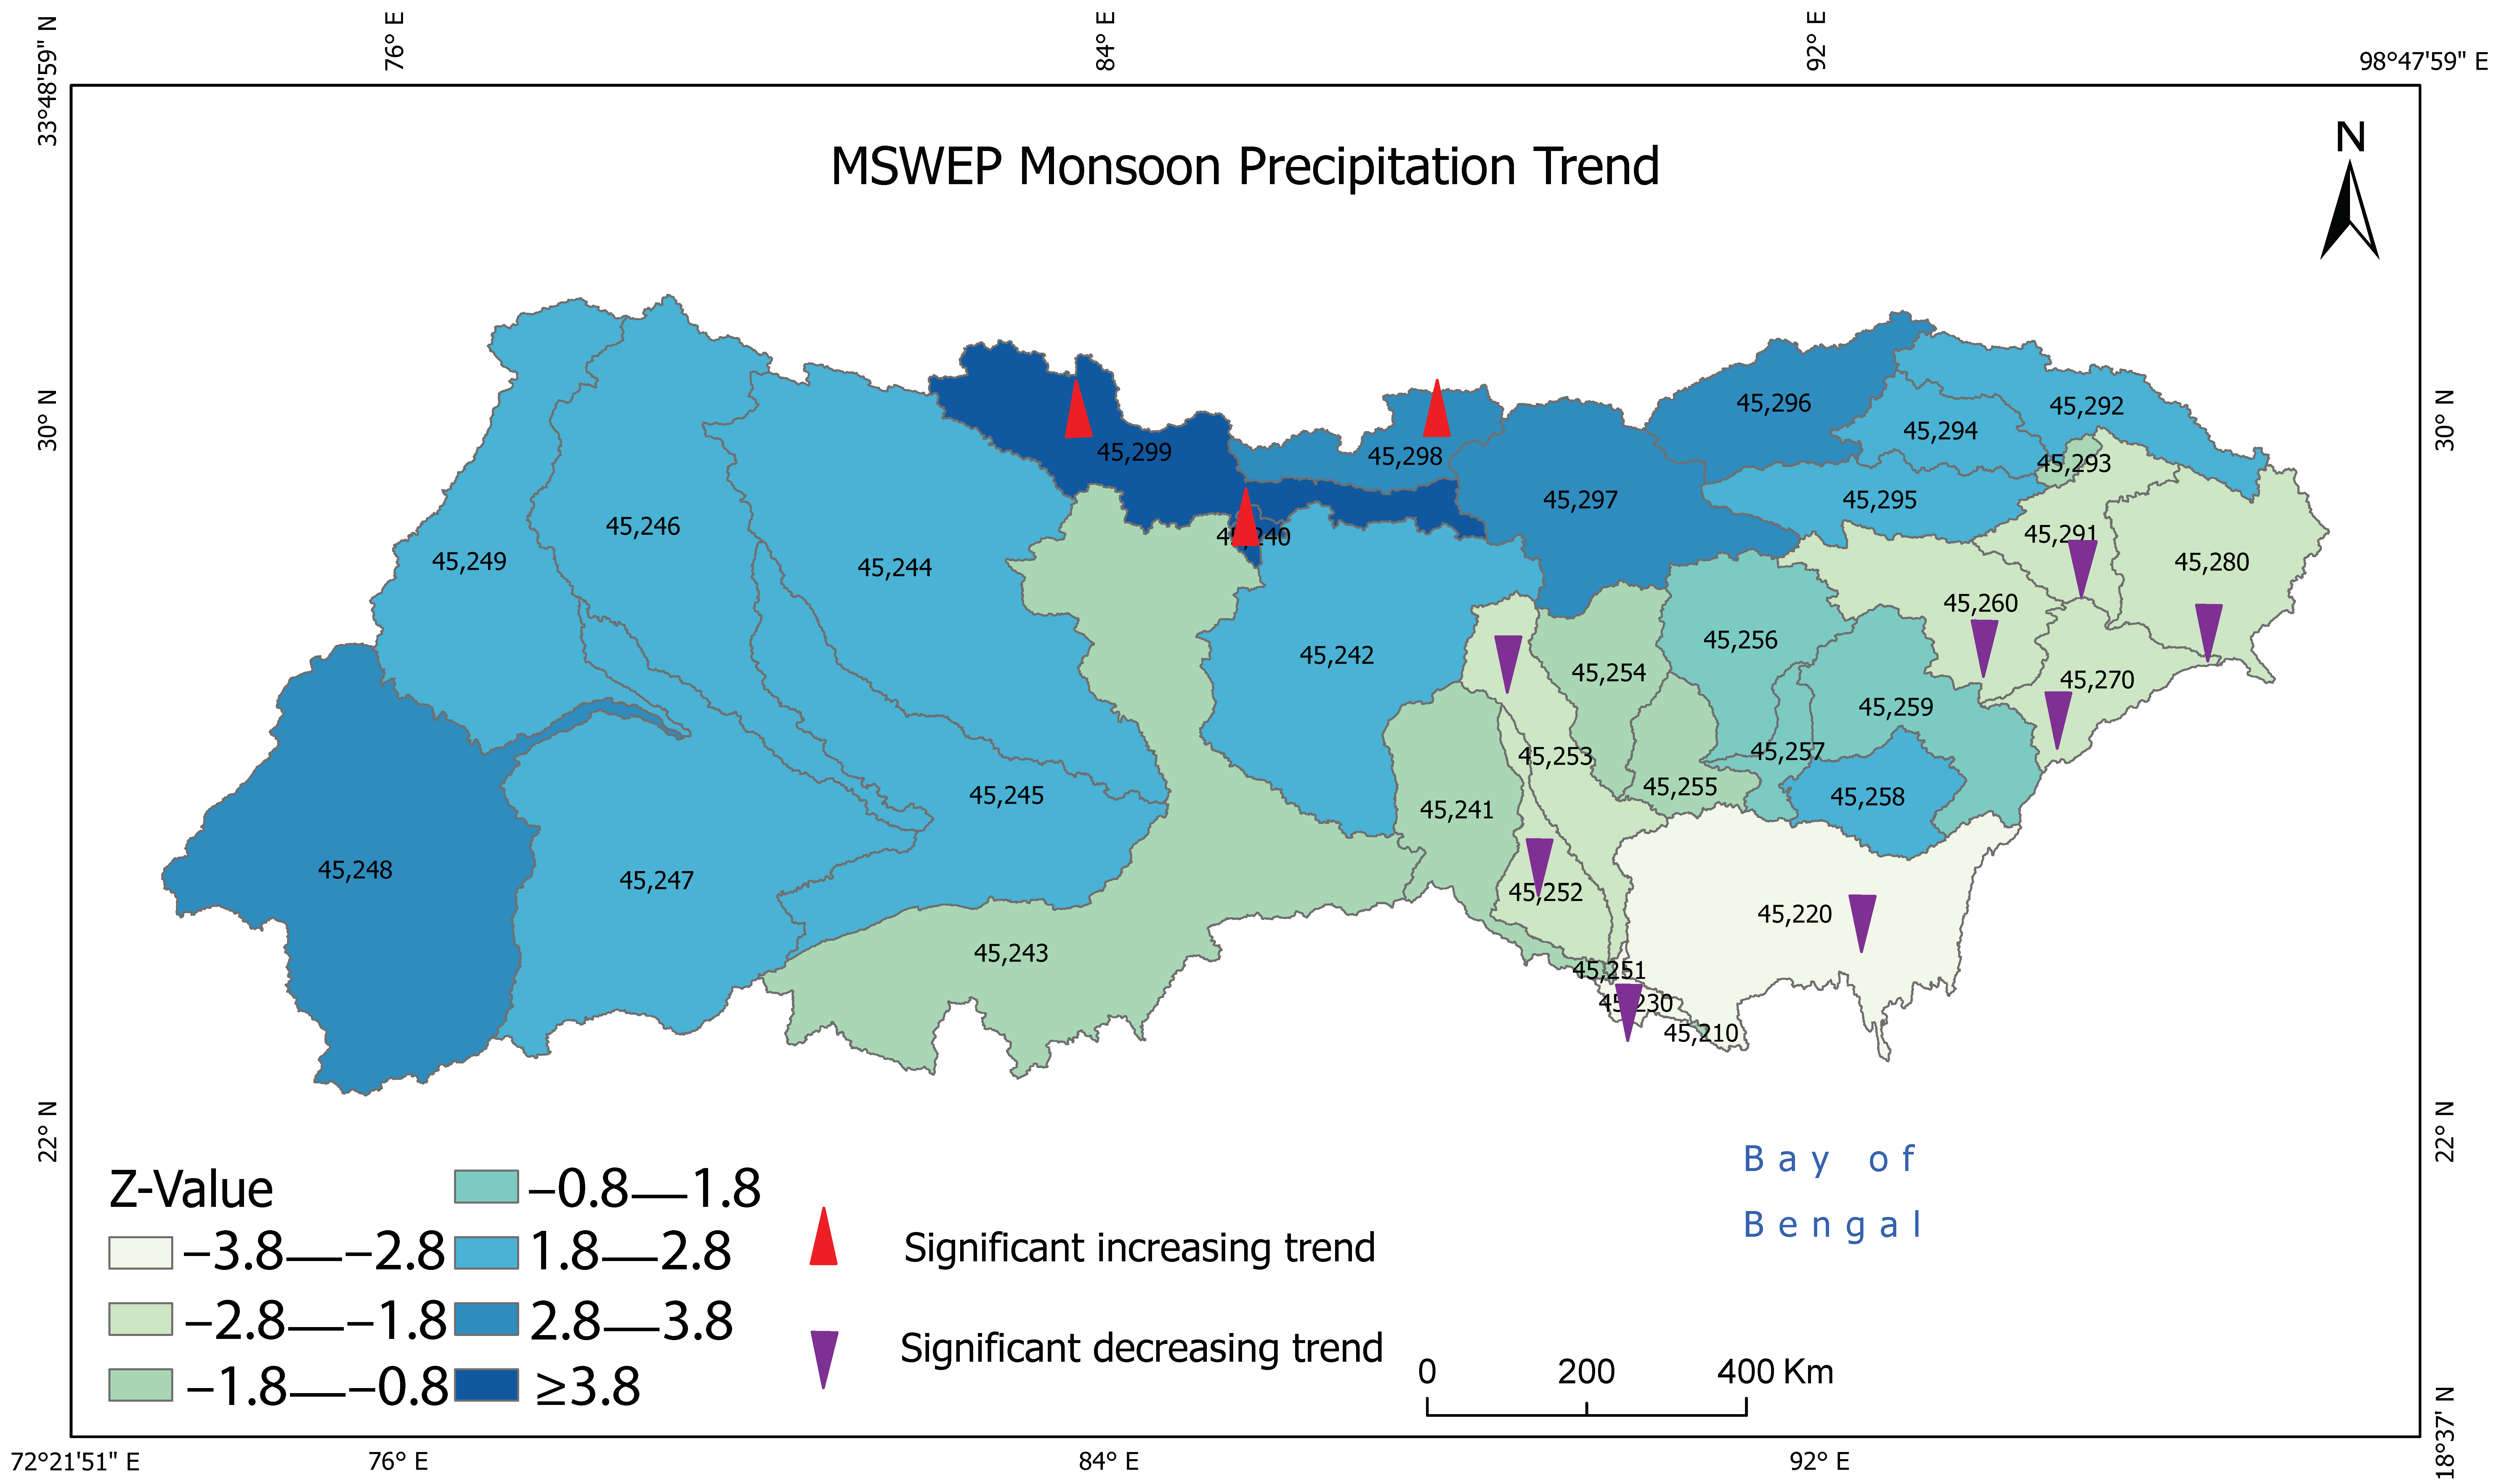
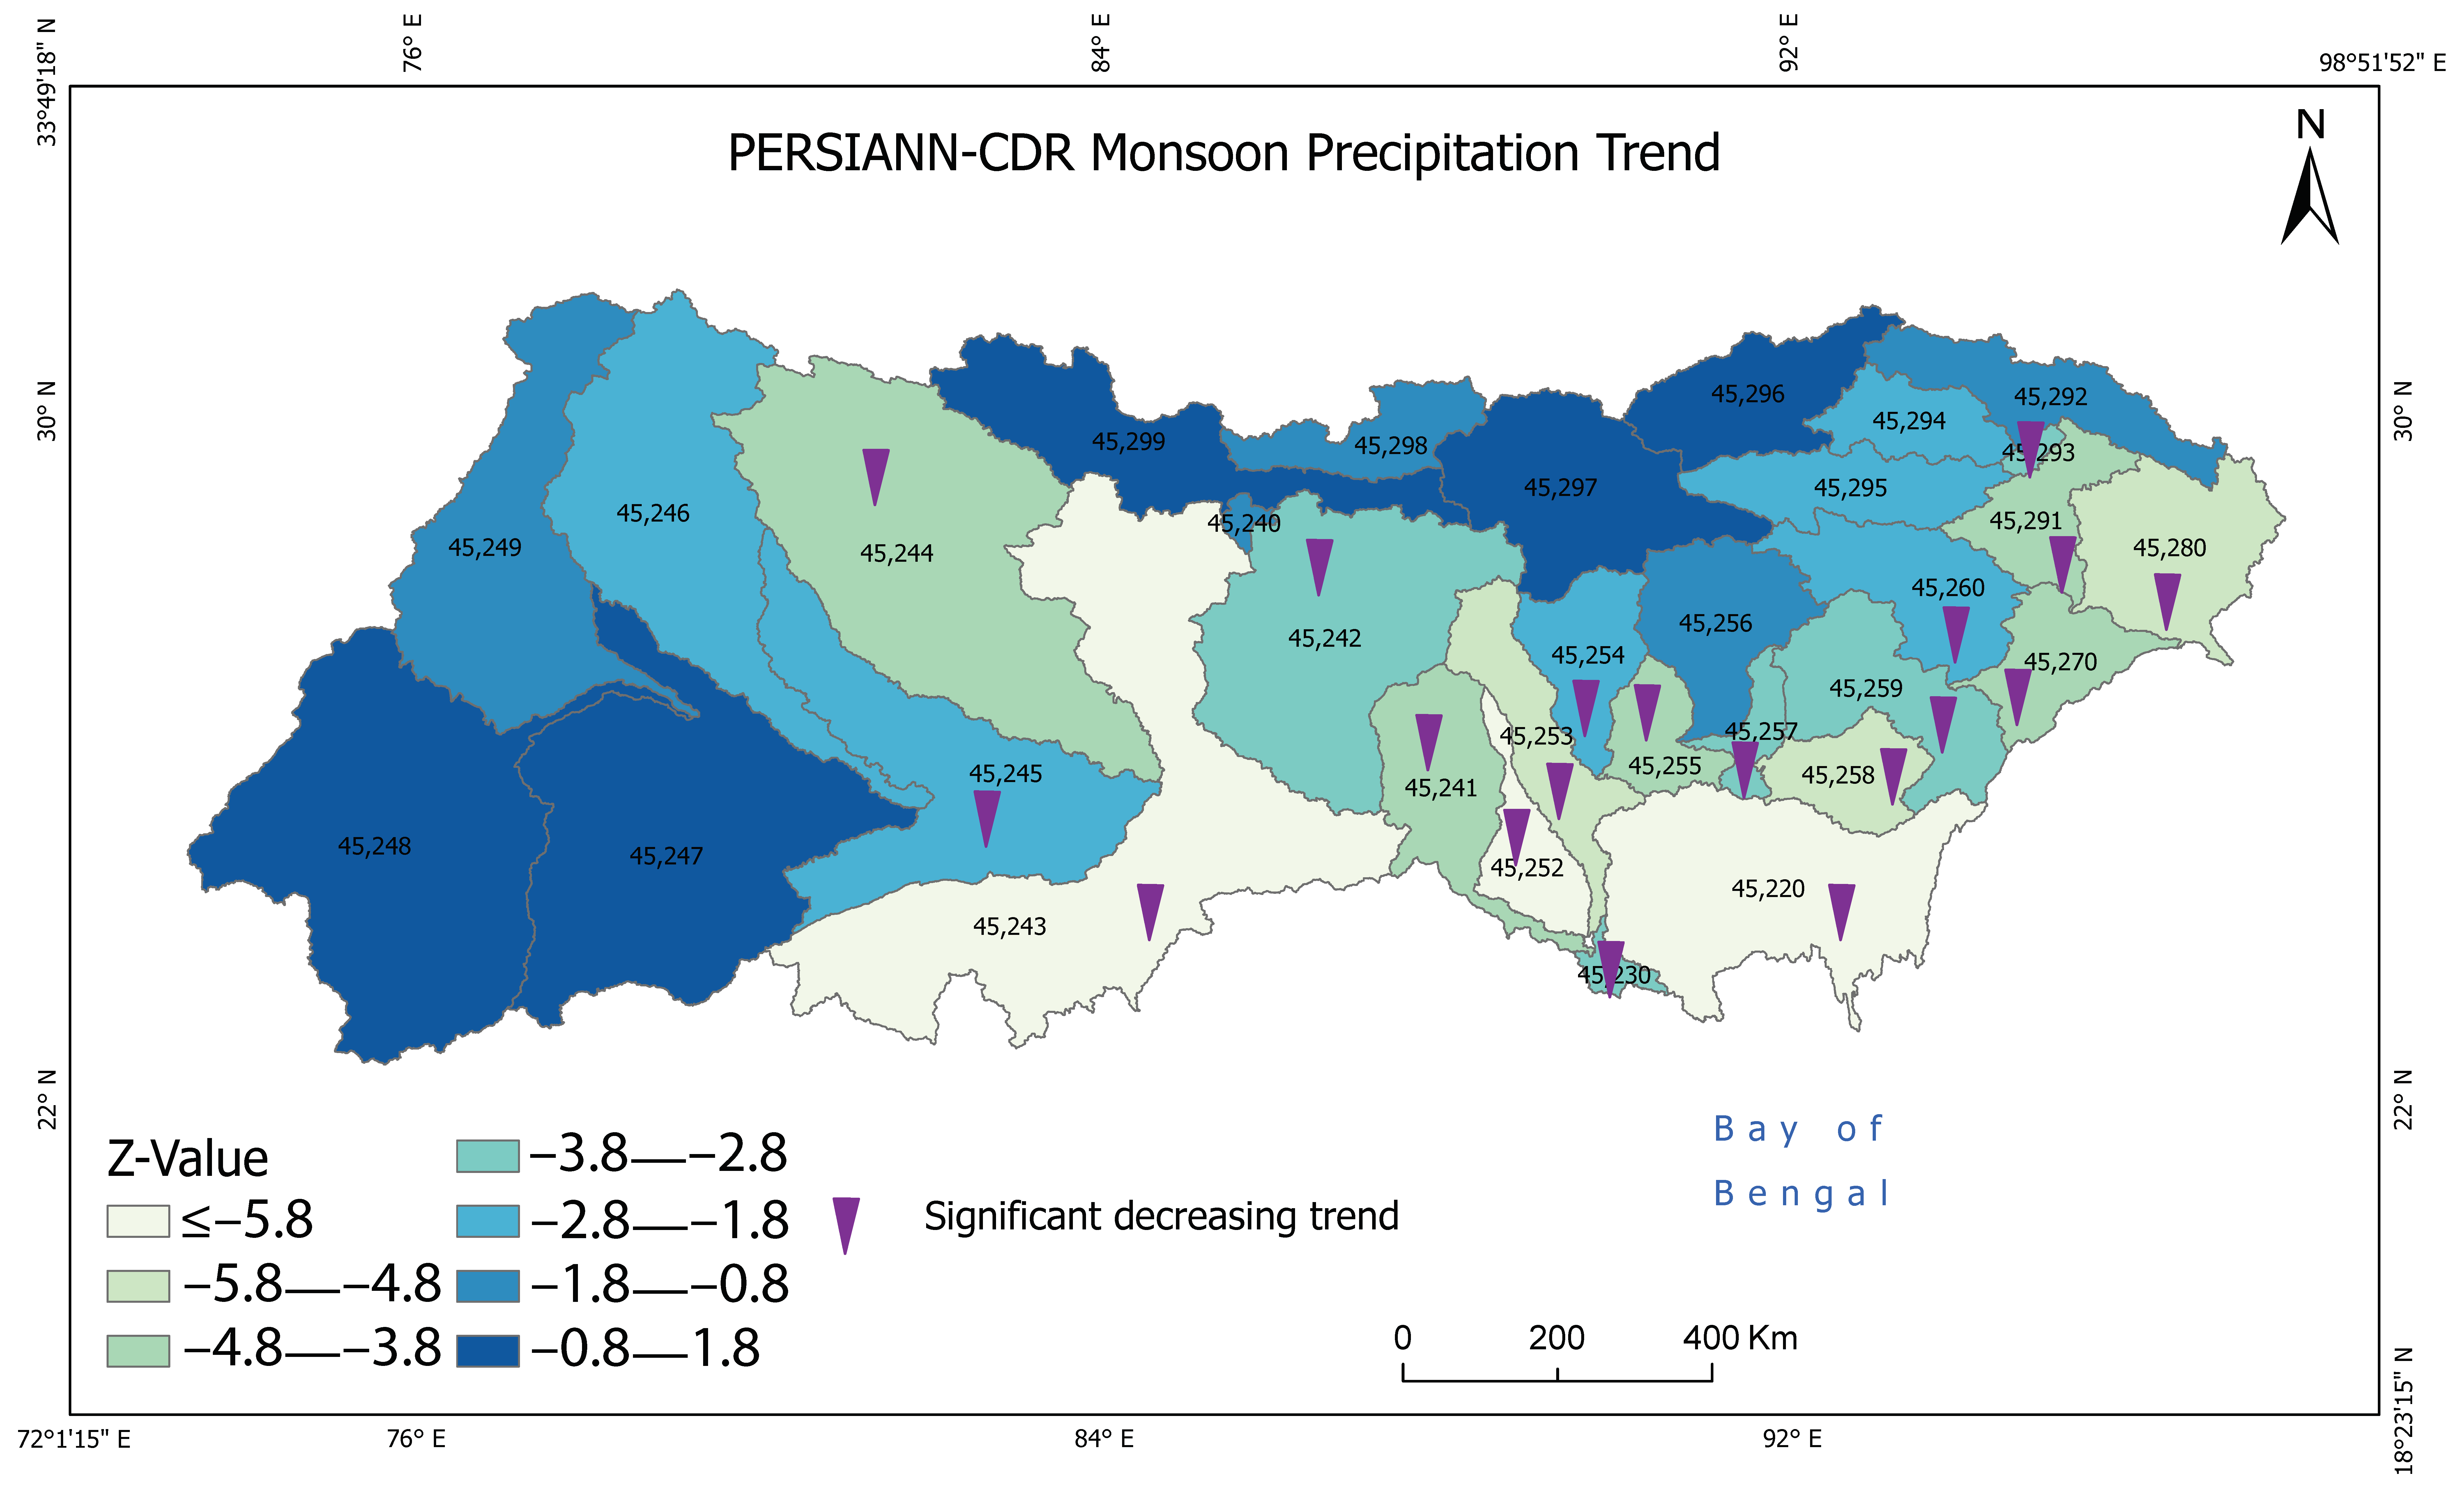
Regarding the monsoon season, eight sub-basins had a significant negative trend for monsoon precipitation in MSWEP (Figure 6a), whereas 19 sub-basins had a significant negative precipitation trend in the PERSIANN-CDR (Figure 6b). The eight MSWEP sub-basins with significant negative precipitation trends were found near Bangladesh and in the eastern region. Similarly, in PERSIANN-CDR, significant negative precipitation trends were mostly found near the southern, central, and eastern part of the GBM (Figure 6b). On the contrary, significant positive precipitation trends were detected in the three sub-basins situated in the upper Himalayas (45,299, 45,298, and 45,240) in MSWEP, whereas, in PERSIANN-CDR, those three sub-basins showed negative Z-values. Only three sub-basins, 45,296 (upper Himalayas), 45,247, and 45,248, situated in the western region, had positive Z-values in PERSIANN-CDR, though they were not significant.

4. Discussion

The pre-monsoon and monsoon precipitation trends were studied for the GBM and pre-defined hydrological sub-basins of the GBM for 1983–2019 using the non-parametric Modified Mann-Kendall test. This study compared two different satellite-based precipitation products, MSWEP and PERSIANN-CDR. While the two data sets were significantly correlated over the pre-monsoon and monsoon seasons, the precipitation trend analysis found differences in the GBM river basin. Different resolutions of the precipitation products likely play a significant role in the contrasting results between PERSIANN-CDR and MSWEP (see Table 1). MSWEP may detect rainfall that PERSIANN-CDR does not. Moreover, the precipitation estimation process is different in these two products. PERSIANN-CDR is developed from infrared and passive microwave observations, whereas MSWEP estimates precipitation using gauge, satellite, and reanalysis-based products. Small biases in rainfall estimates can lead to large differences in the GBM because of the vagaries of the Indian monsoon and the orographic effects of the Himalayan mountains [21]. Therefore, validation of these products is required. The significant increasing pre-monsoon precipitation trend identified by MSWEP and significant decreasing monsoon precipitation trend identified by PERSIANN-CDR are similar to [20], reflecting that seasonal precipitation has changed in the GBM river basin. However, precipitation trends vary with the length of record, and the results are not suitable to extrapolate into the future [61,62]. The sixth assessment report of the Intergovernmental Panel on Climate Change (IPCC) [63] and other investigators [22,23,24] have reported that monsoon precipitation decreased in South Asia, especially during the 1960s to 1980s, likely due to local cooling from human-caused aerosol emissions. However, future projections from CMIP 6 model runs [63] predict an increase in monsoon precipitation due to anthropogenic emissions of greenhouse gases [20]. The MSWEP precipitation trends are more consistent with this picture.
Very few sub-basins have similar trend results between the two satellite products for pre-monsoon and monsoon precipitation. Only four sub-basins show a significant increasing pre-monsoon precipitation trend for both MSWEP and PERSIANN-CDR. Thus, there is greater confidence that rainfall has increased in the central, far north, and western region of the GBM river basin (45,246, 45,249, 45,295, and 45,297). Sharma et al. [20] also found that pre-monsoon precipitation trend increased gradually in that same region of the GBM. Ahmed et al. [64] found a similar result in India consistent with the significant increasing pre-monsoon precipitation trend found in sub-basins 45,247 and 45,249. Similarly, the sub-basins 45,242, 45,243, and 45,244, which cover Nepal, had a significant increasing trend in pre-monsoon precipitation based on MSWEP. Karki et al. [65] also found pre-monsoon precipitation trend significantly increased from 1970–2012 in the lowlands and central hill area of Nepal using daily precipitation data from the Department of Hydrology and Meteorology (DHM), Nepal, and applying a Mann-Kendall test. Bhutan is covered mostly by two sub-basins: 45,254 and 45,256, and 45,254 shows significant increasing pre-monsoon precipitation trend based on MSWEP.
One sub-basin (45,280) in the far eastern region shows a significant decreasing pre-monsoon precipitation trend based on PERSIANN-CDR, and eight sub-basins show significant decreasing monsoon precipitation trends based on both products. The overall trends strongly indicate that precipitation has declined in the pre-monsoon and monsoon seasons in the eastern and southern regions of the GBM river basin. These regions include the Brahmaputra and Meghna river basins. According to Khandu et al. [21], Brahmaputra and Meghna basins’ precipitation declined up to 39 mm per decade in the monsoon season from 1998 to 2013. Sharma et al. [20] also suggest similar decreasing precipitation trend in pre-monsoon and monsoon seasons in this area. On the contrary, Ahmed et al. [64] found that Bangladesh monsoon precipitation increased by 3.04 mm/year and did not find any decreasing monsoon precipitation trend across Bangladesh from 1948 to 2012 using both parametric and non-parametric approaches. However, it should be noted that unlike Sharma et al. [20] and Ahmed et al. [64], our study area only covers the northern area of Bangladesh (Figure 1) and does not extend to the coast. Baidya et al. [66] found increasing daily extremes in precipitation and heavy precipitation events from 1961–2006 in Nepal. Similarly, MSWEP-based monsoon precipitation also has a significant increasing monsoon precipitation trend in the upper GBM, primarily in Tibet-China. The 0.1-degree grid resolution of MSWEP may help it to resolve precipitation processes in this highly mountainous region better than PERSIANN-CDR. Finally, it is interesting to note that the MSWEP trend in the Tibetan Plateau is consistent with the IPCC’s projected trend in monsoon precipitation, where by 2100, rainfall is expected to increase by 38–45% with a 2 °C increase in temperature.

5. Conclusions

The modified Mann-Kendall test was used to detect precipitation trends for the GBM basin as whole and pre-defined hydrological sub-basins within the GBM. The precipitation trend test result obtained from two satellite-based products was compared and results were conflicting. Pre-monsoon precipitation trend significantly increased according to MSWEP while monsoon precipitation trend significantly decreased according to PERSIANN-CDR for the period 1983–2019. However, the study found that pre-monsoon precipitation based on PERSIANN-CDR, and monsoon precipitation based on MSWEP, have no significant negative or positive trend for the GBM whole. A closer examination of sub-basins within the GBM showed regionality of these precipitation trends. Validation of these products with gauge data will help elucidate our results. Therefore, a study is in progress to compare these satellite-based precipitation products with rain gauge station data from Nepal. The findings of the present study will be helpful for managing water crises, agricultural production, and preparing for different natural hazards in the GBM river basin. A further detailed study is needed to identify the reasons behind decreasing and increasing precipitation trends in the GBM river basin.

Author Contributions

Conceptualization, M.K. and S.C.; methodology, M.K. and S.C.; software, M.K.; formal analysis, M.K. and S.C.; writing—original draft preparation, M.K.; writing—review and editing, S.C.; visualization, M.K.; supervision, S.C.; funding acquisition, S.C. All authors have read and agreed to the published version of the manuscript.

Funding

This research was funded by National Science Foundation (NSF), award number 1660447.

Institutional Review Board Statement

Not applicable.

Informed Consent Statement

Not applicable.

Data Availability Statement

PERSIANN-CDR precipitation data were retrieved from the Center for Hydrometeorology and Remote Sensing (CHRS) data portal website at https://chrsdata.eng.uci.edu/ (accessed on 10 March 2021), and MSWEP precipitation data were retrieved from the GloH2O website at http://www.gloh2o.org/mswep/ (accessed on 12 January 2021).

Conflicts of Interest

The authors declare no conflict of interest.

References

  1. Hamal, K.; Sharma, S.; Khadka, N.; Baniya, B.; Ali, M.; Shrestha, M.S.; Xu, T.; Shrestha, D.; Dawadi, B. Evaluation of MERRA-2 Precipitation Products Using Gauge Observation in Nepal. Hydrology 2020, 7, 40. [Google Scholar] [CrossRef]
  2. Sayemuzzaman, M.; Jha, M.K. Seasonal and annual precipitation time series trend analysis in North Carolina, United States. Atmospheric Res. 2014, 137, 183–194. [Google Scholar] [CrossRef]
  3. Stefanidis, S.; Stathis, D. Spatial and Temporal Rainfall Variability over the Mountainous Central Pindus (Greece). Climate 2018, 6, 75. [Google Scholar] [CrossRef] [Green Version]
  4. Mirza, M.Q.; Warrick, R.A.; Ericksen, N.J.; Kenny, G.J. Trends and persistence in precipitation in the Ganges, Brahmaputra and Meghna river basins. Hydrol. Sci. J. 1998, 43, 845–858. [Google Scholar] [CrossRef]
  5. Gc, R.K.; Ranganathan, S.; Tom Hammett, A.L.; Hall, R.P. What factors determine the technical performance of community-managed rural water systems in the middle hills of Nepal? J. Water Sanit. Hyg. Dev. 2021, 11, 222–230. [Google Scholar] [CrossRef]
  6. Shahid, S. Trends in extreme rainfall events of Bangladesh. Theor. Appl. Clim. 2010, 104, 489–499. [Google Scholar] [CrossRef]
  7. Karki, R.; Gurung, A. An Overview of Climate Change And Its Impact on Agriculture: A Review From Least Developing Country, Nepal. Int. J. Ecosyst. 2012, 2, 19–24. [Google Scholar] [CrossRef] [Green Version]
  8. Zaveri, E.; Grogan, D.S.; Fisher-Vanden, K.; Frolking, S.; Lammers, R.B.; Wrenn, D.H.; Prusevich, A.; Nicholas, R.E. Invisible water, visible impact: Groundwater use and Indian agriculture under climate change. Environ. Res. Lett. 2016, 11, 084005. [Google Scholar] [CrossRef] [Green Version]
  9. Kumar, P.V.; Naidu, C.V. Is Pre-monsoon Rainfall Activity Over India Increasing in the Recent Era of Global Warming? Pure Appl. Geophys. PAGEOPH 2020, 177, 4423–4442. [Google Scholar] [CrossRef]
  10. Alamgir, S. Characterization and Estimation of Rainfall in Bangladesh Based on Ground Radar and Satellite Observations; Université du Québec, Institut National de la Recherche Scientifique: Quebec City, QC, Canada, 2009. [Google Scholar]
  11. Rahman, R.; Lateh, H. Climate change in Bangladesh: A spatio-temporal analysis and simulation of recent temperature and rainfall data using GIS and time series analysis model. Theor. Appl. Clim. 2015, 128, 27–41. [Google Scholar] [CrossRef]
  12. Hussain, Y.; Satge, F.; Hussain, M.B.; Martinez-Carvajal, H.; Bonnet, M.-P.; Soto, M.C.; Roig, H.; Akhter, G. Performance of CMORPH, TMPA, and PERSIANN rainfall datasets over plain, mountainous, and glacial regions of Pakistan. Theor. Appl. Clim. 2017, 131, 1119–1132. [Google Scholar] [CrossRef]
  13. Bisht, D.S.; Chatterjee, C.; Raghuwanshi, N.S.; Sridhar, V. Spatio-temporal trends of rainfall across Indian river basins. Theor. Appl. Clim. 2018, 132, 419–436. [Google Scholar] [CrossRef]
  14. Mosaffa, H.; Sadeghi, M.; Hayatbini, N.; Gorooh, V.A.; Asanjan, A.A.; Nguyen, P.; Sorooshian, S. Spatiotemporal Variations of Precipitation over Iran Using the High-Resolution and Nearly Four Decades Satellite-Based PERSIANN-CDR Dataset. Remote. Sens. 2020, 12, 1584. [Google Scholar] [CrossRef]
  15. Longobardi, A.; Buttafuoco, G.; Caloiero, T.; Coscarelli, R. Spatial and temporal distribution of precipitation in a Mediterranean area (southern Italy). Environ. Earth Sci. 2016, 75, 1–20. [Google Scholar] [CrossRef]
  16. Zhang, K.; Kimball, J.S.; Mu, Q.; Jones, L.A.; Goetz, S.; Running, S.W. Satellite based analysis of northern ET trends and associated changes in the regional water balance from 1983 to 2005. J. Hydrol. 2009, 379, 92–110. [Google Scholar] [CrossRef]
  17. Karpouzos, K.D.; Kavalieratou, S.; Babajimopoulos, C. Trend analysis of Precipitation Data in Pieria Region (Greece). Eur. Water 2010, 30, 31–40. [Google Scholar]
  18. Gajbhiye, S.; Meshram, C.; Singh, S.K.; Srivastava, P.K.; Islam, T. Precipitation trend analysis of Sindh River basin, India, from 102-year record (1901–2002). Atmospheric Sci. Lett. 2016, 17, 71–77. [Google Scholar] [CrossRef]
  19. Ahmad, I.; Tang, D.; Wang, T.; Wang, M.; Wagan, B. Precipitation Trends over Time Using Mann-Kendall and Spearman’s rho Tests in Swat River Basin, Pakistan. Adv. Meteorol. 2015, 2015, 431860. [Google Scholar] [CrossRef] [Green Version]
  20. Sharma, C.; Shukla, A.K.; Zhang, Y. Climate change detection and attribution in the Ganga-Brahmaputra-Meghna river basins. Geosci. Front. 2021, 12, 101186. [Google Scholar] [CrossRef]
  21. Khandu; Awange, J.L.; Kuhn, M.; Anyah, R.; Forootan, E. Changes and variability of precipitation and temperature in the Ganges-Brahmaputra-Meghna River Basin based on global high-resolution reanalyses. Int. J. Clim. 2017, 37, 2141–2159. [Google Scholar] [CrossRef]
  22. Kothyari, U.C.; Singh, V.P.; Aravamuthan, V. An Investigation of Changes in Rainfall and Temperature Regimes of the Ganga Basin in India. Water Resour. Manag. 1997, 11, 17–34. [Google Scholar] [CrossRef]
  23. Immerzeel, W. Historical trends and future predictions of climate variability in the Brahmaputra basin. Int. J. Clim. 2008, 28, 243–254. [Google Scholar] [CrossRef]
  24. Janes, T.; McGrath, F.; Macadam, I.; Jones, R. High-resolution climate projections for South Asia to inform climate impacts and adaptation studies in the Ganges-Brahmaputra-Meghna and Mahanadi deltas. Sci. Total. Environ. 2019, 650, 1499–1520. [Google Scholar] [CrossRef]
  25. Ghalhari, G.A.F.; Roudbari, A.A.D.; Asadi, M. Identifying the spatial and temporal distribution characteristics of precipitation in Iran. Arab. J. Geosci. 2016, 9, 595. [Google Scholar] [CrossRef]
  26. Júnior, S.F.A.X.; Jale, J.D.S.; Stosic, T.; Dos Santos, C.A.C.; Singh, V.P. Precipitation trends analysis by Mann-Kendall test: A case study of Paraíba, Brazil. Rev. Bras. Meteorol. 2020, 35, 187–196. [Google Scholar] [CrossRef]
  27. Hu, Q.; He, X.; Lu, X.-A.; Zhang, X. Trend Analysis of Seasonal Precipitation (1960–2013) in Subregions of Hunan Province, Central South China Using Discrete Wavelet Transforms. J. Appl. Meteorol. Clim. 2019, 58, 2159–2175. [Google Scholar] [CrossRef]
  28. Mann, H.B. Nonparametric tests against trend. Econometrica 1945, 13, 245–259. [Google Scholar] [CrossRef]
  29. Kendall, M.G. Rank Correlation Methods, 4th ed.; Griffin: London, UK, 1975. [Google Scholar]
  30. Hamed, K.H.; Rao, A.R. A modified Mann-Kendall trend test for autocorrelated data. J. Hydrol. 1998, 204, 182–196. [Google Scholar] [CrossRef]
  31. Tan, M.L.; Gassman, P.W.; Cracknell, A.P. Assessment of Three Long-Term Gridded Climate Products for Hydro-Climatic Simulations in Tropical River Basins. Water 2017, 9, 229. [Google Scholar] [CrossRef] [Green Version]
  32. Zhang, T.; He, Y.; Ma, J.; Pang, J. Spatial and temporal distribution of precipitation based on corrected TRMM data around the Hexi Corridor, China. Sci. Cold Arid. Reg. 2014, 6, 0159–0167. [Google Scholar]
  33. Beck, H.E.; Vergopolan, N.; Pan, M.; Levizzani, V.; van Dijk, A.I.J.M.; Weedon, G.P.; Brocca, L.; Pappenberger, F.; Huffman, G.J.; Wood, E.F. Global-scale evaluation of 22 precipitation datasets using gauge observations and hydrological modeling. Hydrol. Earth Syst. Sci. 2017, 21, 6201–6217. [Google Scholar] [CrossRef] [Green Version]
  34. Beck, H.E.; Wood, E.F.; Pan, M.; Fisher, C.K.; Miralles, D.G.; van Dijk, A.; McVicar, T.R.; Adler, R.F. MSWEP V2 Global 3-Hourly 0.1° Precipitation: Methodology and Quantitative Assessment. Bull. Am. Meteorol. Soc. 2019, 100, 473–500. [Google Scholar] [CrossRef] [Green Version]
  35. Ashouri, H.; Hsu, K.-L.; Sorooshian, S.; Braithwaite, D.K.; Knapp, K.; Cecil, L.D.; Nelson, B.R.; Prat, O. PERSIANN-CDR: Daily Precipitation Climate Data Record from Multisatellite Observations for Hydrological and Climate Studies. Bull. Am. Meteorol. Soc. 2015, 96, 69–83. [Google Scholar] [CrossRef] [Green Version]
  36. Guo, H.; Chen, S.; Bao, A.; Hu, J.; Gebregiorgis, A.S.; Xue, X.; Zhang, X. Inter-Comparison of High-Resolution Satellite Precipitation Products over Central Asia. Remote. Sens. 2015, 7, 7181–7211. [Google Scholar] [CrossRef] [Green Version]
  37. Hou, A.Y.; Kakar, R.K.; Neeck, S.; Azarbarzin, A.A.; Kummerow, C.D.; Kojima, M.; Oki, R.; Nakamura, K.; Iguchi, T. The global precipitation measurement mission. Bull. Am. Meteorol. Soc. 2014, 95, 701–722. [Google Scholar] [CrossRef]
  38. Curtis, S.; Crawford, T.; Rahman, M.; Paul, B.; Miah, M.G.; Islam, M.R.; Patel, M. A Hydroclimatological Analysis of Precipitation in the Ganges–Brahmaputra–Meghna River Basin. Water 2018, 10, 1359. [Google Scholar] [CrossRef] [Green Version]
  39. Hamza, A.; Anjum, M.; Cheema, M.M.; Chen, X.; Afzal, A.; Azam, M.; Shafi, M.K.; Gulakhmadov, A. Assessment of IMERG-V06, TRMM-3B42V7, SM2RAIN-ASCAT, and PERSIANN-CDR Precipitation Products over the Hindu Kush Mountains of Pakistan, South Asia. Remote. Sens. 2020, 12, 3871. [Google Scholar] [CrossRef]
  40. Santos, C.A.G.; Neto, R.M.B.; Nascimento, T.V.M.D.; da Silva, R.M.; Mishra, M.; Frade, T.G. Geospatial drought severity analysis based on PERSIANN-CDR-estimated rainfall data for Odisha state in India (1983–2018). Sci. Total. Environ. 2021, 750, 141258. [Google Scholar] [CrossRef]
  41. Alijanian, M.; Rakhshandehroo, G.R.; Mishra, A.; Dehghani, M. Evaluation of remotely sensed precipitation estimates using PERSIANN-CDR and MSWEP for spatio-temporal drought assessment over Iran. J. Hydrol. 2019, 579, 124189. [Google Scholar] [CrossRef]
  42. Zhao, Y.; Wu, J.; He, C.; Ding, G. Linking wind erosion to ecosystem services in drylands: A landscape ecological approach. Landsc. Ecol. 2017, 32, 2399–2417. [Google Scholar] [CrossRef]
  43. Chowdhury, R.; Ward, N. Hydro-meteorological variability in the greater Ganges-Brahmaputra-Meghna basins. Int. J. Clim. 2004, 24, 1495–1508. [Google Scholar] [CrossRef]
  44. FAO. Transboundary River Basins Overview-Ganges-Brahmaputra—Meghna River Basin; FAO: Rome, Italy, 2011. [Google Scholar]
  45. Islam, A.S.; Haque, A.; Bala, S.K. Hydrologic characteristics of floods in Ganges–Brahmaputra–Meghna (GBM) delta. Nat. Hazards 2010, 54, 797–811. [Google Scholar] [CrossRef]
  46. Mirza, M.M.Q. Climate change, flooding in South Asia and implications. Reg. Environ. Chang. 2010, 11, 95–107. [Google Scholar] [CrossRef]
  47. Huffman, G.J.; Bolvin, D.T.; Nelkin, E.J.; Wolff, D.B.; Adler, R.F.; Gu, G.; Hong, Y.; Bowman, K.P.; Stocker, E.F. The TRMM Multisatellite Precipitation Analysis (TMPA): Quasi-Global, Multiyear, Combined-Sensor Precipitation Estimates at Fine Scales. J. Hydrometeorol. 2007, 8, 38–55. [Google Scholar] [CrossRef]
  48. Joyce, R.J.; Janowiak, J.E.; Arkin, P.A.; Xie, P. CMORPH: A method that produces global precipitation estimates from passive microwave and infrared data at high spatial and temporal resolution. J. Hydrometeorol. 2004, 5, 487–503. [Google Scholar] [CrossRef]
  49. Sorooshian, S.; Hsu, K.-L.; Gao, X.; Gupta, H.; Imam, B.; Braithwaite, D. Evaluation of Persiann System Satellite–Based Estimates of Tropical Rainfall. Bull. Am. Meteorol. Soc. 2000, 81, 2035–2046. [Google Scholar] [CrossRef] [Green Version]
  50. Huffman, G.J.; Bolvin, D.T.; Nelkin, E.J.; Tan, J. Integrated Multi-satellitE Retrievals for GPM (IMERG) technical documentation. NASA/GSFC Code 2015, 612, 2019. [Google Scholar]
  51. Nair, A.S.; Indu, J. Performance Assessment of Multi-Source Weighted-Ensemble Precipitation (MSWEP) Product over India. Clim. 2017, 5, 2. [Google Scholar] [CrossRef]
  52. Prakash, S. Performance assessment of CHIRPS, MSWEP, SM2RAIN-CCI, and TMPA precipitation products across India. J. Hydrol. 2019, 571, 50–59. [Google Scholar] [CrossRef]
  53. Khatiwada, M.; Curtis, S. Understanding the Relationship Between Pre-monsoon and Monsoon Precipitation Patterns in the GBM Sub-basins. In Proceedings of the 45th NOAA Climate Diagnostics and Prediction Workshop, Virtual Online, College Park, MD, USA, 20–22 October 2020; p. 109. [Google Scholar] [CrossRef]
  54. Katiraie-Boroujerdy, P.-S.; Asanjan, A.A.; Hsu, K.-L.; Sorooshian, S. Intercomparison of PERSIANN-CDR and TRMM-3B42V7 precipitation estimates at monthly and daily time scales. Atmospheric Res. 2017, 193, 36–49. [Google Scholar] [CrossRef] [Green Version]
  55. Nguyen, P.; Ombadi, M.; Sorooshian, S.; Hsu, K.; AghaKouchak, A.; Braithwaite, D.; Ashouri, H.; Thorstensen, A.R. The Persiann family of global satellite precipitation data: A review and evaluation of products. Hydrol. Earth Syst. Sci. 2018, 22, 5801–5816. [Google Scholar] [CrossRef] [Green Version]
  56. Beck, H.E.; van Dijk, A.I.J.M.; Levizzani, V.; Schellekens, J.; Miralles, D.G.; Martens, B.; de Roo, A. MSWEP: 3-hourly 0.25° global gridded precipitation (1979–2015) by merging gauge, satellite, and reanalysis data. Hydrol. Earth Syst. Sci. 2017, 21, 589–615. [Google Scholar] [CrossRef] [Green Version]
  57. Awange, J.; Hu, K.; Khaki, M. The newly merged satellite remotely sensed, gauge and reanalysis-based Multi-Source Weighted-Ensemble Precipitation: Evaluation over Australia and Africa (1981–2016). Sci. Total. Environ. 2019, 670, 448–465. [Google Scholar] [CrossRef]
  58. Lehner, B.; Grill, G. Global river hydrography and network routing: Baseline data and new approaches to study the world’s large river systems. Hydrol. Process. 2013, 27, 2171–2186. [Google Scholar] [CrossRef]
  59. Pfafstetter, O. Classification of hydrographic basins: Coding methodology. Dep. Nac. Obras Saneam. 1989, unpublished manuscript. [Google Scholar]
  60. Mondal, A.; Kundu, S.; Mukhopadhyay, A. Rainfall trend analysis by Mann-Kendall test: A case study of North-Eastern part of Cuttack district, Orissa. Int. J. Geol. Earth Environ. Sci. 2012, 2, 70–78. [Google Scholar]
  61. Blöschl, G.; Hall, J.; Viglione, A.; Perdigão, R.A.P.; Parajka, J.; Merz, B.; Lun, D.; Arheimer, B.; Aronica, G.T.; Bilibashi, A.; et al. Changing climate both increases and decreases European river floods. Nature 2019, 573, 108–111. [Google Scholar] [CrossRef]
  62. De Luca, D.L.; Petroselli, A.; Galasso, L. A Transient Stochastic Rainfall Generator for Climate Changes Analysis at Hydrological Scales in Central Italy. Atmosphere 2020, 11, 1292. [Google Scholar] [CrossRef]
  63. Douville, H.; Raghavan, K.; Renwick, J.; Allan, R.P.; Arias, P.A.; Barlow, M.; Cerezo-Mota, R.; Cherchi, A.; Gan, T.Y.; Gergis, J.; et al. Water Cycle Changes. In Climate Change 2021: The Physical Science Basis. Contribution of Working Group I to the Sixth Assessment Report of the Intergovernmental Panel on Climate Change; Masson-Delmotte, V., Zhai, P., Pirani, A., Connors, S.L., Péan, C., Berger, S., Caud, N., Chen, Y., Goldfarb, L., Gomis, M.I., et al., Eds.; Cambridge University Press: Cambridge, UK, 2021; in press. [Google Scholar]
  64. Ahmed, K.; Alam, M.S.; Yousuf, A.H.M.; Islam, M. A long-term trend in precipitation of different spatial regions of Bangladesh and its teleconnections with El Niño/Southern Oscillation and Indian Ocean Dipole. Theor. Appl. Clim. 2017, 129, 473–486. [Google Scholar] [CrossRef]
  65. Karki, R.; Hasson, S.U.; Schickhoff, U.; Scholten, T.; Böhner, J. Rising Precipitation Extremes across Nepal. Climate 2017, 5, 4. [Google Scholar] [CrossRef] [Green Version]
  66. Baidya, S.K.; Shrestha, M.L.; Sheikh, M.M. Trends in daily climatic extremes of Temperature and Precipitation in Nepal. J. Hydrol. Meteorol. 2008, 5, 38–51. [Google Scholar]
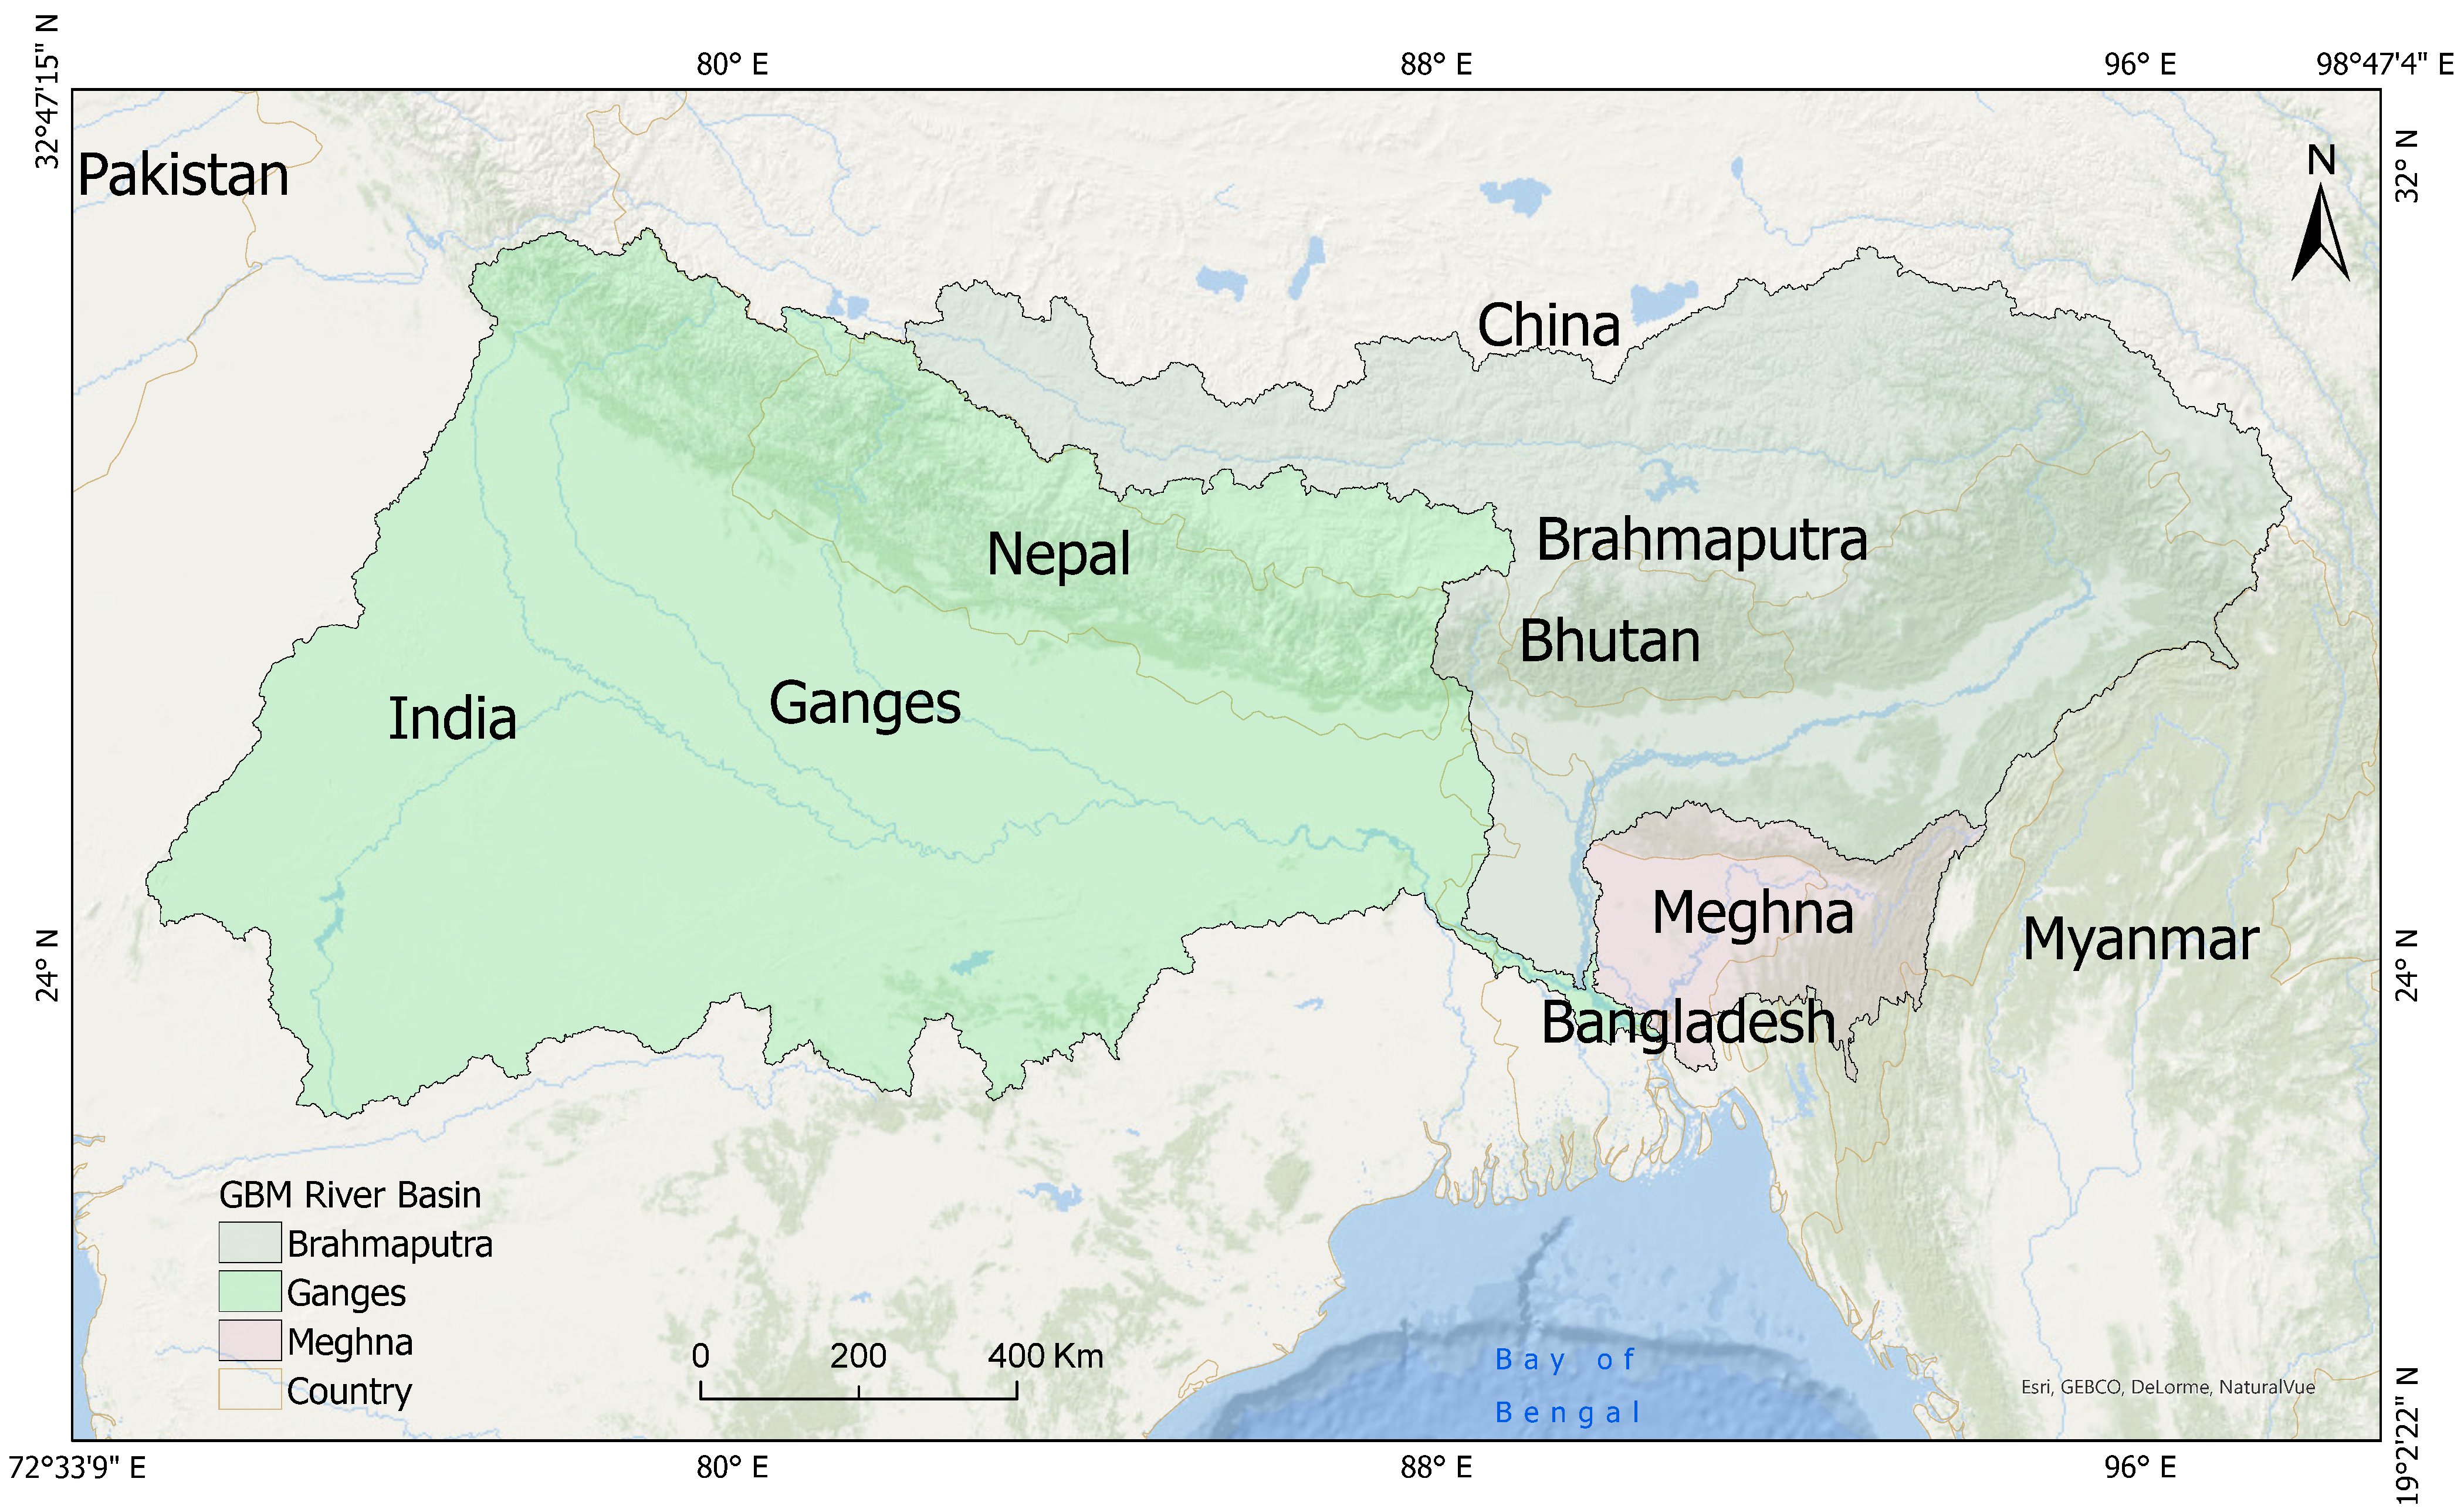
Figure 1. (a) Study area map of the GBM river basin; (b) Digital Elevation Model of the GBM river basin.
Atmosphere 12 01155 g001aAtmosphere 12 01155 g001b
Figure 2. Hydrological sub-basins’ boundaries of the Pfafstetter level-05 of GBM. Numbers are the Pfafstetter identification codes. Country boundaries are the red lines.
Atmosphere 12 01155 g002
Figure 3. Flow chart of the methodology demonstrating the steps used in this work.
Atmosphere 12 01155 g003
Figure 4. (a) MSWEP pre-monsoon precipitation trend; (b) MSWEP monsoon precipitation trend; (c) PERSIANN-CDR pre-monsoon precipitation trend; (d) PERSIANN-CDR monsoon precipitation trend. The red dotted line indicates the linear regression.
Atmosphere 12 01155 g004
Figure 5. Pre-monsoon precipitation trend for (a) MSWEP and (b) PERSIANN-CDR. Red color upright triangle indicates a significant increasing trend (p < 0.05), and a purple color downright triangle indicates significant decreasing trend.
Atmosphere 12 01155 g005aAtmosphere 12 01155 g005b
Figure 6. Monsoon precipitation trend for (a) MSWEP and (b) PERSIANN-CDR. Red color upright triangle indicates a significant increasing trend (p < 0.05), and a purple color downright triangle indicates significant decreasing trend.
Atmosphere 12 01155 g006aAtmosphere 12 01155 g006b
Table 1. Summary of satellite-based precipitation product used in this work.
Satellite-Based Precipitation ProductSpatial
Resolution
Temporal
Resolution
Spatial
Coverage
Data
Availability
No. of Grid Boxes Covered by GBMReferences
MSWEP0.1°3 hFully global1979–Present14,401Beck et al. [34]
PERSIANN-CDR0.25°3 h60° S–60° N
globally
1983–Present2309Ashouri et al. [35]
Table 2. p- and Z-value of pre-monsoon and monsoon precipitation trends using Modified Mann-Kendall for the GBM river basin during 1983–2019.
Satellite-BasedPre-Monsoon Monsoon
Precipitation ProductZ-Valuep-ValueZ-Valuep-Value
MSWEP2.2360.025−0.5540.579
PERSIANN-CDR−0.5360.592−33.071<0.000
Publisher’s Note: MDPI stays neutral with regard to jurisdictional claims in published maps and institutional affiliations.