
Advances of Local Climate Zone Mapping and Its Practice Using Object-Based Image Analysis


Abstract
:1. Introduction
2. Overview of LCZ Mapping
3. LCZ Mapping Based on Remote-Sensing Technology
3.1. Mapping Unit and Scale
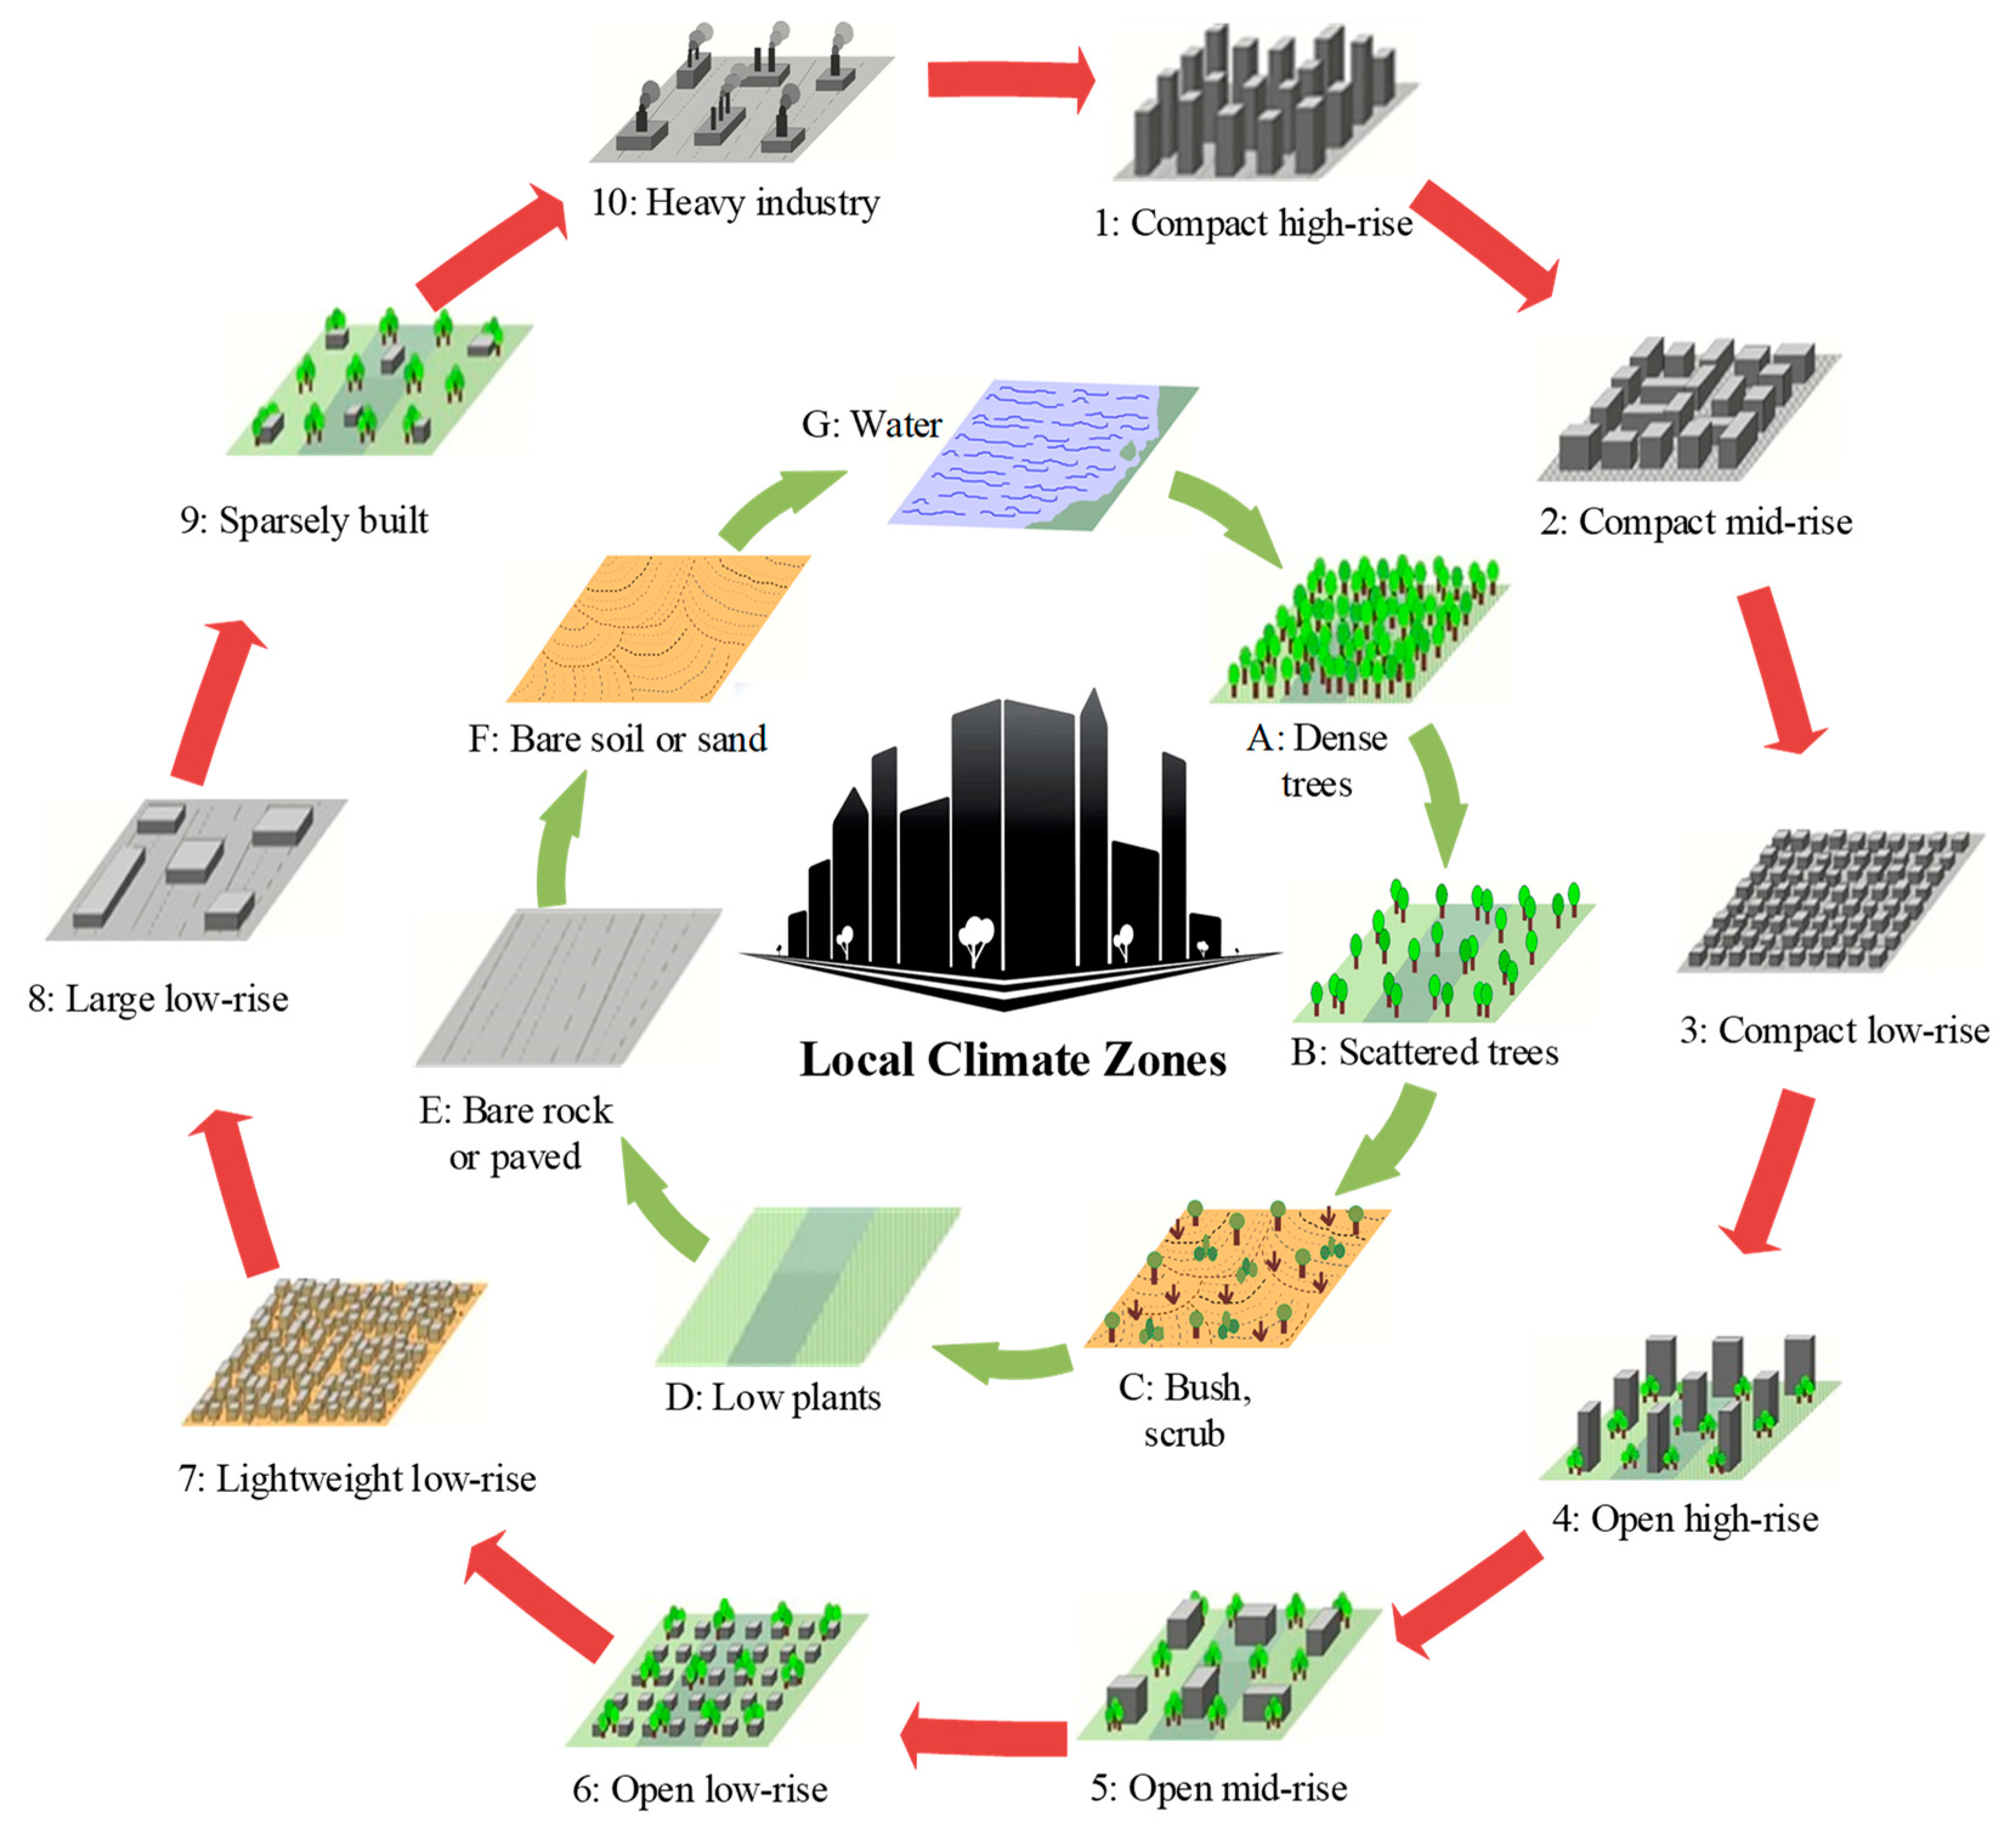
3.1.1. Mapping Units in LCZ Classification
3.1.2. Importance of Fine-Scale LCZ Mapping
3.1.3. Limitations of the Regular Mapping Unit
3.2. Transferability
3.2.1. Lack of an Efficient Transferring Mode
3.2.2. Lack of a Benchmark Dataset
3.3. Limitations of LCZ Classification
3.3.1. Low Accuracy and Valid Measures
3.3.2. Classification Schemes
3.4. The Issue of Describing 3-D Urban Structures
4. Applications and Challenges of LCZ Mapping Using OBIA
5. Discussion and Conclusions
Author Contributions
Funding
Institutional Review Board Statement
Informed Consent Statement
Data Availability Statement
Acknowledgments
Conflicts of Interest
References
- UN (United Nations). World Urbanization Prospects: The 2018 Revision, Methodology; New York Working Paper No. ESA/P/WP.252; United Nations: Herndon, VA, USA, 2018. [Google Scholar]
- The Intergovernmental Panel on Climate Change (IPCC). Climate Change 2014—Working Group II Contribution to the Fifth Assessment Report of the Intergovernmental Panel on Climate Change; Cambridge University Press: Cambridge, UK; New York, NY, USA, 2014. [Google Scholar]
- Zhan, W.; Chen, Y.; Zhou, J.; Wang, J.; Liu, W.; Voogt, J.; Zhu, X.; Quan, J.; Li, J. Disaggregation of remotely sensed land surface temperature: Literature survey, taxonomy, issues, and caveats. Remote Sens. Environ. 2013, 131, 119–139. [Google Scholar] [CrossRef]
- Weng, Q. Remote sensing of impervious surfaces in the urban areas: Requirements, methods, and trends. Remote Sens. Environ. 2012, 117, 34–49. [Google Scholar] [CrossRef]
- Liu, X.; Hu, G.; Chen, Y.; Li, X.; Xu, X.; Li, S.; Pei, F.; Wang, S. High-resolution multi-temporal mapping of global urban land using Landsat images based on the Google Earth Engine Platform. Remote Sens. Environ. 2018, 209, 227–239. [Google Scholar] [CrossRef]
- Gong, P.; Li, X.; Zhang, W. 40-Year (1978–2017) human settlement changes in China reflected by impervious surfaces from satellite remote sensing. Sci. Bull. 2019, 64, 756–763. [Google Scholar] [CrossRef] [Green Version]
- Stewart, I.D.; Oke, T.R. Local climate zones for urban temperature studies. Bull. Am. Meteorol. Soc. 2012, 93, 1879–1900. [Google Scholar] [CrossRef]
- Alexander, P.; Fealy, R.; Mills, G. Simulating the impact of urban development pathways on the local climate: A scenario-based analysis in the greater Dublin region, Ireland. Landsc. Urban. Plan. 2016, 152, 72–89. [Google Scholar] [CrossRef] [Green Version]
- Du, P.; Chen, J.; Bai, X.; Han, W. Understanding the seasonal variations of land surface temperature in Nanjing urban area based on local climate zone. Urban. Clim. 2020, 33, 100657. [Google Scholar] [CrossRef]
- Taubenböck, H.; Debray, H.; Qiu, C.; Schmitt, M.; Wang, Y.; Zhu, X. Seven city types representing morphologic configurations of cities across the globe. Cities 2020, 105, 102814. [Google Scholar] [CrossRef]
- Hu, J.; Wang, Y.; Taubenböck, H.; Zhu, X.X. Land consumption in cities: A comparative study across the globe. Cities 2021, 113, 103163. [Google Scholar] [CrossRef]
- Verdonck, M.-L.; Okujeni, A.; van der Linden, S.; Demuzere, M.; De Wulf, R.; Van Coillie, F. Influence of neighbourhood information on ‘Local Climate Zone’ mapping in heterogeneous cities. Int. J. Appl. Earth Obs. Geoinf. 2017, 62, 102–113. [Google Scholar] [CrossRef]
- Yoo, C.; Lee, Y.; Cho, D.; Im, J.; Han, D. Improving local climate zone classification using incomplete building data and Sentinel 2 images based on convolutional neural networks. Remote Sens. 2020, 12, 3552. [Google Scholar] [CrossRef]
- Bechtel, B.; See, L.; Mills, G.; Foley, M. Classification of local climate zones using SAR and multispectral data in an arid environment. IEEE J. Sel. Top. Appl. Earth Obs. Remote Sens. 2016, 9, 3097–3105. [Google Scholar] [CrossRef]
- Qiu, C.; Mou, L.; Schmitt, M.; Zhu, X.X. Local climate zone-based urban land cover classification from multi-seasonal Sentinel-2 images with a recurrent residual network. ISPRS J. Photogramm. Remote Sens. 2019, 154, 151–162. [Google Scholar] [CrossRef] [PubMed]
- Qiu, C.; Liebel, L.; Hughes, L.H.; Schmitt, M.; Korner, M.; Zhu, X.X. Multitask learning for human settlement extent regression and local climate zone classification. IEEE Geosci. Remote Sens. Lett. 2020, 1–5. [Google Scholar] [CrossRef]
- Bechtel, B.; Alexander, P.J.; Böhner, J.; Ching, J.; Conrad, O.; Feddema, J.; Mills, G.; See, L.; Stewart, I. Mapping local climate zones for a worldwide database of the form and function of cities. ISPRS Int. J. Geo-Inf. 2015, 4, 199–219. [Google Scholar] [CrossRef] [Green Version]
- Bechtel, B.; Alexander, P.J.; Beck, C.; Böhner, J.; Brousse, O.; Ching, J.; Demuzere, M.; Fonte, C.; Gál, T.; Hidalgo, J.; et al. Generating WUDAPT level 0 data—Current status of production and evaluation. Urban. Clim. 2018, 27, 24–45. [Google Scholar] [CrossRef] [Green Version]
- Stewart, I.D.; Oke, T.R.; Krayenhoff, E.S. Evaluation of the ‘local climate zone’ scheme using temperature observations and model simulations. Int. J. Clim. 2013, 34, 1062–1080. [Google Scholar] [CrossRef]
- Geletič, J.; Lehnert, M.; Dobrovolný, P. Land surface temperature differences within local climate zones, based on two Central European cities. Remote Sens. 2016, 8, 788. [Google Scholar] [CrossRef] [Green Version]
- Nassar, A.K.; Blackburn, G.A.; Whyatt, J.D. Dynamics and controls of urban heat sink and island phenomena in a desert ciy: Devel-opment of a local climate zone scheme using remotely-sensed inputs. Int. J. Appl. Earth Obs. Geoinform. 2016, 51, 76–90. [Google Scholar] [CrossRef] [Green Version]
- Perera, N.; Emmanuel, R.A. A “local climate zone” based approach to urban planning in Colombo, Sri Lanka. Urban. Clim. 2018, 23, 188–203. [Google Scholar] [CrossRef] [Green Version]
- Ren, C.; Cai, M.; Li, X.; Zhang, L.; Wang, R.; Xu, Y.; Ng, E.Y.Y. Assessment of local climate zone classification maps of cities in China and feasible refinements. Sci. Rep. 2019, 9, 1–11. [Google Scholar] [CrossRef] [PubMed] [Green Version]
- Bechtel, B.; Daneke, C. Classification of local climate zones based on multiple Earth observation data. IEEE J. Sel. Top. Appl. Earth Obs. Remote Sens. 2012, 5, 1191–1202. [Google Scholar] [CrossRef]
- Rosentreter, J.; Hagensieker, R.; Waske, B. Towards large-scale mapping of local climate zones using multitemporal Sentinel 2 data and convolutional neural networks. Remote Sens. Environ. 2019, 237, 111472. [Google Scholar] [CrossRef]
- Yokoya, N.; Ghamisi, P.; Xia, J.; Sukhanov, S.; Heremans, R.; Tankoyeu, I.; Bechtel, B.; Le Saux, B.; Moser, G.; Tuia, D. Open data for global multimodal land use classification: Outcome of the 2017 IEEE GRSS data fusion contest. IEEE J. Sel. Top. Appl. Earth Obs. Remote Sens. 2018, 11, 1363–1377. [Google Scholar] [CrossRef] [Green Version]
- Geletič, J.; Lehnert, M. GIS-based delineation of local climate zones: The case of medium-sized Central European cities. Morav. Geogr. Rep. 2016, 24, 2–12. [Google Scholar] [CrossRef] [Green Version]
- Zheng, Y.; Ren, C.; Xu, Y.; Wang, R.; Ho, J.; Lau, K.; Ng, E. GIS-based mapping of Local Climate Zone in the high-density city of Hong Kong. Urban. Clim. 2018, 24, 419–448. [Google Scholar] [CrossRef]
- Geletič, J.; Lehnert, M.; Savić, S.; Milošević, D. Inter-/intra-zonal seasonal variability of the surface urban heat island based on local climate zones in three central European cities. Build. Environ. 2019, 156, 21–32. [Google Scholar] [CrossRef]
- Demuzere, M.; Bechtel, B.; Middel, A.; Mills, G. Mapping Europe into local climate zones. PLoS ONE 2019, 14, e0214474. [Google Scholar] [CrossRef] [Green Version]
- Zhu, X.X.; Hu, J.; Qiu, C.; Shi, Y.; Kang, J.; Mou, L.; Bagheri, H.; Haberle, M.; Hua, Y.; Huang, R.; et al. So2Sat LCZ42: A benchmark data set for the classification of global local climate zones [Software and Data Sets]. IEEE Geosci. Remote Sens. Mag. 2020, 8, 76–89. [Google Scholar] [CrossRef] [Green Version]
- Simanjuntak, R.M.; Kuffer, M.; Reckien, D. Object-based image analysis to map local climate zones: The case of Bandung, Indonesia. Appl. Geogr. 2019, 106, 108–121. [Google Scholar] [CrossRef]
- Liu, S.; Shi, Q. Local climate zone mapping as remote sensing scene classification using deep learning: A case study of metropolitan China. ISPRS J. Photogramm. Remote Sens. 2020, 164, 229–242. [Google Scholar] [CrossRef]
- Lau, K.; Ren, C.; Shi, Y.; Zheng, V. Determining the optimal size of local climate zones for spatial mapping in high-density cities. In Proceedings of the ICUC9—9th International Conference on Urban Climate Jointly with 12th Symposium on the Urban Environment, Toulouse, France, 20–24 July 2015. [Google Scholar]
- Ma, L.; Liu, Y.; Zhang, X.; Ye, Y.; Yin, G.; Johnson, B.A. Deep learning in remote sensing applications: A meta-analysis and review. ISPRS J. Photogramm. Remote Sens. 2019, 152, 166–177. [Google Scholar] [CrossRef]
- Cheng, G.; Xie, X.; Han, J.; Guo, L.; Xia, G.-S. Remote sensing image scene classification meets deep learning: Challenges, methods, benchmarks, and opportunities. IEEE J. Sel. Top. Appl. Earth Obs. Remote Sens. 2020, 13, 3735–3756. [Google Scholar] [CrossRef]
- Yoo, C.; Han, D.; Im, J.; Bechtel, B. Comparison between convolutional neural networks and random forest for local climate zone classification in mega urban areas using Landsat images. ISPRS J. Photogramm. Remote Sens. 2019, 157, 155–170. [Google Scholar] [CrossRef]
- Demuzere, M.; Bechtel, B.; Mills, G. Global transferability of local climate zone models. Urban. Clim. 2018, 27, 46–63. [Google Scholar] [CrossRef]
- Collins, J.; Dronova, I. Urban landscape change analysis using local climate zones and object-based classification in the Salt Lake metro region, Utah, USA. Remote Sens. 2019, 11, 1615. [Google Scholar] [CrossRef] [Green Version]
- Kotharkar, R.; Bagade, A. Local climate zone classification for Indian cities: A case study of Nagpur. Urban Clim. 2018, 24, 369–392. [Google Scholar] [CrossRef]
- Wang, Y.; Zhan, Q.; Ouyang, W. Impact of urban climate landscape patterns on land surface temperature in Wuhan, China. Sustainability 2017, 9, 1700. [Google Scholar] [CrossRef] [Green Version]
- Elshamli, A.; Taylor, G.W.; Areibi, S. Multisource domain adaptation for remote sensing using deep neural networks. IEEE Trans. Geosci. Remote Sens. 2019, 58, 3328–3340. [Google Scholar] [CrossRef]
- Qiu, C.; Schmitt, M.; Mou, L.; Ghamisi, P.; Zhu, X.X. Feature importance analysis for local climate zone classification using a residual convolutional neural network with multi-source datasets. Remote Sens. 2018, 10, 1572. [Google Scholar] [CrossRef] [Green Version]
- Hu, J.; Ghamisi, P.; Zhu, X.X. Feature extraction and selection of Sentinel-1 dual-pol data for global-scale local climate zone classification. ISPRS Int. J. Geo-Inf. 2018, 7, 379. [Google Scholar] [CrossRef] [Green Version]
- Zhang, G.; Ghamisi, P.; Zhu, X.X. Fusion of heterogeneous Earth observation data for the classification of local climate zones. IEEE Trans. Geosci. Remote Sens. 2019, 57, 7623–7642. [Google Scholar] [CrossRef]
- Qiu, C.; Tong, X.; Schmitt, M.; Bechtel, B.; Zhu, X.X. Multilevel feature fusion-based CNN for local climate zone classification from Sentinel-2 Images: Benchmark results on the So2Sat LCZ42 dataset. IEEE J. Sel. Top. Appl. Earth Obs. Remote Sens. 2020, 13, 2793–2806. [Google Scholar] [CrossRef]
- Danylo, O.; See, L.; Bechtel, B.; Schepaschenko, D.; Fritz, S. Contributing to WUDAPT: A Local Climate Zone Classification of Two Cities in Ukraine. IEEE J. Sel. Top. Appl. Earth Obs. Remote. Sens. 2016, 9, 1841–1853. [Google Scholar] [CrossRef] [Green Version]
- Brousse, O.; Georganos, S.; Demuzere, M.; Vanhuysse, S.; Wouters, H.; Wolff, E.; Linard, C.; Nicole, P.M.; Dujardin, S. Using Local Climate Zones in Sub-Saharan Africa to tackle urban health issues. Urban Clim. 2019, 27, 227–242. [Google Scholar] [CrossRef] [Green Version]
- Xu, Y.; Ren, C.; Cai, M.; Edward, N.Y.Y.; Wu, T. Classification of Local Climate Zones Using ASTER and Landsat Data for High-Density Cities. IEEE J. Sel. Top. Appl. Earth Obs. Remote. Sens. 2017, 10, 3397–3405. [Google Scholar] [CrossRef]
- Mills, G.; Ching, J.; See, L.; Bechtel, B.; Foley, M. An introduction to the WUDAPT project. In Proceedings of the 9th International Conference on Urban Climate, Toulouse, France, 20–24 July 2015; pp. 20–24. [Google Scholar]
- Zhao, C.; Jensen, J.; Weng, Q.; Currit, N.; Weaver, R. Application of airborne remote sensing data on mapping local climate zones: Cases of three metropolitan areas of Texas, US. Comput. Environ. Urban. Syst. 2018, 74, 175–193. [Google Scholar] [CrossRef]
- Zhao, C.; Jensen, J.L.R.; Weng, Q.; Currit, N.; Weaver, R. Use of Local Climate Zones to investigate surface urban heat islands in Texas. GIScience Remote Sens. 2020, 57, 1083–1101. [Google Scholar] [CrossRef]
- Koc, C.B.; Osmond, P.; Peters, A.; Irger, M. Understanding land surface temperature differences of local climate zones based on airborne remote sensing data. IEEE J. Sel. Top. Appl. Earth Obs. Remote Sens. 2018, 11, 2724–2730. [Google Scholar] [CrossRef]
- Quan, S.J.; Dutt, F.; Woodworth, E.; Yamagata, Y.; Yang, P.P.-J. Local climate zone mapping for energy resilience: A fine-grained and 3D approach. Energy Procedia 2017, 105, 3777–3783. [Google Scholar] [CrossRef]
- Shahzad, M.; Maurer, M.; Fraundorfer, F.; Wang, Y.; Zhu, X.X. Buildings detection in VHR SAR images using fully convolution neural networks. IEEE Trans. Geosci. Remote Sens. 2018, 57, 1100–1116. [Google Scholar] [CrossRef] [Green Version]
- Nex, F.C.; Remondino, F. UAV for 3D mapping applications: A review. Appl. Geomatics 2013, 6, 1–15. [Google Scholar] [CrossRef]
- Blaschke, T.; Hay, G.J.; Kelly, M.; Lang, S.; Hofmann, P.; Addink, E.; Feitosa, R.; van der Meer, F.; van der Werff, H.; van Coillie, F.; et al. Geographic object-based image analysis: A new paradigm in remote sensing and geographic information science. ISPRS Int. J. Photogramm. Remote Sens. 2014, 87, 180–191. [Google Scholar] [CrossRef] [PubMed] [Green Version]
- Ma, L.; Li, M.; Ma, X.; Cheng, L.; Du, P.; Liu, Y. A review of supervised object-based land-cover image classification. ISPRS J. Photogramm. Remote Sens. 2017, 130, 277–293. [Google Scholar] [CrossRef]
- Ma, L.; Cheng, L.; Li, M.; Liu, Y.; Ma, X. Training set size, scale, and features in Geographic Object-Based Image Analysis of very high resolution unmanned aerial vehicle imagery. ISPRS J. Photogramm. Remote Sens. 2015, 102, 14–27. [Google Scholar] [CrossRef]
- Li, M.; Ma, L.; Blaschke, T.; Cheng, L.; Tiede, D. A systematic comparison of different object-based classification techniques using high spatial resolution imagery in agricultural environments. Int. J. Appl. Earth Obs. Geoinf. 2016, 49, 87–98. [Google Scholar] [CrossRef]
- Rodriguez-Galiano, V.F.; Ghimire, B.; Rogan, J.; Olmo, M.C.; Rigol-Sanchez, J.P. An assessment of the effectiveness of a random forest classifier for land-cover classification. ISPRS J. Photogramm. Remote Sens. 2012, 67, 93–104. [Google Scholar] [CrossRef]
- Chen, T.-H.K.; Qiu, C.; Schmitt, M.; Zhu, X.X.; Sabel, C.; Prishchepov, A.V. Mapping horizontal and vertical urban densification in Denmark with Landsat time-series from 1985 to 2018: A semantic segmentation solution. Remote Sens. Environ. 2020, 251, 112096. [Google Scholar] [CrossRef]
- Graf, L.; Bach, H.; Tiede, D. Semantic segmentation of Sentinel-2 imagery for mapping irrigation center pivots. Remote Sens. 2020, 12, 3937. [Google Scholar] [CrossRef]
- Ghorbanzadeh, O.; Tiede, D.; Wendt, L.; Sudmanns, M.; Lang, S. Transferable instance segmentation of dwellings in a refugee camp—Integrating CNN and OBIA. Eur. J. Remote Sens. 2020, 54, 127–140. [Google Scholar] [CrossRef]
- Fu, T.; Ma, L.; Li, M.; Johnson, B.A. Using convolutional neural network to identify irregular segmentation objects from very high-resolution remote sensing imagery. J. Appl. Remote Sens. 2018, 12, 025010. [Google Scholar] [CrossRef]


| Index | Description |
|---|---|
| OA | Percentage of correctly classified pixels or area for all polygons |
| Kappa | A standard measure accounting for accuracies of different classes |
| OA_urb | The OA for only the urban polygons. It’s necessary because of the bias of large training area from natural classes |
| OA_builtup | The OA for both classes with urban and natural, and LCZ E as artificial class in natural is omitted |
| Weighted accuracy (WA) | A metric that accounts for similarity and dissimilarity between classes |
| Cites | Classification Schemes | Accuracy—OA | Data | City Ratio | Reference |
|---|---|---|---|---|---|
| Bandung in Indonesia | OBIA with Rule-based classification | 75.56%–82.31% 86.15%–88.89% | SPOT-6 (2013) Pleiades (2016) | 68.02% 69.17% | Simanjuntak et al. [32] |
| Salt Lake City in USA | OBIA with RF classifier | 64% | Landsat | Metropolitan area | Collins and Dronova [39] |
| Kyiv of Ukraine | Pixel-based method with RF classifier (WUDAPT framework) | 64% | Landsat 8 (Multi-seasonal) | 43.11% (The ratio of city to nature in the verification point, 485/1125) | Danylo et al. [47] |
| 7 cities in Germany | Pixel-based method with RNN | 79.8%–84% (average accuracy of 7 cities) 78% (average accuracy of 7 cities) | Sentinel-2 (Multi-seasonal) Sentinel-2 + Landsat 8 | - | Qiu et al. [15] Qiu et al. [43] |
| Berlin, Seoul | Pixel-based method with CNN (50 m) | 85.3% 96.1% | Sentinel-2 + Landsat 8 + OSM | - | Yoo et al. [13] |
| Rome, Hong Kong, Maryland, Chicago | Pixel-based method with RF (100 m) | 75.7% 75.5% 85.9% 89.8% | Landsat 8 (Dual time) | - | Yoo et al. [37] |
| Rome, Hong Kong, Maryland, Chicago | Pixel-based method with CNN (100 m) | 82.2% 80% 90.3% 91.2% | Landsat 8 (Dual time) | - | Yoo et al. [37] |
| Europe | Pixel-based method with RF (100 m) (WUDAPT framework) | - | Landsat 8 Sentinel-1 DEM(DSM-DTM) | Demuzere et al. [30] | |
| 50 cities in China | Pixel-based method with R (100 m) (WUDAPT framework) | 76% (OA Average accuracy) 47% (OAu) | Landsat Sentinel-1 (Generating DEM) | - | Ren et al. [23] |
| Kampala in Uganda | Pixel-based method with RF (100 m) (WUDAPT framework) | 68.68% (OA Average accuracy) 66.61% (OAu) | Landsat 8 (Dual time) Sentinel-1 | Brousse et al. [48] | |
| Guangzhou | Pixel-based method with RF (120 m) | >80% (OA Average accuracy) <70% (OAu) | Landsat ASTER | Xu et al. [49] |
| Cities | OBIA-Mean OA | Mean OA of Pixel-Based Method | ||
|---|---|---|---|---|
| 100 m | 200 m | 300 m | ||
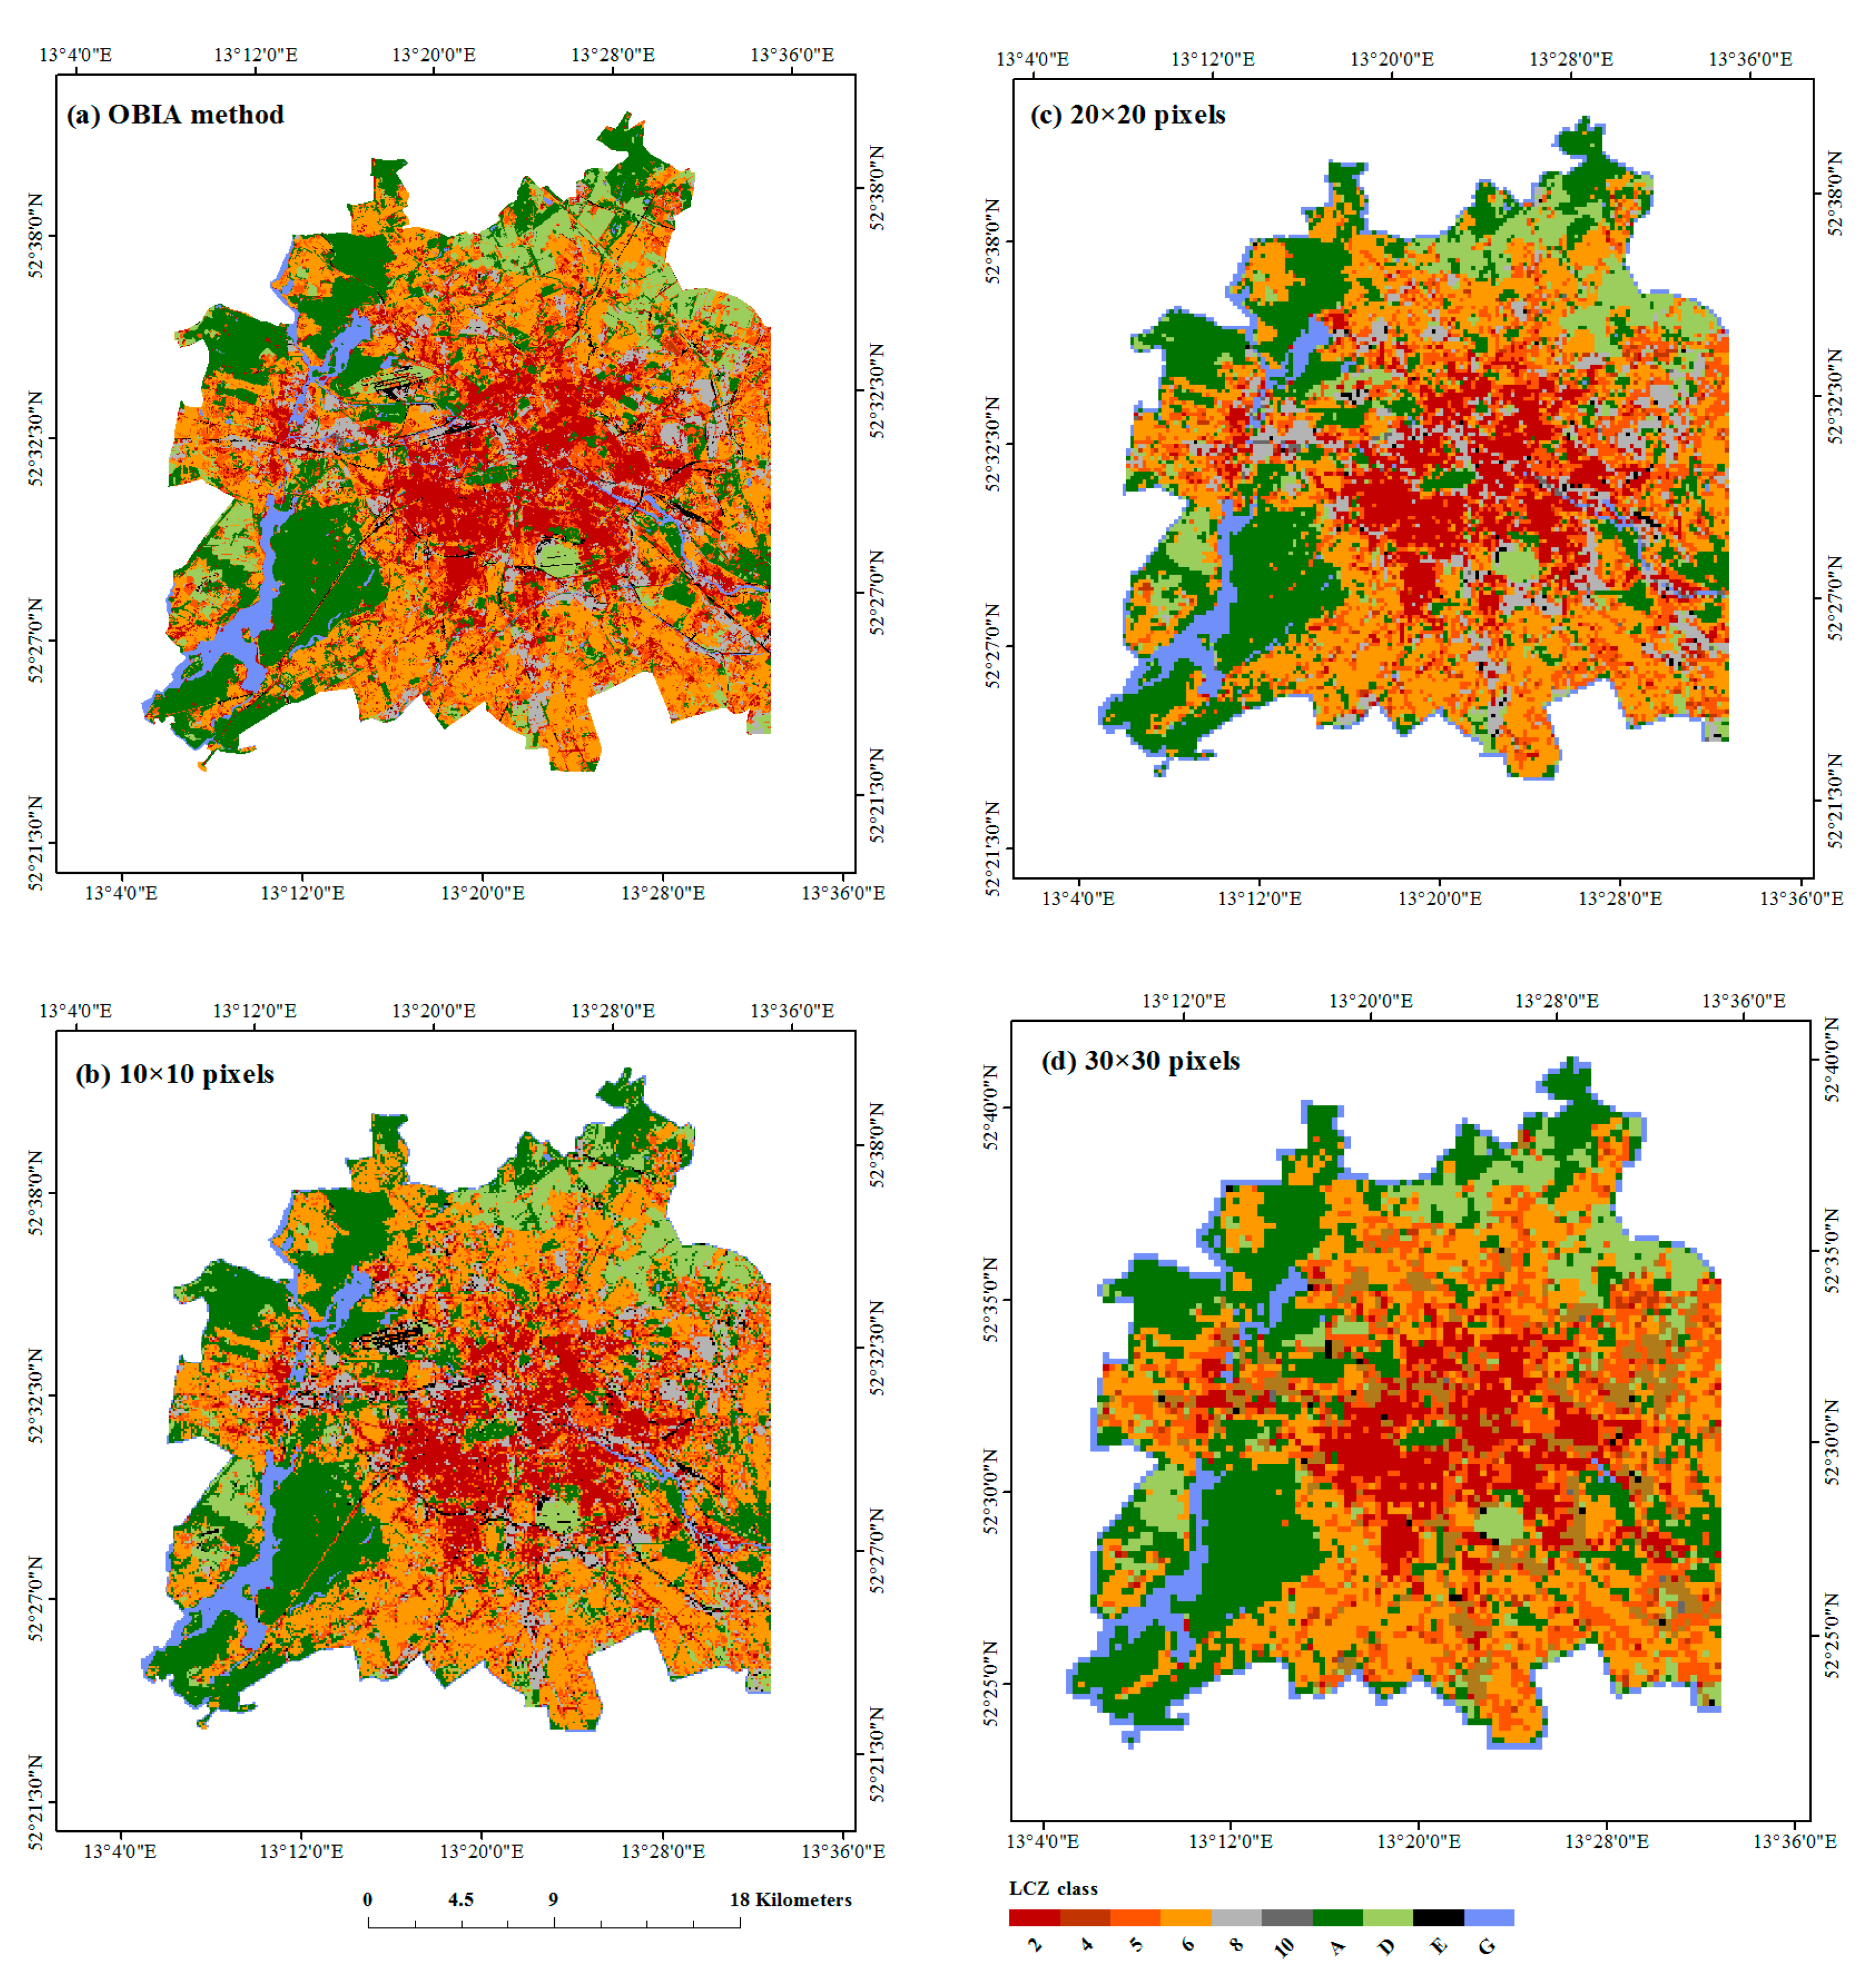
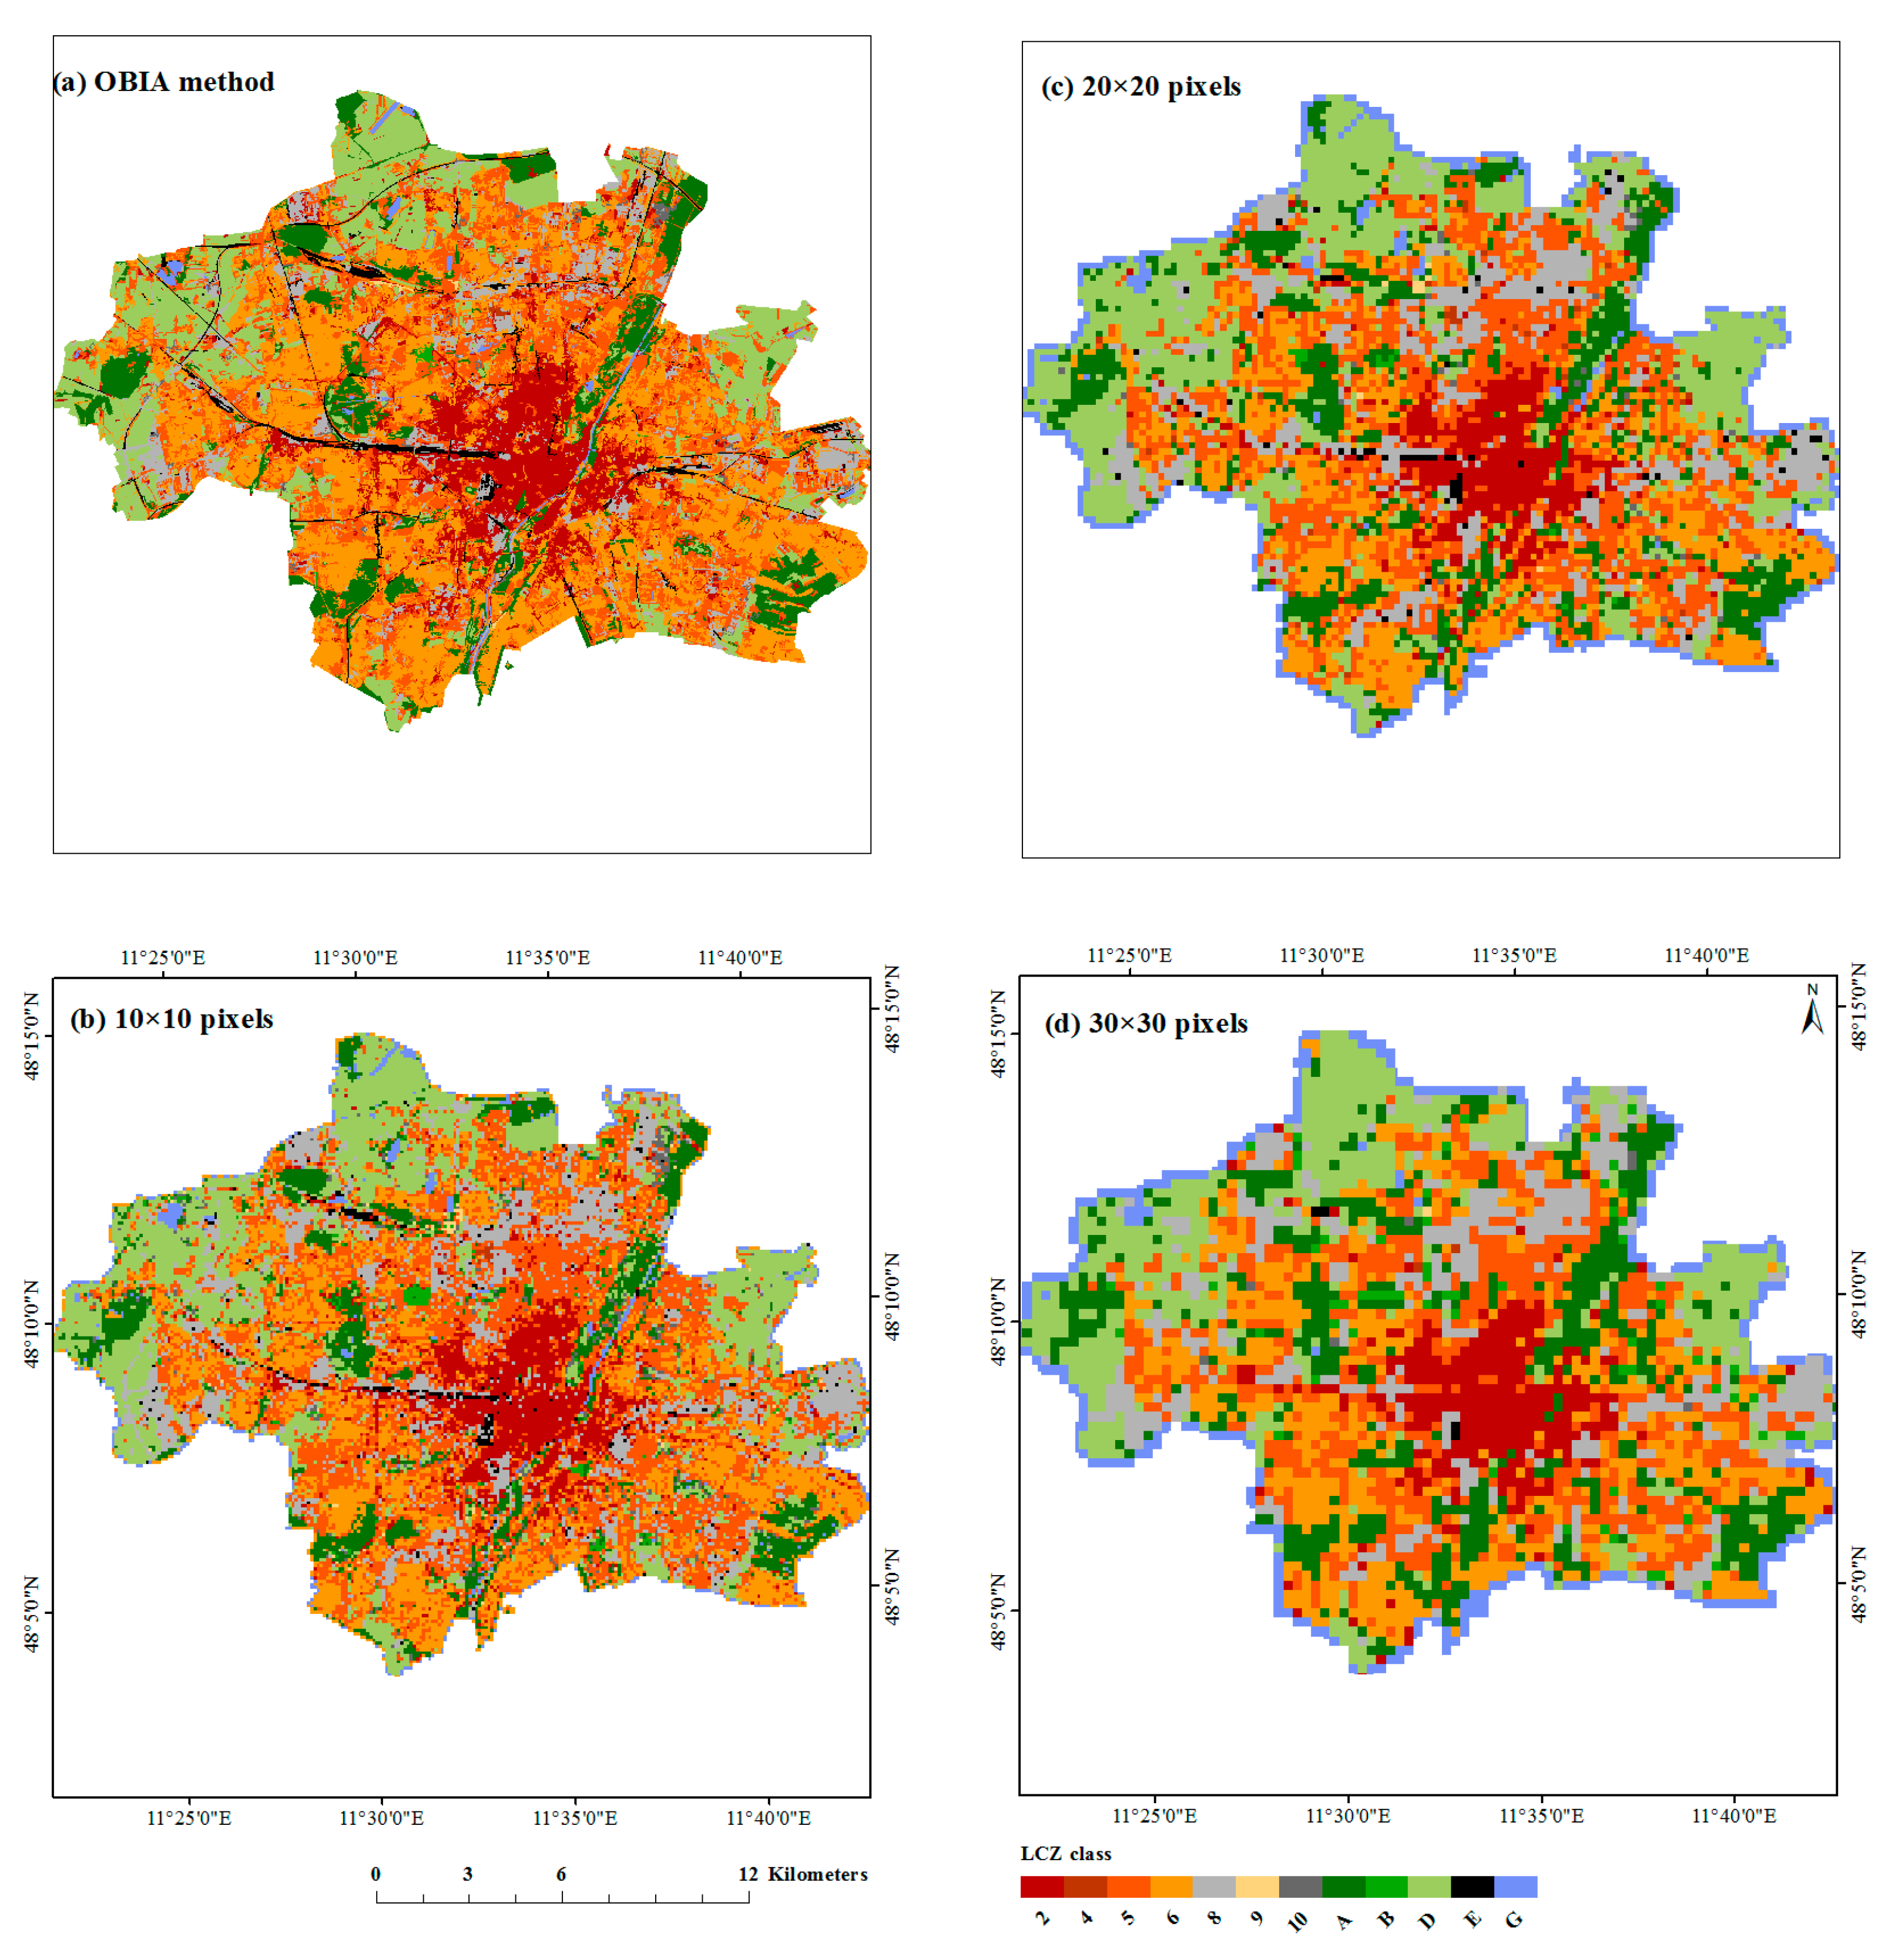
| Munich | 64.16% | 66.2% | 61.14% | 59.38% |
| Berlin | 86.38% | 87.49% | 89.32% | 90.75% |
Publisher’s Note: MDPI stays neutral with regard to jurisdictional claims in published maps and institutional affiliations. |
© 2021 by the authors. Licensee MDPI, Basel, Switzerland. This article is an open access article distributed under the terms and conditions of the Creative Commons Attribution (CC BY) license (https://creativecommons.org/licenses/by/4.0/).
Share and Cite
Ma, L.; Zhu, X.; Qiu, C.; Blaschke, T.; Li, M. Advances of Local Climate Zone Mapping and Its Practice Using Object-Based Image Analysis. Atmosphere 2021, 12, 1146. https://doi.org/10.3390/atmos12091146
Ma L, Zhu X, Qiu C, Blaschke T, Li M. Advances of Local Climate Zone Mapping and Its Practice Using Object-Based Image Analysis. Atmosphere. 2021; 12(9):1146. https://doi.org/10.3390/atmos12091146
Chicago/Turabian StyleMa, Lei, Xiaoxiang Zhu, Chunping Qiu, Thomas Blaschke, and Manchun Li. 2021. "Advances of Local Climate Zone Mapping and Its Practice Using Object-Based Image Analysis" Atmosphere 12, no. 9: 1146. https://doi.org/10.3390/atmos12091146
APA StyleMa, L., Zhu, X., Qiu, C., Blaschke, T., & Li, M. (2021). Advances of Local Climate Zone Mapping and Its Practice Using Object-Based Image Analysis. Atmosphere, 12(9), 1146. https://doi.org/10.3390/atmos12091146