Article

Assessing Heatwaves and Their Association with North African Dust Intrusions in the Algarve (Portugal)

Centre of Geographical Studies, Institute of Geography and Spatial Planning (IGOT), Universidade de Lisboa, 1600-276 Lisboa, Portugal
*
Author to whom correspondence should be addressed.
Atmosphere 2021, 12(9), 1090; https://doi.org/10.3390/atmos12091090
Submission received: 12 July 2021 / Revised: 19 August 2021 / Accepted: 21 August 2021 / Published: 24 August 2021
(This article belongs to the Special Issue Climate Change and Air Pollution in Portugal)

Abstract

:
Heatwaves are an extreme meteorological event in which affected populations may also be exposed to deteriorated air quality conditions due to the increase in air pollutant concentrations, such as PM10 (particulate matter < 10 µg/m3). In order to identify heatwaves (1973–2019) in the region of Faro (Algarve) during the hot season (April–September), the Excess Heat Factor (EHF) index was applied. The Mann–Kendall test revealed an upward trend in three heatwave metrics in Faro, and the trend of accumulated heat load (EHF load) was also positive as would be expected, but its signal was not statistically significant. An inventory of North African dust events (2006–2019) was made, and their simultaneous occurrence with heatwaves was assessed, pointing to only 20% of dust events of the Sahara occurring simultaneously with heatwave days. A cluster analysis was conducted on daily geopotential height fields at 850 hPa level over the 2006–2019 period, and four distinct patterns were identified as the most prominent synoptic circulations promoting both heatwave conditions and North African dust over the Algarve.

1. Introduction

Heatwaves are a phenomenon known for their impacts not only on human health and mortality but also on the economy and environment [1]. There is no consensual definition of this extreme meteorological event to date despite a better understanding and more accurate heatwave assessments in addition to more characteristics in terms of their description and duration [2]. The effects of abnormally high temperatures depend on both the level of exposure (frequency, duration, intensity) [3] and vulnerability of the population, which may be influenced by several factors, such as physiological aspects, age, gender [4], or preexisting health conditions [5]. The impacts on mortality and morbidity have been described in many parts of the globe (e.g., [4,6,7,8,9]). Likewise, Portugal has experienced heatwaves that have led to an increase in mortality, as was the case in June 1981 [10], July 1991 [10], and during the European-wide heatwave in 2003 [11,12]. In this study, a more in-depth analysis of heatwaves in the southernmost Portuguese region (Algarve) was conducted using the Excess Heat Factor (EHF). This index was established primarily for assessing Australian heatwaves [13] and combines both the statistical and human-impact features of the identified heatwaves [14]. More recently, studies from other countries, such as the Czech Republic [15] and Greece [14], have provided additional and useful information on the impact of these extreme heat conditions on human health.
During a heatwave, the affected population may suffer as a result of exposure to heat stress and also due to air quality deterioration, as air pollutant concentrations, such as PM10 (particulate matter < 10 µg/m3) and ozone, are frequently exacerbated under anticyclonic weather conditions, increased temperatures, and light winds [5]. Recent studies have shown the relationship between temperature, ozone, and particulate matter in premature mortality and morbidity. Therefore, it is important to reduce the concentrations of these pollutants during heatwaves [16]. The Sahara Desert is a major source of dust intrusions into the Mediterranean Sea and neighbouring countries, causing health impacts that have been demonstrated in cities such as Madrid, Barcelona, Rome, and Athens (e.g., [17,18]). However, African dust from the Sahara and Sahel regions has also been observed in other global locations, for example, the Caribbean and Southern United States [19]. Some studies have shown that PM10 and ozone concentrations during hot summer weather, and particularly during the most extreme heatwaves, can lead to an increase in mortality [4,16,20,21]. Several authors state that in some European cities, heatwave effects are more related to respiratory diseases than to cardiovascular problems, e.g., in the summer of 2003 (June–August), around 1460 deaths were attributable to ambient PM10 exposure and 1400 deaths to ambient ozone exposure in the Netherlands [20]. Stedman [21] also estimated that between 225 and 593 additional deaths were the result of ozone exposure and 207 due to PM10 in the United Kingdom during the same heatwave episode.
Dust transport from the Sahara Desert is one of the most significant sources of particulate matter in the southern Mediterranean [22]. From April to September (warm season), the Faro district (Algarve, Portugal) is frequently affected by heatwaves and dust intrusions [23]. Its proximity to the African continent and the Sahara Desert, the latter a source of dust emission and hot and dry continental air mass formation, leads to greater exposure of the population to these phenomena. During these months, there is a significant population increase across the Algarve due to the domestic and international influx of tourists. As a region characterized by beach and sun tourism, the Algarve is currently the main tourism destination in Portugal, recording 30.9% of the total overnight stays in 2017, followed by the Lisbon Metropolitan Area, with 25.5% [24]. In view of these important seasonal changes in the demography of the Algarve, it is crucial to assess and study the occurrence of heatwaves and Saharan Dust Events (SDE), as both are potentially responsible for the negative effects on health [25,26,27]. No scientific study has been conducted to date to assess the simultaneous occurrence of heatwaves and SDE in Portugal by means of a systematic analysis. Therefore, this study aims to (i) identify heatwaves in the Faro (Algarve) district using the EHF method and ascertain whether their frequency, duration, and EHF load trends increased in Faro between 1973 and 2019; (ii) analyse an inventory of North African dust events to establish any simultaneous occurrences with the detected heatwaves from 2006 to 2019; and (iii) identify the main atmospheric circulation types that lead to the simultaneous occurrence of heatwaves and SDE.

2. Materials and Methods
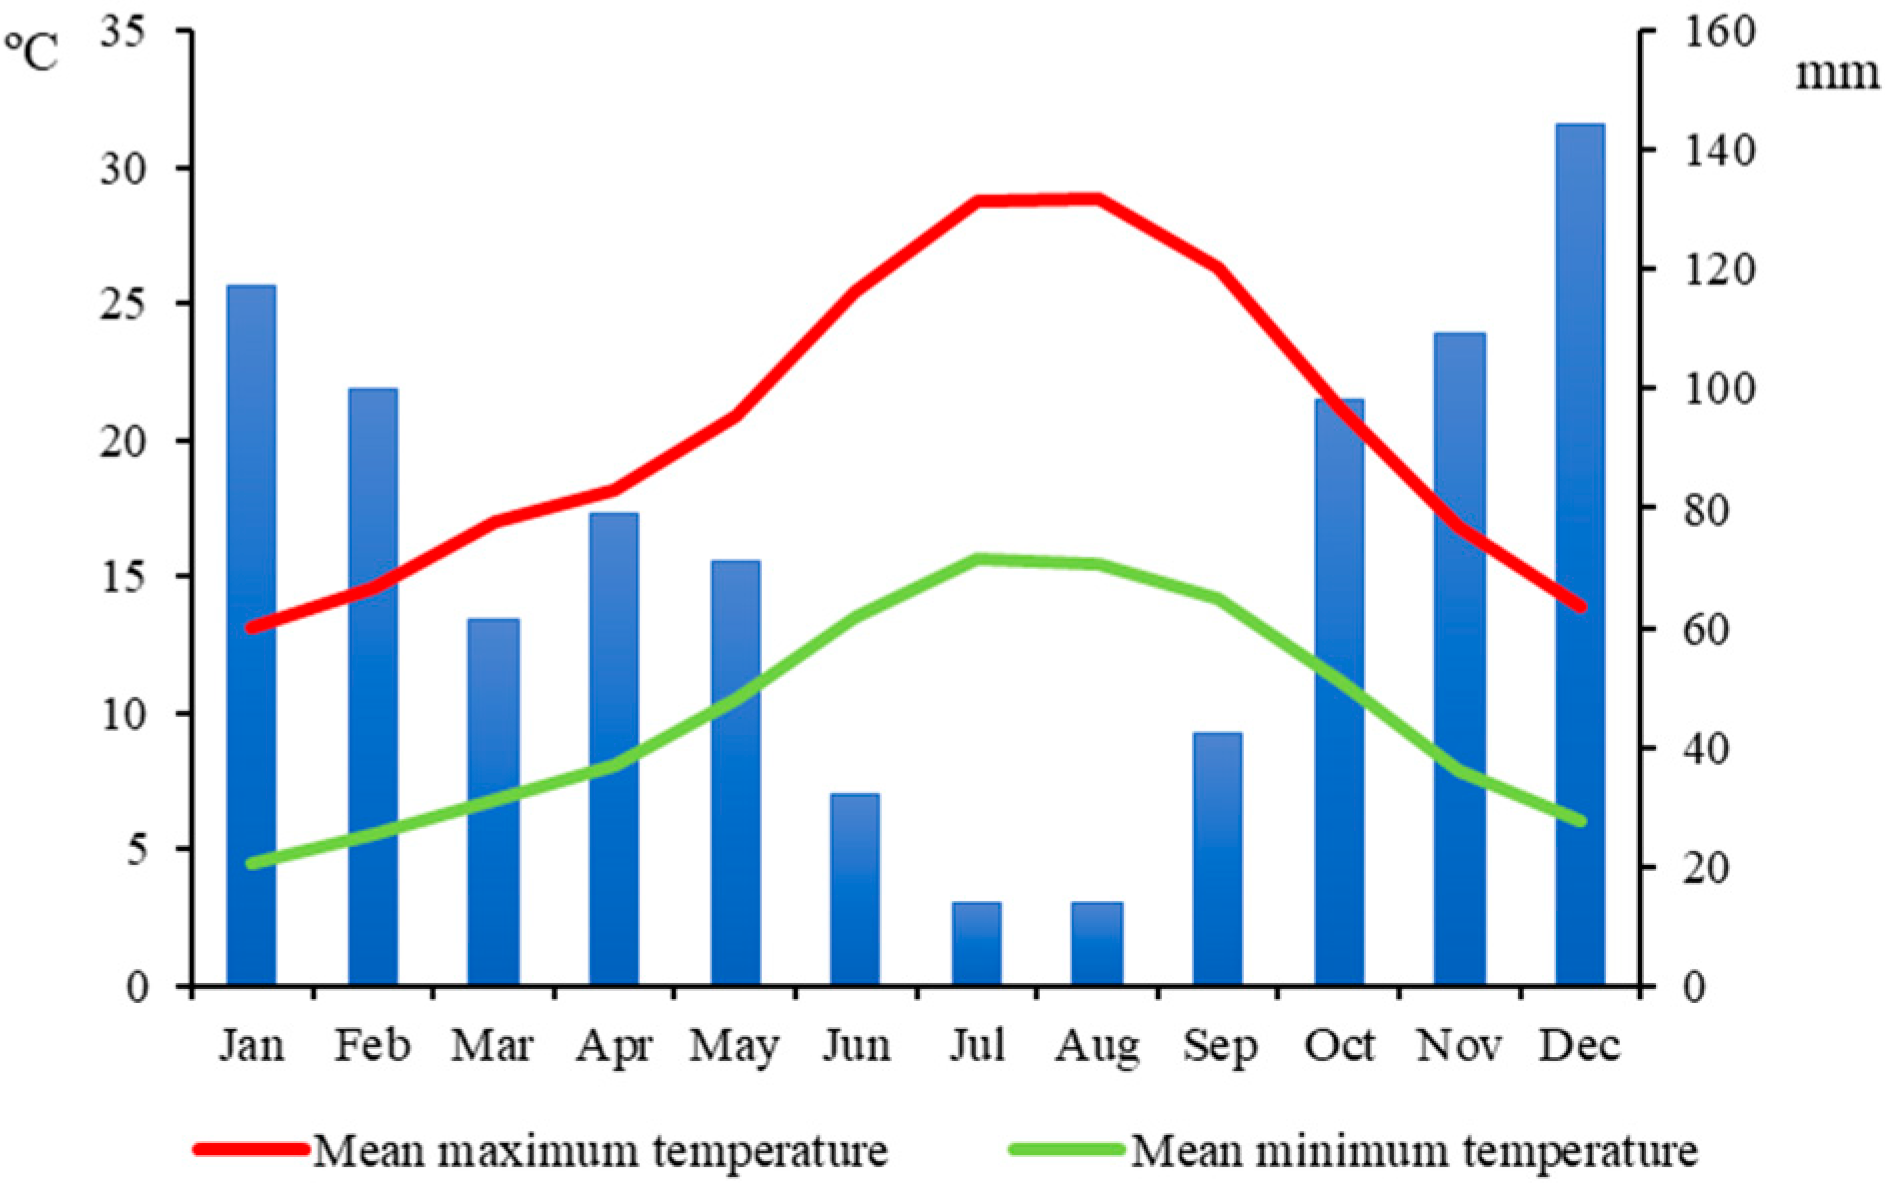
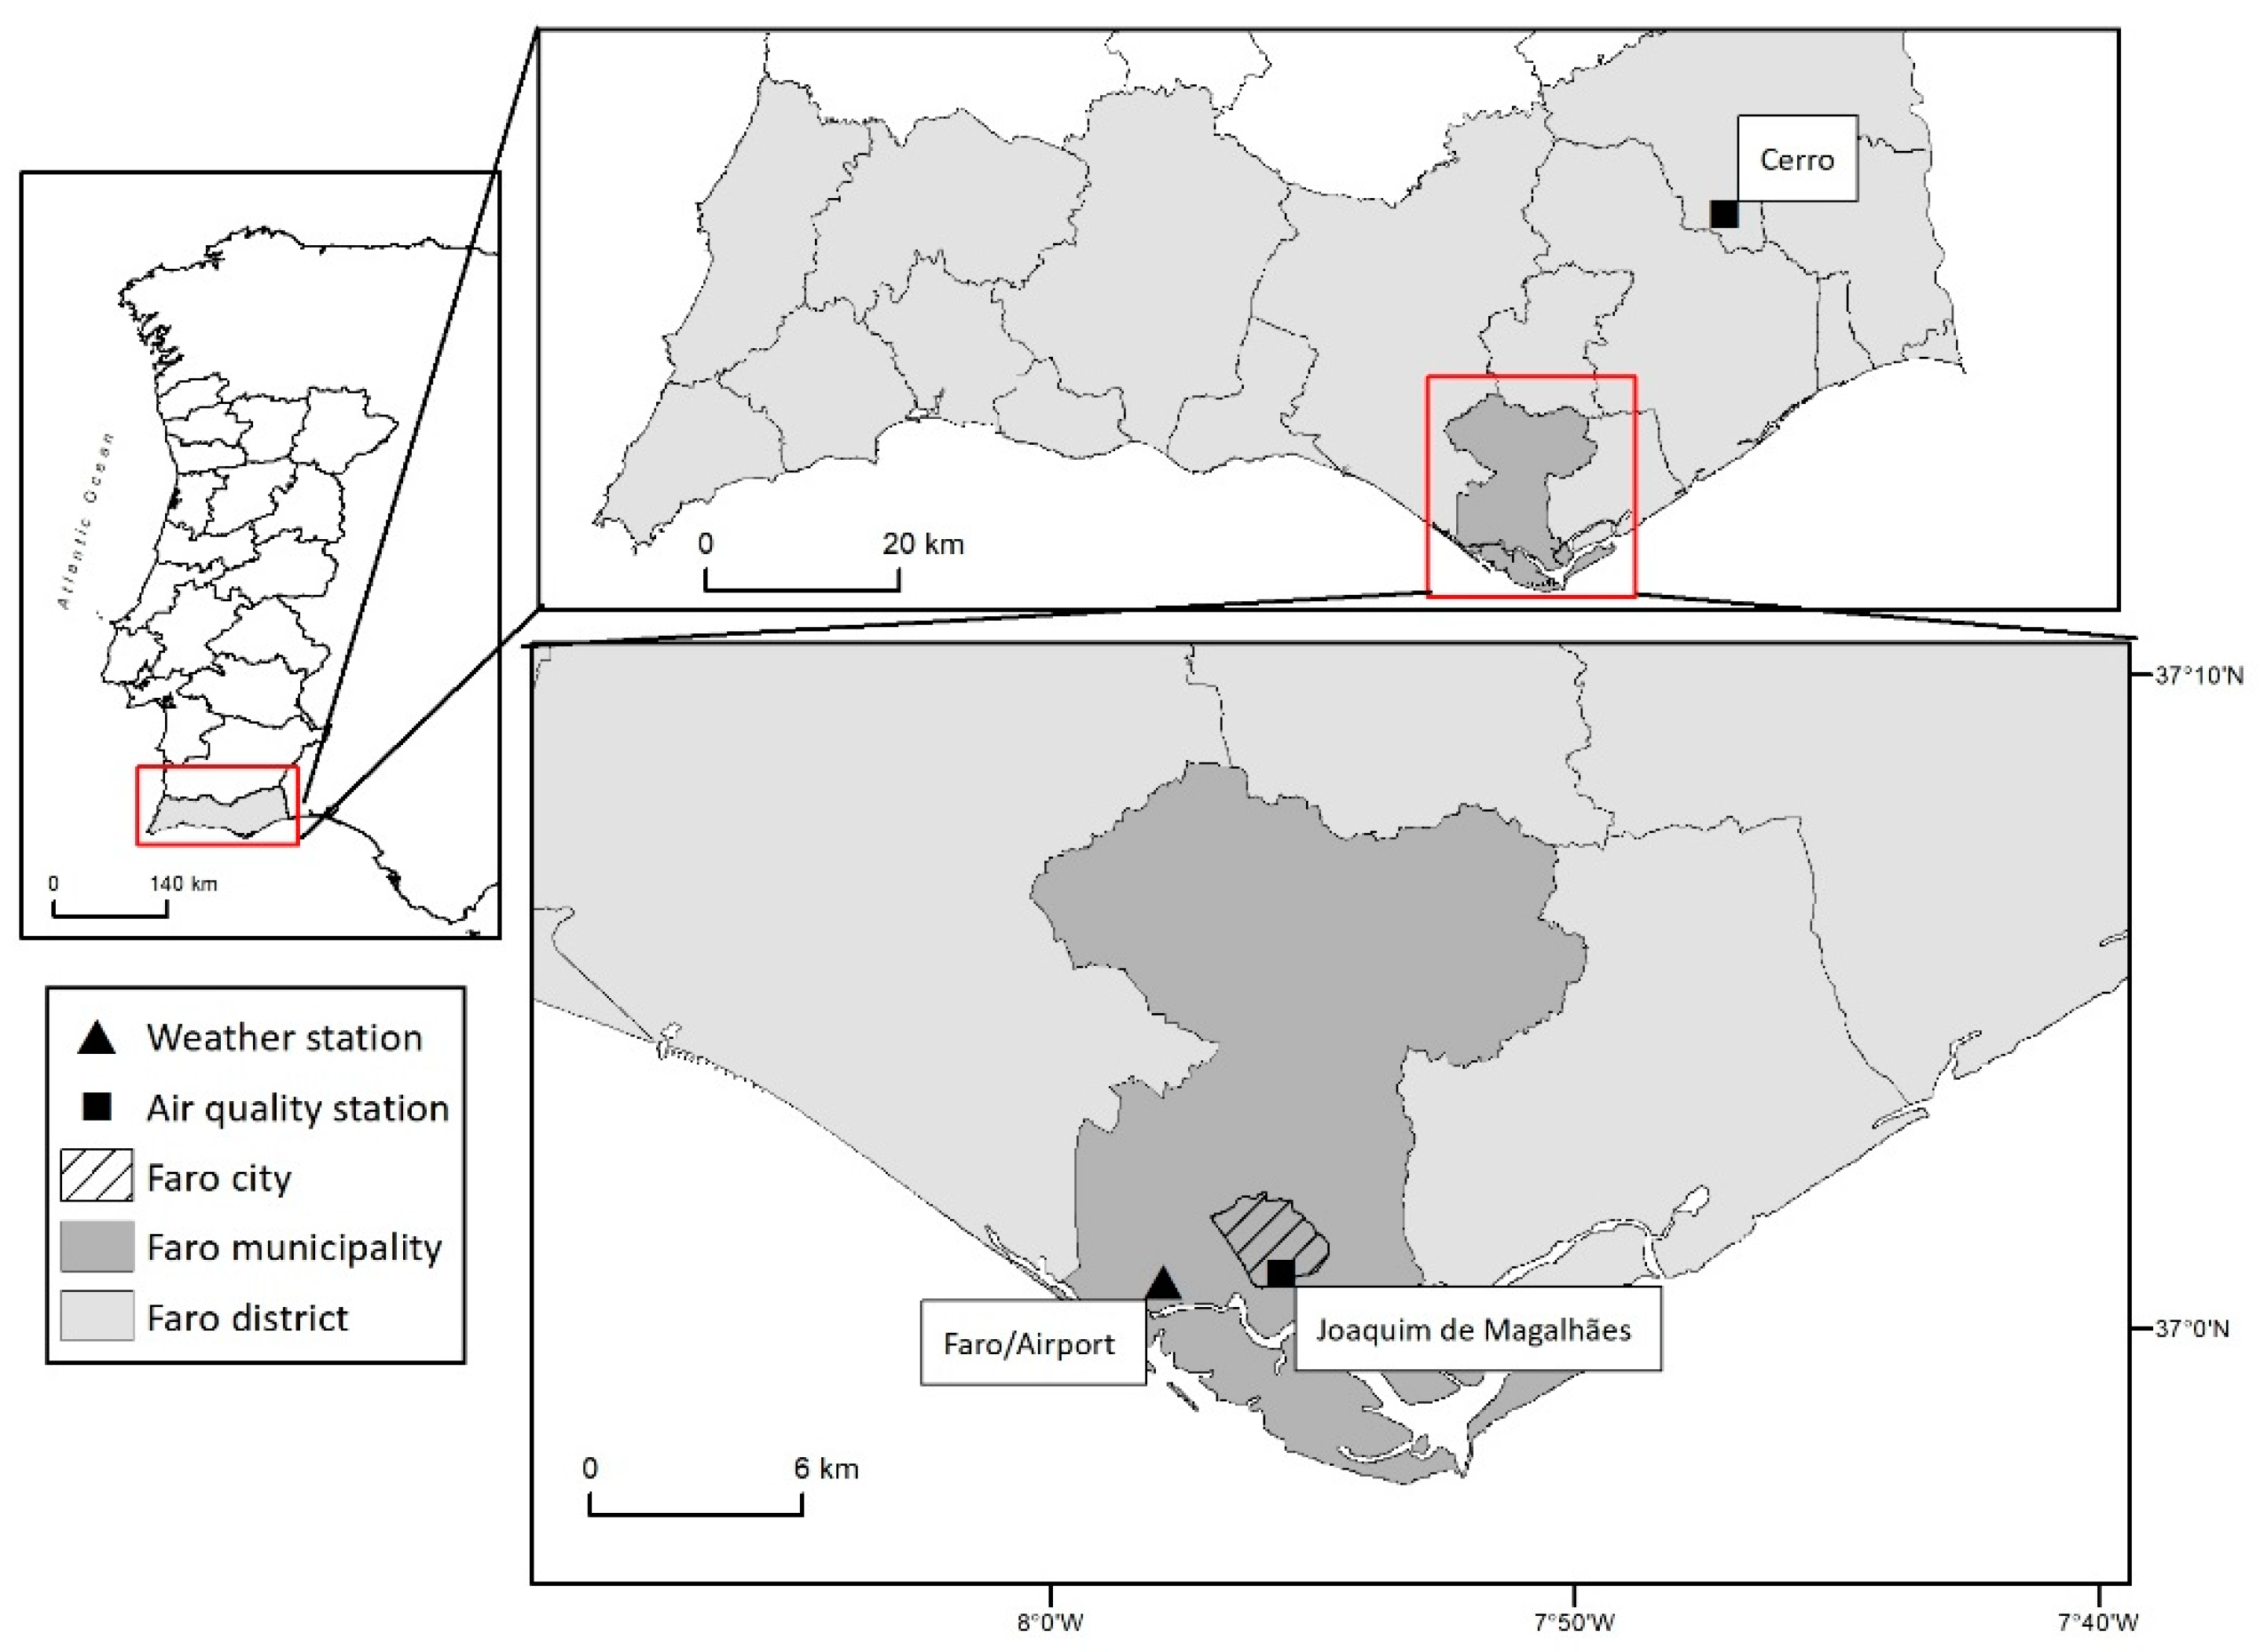
2.1. Study Area

The Faro district is located in the south of Portugal and is characterized by a Mediterranean climate, with a predominantly cool wet season and dry summer (Figure 1).
Mainly in June, July, and August, Portugal and the Algarve region in particular is exposed to heatwave events [28,29,30] that typically occur when the subtropical anticyclone is in an abnormally northern position [31]. A strong subtropical ridge covers the Iberian Peninsula, moving north and transporting Saharan tropical air (very hot and dry) which, after crossing the barrier of the Atlas Mountains, hits the Iberian thermal depression [28]. On the other hand, Ferreira and Marques [32] claimed that the predominant meteorological conditions for the occurrence of dust events can be divided into two sets of months: April to June, when the movement of particles from the Sahel to the Sahara occurs, with the influence of a low pressure system in the SW of Portugal and anticyclones in the Mediterranean and Northern Africa; and from July to August, when the transport of particles from the Sahara intensifies, associated with the presence of anticyclones in the Mediterranean and North Africa. The relationship between the Iberian heatwaves and Saharan warm air intrusions is observed to be closer in the southern sectors of the Iberian Peninsula [31]; thus, due to its proximity to North Africa, the Faro (Figure 2) district is highly sensitive to these phenomena.

2.2. Materials

2.2.1. Daily Air-Temperature Data

Series of daily maximum and minimum temperatures (°C) from the Faro/Airport weather station (Figure 2) for the period 1973 to 2019 were collected at the NOAA database, https://www.ncdc.noaa.gov/cdo-web/, accessed on 15 March 2021). These are the longest air temperature series available for the Algarve region, hence allowing for an almost up-to-date and pluri-decadal identification of the heatwaves. Daily mean temperatures were then computed as required for the method of heatwave detection (Excess Heat Factor, explained further ahead in this paper).

2.2.2. Saharan Dust Events (APA Inventory)

In this study, the dust events from northern Africa were identified. The events that occurred between April and September (warm months) were identified through an analysis of the Identification and Evaluation Reports of Natural Events in Portugal by the APA (Portuguese Environmental Agency), available since 2006. These reports are published annually and contain the identification of Saharan dust events by Portuguese regions and with a monthly temporal resolution. All the events that reached national territory and particularly the Algarve region were considered even if they did not exceed the legally required air-quality limits.

2.2.3. Air-Quality Station Data: PM10 Daily/Hourly Legal Exceedances

In order to identify the Saharan dust days (SD) that exceeded the PM10 daily limit values (under Directive 2008/50 on ambient air quality and cleaner air for Europe), data from two air quality stations were analysed: the Joaquim de Magalhães urban station (2011–2016) and the Cerro rural station (2012–2016), both located in the Faro municipality (Figure 2). The air-quality data from these two stations have the legally required efficiency, i.e., one station should have 85% of observations with continuous measurements, as below this value, the measurements are indicative only [33].
Portuguese law considers that, in the period of a year, the PM10 value should not exceed 40 μg/m3. The daily value of this pollutant shall not exceed 50 μg/m3, which may not be exceeded more than 35 times a year [33]. Therefore, days with PM10 values above 50 μg/m3 are deemed to correspond to poor air-quality days.

2.3. Methods

2.3.1. Excess Heat Factor (EHF)

There are a great diversity of indices and methodological approaches to identify heatwaves and assess their duration and intensity (e.g., [2]. This diversity causes limitations and uncertainties on the comparative assessment of heatwaves trends and metrics across the world. As stated in the introduction, the authors decided to adopt the EHF methodology. The Excess Heat Factor—EHF [13,34]—is a heatwave-intensity measure based on the average of the daily mean temperature (DMT) of a three-day period (TDP) for the hot semester (April to September). The two ingredients in the EHF calculation are the significance index—EHIsig (1)—and the acclimatization index—EHFaccl (2). In the EHIsig, a three-day-averaged DMT is compared against the 95th percentile for DMT using the following calculation:
EHIsig = (Ti−2 + Ti−1 + Ti)/3 − T95
In the second index, the three-day-averaged DMT is compared with the average daily temperature of the previous 30 days based on the following calculation:
EHIaccl = (Ti−2 + Ti−1 + Ti)/3 − (Ti − 1 + … + Ti − 30)/30
Following the calculation of the two indices, the product—EHF (3)—between them is calculated:
EHF = EHIsig × max(1, EHIaccl)
The highest value between 1 °C and the EHI is selected, as only positive EHF values obtained with the two positive partial indices are considered for the identification of heatwaves.
As the values of the two partial indices increase, so does the intensity of the heatwaves. To be considered a heatwave, there must be a positive EHF for at least three consecutive days, and a negative EHF value signifies the end of the identified heatwave. The Excess Heat Factor load, or cumulative/total EHF daily values across an entire heatwave, was also assessed for each heatwave. The Excess Heat Factor load can be used to assess an event and is useful for agencies, community groups, or business sectors wishing to evaluate their resilience thresholds [13].

2.3.2. Heatwave Trends (Frequency, Duration, and EHF Load)

The Mann–Kendall test is a non-parametric test that is used to determine the existence and significance of trends in data collected in meteorological stations [35]. Using the XLSTAT software, the Mann–Kendall test was applied to identify climate trends for the variables: number of heatwave days (HWF), which means the number of days where EHF > 0, i.e., days with abnormally hot conditions; number of heatwaves (HWN); longest heatwave duration (HWD); and also for the EHF load accumulated for each year under study.

2.3.3. K-Means

In this study, the K-means clustering algorithm [36] was used to classify the atmospheric circulation patterns for the days with simultaneous occurrence of heatwave and SDE. This non-hierarchical method provides excellent separability among the clusters, good temporal and spatial stability [37], and aims to classify data into different groups or clusters, performing an iterative adjustment of data centroids and classifying the observations of a variable into homogeneous K groups [38,39], which should be specified by the user at first, showing the subjectivity of the methodology [37], and then each point is allocated to the cluster to the closest centre, and each center is recalculated as the centroid of the points in it [36]. The cluster analysis was applied to daily geopotential height fields at 850 hPa level for the specified days over the 2006–2019 period from R1 NCEP reanalysis available on the National Centres for Environmental Prediction (NCEP) website. These data were extracted for the geographical domain defined by 20–55° N latitude and 25° W–15° E longitude limits, encompassing a total of 255 points (2.5° × 2.5° spatial resolution). SPSS was the software used to carry out the K-means classification, applied to a matrix with 174 rows (heatwave and SD days) × 255 columns (grid points in geopotential height fields). The composites or atmospheric circulation patterns (average of all days included in each cluster obtained) were computed using the CDO program (Climate Data Operators, https://code.mpimet.mpg.de/projects/cdo, accessed on 11 April 2021) and plotted in Panoply software (https://www.giss.nasa.gov/tools/panoply/, accessed on 29 April 2021).

3. Results

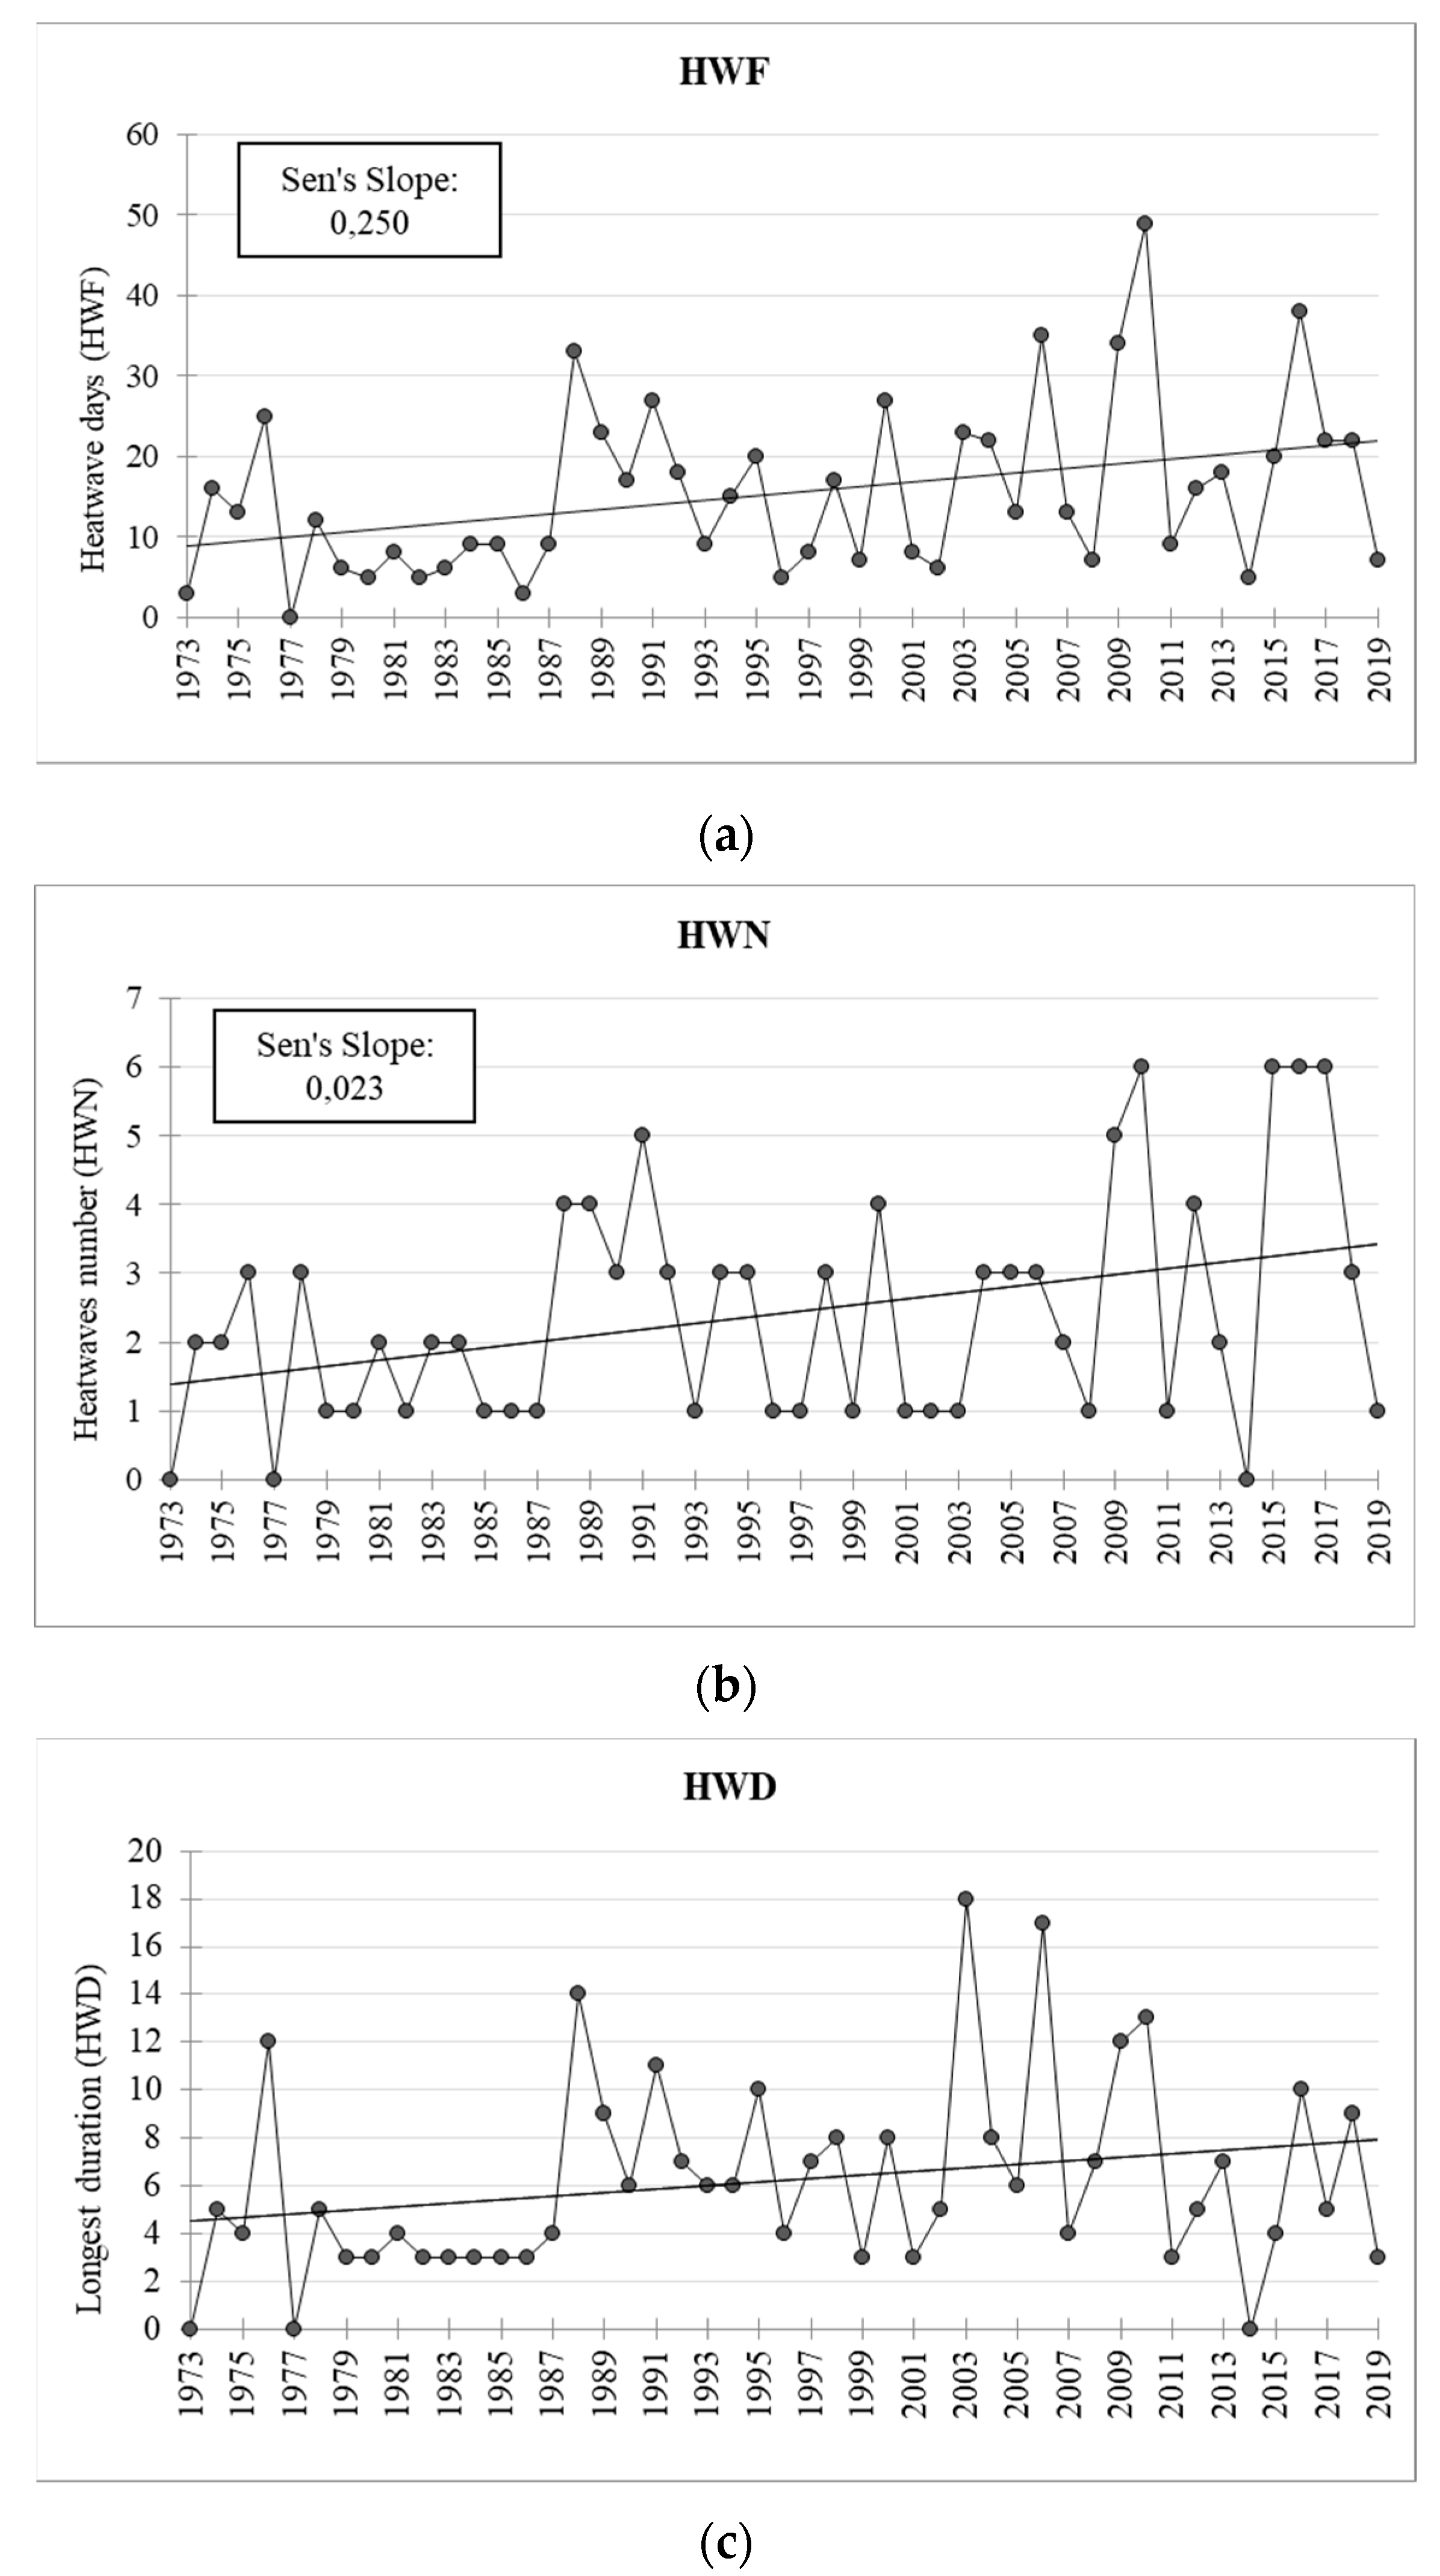
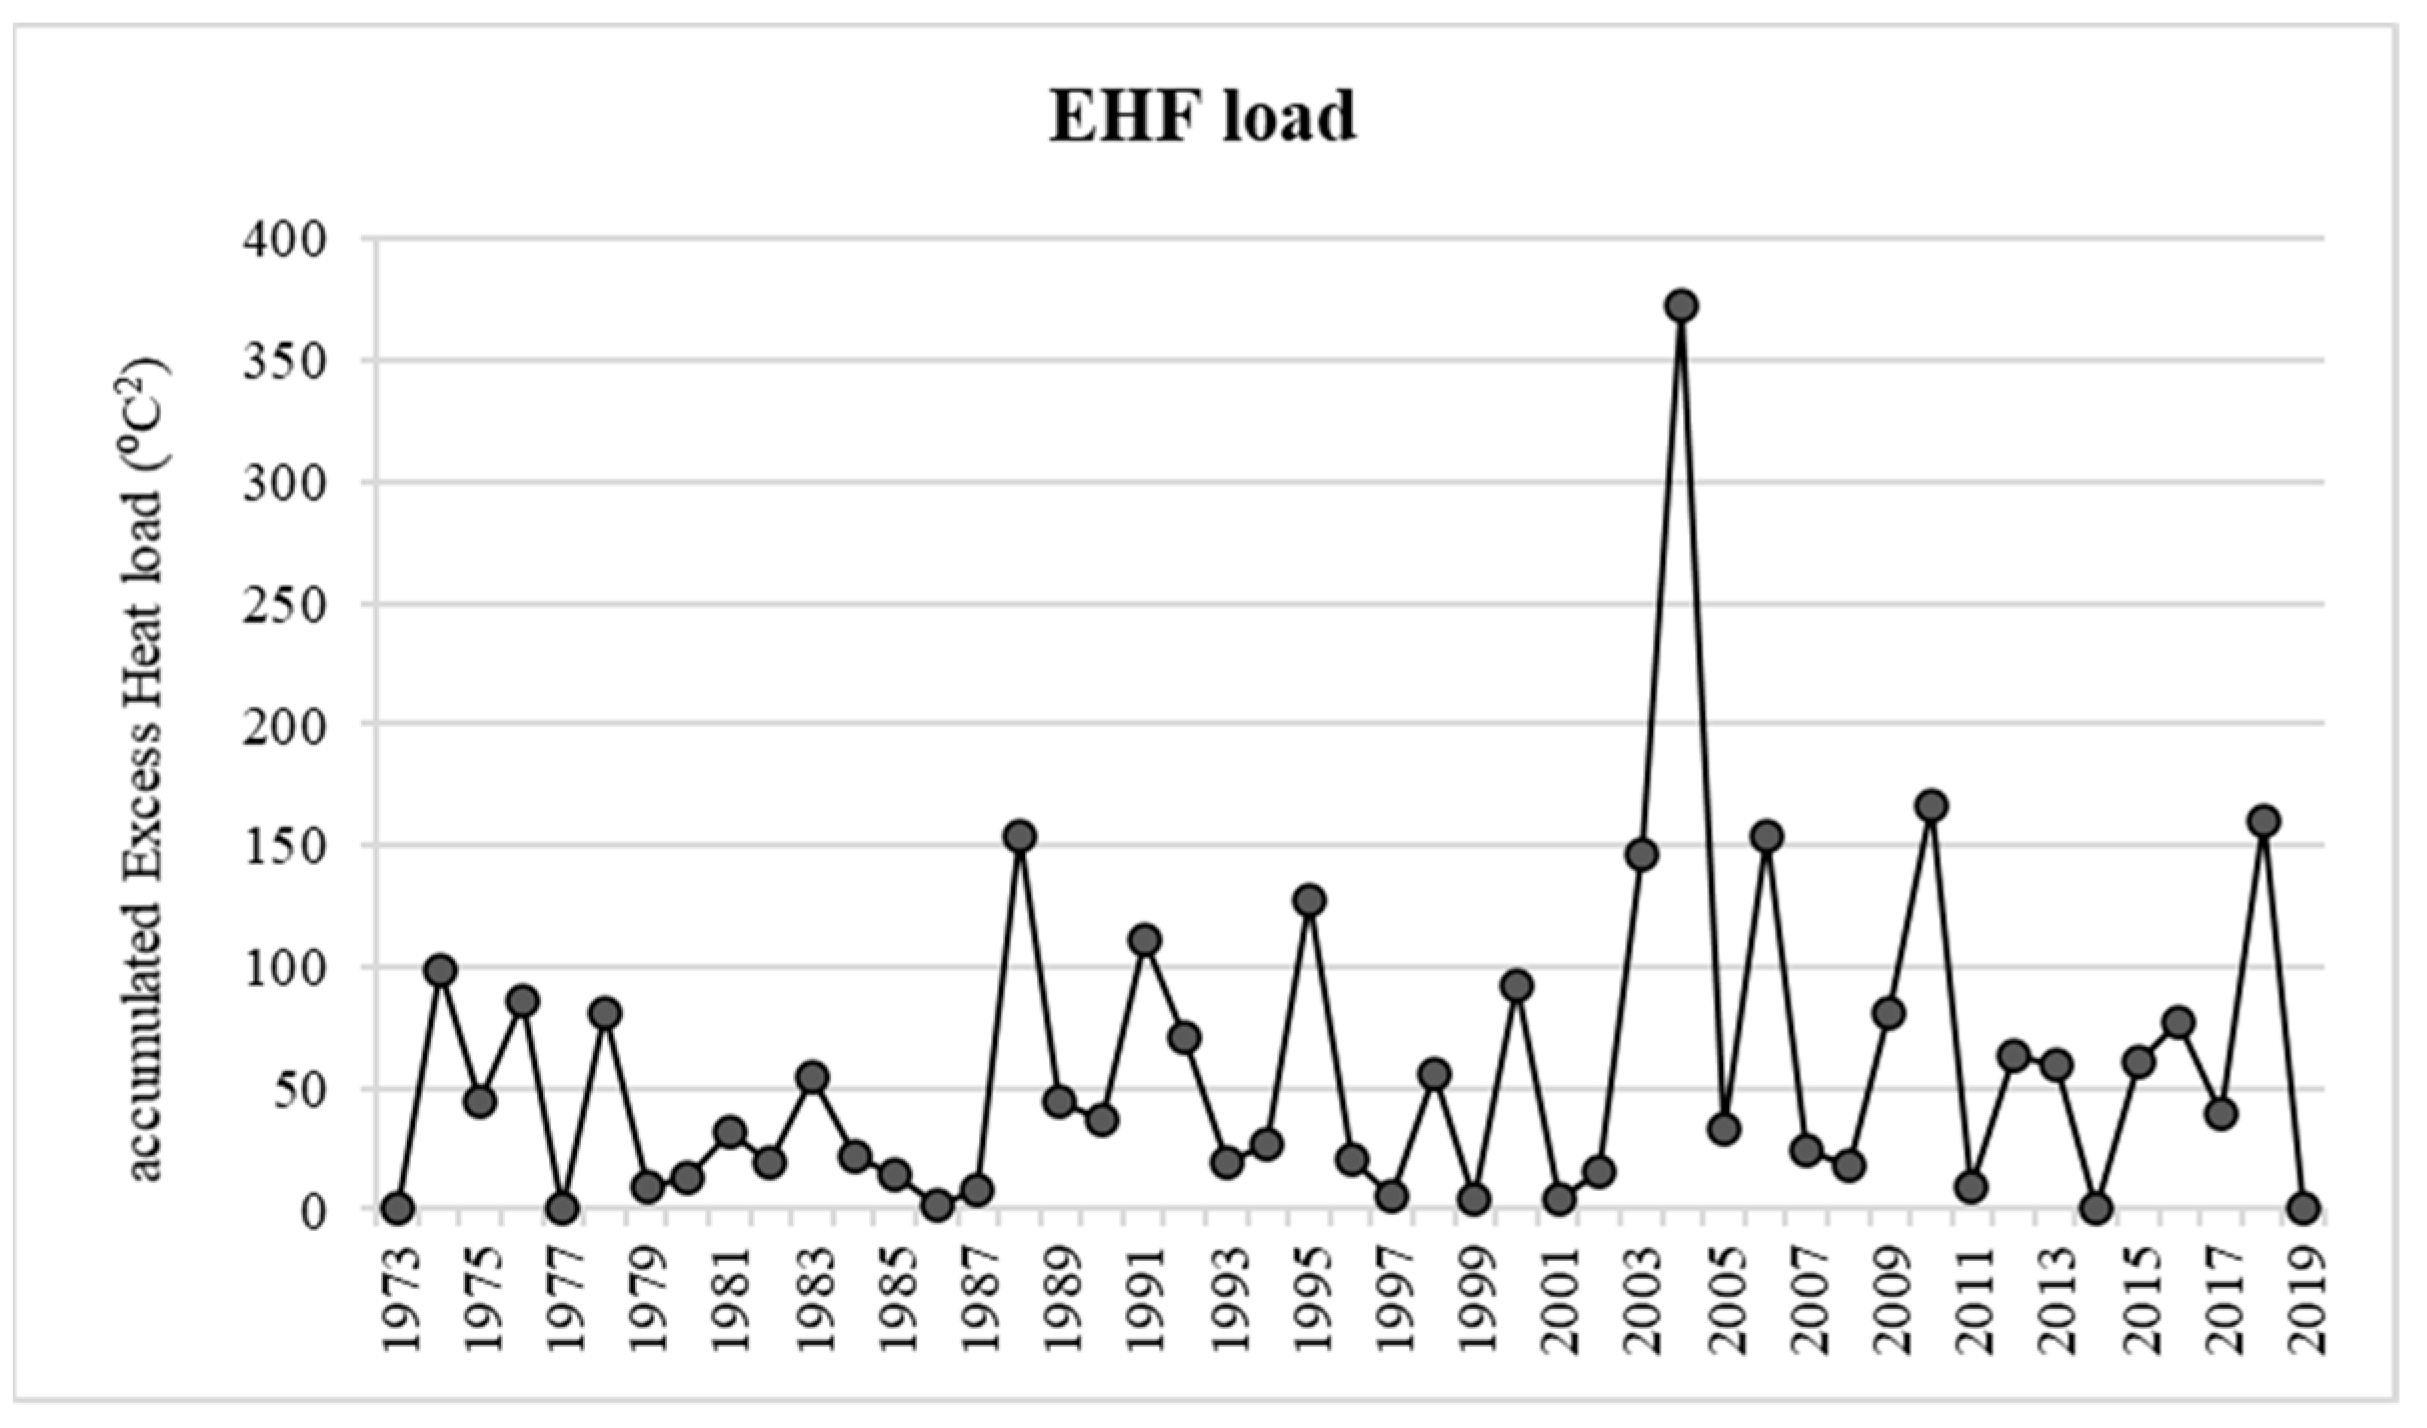
3.1. Heatwaves: Trend Analyses

The EHF method enabled the identification of 722 heatwave days and 113 heatwaves between 1973 and 2019, occurring mostly in July (53 heatwaves) and August (41 heatwaves), with an average of approximately two heatwaves per year. According to the EHF method, the only month of the hot semester that did not experience a heatwave was April. The mean duration of the heatwaves was around five days, and the longest lasted 18 days (30 July to 16 August 2003).
The statistics of the non-parametric test on temporal trends are presented in Table 1.
The Mann–Kendall test revealed that the three heatwave metrics (HWF, HWN, HWD) exhibited positive and statistically significant trends over the 1973–2019 period, pointing to heatwaves having increased in number and duration in the Algarve over the last five decades.
The magnitude of an upward trend in the HWF parameter (number of heatwave days) is the strongest, indicating an increase of 2.5 heatwave days per decade (Figure 3a), while the frequency of heatwave events (HWN) reveals a slower growth (+0.2 heatwaves per decade, Figure 3b). In addition, the duration of the longest heatwave (HWD) increased by 3.1 days over the 47-year period (Figure 3c). The trend of the accumulated heat load (EHF load) is also positive, as would be expected; however, its magnitude is not statistically significant (Figure 4).
The outstanding heatwave of 23–29 July 2004 was remarkable for its severity, as can be seen in Figure 5, with an accumulated heat load surpassing several other even longer heatwaves. Figure 5 clearly illustrates how heatwaves have become longer and more severe in terms of accumulated heat load in Faro (Algarve).
In this respect, it should be noted that the three more intense heatwaves in terms of EHF load (°C2) occurred in the current century: 23–29 July 2004 (~266 °C2), 30 July–16 August 2003 (~146 °C2), and 1–9 August 2018 (133 °C2). The temporal trend of the EHF load over the 1973–2019 period in Faro was positive, in line with the trends detected in the HWF, HWN, and HWD but without statistical significance (Table 1).

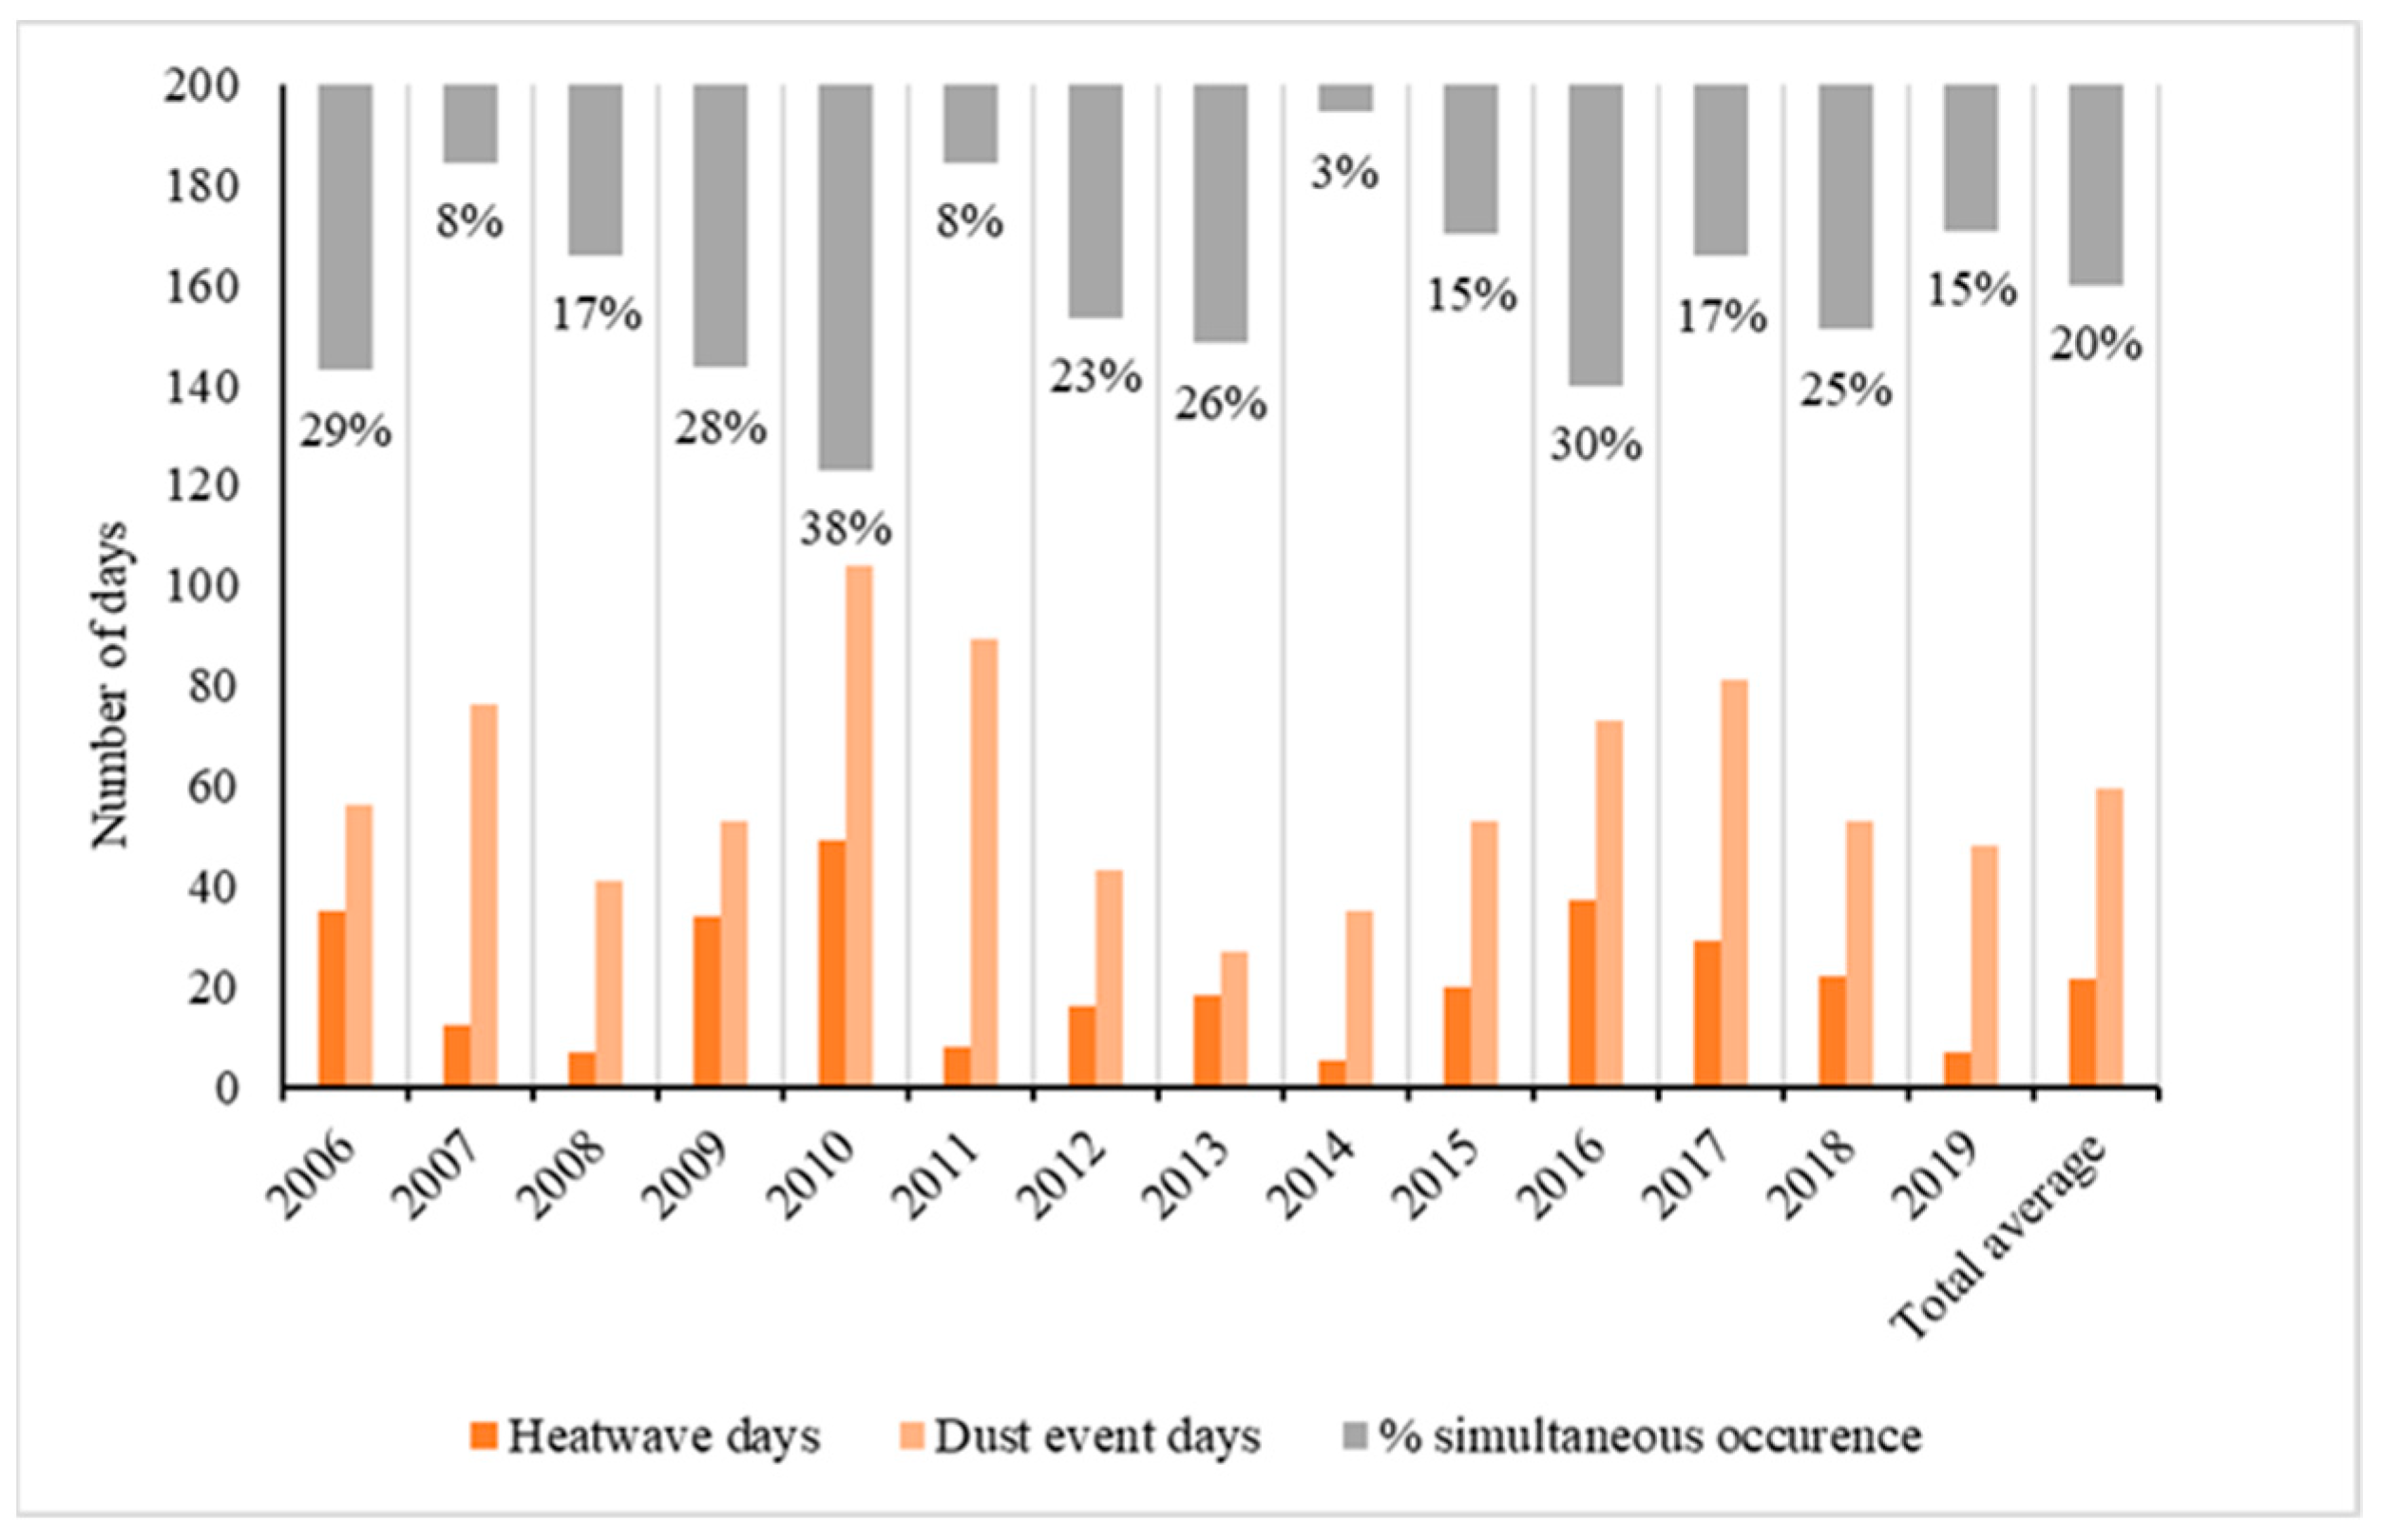
3.2. Air-Quality Deterioration during Heatwaves
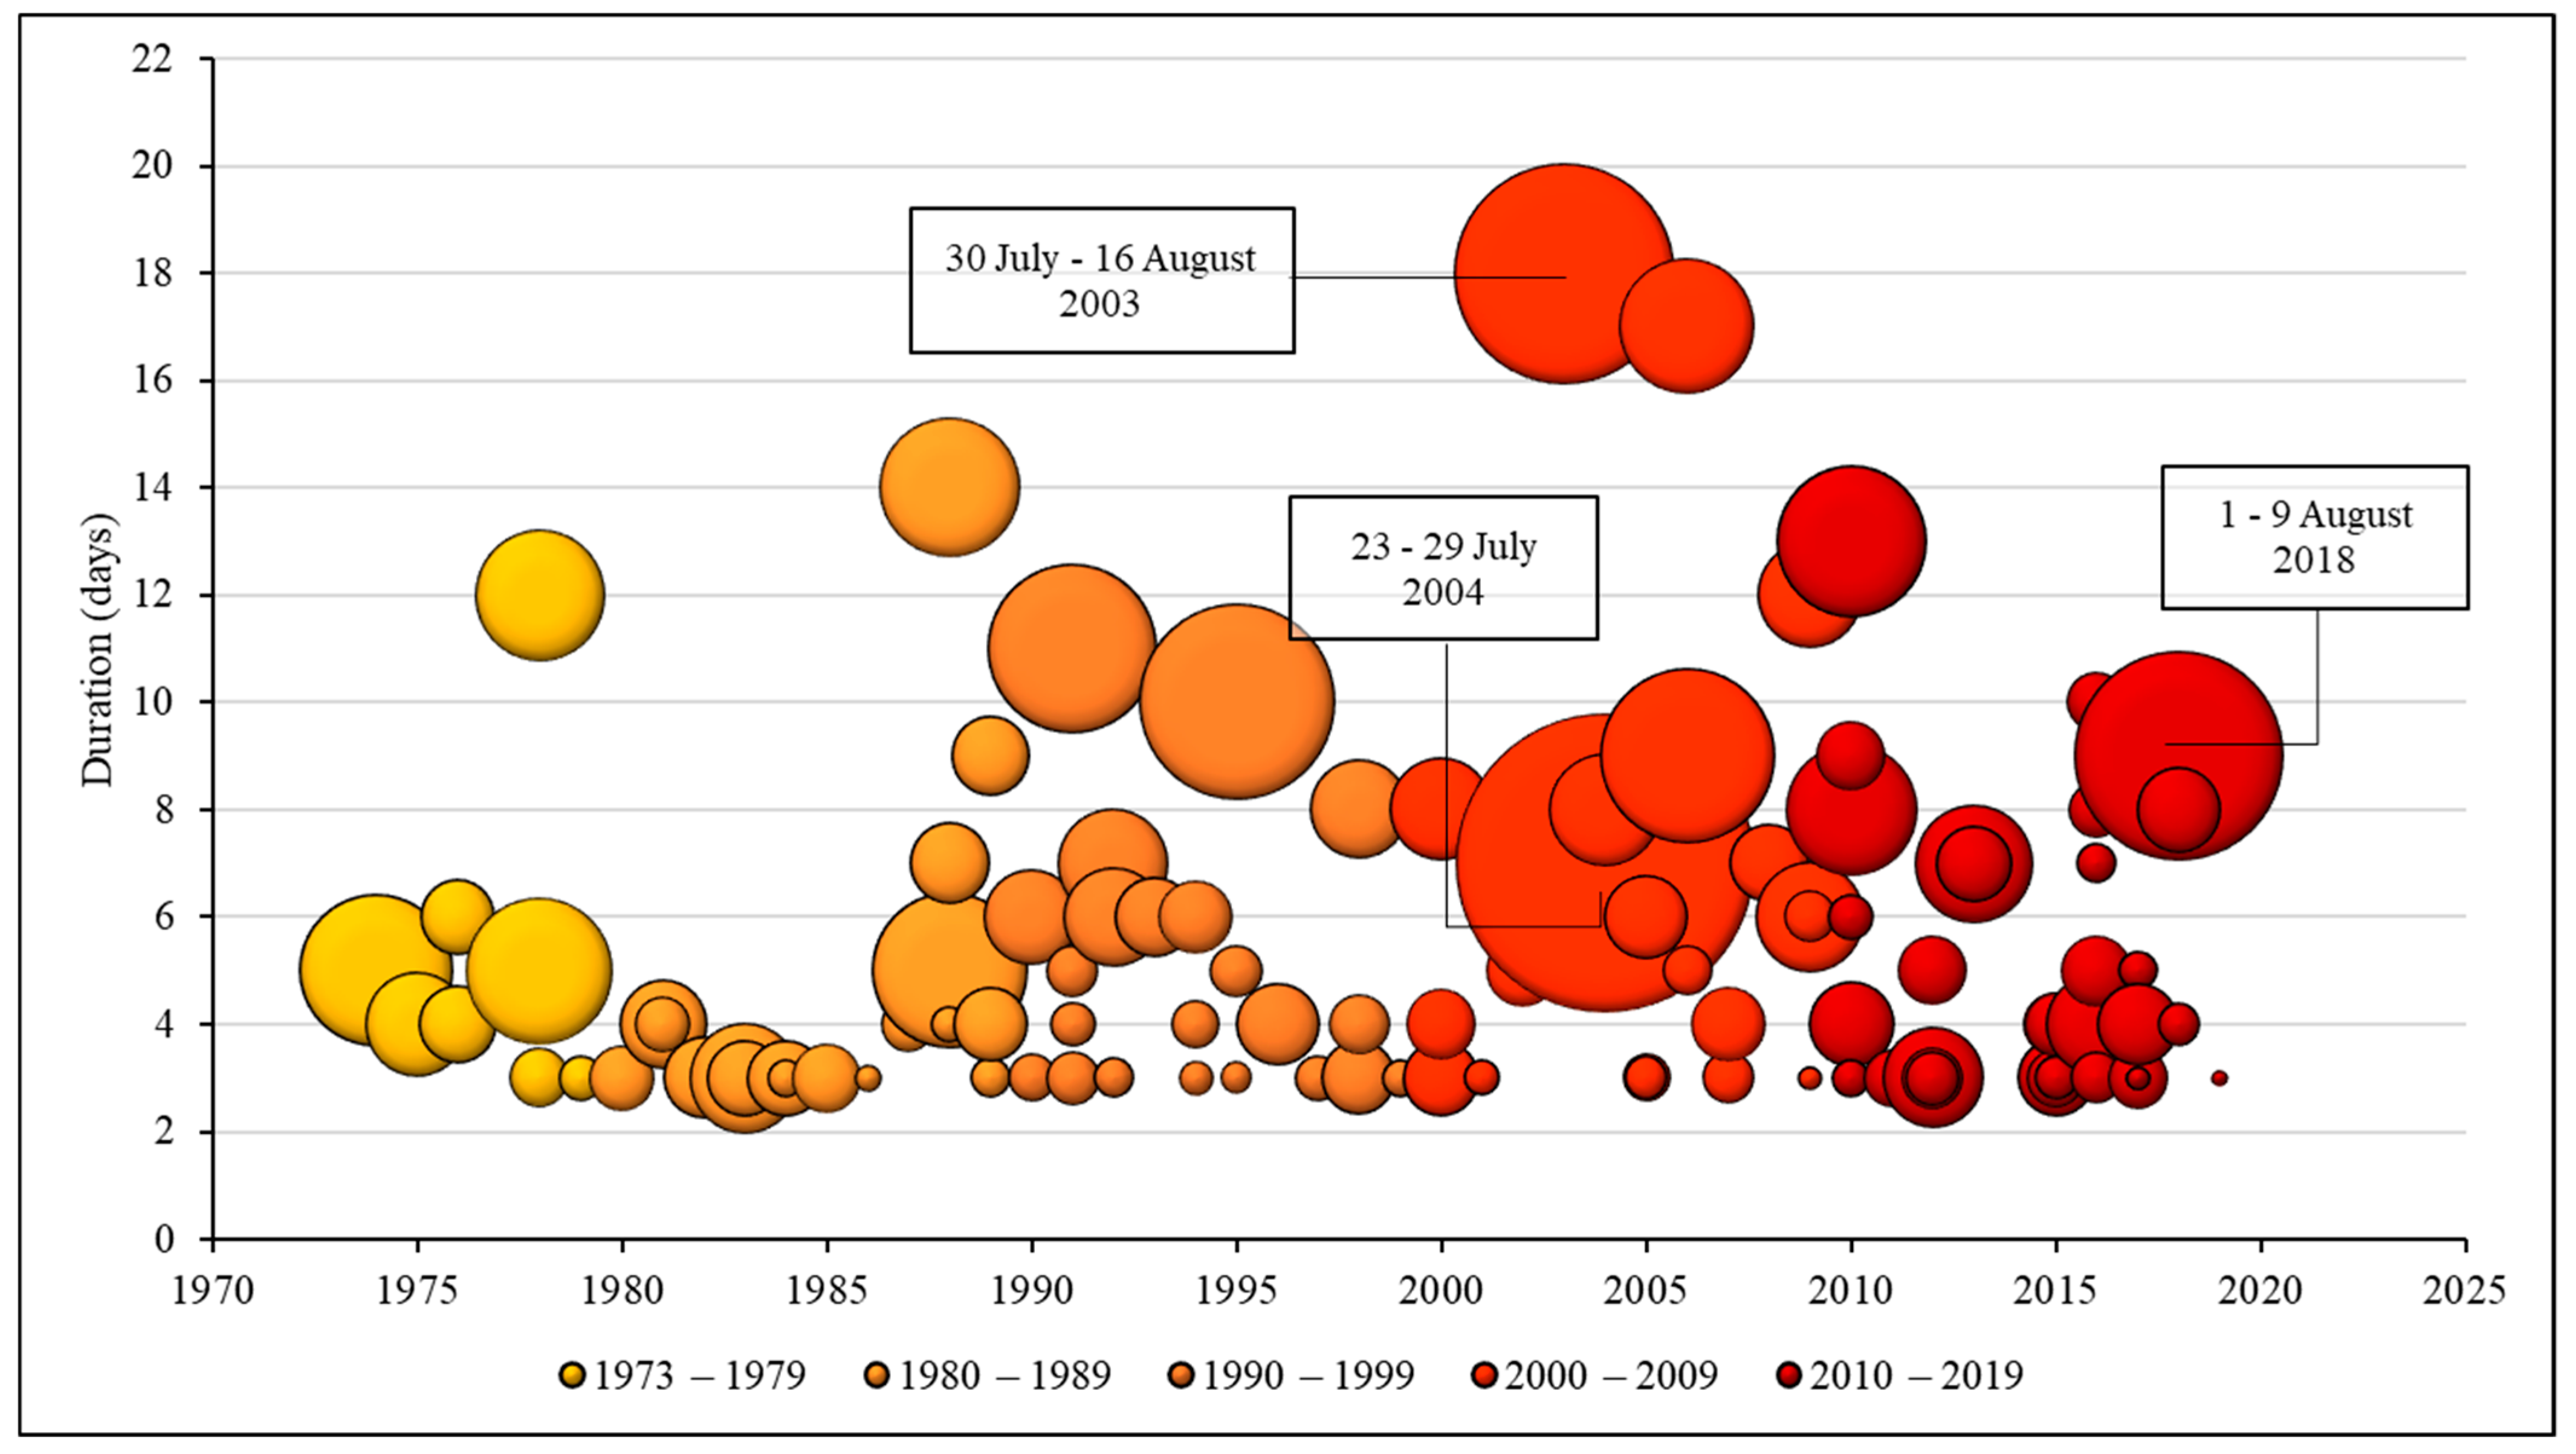
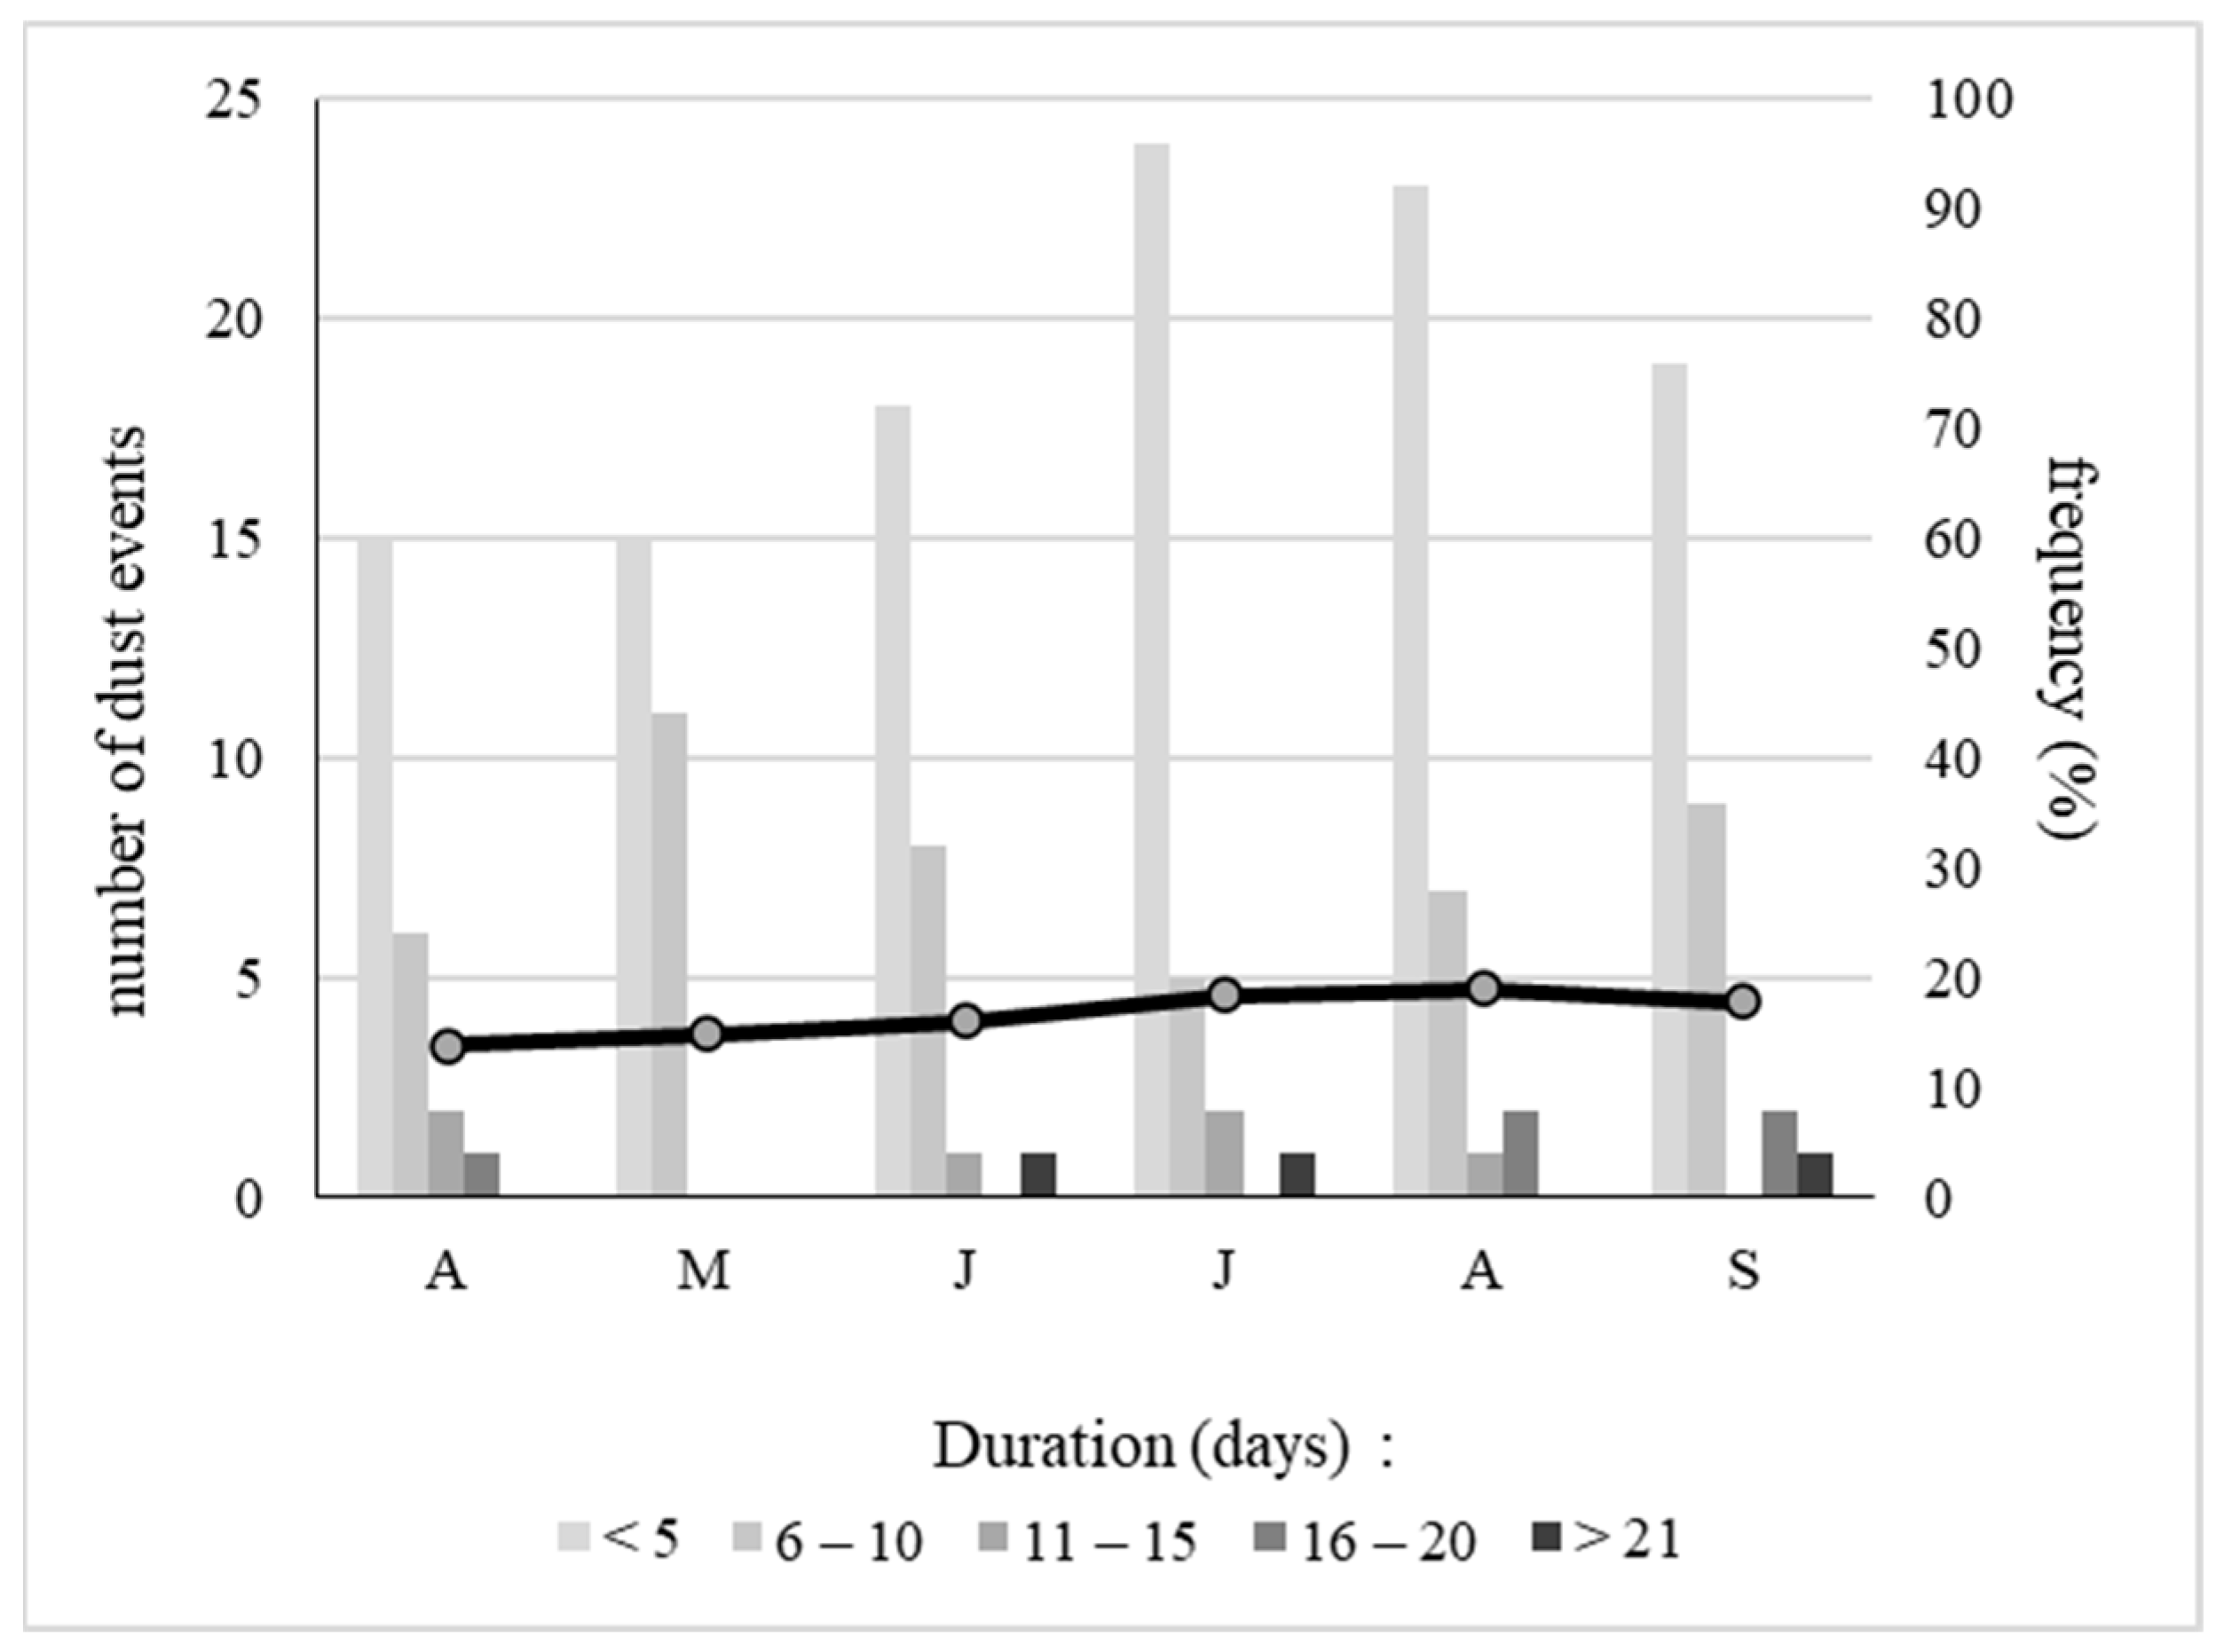
SDE Inventory

The analysis of the Identification and Evaluation Reports of Natural Events in Portugal made it possible to identify 174 dust events from northern Africa in the warm months (AMJJAS) between 2006 and 2019 (Figure 6). The year 2012 had the lowest number of SDE (8), while in 2017, the highest number of events was recorded (20). The year 2017 was classified as extremely hot (especially April, June, and October) and extremely dry (meteorological drought between April and December) [40], with a very severe fire season [40]. According to Figure 3b, 2017 was the year in which the highest number of heatwaves was detected (6); however, in this year, short-duration heatwaves occurred, with less accumulated EHF load. SDE were most frequent in July and August, and most of them had a short duration (under five days). The average SDE duration was around four days. Three of the identified events had a duration of over 21 days: 22 June–17 July 2010 (26 days); 24 July–15 August 2010 (24 days); and 1 September–23 September 2018 (23 days).
Unlike the heatwaves identified by means of the EHF method, the SDE were detected in all the months under study. A similarity observed was that both phenomena have a higher occurrence in the months of July and August.
In the analysis of the number of SDE corresponding to heatwaves, 42 of the SDE were found to occur simultaneously with heatwaves between 2006 and 2019, in other words, less than half.
However, it is important to evaluate the number of days for which SDE were detected in the Algarve air-quality stations and their co-occurrence with heatwave days (EHF > 0). According to Figure 7, 2010 was the year with the most SDE corresponding to heatwave days (38% simultaneous occurrence). Ferreira et al. [41] stated that in 2010, the Algarve was the region with the most SDE in Portugal, and the summer was hot and dry. The heatwave of 2018 (1–9 August), considered one of the most intense of the last decade, also corresponds to an SDE and occurred between 2 and 7 August of the same year.
On average, only 20% of the SDE occurred simultaneously with heatwave days (Figure 7).

3.3. PM10 Legal Exceedances during SDE

A monthly assessment of the PM10 exceedances during SDE was conducted in order to evaluate the air quality during these events between 2011 and 2019. According to the Joaquim de Magalhães urban air quality station (Table 2), there was no daily average value above the legal limit of 50 µg/m3 on any day during SDE in May, July, and September. The highest annual hourly average above 50 µg/m3 and the highest number of consecutive hours with values above 50 µg/m3 were recorded (21 h) in August. However, it was in April that the highest value of the data series was recorded, namely 135.7 µg/m3 (19 April).
At the Cerro rural air quality station (Table 3), April saw the highest number of days with an average value ≥ 50 µg/m3 as well as the highest average hours of days with ≥50 µg/m3 and highest hourly µg/m3 value, occurring on 9 April of 2015. In both stations, August was the month with the most SDE, and this may have increased air-quality deterioration during this month. However, it is for April that both stations show a higher average of hours that exceed the legal PM10 levels. In fact, the 2015 APA report demonstrates that the Algarve region recorded the highest number of African intrusions in April, which may have contributed to greater air-quality deterioration.
Although it would be necessary to evaluate the effect of SDE on the legal exceedances of PM10 (in addition to the African intrusions, this value can be influenced by wildfires, for example), particular attention should be given to the month of August, which presents a greater frequency of events and whose contribution, although not accounted for, may be observed in the increase of PM10 levels in the Algarve region. It is during this month that the population increases substantially due to tourism, and therefore, the deterioration of air quality should be considered in light thereof.

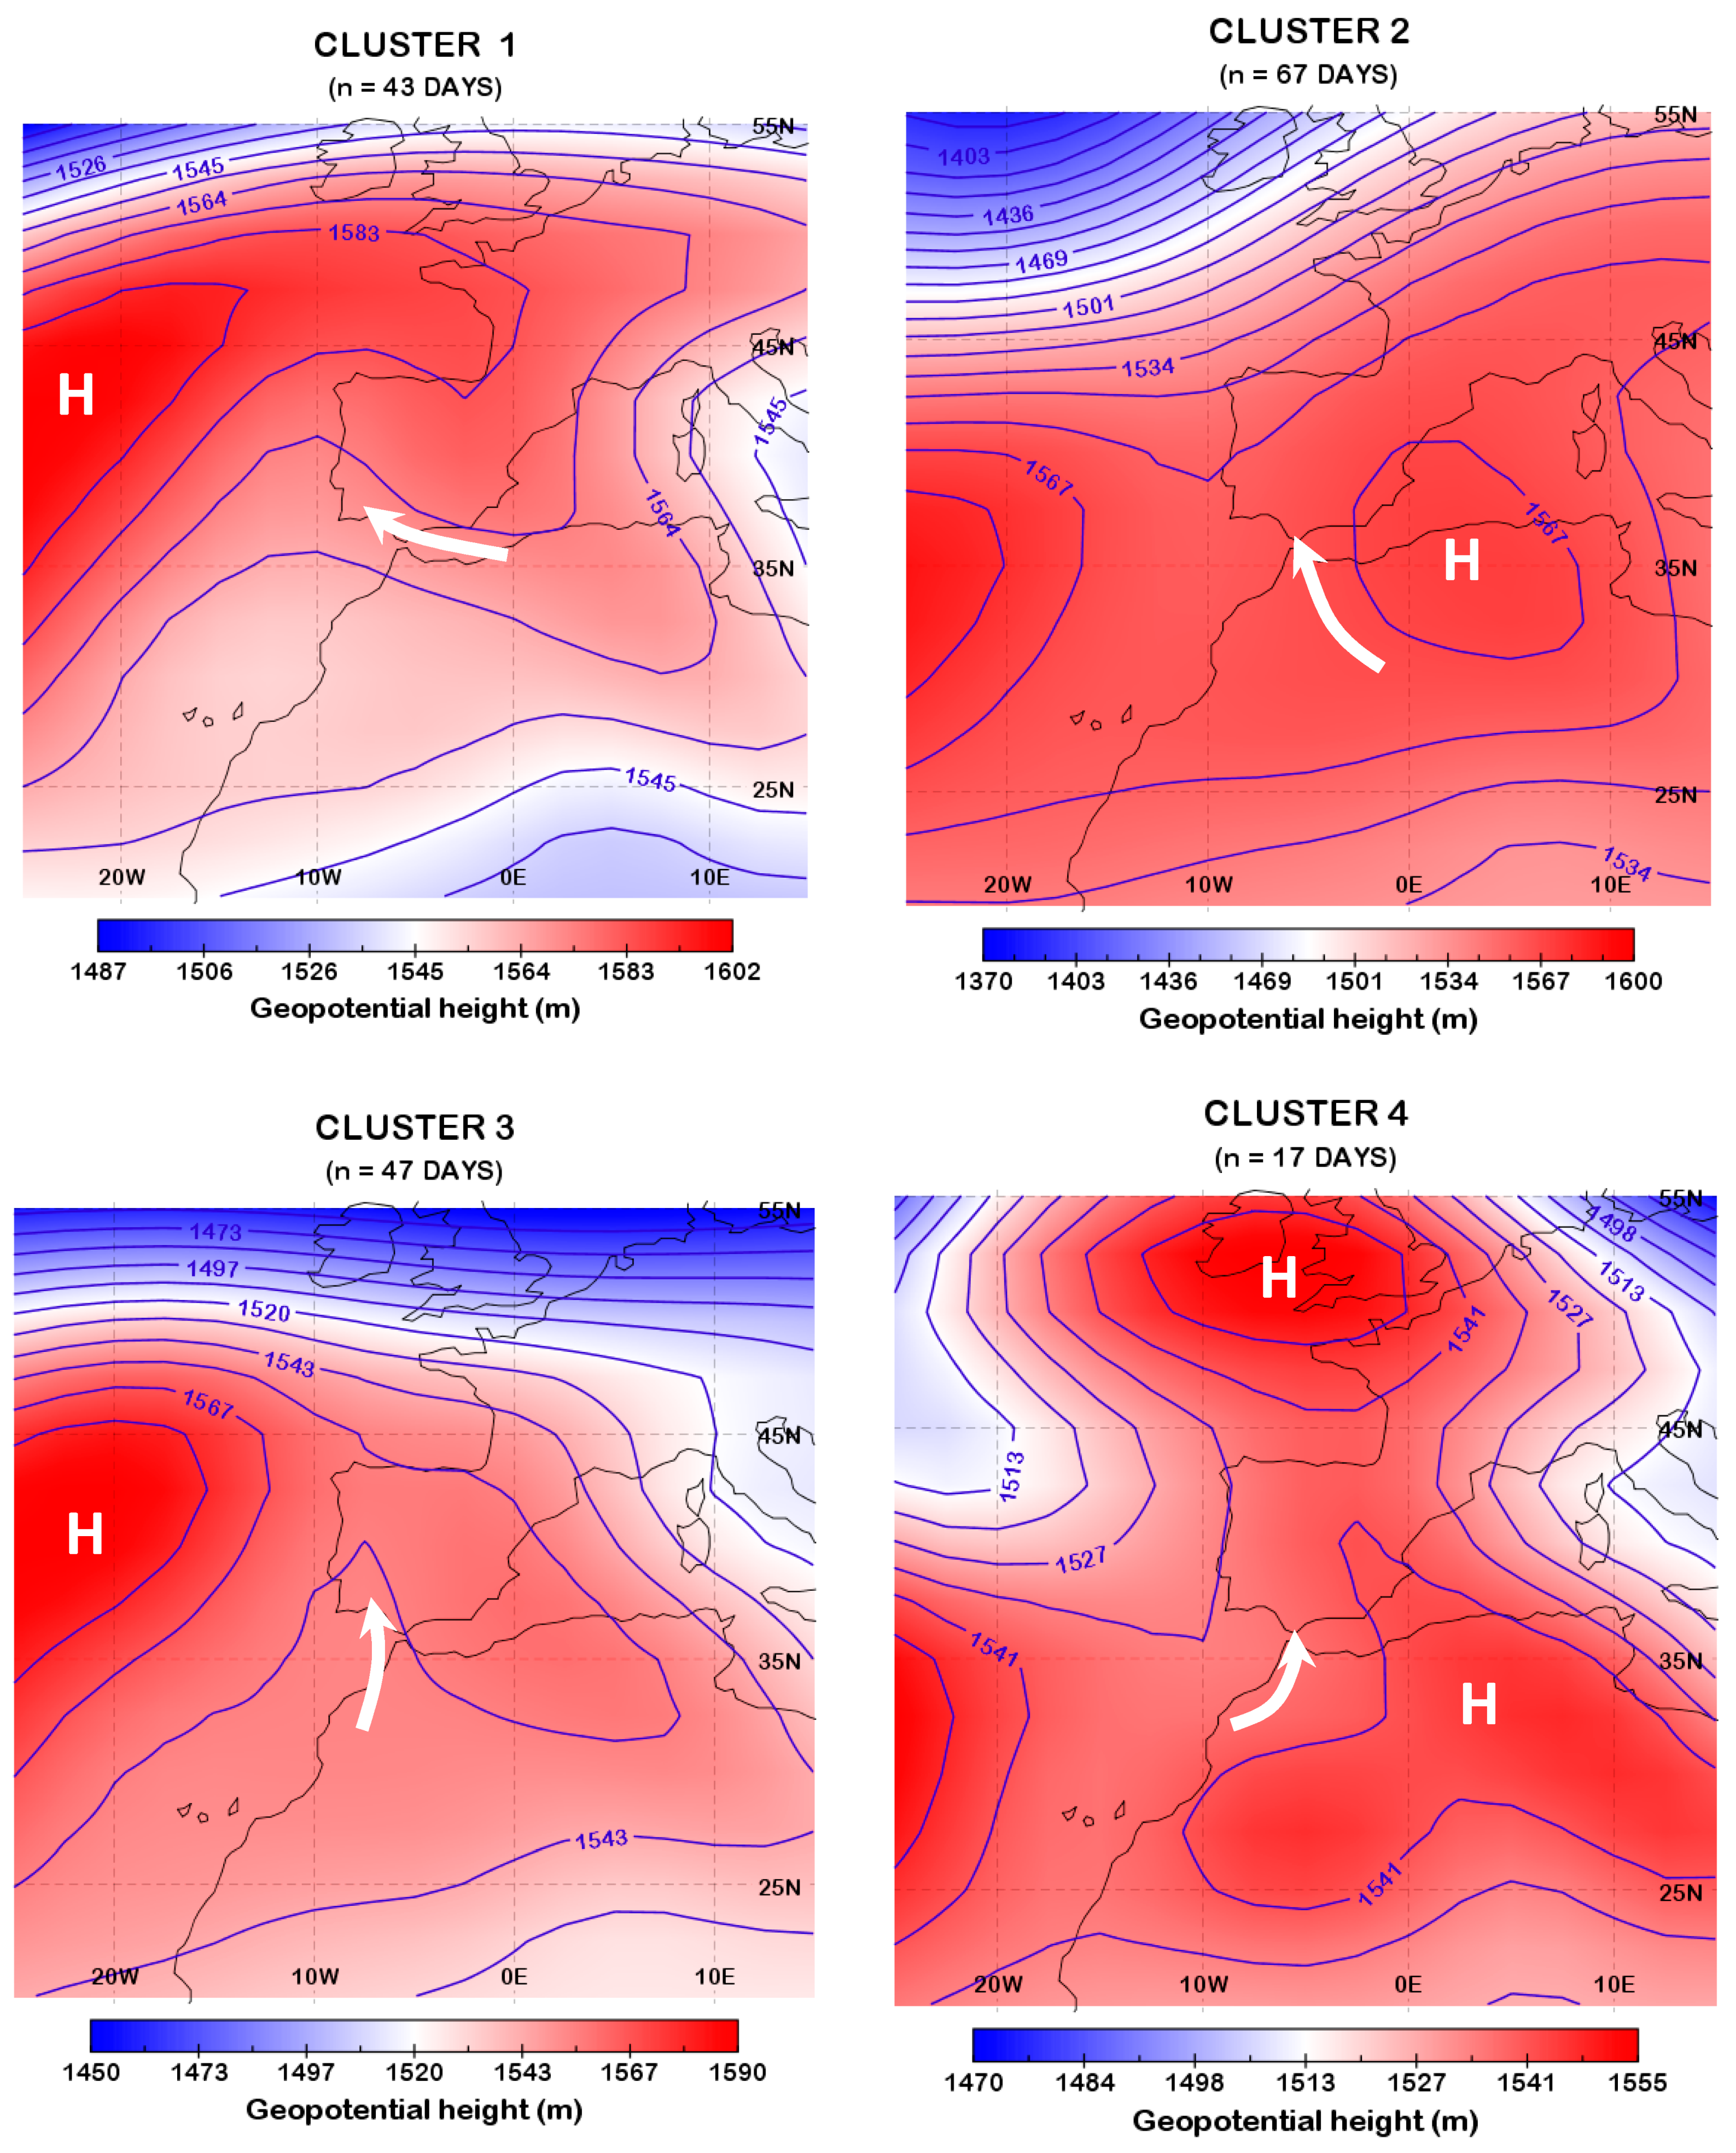
3.4. Atmospheric Patterns

The K-means classification of the atmospheric patterns associated with heatwaves and SD in the Algarve region is depicted in Figure 8. All the clusters exhibit anticyclonic circulations promoting airmass advections from Northern Africa to the southwestern regions of the Iberian Peninsula. The prevalent influence of the subtropical high (Azores anticyclone) in this geographic domain during the summer months explains the relevance of high-pressure centres within the atmospheric circulation associated with heatwaves and SDE in the Algarve region.
Cluster 1 groups 25% of the heatwaves and SD identified over the study period. An anticyclone cantered over the Atlantic area is its most prominent feature, with its eastern margin encompassing the Iberian Peninsula and the north of Morocco and Algeria (Figure 8). This synoptic pattern promotes the south-easterly fluxes responsible for warm air advection and dust transport into the Algarve region.
Cluster 2 includes 38.5% of the heatwaves and SD, thus the most represented of the four. The presence of a high-pressure centre is visible over northern Algeria and the western Mediterranean, ensuring south-easterly or southerly winds that may explain the occurrence of very hot weather and Saharan dust in the study region.
The third identified pattern (Cluster 3) is apparently quite similar to the Cluster 1 scenario, characterized by an Atlantic anticyclone, with its eastern margin overarching the Iberian Peninsula and the northwestern area of Africa. This cluster includes 47 days (27% of the heatwaves and SD days). The configuration of the isohypses clearly suggests the presence of a thermal low located over northern Morocco and southwestern Iberia, which may reinforce the pressure gradient and increase the speed of southerly air fluxes, hence contributing to African warm airmass advection and Saharan dust.
The less frequent pattern (10% of the events) corresponds to Cluster 4. This synoptic type is characterized by the presence of a strong ridge over Western Europe, with two high pressure cores located over the British Islands and northwest Africa (Morocco and Algeria). The position of this great ridge assures the influence of a southerly circulation over southern Portugal, apparently responsible for warm airmass advection (heatwave conditions) and Saharan dust transport.

4. Discussion

4.1. Heatwaves

The Mann–Kendall test showed that the HWF, HWN, and HWD have positive trends in Faro (Algarve), which points to an increase in these variables between 1973 and 2019. These results are in line with studies that have indicated an increase in heatwave frequency and duration in Europe over the last decades [42,43,44,45,46]. Regarding heatwave days (HWF), an increase of 2.5 days/decade was estimated, which is very close to the result obtained by Sánchez-Benítez et al. [45]: +2.6 heatwave days/decade, assessing the 1979–2019 period in the Iberian Peninsula) but lower than the 3.8 days/decade estimated by Lorenzo et al. [46] as an average spatial trend for the Iberian Peninsula territory during the period 1971–2000, also using the EHF. The study of Lorenzo et al. [46] provides the most suitable results for a comparison with the present heatwave analysis, considering its geographical context (the Iberian Peninsula) and methodological approach (EHF and Mann–Kendall test). The trend detected in the number of heatwave events (HWN) in Faro (Algarve) was also statistically significant and evaluated at +0.2 events/decade. This heatwave metric was not assessed by Lorenzo et al. [46]. In the present study, an upward trend in the duration of the longest heatwave (HWD) was also found, assessed at +3.1 days over the 1973–2019 period.
In comparison with other approaches, the EHF method has the advantage of quantifying accumulated excess heat load and is more focused on the effects of heat on human health. However, it is apparent that a longer lasting heatwave is not always more intense (Figure 5) when compared with other longer lasting heatwaves. An example of this is the 2003 heatwave, which is noteworthy for its duration (18 consecutive days in Faro, the longest duration) despite being known for its duration and mortality impacts across Europe [47]. Its intensity was lower in the areas closer to the sea [30], which may explain its sixth position in the ranking of accumulated EHF load values (146 °C2). The longest heatwave of 2003 hit the entire territory of mainland Portugal, but its impacts were greater on inland areas than those close to the Atlantic Ocean [30], which may justify the fact that Faro does not have a higher accumulated EHF load, while the southern region of Alentejo (interior of Portugal) registered an outstanding sequence of extremely hot days [30].
As may be observed in Figure 5, it is the 2004 heatwave that stands out for its intensity or higher integrated EHF (266 °C2). The 2004 heatwave particularly affected the Algarve region [48] not only due to its duration but most notably its intensity, recording the highest maximum temperature of the long-term data under study: 45 °C (25 July). In fact, the highest EHF values were recorded in 2004 (Figure 4). Conversely, despite the 2018 heatwave being considered the third most intense, studies have revealed that this event did not have a significant impact on mortality in the Algarve region [49].

4.2. Saharan Dust Events (SDE)

From April to September, SDE were detected in Faro, mostly with a duration of less than five consecutive days. In the Mediterranean, the relationship between heatwaves and SDE is acknowledged, especially in the summer months [31,50]. Our results show that, on a yearly basis, heatwaves and SDE occur simultaneously only on an average of 20% of the days. Other studies demonstrated that air masses from the North of Africa transport dust that can lead to an increase of PM10 in the atmosphere in Portugal and other Mediterranean countries [17,23,50]. During the identified SDE, around 20 days exceeded the legal values of PM10 between 2011 and 2019 at both air quality stations. However, a further study in order to determine the weight of SDE in the increase of PM10 in the atmosphere is necessary as is further research into the role of the heatwave’s mechanisms in this possible increase and concentration of particles.

4.3. Atmospheric Patterns of Heatwave and Dust Days

Sousa et al. (2019) [31] already showed that dust intrusions can be a relevant mechanism to trigger heatwaves in Southern Iberia. However, so far, no systematic study had been conducted in this region to identify the main atmospheric patterns responsible for the simultaneous occurrence of dust and warm air advections. The present analysis brought clearer evidence about the atmospheric patterns that promote this combination of anomalous weather conditions. Four distinct patterns were identified as the most prominent synoptic circulations that promoted both heatwave conditions and North African dust over the Algarve during the hot season (April–September). An alternative number of clusters (three and five) was assessed, but it did not provide a better distinction of the atmospheric patterns. All four atmospheric types (850 hPa level) are associated with strong subtropical ridges, inhibiting the presence of cloudiness, hence assuring high insolation and hot weather persistence. The analysis of these atmospheric patterns (Figure 8) also revealed the importance of the synoptic circulations responsible for southerly winds in the lower troposphere (850 hPa), which are essential to drive the transport of dust plumes from northern Africa to the Algarve region. These findings are clearly in line with the results obtained in the study by Huerta-Viso et al. [39] on the dust intrusions over the Valencia region (Spain). Considerable similarities were found between the identified patterns and the prevalent meteorological scenarios during the summer months (C1, C3, and C5) determined by Huerta-Viso et al. [39]. Furthermore, it should also be noted that the four atmospheric patterns identified in the present study may be seen as different variants or types of synoptic circulation associated with the influence of a North African high at the upper levels, described as “Scenario 4” in the research of Escudero et al. [51] and also described by these authors as “the most frequent scenario causing dust outbreaks over Iberia (…) produced by intense heating of the Sahara and the consequent development of the North African thermal low” (p. D18S08). Salvador et al. [37] also highlighted this general synoptic situation (referred to as “type IV” by the authors in their classification) as the most typical in summer, characterized by an “intense North African high over northeastern Algeria and Tunisia, advecting warm African air masses onto the Iberian Peninsula from southern and southeastern areas” (p. 6765).

5. Conclusions

Heatwaves in Southwestern Europe where the Algarve region is included may sometimes be induced by the transport of hot air masses from North Africa, as highlighted by Theoharatos et al. [52] in their study on heatwaves in Greece in 2007. Papanastasiou et al. [50] stated that the exceedance of air-quality standards correlates well with the annual number of heatwave days and the accumulation of particles favoured by the atmospheric conditions that prevail during this phenomenon.
Although there are other heatwaves definitions, the EHF method was chosen to identify heatwaves at Faro (Algarve). Between 1973 and 2019, the EHF method enabled the identification of 722 heatwave days and 113 heatwaves. The Mann–Kendall test revealed that three heatwave metrics (HWF, HWN, HWD) exhibited positive and statistically significant trends over the 1973–2019 period, i.e., for the last 47 years, these variables have been on an upward trend in Faro. The trend of the accumulated heat load (EHF load) is also positive as would be expected, but its magnitude is not statistically significant. The heatwaves with the highest accumulated EHF load occurred in the 2000–2009 and 2010–2019 decades. The EHF method identified the most intense and durable heatwaves in the Algarve region with precision.
The APA reports made it possible to identify 174 SDE between 2006 and 2019, mostly in August, which corresponds to the second month with the most heatwaves. Around 20% of SDE occur simultaneously with heatwave days. Additionally, in August, both air-quality stations recorded daily and hourly exceedances of the legal values of PM10 during the SDE. These exceedances may be related to the African dust intrusions identified, but a more in-depth analysis should be conducted in order to ascertain the relevance of SDE in explaining the daily exceedances of PM10. On the other hand, air quality during heatwaves can be affected by wildfires, but this contribution was not assessed in this study, which is also a limitation. Finally, in a novel classification, four distinct atmospheric scenarios promoting heatwave conditions and Saharan dust intrusions in the Algarve were identified and assessed. Warm air advections and Saharan dust transport affecting this region are both possible under different synoptic circulation patterns mainly controlled by strong subtropical anticyclonic ridges over the Northwestern Africa.

Author Contributions

R.F. and M.F.; R.F. developed all the research on heatwaves and Saharan dust intrusions, including the statistical analysis and illustration (Figure 1, Figure 2, Figure 3, Figure 4, Figure 5, Figure 6 and Figure 7); M.F. carried out the section on the atmospheric circulation patterns, including the illustration (Figure 8). R.F. wrote the first draft version of the paper; R.F. and M.F. worked together on the revisions to produce the final version of the paper. Both authors have read and agreed to the published version of the manuscript.

Funding

This study stems from the project “Saharan dust events and impacts on health in Portugal and Morocco (GEOSAHARA), Programme for Cooperation in Science between Portugal and Morocco (2019/2020). This research was also funded by FCT (Fundação para a Ciência e Tecnologia), grant number (SFRH/BD/146757/2019), and the ZEPHYRUS research group of the CEG/IGOT—Universidade de Lisboa (UIDB/00295/2020 and UIDP/00295/2020).

Institutional Review Board Statement

Not applicable.

Informed Consent Statement

Not applicable.

Data Availability Statement

Publicly available datasets were analysed in this study.

Acknowledgments

The authors are grateful to the reviewers for many valuable suggestions, which helped improve the manuscript.

Conflicts of Interest

The authors declare no conflict of interest.

References

  1. Meehl, G.; Tebaldi, C. More intense, more frequent, and longer lasting heat waves in the 21st century. Science 2004, 305, 994–997. [Google Scholar] [CrossRef] [PubMed] [Green Version]
  2. Perkins, S. Review on the scientific understanding of heatwaves—Their measurement, driving mechanisms, and changes at the global scale. Atmos. Res. 2015, 164, 242–267. [Google Scholar] [CrossRef]
  3. DGS. Plano de Contingência Para Temperaturas Extremas Adversas. In Módulo Calor 2014; Divisão de Saúde Ambiental e Ocupacional, Direção de Serviços de Prevenção da Doença e Promoção da Saúde: Lisboa, Portugal, 2014. [Google Scholar]
  4. D’Ippoliti, D.; Michelozzi, P.; Marino, C.; de’Donato, F.; Menne, B.; Katsouyanni, K.; Kirchmayer, U.; Analitis, A.; Medina-Ramón, M.; Paldy, A.; et al. The impact of heat waves on mortality in 9 European cities: Results from the EuroHEAT project. Environ. Health 2010, 16, 9–37. [Google Scholar] [CrossRef] [Green Version]
  5. IPCC. Managing the Risks of Extreme Events and Disasters to Advance Climate Change Adaptation: A Special Report of Working Groups I and II of the Intergovernmental Panel on Climate Change; Cambridge University Press: Cambridge, UK; New York, NY, USA, 2012; p. 582. [Google Scholar]
  6. Stafoggia, M.; Forastiere, F.; Agostini, D.; Biggeri, A.; Bisanti, L.; Cadum, E.; Caranci, N.; de’ Donato, F.; de Lisio, S.; de Maria, M.; et al. Vulnerability to heat-related mortality: A multicity, population-based, case-crossover analysis. Epidemiolog 2006, 17, 315–323. [Google Scholar] [CrossRef]
  7. Kovats, R.; Ebi, K. Heatwaves and public health in Europe. Eur. J. Public Health 2006, 16, 592–599. [Google Scholar] [CrossRef] [Green Version]
  8. Nitschke, M.; Tucker, G.; Hansen, A.; Williams, S.; Zhang, Y.; Bi, P. Impact of two recent extreme heat episodes on morbidity and mortality in Adelaide, South Australia: A case-series analysis. Environ. Health 2011, 10, 42. [Google Scholar] [CrossRef] [PubMed] [Green Version]
  9. Son, J.; Lee, J.; Anderson, G.; Michelle, L. The Impact of Heat Waves on Mortality in Seven Major Cities in Korea. Environ. Health Perspect. 2012, 120, 566–571. [Google Scholar] [CrossRef] [Green Version]
  10. Paixão, E.; Nogueira, P. Efeitos de uma onda de calor na mortalidade. Rev. Port. Saúde Pública 2003, 21, 41–54. [Google Scholar]
  11. Calado, R.; Nogueira, P.; Catarino, J.; Paixão, E.; Botelho, J.; Carreira, M.; Falcão, J. A onda de calor de agosto de 2003 e os seus efeitos sobre a mortalidade da população portuguesa. Rev. Port. Saúde Pública 2004, 22, 7–20. [Google Scholar]
  12. Nogueira, P.; Falcão, J.; Contreiras, M.; Paixão, E.; Brandão, J.; Batista, I. Mortality in Portugal associated with the heat wave of August 2003: Early estimation of effect, using a rapid method. Eurosurveillance 2005, 10, 553. [Google Scholar] [CrossRef]
  13. Nairn, J.; Fawcett, R.; Ray, D. Defining and predicting excessive heat events: A national system. In Proceedings of the Modelling and Understanding High Impact Weather: Extended Abstracts of the Third CAWCR Modelling Workshop, Melbourne, Australia, 30 November–2 December 2009; Volume 17, pp. 83–86. [Google Scholar]
  14. Tolika, K. Assessing Heat Waves over Greece Using the Excess Heat Factor (EHF). Climate 2019, 7, 9. [Google Scholar] [CrossRef] [Green Version]
  15. Urban, A.; Hanzlíková, H.; Kyselý, J.; Plavcová, E. Impacts of the 2015 heat waves on mortality in the Czech Republic—A comparison with previous heat waves. Int. J. Environ. Res. Public Health 2017, 14, 1562. [Google Scholar] [CrossRef] [Green Version]
  16. Pascal, M.; Wagner, V.; Alari, A.; Corso, M.; Tertre, A. Extreme heat and acute air pollution episodes: A need for joint public health warnings? Atmos. Res. 2021, 249, 118249. [Google Scholar]
  17. Pey, J.; Querol, X.; Alastuey, A.; Forastiere, F.; Stafoggia, M. African dust outbreaks over the Mediterranean Basin during 2001–2011: PM10 concentrations, phenomenology and trends, and its relationship with synoptic and mesoscale meteorology. Atmos. Chem. Phys. 2013, 13, 1395–1410. [Google Scholar] [CrossRef] [Green Version]
  18. Díaz, J.; Linares, C.; Carmona, R.; Russo, A.; Ortiz, C.; Salvador, P.; Trigo, R. Saharan dust intrusions in Spain: Health impacts and associated synoptic conditions. Environ. Res. 2017, 156, 455–467. [Google Scholar] [CrossRef] [PubMed]
  19. Waters, S.; Armstrong, R.; Detres, Y. Metagenomic investigation of African dust events in the Caribbean. FEMS Microbiol. Lett. 2020, 367, fnaa051. [Google Scholar] [CrossRef] [PubMed]
  20. Fischer, P.; Brunekreef, B.; Lebret, E. Air pollution related deaths during the 2003 heat wave in the Netherlands. Atmos. Environ. 2004, 38, 1083–1085. [Google Scholar] [CrossRef]
  21. Stedman, J. The predicted number of air pollution related deaths in the UK during the August 2003 heatwave. Atmos. Environ. 2004, 38, 1087–1090. [Google Scholar] [CrossRef]
  22. Russo, A.; Sousa, P.; Durão, R.; Ramos, A.; Salvador, P.; Linares, C.; Díaz, J.; Trigo, R. Saharan dust intrusions in the Iberian Peninsula: Predominant synoptic conditions. Sci. Total Environ. 2020, 717, 137041. [Google Scholar] [CrossRef]
  23. Silva, T.; Fragoso, M.; Almendra, R.; Vasconcelos, J.; Lopes, A.; Faleh, A. North African dust intrusions and increased risk of respiratory diseases in Southern Portugal. Int. J. Biometeorol. 2021. [Google Scholar] [CrossRef]
  24. Statistics Portugal—Tourism Statistics. Available online: https://www.ine.pt/xportal/xmain?xpgid=ine_tema&xpid=INE&tema_cod=1713 (accessed on 6 July 2021).
  25. Conti, S.; Meli, P.; Minelli, G.; Solimini, R.; Taccaceli, V.; Vichi, M.; Beltrano, C.; Perini, L. Epidemiologic study of mortality during the Summer 2003 heat wave in Italy. Environ. Res. 2005, 98, 390–399. [Google Scholar] [CrossRef]
  26. Tan, J.; Zheng, Y.; Song, G.; Kalkstein, L.; Kalkstein, A.; Tang, X. Heat waves impacts on mortality in Shanghai, 1998 and 2003. Int. J. Biometeorol. 2007, 51, 193–200. [Google Scholar] [CrossRef] [PubMed]
  27. Li, M.; Gu, S.; Peng, B.; Yang, J.; Qiyong, L. Heat waves and morbidity: Current knowledge and futher direction—A comprehensive literature review. Environ. Res. Public Health 2015, 12, 5256–5283. [Google Scholar] [CrossRef] [PubMed] [Green Version]
  28. Ferreira, D. Oambiente Climático in Geografia de Portugal 1; Círculo de Leitores: Lisboa, Portugal, 2005. [Google Scholar]
  29. Cunha, L. Riscos climáticos no Centro de Portugal. Uma leitura geográfica. Rev. Geonorte 2012, 4, 105–115. [Google Scholar]
  30. Trigo, R.; Ramos, A.; Nogueira, P.; Santos, F.; Garcia-Herrera, R.; Gouveia, C.; Santo, F. Evaluating the impact of extreme temperature-based indices in the 2003 heatwave excessive mortality in Portugal. Environ. Sci. Policy 2009, 12, 844–854. [Google Scholar] [CrossRef]
  31. Sousa, P.; Barriopedro, D.; Ramos, A.; García-Herrera, R.; Espírito-Santo, F.; Trigo, R. Saharan air intrusions as a relevant mechanism for Iberian heatwaves: The record-breaking events of August 2018 and June 2019. Weather Clim. Extrem. 2019, 26, 100224. [Google Scholar] [CrossRef]
  32. Ferreira, F.; Monjardino, J.; Mendes, L. Identificação e Avaliação de Eventos Naturais no ano de 2015; Report; Agência Portuguesa do Ambiente: Amadora, Portugal, 2016. [Google Scholar]
  33. Decree—Law 102/2010 of 23 September of the Committee on the Environment and Territorial Planning. Diário da República: I Série, Nº 186. 2010. Available online: https://data.dre.pt/eli/dec-lei/102/2010/09/23/p/dre/pt/html (accessed on 1 April 2021).
  34. Nairn, J.; Fawcett, R. The Excess Heat Factor: A Metric for Heatwave Intensity and Its Use in Classifying Heatwave Severity. Environ. Res. Public Health 2015, 12, 227–253. [Google Scholar] [CrossRef] [PubMed] [Green Version]
  35. Barbieri, L.; Correia, M.; Aragão, M.; Vilar, R.; Moura, M. Impact of Climate Variations and Land Use Change: A Mann-Kendall Application. Rev. Geama 2017, 3, 127–135. [Google Scholar]
  36. Christiansen, B. Atmospheric Circulation Regimes: Can Cluster Analysis Provide the Number? J. Clim. 2007, 20, 2229–2250. [Google Scholar] [CrossRef]
  37. Salvador, P.; Alonso-Pérez, S.; Pey, J.; Artíñano, B.; de Bustos, J.; Alastuey, A.; Querol, X. African dust outbreaks over the western Mediterranean Basin: 11-year characterization of atmospheric circulation patterns and dust source areas. Atmos. Chem. Phys. 2014, 14, 6759–6775. [Google Scholar] [CrossRef] [Green Version]
  38. Alonzo-Pérez, S.; Cuevas, E.; Querol, X. Objective identification of synoptic meteorological patterns favouring African dust intrusions into the marine boundary layer of the subtropical eastern north Atlantic region. Meteorol. Atmos. Phys. 2011, 113, 109–124. [Google Scholar] [CrossRef]
  39. Huerta-Viso, A.; Crespo, J.; Galindo, N.; Yubero, E.; Nicolás, J. Saharan Dust Events over the Valencian Community (Eastern Iberian Peninsula): Synoptic Circulation Patterns and Contribution to PM10 Levels. Aerosol Air Qual. Res. 2020, 20, 2519–2528. [Google Scholar] [CrossRef]
  40. Ferreira, F.; Monjardino, J.; Mendes, L. Identificação e Avaliação de Eventos Naturais no ano de 2018; Report; Agência Portuguesa do Ambiente: Amadora, Portugal, 2018. [Google Scholar]
  41. Ferreira, F.; Monjardino, J. Identificação e Avaliação de Eventos Naturais no ano de 2010; Report; Agência Portuguesa do Ambiente: Amadora, Portugal, 2011. [Google Scholar]
  42. Perkins, S.; Alexander, L.; Nairn, J. Increasing frequency, intensity and duration of observed global heatwaves and warm spells. Geophys. Res. Lett. 2012, 39. [Google Scholar] [CrossRef]
  43. Stefanon, M.; D’Andrea, F.; Drobinski, P. Heatwave classification over Europe and the Mediterranean region. Environ. Res. Lett. 2012, 7, 014023. [Google Scholar] [CrossRef]
  44. Perkins-Kirkpatrick, S.; Lewis, S. Increasing trends in regional heatwaves. Nat. Commun. 2020, 11, 3357. [Google Scholar] [CrossRef]
  45. Sánchez-Benítez, A.; Barriopedro, D.; García-Herrera, R. Tracking Iberian heatwaves from a new perspective. Weather Clim. Extrem. 2020, 28, 100238. [Google Scholar] [CrossRef]
  46. Lorenzo, N.; Díaz-Poso, A.; Royé, D. Heatwave intensity on the Iberian Peninsula: Future climate projections. Atmos. Res. 2021, 258, 105655. [Google Scholar] [CrossRef]
  47. Charpentier, A. On the Return Period of the 2003 Heat Wave. Clim. Chang. 2011, 109, 245–260. [Google Scholar] [CrossRef]
  48. Falcão, J.; Paixão, E.; Nogueira, P.; Nunes, B. A onda de Calor de Julho de 2004: Efeitos Sobre a Mortalidade na Região do Algarve; Estimativas Preliminares, Instituto de Saúde Dr. Ricardo Jorge: Lisboa, Portugal, 2004. [Google Scholar]
  49. Torres, A.; Silva, S.; Nunes, B.; Rodrigues, A. Excesso de mortalidade em Portugal associado ao período de calor extremo em agosto de 2018: Um instrumento ao serviço da intervenção em saúde pública. In Boletim Epidemiológico; Instituto Nacional de Saúde Doutor Ricardo Jorge: Lisboa, Portugal, 2020; Volume 26, pp. 9–13. [Google Scholar]
  50. Papanastasiou, D.; Melas, D.; Kambezidis, H. Heat waves characteristics and their relation to air quality in Athens. Glob. NEST J. 2014, 16, 919–928. [Google Scholar]
  51. Escudero, M.; Castillo, S.; Querol, X.; Avila, A.; Alarcón, M.; Viana, M.; Alastuey, A.; Cuevas, E.; Rodríguez, S. Wet and dry African dust episodes over eastern Spain. J. Geophys. Res. 2005, 110, D18. [Google Scholar] [CrossRef] [Green Version]
  52. Theoharatos, G.; Pantavou, K.; Mavrakis, A.; Spanou, A.; Katavoutas, G.; Efstathiou, P.; Mpekas, P.; Asimakopoulos, D. Heat waves observed in 2007 in Athens, Greece: Synoptic conditions, bioclimatological assessment, air quality levels and health effects. Environ. Res. 2010, 110, 152–161. [Google Scholar] [CrossRef] [PubMed]
Figure 1. Maximum and minimum mean temperature and mean precipitation in the Algarve (1971–2000). Source: Portal do Clima, climate statistics 1971–2000, IPMA.
Atmosphere 12 01090 g001
Figure 2. Study area location. Source: base map GADM (https://gadm.org/, accessed on 15 April 2021).
Atmosphere 12 01090 g002
Figure 3. Annual trends of heatwaves in Faro (1973–2019). Number of heatwave days (a); number of heatwaves (b); longest heatwave duration (c). The values indicated in the boxes represent the Sen’s slope per decade.
Atmosphere 12 01090 g003
Figure 4. Annual trend of the accumulated Excess Heat Factor load for each heatwave in Faro (1973–2019). The value indicated in the box represent the Sen’s slope per decade.
Atmosphere 12 01090 g004
Figure 5. Relationship between heatwaves duration and EHF load (°C2). The size of the bubbles depends on the EHF load of each heatwaves, i.e., the larger their size, the greater the accumulated Excess Heat load.
Atmosphere 12 01090 g005
Figure 6. Number of Saharan dust events (SDE) of the hot season (April–September) identified in the study period (2006–2019) and their duration (days). The black line represents the percentage of events occurred at each month in study.
Atmosphere 12 01090 g006
Figure 7. Interannual distribution of heatwaves and SD days and their simultaneous occurrence between 2006 and 2019.
Atmosphere 12 01090 g007
Figure 8. Atmospheric patterns (850 hPa geopotential height) related to the clusters of heatwave and SD days (2006–2019 period). The arrows indicate the direction of the airflow and “H” letters indicate the position of main high-pressure cores.
Atmosphere 12 01090 g008
Table 1. Mann–Kendall test results for HWF (heatwaves days), HWN (heatwaves number), and HWD (longest heatwave duration).
Mann–Kendall Trend Test
VariableZp-ValueSen’s Slope
Heatwave days (HWF)2.430.015+0.250
Heatwave number (HWN)2.040.041+0.023
Longest heatwave duration (HWD)1.940.053+0.065
EHF load1.090.065+0.507
H0: there is no trend in the series; should be rejected if the p-value is lower the significant level alpha = 0.05.
Table 2. Legal exceedances of the PM10 values for the Joaquim de Magalhães urban air quality station at the SDE between 2011 and 2019.
Joaquim de Magalhães
Dust Events DaysDays with Average Value ≥ 50 µg/m3Average Hours ≥ 50 µg/m3Maximum Number of Consecutive Hours ≥ 50 µg/m3Highest Hourly Value µg/m3
April7311718135.47
May71011289.9
June922102178.8
July68061277.2
August10211924100.2
September96051072.4
Table 3. Legal exceedances of the PM10 values for the Cerro rural air quality station at the SDE between 2011 and 2019.
Cerro
Dust Events DaysDays with Average Value ≥ 50 µg/m3Average Hours with ≥ 50 µg/m3Maximum Number of Consecutive Hours ≥ 50 µg/m3Highest Hourly Value µg/m3
April7382721244.2
May7102576.9
June92372291
July68068119.2
August10252324129.9
September9600.2150.7
Publisher’s Note: MDPI stays neutral with regard to jurisdictional claims in published maps and institutional affiliations.

