Article

Raindrop Size Spectrum in Deep Convective Regions of the Americas

1
Department of Atmospheric Sciences, University of Illinois Urbana-Champaign, Champaign, IL 61820, USA
2
Pacific Northwest National Laboratory, Richland, Washington, DC 99354, USA
*
Author to whom correspondence should be addressed.
Atmosphere 2021, 12(8), 979; https://doi.org/10.3390/atmos12080979
Submission received: 15 June 2021 / Revised: 22 July 2021 / Accepted: 27 July 2021 / Published: 29 July 2021
(This article belongs to the Section Meteorology)

Abstract

:
This study compared drop size distribution (DSD) measurements on the surface, the corresponding properties, and the precipitation modes among three deep convective regions within the Americas. The measurement compilation corresponded to two sites in the midlatitudes: the U.S. Southern Great Plains and Córdoba Province in subtropical South America, as well as to one site in the tropics: Manacapuru in central Amazonia; these are all areas where intense rain-producing systems contribute to the majority of rainfall in the Americas’ largest river basins. This compilation included two types of disdrometers (Parsivel and 2D-Video Disdrometer) that were used at the midlatitude sites and one type of disdrometer (Parsivel) that was deployed at the tropical site. The distributions of physical parameters (such as rain rate R, mass-weighted mean diameter D m , and normalized droplet concentration N w ) for the raindrop spectra without rainfall mode classification seemed similar, except for the much broader N w distributions in Córdoba. The raindrop spectra were then classified into a light precipitation mode and a precipitation mode by using a cutoff at 0.5 mm h 1 based on previous studies that characterized the full drop size spectra. These segregated rain modes are potentially unique relative to previously studied terrain-influenced sites. In the light precipitation and precipitation modes, the dominant higher frequency observed in a broad distribution of N w in both types of disdrometers and the identification of shallow light precipitation in vertically pointing cloud radar data represent unique characteristics of the Córdoba site relative to the others. As a result, the co-variability between the physical parameters of the DSD indicates that the precipitation observed in Córdoba may confound existing methods of determining the rain type by using the drop size distribution.

1. Introduction

Clouds help to drive the atmospheric circulation from the global to the convective scale through diabatic heat release. In addition to heating and cooling due to radiative effects and the phase changes of water, clouds also moderate the global hydrological cycle through precipitation processes and vertical transportation of water [1,2,3]. The microphysical processes that modify a cloud’s structure and lifetime and control a cloud’s redistribution of heat and moisture are linked to the underlying thermodynamic conditions arising primarily from vertical air motions within and outside these cloud systems [4,5,6,7]. Understanding the connections between the kinematic and thermodynamic conditions that influence cloud dynamics, microphysics, and attendant rainfall production is essential from a hydro-meteorological perspective. However, these intertwined processes that operate from the micro- to the meso-scale can be difficult to represent with fidelity in multi-scale atmospheric models [2,3,8,9].
Liquid drops and ice particles of diverse sizes are involved in cloud microphysics [4]. The drop size distribution (DSD) is a characteristic of liquid precipitation, and DSD observations are of interest in applications beyond understanding microphysical processes in clouds. To illustrate this, for rainfall estimation with satellite-based methods or ground-based retrieval algorithms, DSDs are critical for determining the relations in the reflectivity–rain rate [10,11,12,13,14] and improving dual-polarization rainfall retrievals [15,16,17,18]. Additionally, the characterization of DSDs in multi-scale models is vital for representing the processes of cloud dynamics and rainfall prediction in numerical simulations and forecasts [19,20,21,22]. It is also essential for broader studies of soil erosion due to rainfall and irrigation systems in agricultural engineering [23,24,25,26,27,28].
Various formulated mathematical models quantify the shape characteristics of the raindrop size distribution; for example, the exponential distribution N ( D ) = N 0 exp ( λ D ) , where N ( D ) is the raindrop concentration per droplet diameter D (mm) interval per unit of volume ( m 3 mm 1 ), N 0 ( m 3 mm 1 ) is the intercept parameter, and λ ( mm 1 ) is the slope parameter, as first formulated by Marshall and Palmer [29]. Moreover, the three-parameter gamma distribution N ( D ) = N 0 D μ exp ( λ D ) , with N 0 ( m 3 mm 1 ), μ (unitless), and λ ( mm 1 ), was introduced by Ulbrich [30] and Willis [31], but had a disadvantage in that the three parameters are mathematical and not easily interpretable physical quantities. Hence, Testud et al. [32] proposed the normalization of raindrop distribution without an a priori assumption about the DSD shape and found a normalized intercept parameter N w proportional to L W C and ( D m 4 ), where L W C is the water content of liquid precipitation ( gm 3 ), and D m is the mass-weighted mean diameter (mm). Subsequently, the three physical quantities in this normalized gamma DSD are N w , D m , and μ , where N w represents the intercept parameter of an exponential distribution with the same L W C and D m , as well as shape parameter μ of 0 (Appendix A).
Moreover, radar hydro-meteorology is dependent on the estimation of the raindrop size distribution (DSD) as a function of parameters of rain physics through the relationships of Z = a R b . Here, Z is the radar reflectivity factor (in linear units of mm 6 m 3 ), and R is the rain rate (mm h 1 ). The empirical quantities (a, b) depend on the variability of the DSD for different climatic regimes of rain due to differences in their dominant microphysical processes [30,33,34,35,36,37]. The diverse Z R relationships in the literature also imply different N w values depending on the microphysical processes and rainfall intensity occurring in varying climate regimes [30,32,36,38]. In DSDs from radars and disdrometers, Bringi et al. [36,39] analyzed the linear relation between N w (or l o g 10 N w ) and the median volume diameter ( D 0 ) to classify surface rainfall at maritime and continental locations in two regimes. These analyses revealed microphysical differences in the stratiform and convective rain regimes that were attributed to different formation processes.
Consequently, Bringi et al. [36,39] introduced a convective–stratiform segregation criterion based on these two parameters for maritime and continental geographical locations. Subsequently, Thompson et al. [40] examined DSD observations in tropical oceanic rain at two locations. They showed DSD characteristics for stratiform tropical oceanic rain that were similar to those of [39], but found a larger N w with smaller D 0 in convective rain, in contrast to previous studies up to that point, which presented smaller N w with smaller D 0 for maritime continental locations [36,38,39,41,42].
In another study that used many disdrometer sites worldwide, Dolan et al. [38] used principal component analysis to examine the spatial–temporal variability in DSD datasets in twelve geographical locations from high latitudes to the tropics. They presented a conceptual model of the variability between N w and D 0 based on clustering of the dominant processes that modified the DSD shapes for different rainfall modes. All sites reported larger N w in the high latitudes and smaller N w in the midlatitudes. The two sites examined in the tropics reported an N w bimodality for convective and stratiform rain clusters and larger N w with smaller D 0 . Another global examination of DSD properties from Gatlin et al. [43] analyzed samples of large drops from eighteen geographical sites in various rainfall conditions, reporting maximum raindrop diameter values ( D m a x ) of up to 9.0–9.7 mm for the validation of assumptions of D m a x in remote sensing retrieval algorithms. Furthermore, Thurai et al. [44] examined the effects of small drops by using a combined two-instrument raindrop size spectrum at two sites in the United States, and they showed precipitation and drizzle modes. At the same time, they showed higher values of N w due to the minimum raindrop diameter values ( D m i n < 0.7 mm), which are generally undercounted by commonly used disdrometers, including those used in this study.
In spite of the disdrometer-based efforts to measure surface precipitation and improve precipitation representation worldwide, a literature review indicated that some climatic regimes have scarce disdrometer measurements [45,46,47], particularly in South America [48,49]. For example, the NASA Tropical Rainfall Measuring Mission–Large-Scale Biosphere–Atmosphere (TRMM-LBA) experiment conducted in 1999 in southwestern Amazonia [43,50,51,52] and the Department of Energy (DOE) Atmospheric Radiation Measurement (ARM) Green Ocean Amazon (GoAmazon) field campaign conducted in central Amazonia during 2014 and 2015 [53,54,55] collected DSD observations. Moreover, the DOE ARM Cloud, Aerosol, and Complex Terrain Interactions (CACTI) and Remote sensing of Electrification, Lightning, And Mesoscale/microscale Processes with Adaptive Ground Observations (RELAMPAGO) field campaigns conducted during the austral warm season of 2018–2019 collected disdrometer observations in west-central Argentina near the Sierras de Córdoba (SDC) [56,57]. This north–south-oriented mountain range east of the Andes in subtropical South America is known to frequently initiate deep convection [56,57,58,59,60,61]. In addition, measurements from the Integrated Precipitation and Hydrology Experiment (IPHEx), which was conducted in the Appalachian Mountains of North Carolina (USA), formed an extensive DSD database for midlatitude mountainous terrain [62]. However, mountainous regions worldwide likely have a range of orographically impacted precipitation processes that lead to substantial variability in the surface DSD characteristics.
The precipitation processes in subtropical South America may be unique compared to those of other climate regimes. Observations from the Precipitation Radar (PR) aboard the TRMM satellite showed that the deep convective regions in subtropical South America produce some of the most intense and organized convective systems on Earth [63,64].
Previous studies have compared the vertical and horizontal radar reflectivity echo structures of three deep convection regions in the Americas, including the Amazon and west-central Argentina, by examining an 11-year record of storms from the TRMM PR dataset [58,65,66,67,68]. For example, Rasmussen et al. [66] suggested that organized convective systems bearing wide convective cores are more frequent near the SDC, which was where the RELAMPAGO-CACTI field campaign took place. As this frequent and organized convection moves to the east and northeast of the SDC, it presents similarities with the mesoscale convective system (MCS) structure of a leading line of cells followed by a stratiform rain region, which was observed in Central Oklahoma in the United States [69]. However, storms in the Great Plains do not interact significantly with surrounding topography, such as storms near the SDC, where terrain-induced flow modifications have led to the rapid organization of convection [58,59], which we hypothesize can be reflected in the differences in the variability of DSD parameters. Therefore, these MCSs of the wide convective core storm type are relatively infrequent in the Amazon compared to warm-season storms in subtropical South America and the Great Plains. Thus, Romatschke and Houze [65] and Rasmussen et al. [66] more commonly classified MCSs in the Amazon as storms with broader stratiform areas during the warm season than those of the midlatitude sites considered herein.
The purpose of this work is to leverage these recent disdrometer data collection efforts to compare the DSDs and DSD parameters among three deep convective regions in the Americas: the core site of the RELAMPAGO-CACTI field campaign near the SDC, the US Southern Great Plains site, and central tropical Amazonia during the GoAmazon field campaign. Casanovas et al. [70] described intra-site DSD variability across central Argentina during RELAMPAGO-CACTI, whereas this study compared the DSD characteristics across campaigns in the Americas for the first time. Section 2 outlines the data and methods, and Section 3 summarizes the results obtained from this comparison of the DSDs between the midlatitude sites (COR and SGP) and the tropical site (MAN). Section 4 discusses the more notorious variability of the DSD parameters affected by the complex terrain at COR relative to SGP and MAN, and potentially to previously studied orographically influenced sites. Furthermore, Section 5 presents the overall conclusions.

2. Data and Methods

2.1. Locations of Sites and Field Experiments

The three sites in the Americas examined in this study spanned different climate regimes: humid subtropical grasslands for the US Southern Great Plains, an equatorial rainforest in Manacapuru, Brazil, and a humid subtropical climate near the complex terrain in Córdoba, Argentina. For reference, Figure 1 shows the three sites where intense rain-producing systems contribute to the majority of rainfall in their respective river basins: Mississippi, Amazon, and La Plata. Table 1 gives information on each site’s location and coordinates, the source instruments, and the data collection period selected. For these sites, the ground-based measurements compiled from the ARM user facility correspond to the following field experiments.
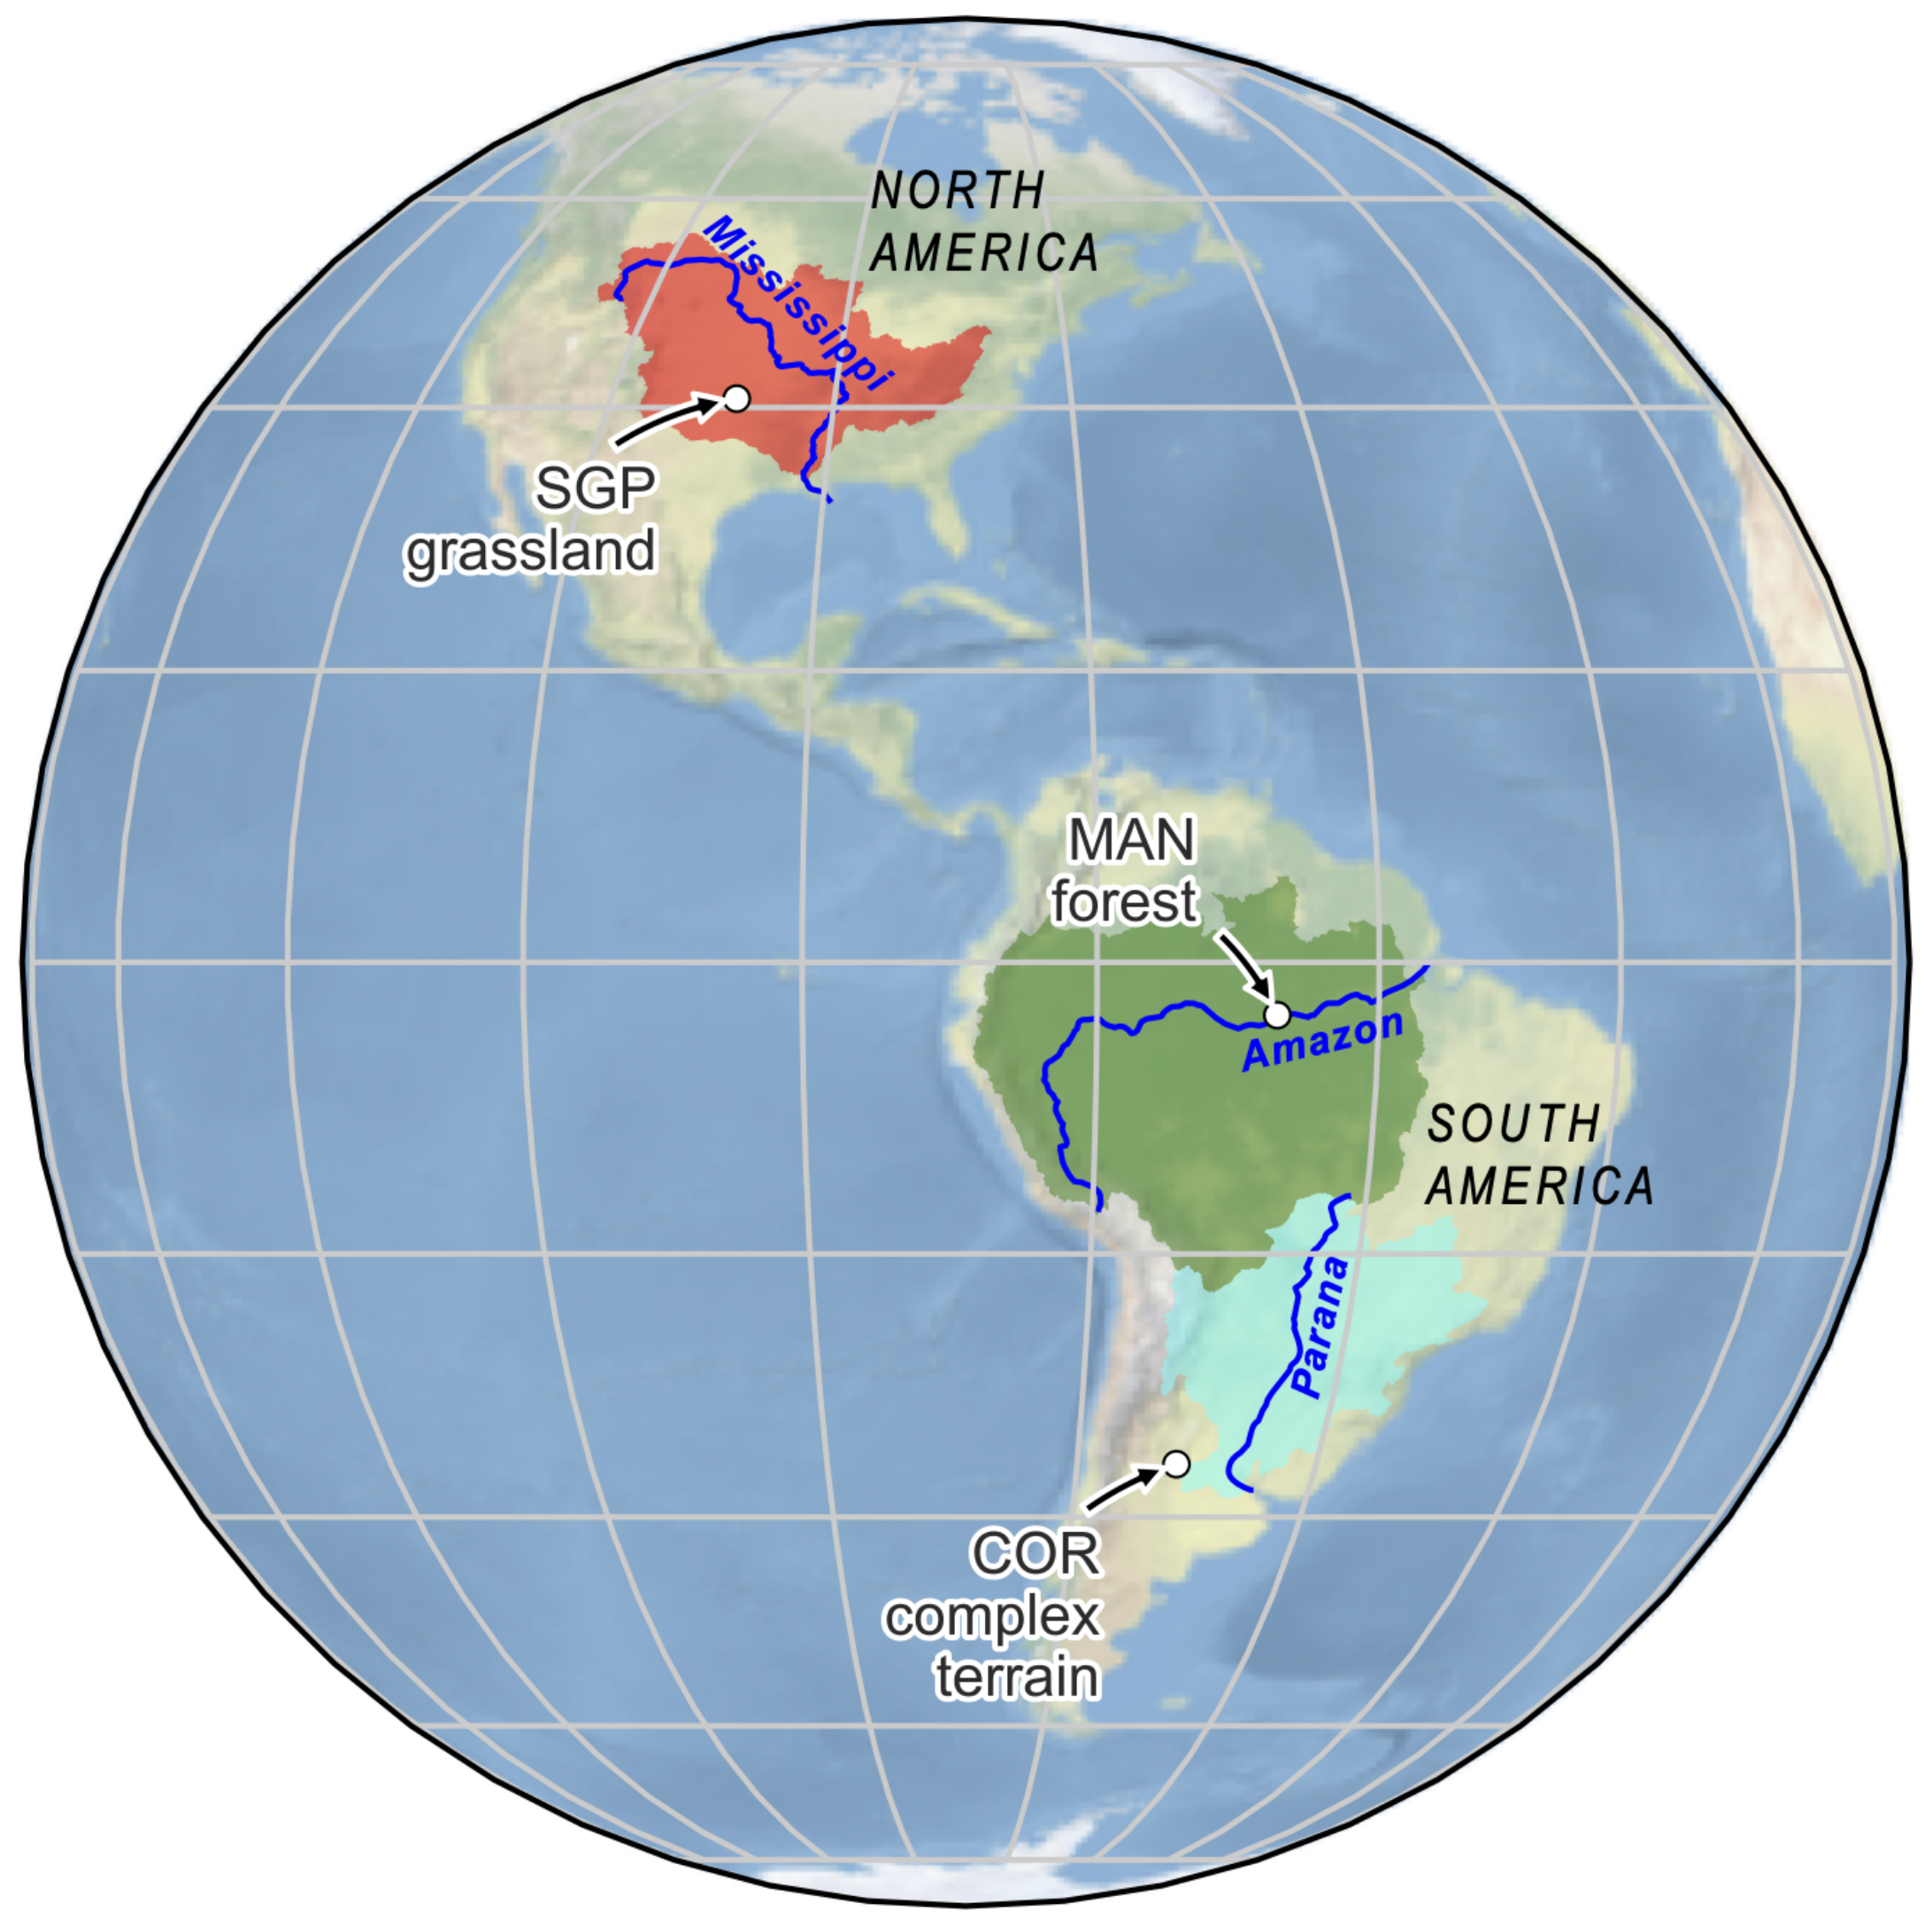
  • The Southern Great Plains atmospheric observatory from the ARM Program (operating since 1992) has extensive instrumentation in the United States, and is located in north-central Oklahoma and within the southwest part of the Mississippi Basin. This basin is the second-largest in the Americas after the Amazon, where extreme flood events have historically occurred (e.g., during the spring–summer seasons of 1993 [71,72,73]). Houze et al. [74] studied spring storm events in central Oklahoma using a six-year dataset and showed that most of the rain came from the MCS structure of a leading line of convective cells trailed by stratiform rain, as compared to other types of MCSs or storms. Thus, the ARM acronym for this site is SGP (Southern Great Plains)
  • The DOE ARM Green Ocean Amazon (GoAmazon) field campaign took place in Manaus, Brazil, in the central part of the Amazon Basin, from January 2014 through December 2015. The Amazon is the most broadly studied and largest basin in the Americas [72,75,76,77]. It is considered a crucial convective area in the tropics where moderately intense to weak convective systems cause significant rainfall throughout the austral summer [63,64,78,79,80,81]. The ARM Mobile Facility (AMF1) and Mobile Aerosol Observing System (MAOS) were at the “T3” site near Manacapuru, which is on the Amazon River and is located 80 km west of the Manaus airport [53,54,55,82]. The ARM acronym for this site is MAO, but this study denotes it as MAN (MANacapuru).
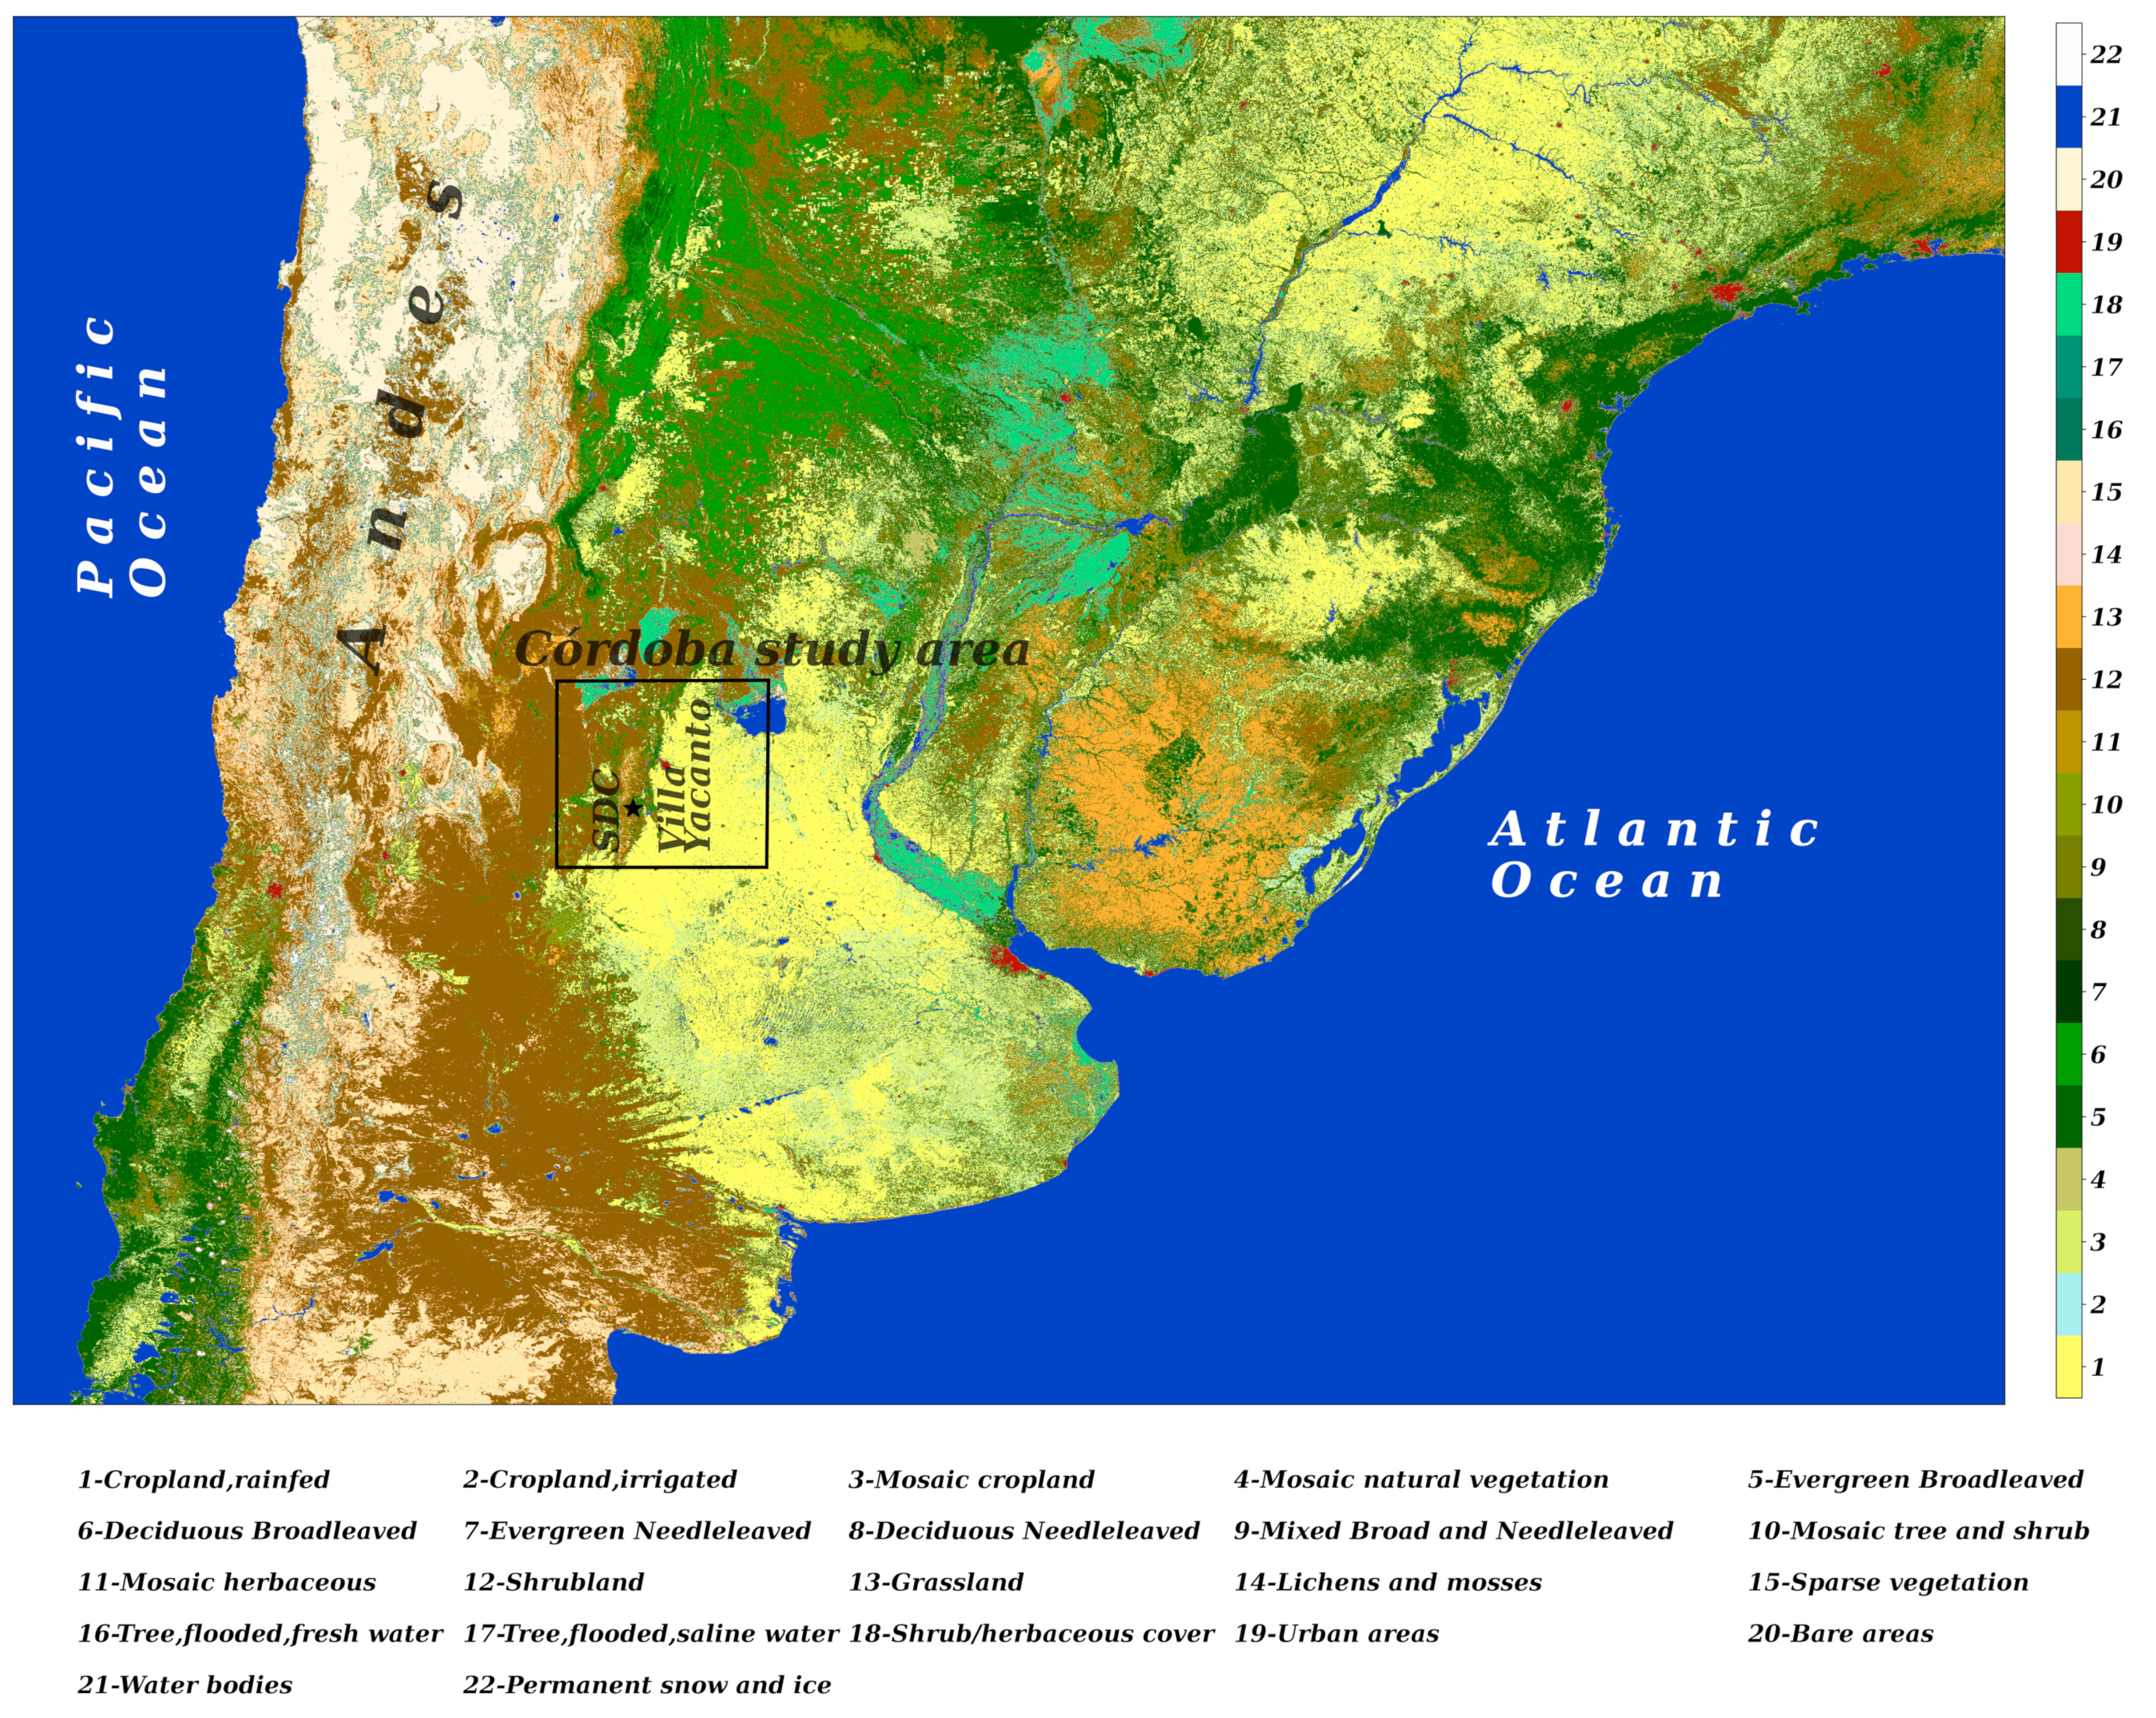
  • In connection with the National Science Foundation (NSF)-led RELAMPAGO field campaign, the DOE ARM CACTI field campaign collected disdrometer observations in Villa Yacanto (see Figure 2). Both experiments took place in Córdoba, Argentina, near the SDC during the warm season of 2018–2019. Headwaters in the SDC form the Carcarañá River Basin, which flows into the Paraná River, a major river in the La Plata Basin, the third-largest basin in the Americas. These rivers are vital for socioeconomic activities and are highly influenced by frequent and intense, organized convection and the consequent severe weather impacts, including costly flooding disasters [67,83,84,85,86,87]. Approximately 20 km to the east of the highest terrain of the SDC and 90 km southwest from Córdoba’s capital city was located the ARM Mobile Facility-1 (AMF1) site [60,88,89]. The ARM acronym for this site is COR (CORdoba).

2.2. Disdrometer Instrumentation and Data Analysis Methods

The ARM program’s disdrometers have collected DSD spectra in sites where there might not be other routine disdrometer-based observations and precipitation because severe convective storms represent a fundamental contribution to the Americas’ major river basins. For the observational periods and experiments examined here, between 2014 and 2019, the ARM program mainly deployed two types of disdrometers for long-term measurements of DSDs. These are a particle size velocity (PARSIVEL) laser-optical disdrometer and a two-dimensional video disdrometer, or 2D-video disdrometer (2DVD).
The OTT HydroMet PARSIVEL 2 , or PARSIVEL2 disdrometer (henceforth PARS), provides measurements of the raw particle size and fall speed distributions within a matrix (32 × 32) constructed from particle counts of uneven classes that are from 0.06 to 24 mm in diameter at OTT fall velocities from 0.050 s 1 to 20.80 m s 1 . For this study, the uniform bin width selected was 0.20 mm [90]. Some of the primary variables were the Lhermitte fall velocity (m s 1 ), surface precipitation as the rainfall rate (R), liquid water content ( L W C ), number concentration, and raindrop characteristic size as the median volume diameter ( D 0 ) [52,91,92]. The PARS is known for its robustness and low maintenance requirements, as well as for being subject to error with larger raindrops and faster fall velocities when calculating the DSD parameters [38,93,94]. The ARM Parsivel2 Handbook [92] provides further information about other primary variables and expected uncertainty. In addition, the reports from the GoAmazon and CACTI field campaigns [60,95] and from recent studies that used ARM data [38,94] give more details about the deployment and standard corrections of PARS.
The raw output files of the 2D-video disdrometer (hereafter 2DVD) contain the dimensions of every drop observed by two scanning cameras and their respective matching systems, with an equivolumetric diameter from 0.20 (or finer grid resolution) to 10 mm [96,97]. Moreover, some of the constructed observables are the raindrop oblateness and fall speed, and the drop diameter is the center of the bin for drops for each 0.2 mm bin spacing [43,52,98]. The 2DVD requires frequent calibration and tends to underestimate small droplet concentrations [38,40,43,44]. However, it provides the most accurate concentration of large raindrops and characterization of raindrop shapes because there are fewer errors in the matching procedure [18,43,44,52,97]. More information on the 2DVD and its deployment are available in the ARM VDIS Instrument Handbook [98], the CACTI field campaign report [60], and previous studies that used ARM datasets [38,40,94]. Note that the sampling area of the 2DVD line-scan camera is 0.01 m 2 , while the PARS laser sheet images were over an area of 0.0054 m 2 [52,92,98].
Following the corrections applied in similar DSD studies [43,52,93,94], the raw dataset processing considered for each 1-min raindrop spectrum removed drop sizes D 0 with a diameter of less than 0.2 mm for being unreliable in these disdrometers [52,93,94]. Moreover, following Giangrande et al. [94], the dataset processing removed rain rates R lower than 0.1 mm h 1 and used at least 5 min of consecutive rain with a rate greater than 0.1 mm h 1 to reduce any noise in the 1-min DSD measurements. Previous studies found the above data processing method to be more accurate for moderate to large raindrops due to the disdrometer’s resolution and the consequent tendency to underestimate the concentration of small raindrops [44,52,94].
Apart from the recent value-added ARM products—LDQUANTS (Laser Disdrometer Quantities) and VDISQUANTS (Video Disdrometer Quantities) [99], which provide quality control for some of the DSD properties—the filtering of the disdrometers’ raw data to eliminate secondary or suspicious drops is left to the users, as their filtering requirements may vary (MJ Bartholomew 2020, personal communication).
Nonetheless, the precision in the DSD representation and the measurements of the drop size and fall velocity by the disdrometers can be significantly affected by strong winds during intense rainfall [100], especially for the PARS compared to the 2DVD [93]. So, the first stage of quality control is masking the drops that exceed the calculated Lhermitte fall velocity [92,101], v L h e r m i t t e ± (threshold = 2 m s 1 ), to include light-precipitation-mode droplets and to eliminate secondary or suspicious droplets from rain splashes and wind effects during heavy precipitation. Other standard filtering methods and thresholds ( v L h e r m i t t e ± 50%) [52,93,102] were extensively tested, but resulted in a detriment to the smaller drops [93], especially at the COR site. This modification in the criteria, including small drops, was independently verified with radar echoes at COR from precipitating clouds (see below).
Therefore, the second stage of the quality control and processing of the data included retaining 1-min observations with at least 100 drops [38,40,94]. For the spectra that were retained in the second stage, following the criteria of previous studies that characterized the full drop size spectra [44], rain rates lower than 0.5 mm h 1 defined the “light precipitation mode” ( L p m ), and rain rates greater than 0.5 mm h 1 defined the “precipitation mode” ( P m ) [43,103,104].
Subsequently, the DSD parameters were calculated by using these data with a 0.20 mm binning, and they included the Lhermitte fall velocity v L h e r m i t t e , mass-weighted mean diameter D m , mass standard deviation σ m , normalized intercept parameter N w , liquid water content L W C , and the median volume diameter D 0 [25,32,97,101,105,106]. Appendix A contains the DSD parameter relationships used in the data processing. Table 1 details the total number of minutes after the quality control was used in the calculations of the DSD parameters for each site, instrument, and rain mode. There was good agreement between these calculations and the corresponding nugget DSD parameters from the LDQUANTS and VDISQUANTS. However, our analysis does not show these comparisons.
The hydrological applications of light precipitation for the Córdoba region are important during the wet season, but even more critical during the dry season [104] (e.g., a sequence of days with persistent drizzle throughout the San Roque Lake region reported in 2018 [107]). Furthermore, Section 3.3 presents two case studies with a high-frequency occurrence of Lpm in order to enhance the characterization of the properties of drizzle and light rain. Here, the data collected by the Ka-band ARM Zenith-pointing Doppler cloud Radar (KAZR) [108] provided appropriate monitoring of the light precipitation mode in tandem with the disdrometer observations at the COR site (see Figure 2). It is worth noting that when averaging the 1-min Lpm PARS disdrometer observations with the 15-min sequence of KAZR measurements, the precipitation analysis should not be affected by the KAZR’s small attenuation in light rain conditions [94,109].
In addition, collocated with the disdrometers, rain gauges, such as a tipping-bucket rain gauge (TBRG) [110] and a weighing-bucket precipitation gauge (WRG) [111], were used to make additional precipitation measurements. Neither the TBRG nor WRG was used to measure the DSDs or report relevant rain-rate errors in light and heavy precipitation, respectively, but they provided reliable total rain values [52,112]. As a further verification at the COR site, the TBRG 1-min rain-rate measurements [113] were compared with the corresponding PARS observations. Specifically, the TBRG and PARS showed a good agreement throughout the observational period of COR (correlation coefficient = 0.73, RMSE = 16.11 mm h 1 , n = 2948).

3. Results

3.1. DSD Parameter Distributions

A comparison of the probability density functions (pdfs) of the rain rate—expressed as 10 l o g 10 R (in d B R with R units mm h 1 ), the mass-weighted mean diameter is expressed as D m (in mm), and the normalized intercept parameter is expressed as l o g 10 N w (in B N w , where N w in units of m 3 mm 1 )—is presented to examine the site-to-site variability. Appendix A reviews the definitions and formulas of these three parameters, which were given by Williams et al. [25,105]. Figure 3a, Figure 4a and Figure 5a show five lines: the non-segregated data are in violet/blue lines for COR, magenta/orange lines for SGP, and a green line for MAN. Otherwise, Figure 3b–d, Figure 4b–d and Figure 5b–d present two lines for the segregated data; the dashed line is for the light precipitation mode ( L p m ) and the solid line is for the precipitation mode ( P m ). Again, the PARS/2DVD datasets are indicated here by violet/blue lines for COR, magenta/orange lines for SGP, and green lines for MAN. The logarithmic d B R scale in Figure 3 provides a convenient comparison between L p m and P m in the rain-rate pdfs.
Considering all of the non-segregated rain observations, the pdfs of the rain rate in Figure 3a appear to be quite similar, particularly at the midlatitude sites. Concurrently, a lower (higher) frequency of observed values between 0–5 (10–15) d B R —corresponding with the rain-rate range of 1–3 (10–30) mm h 1 —was estimated at MAN. Despite the general agreement, slight differences existed between COR and SGP, where the COR site had higher (lower) frequencies in the range of 0–2.5 (10–15) d B R or 1–1.8 (10–30) mm h 1 .
Figure 3b–d examine the 10 l o g 10 R rain-rate pdfs at each site, which were separated into the L p m and P m rainfall modes. Overall, when separated into modes, the rain-rate pdfs at each site appeared to show right-skewed distributions for the L p m , indicating a higher frequency of heavier rain with the heavy right tail near the maximum rain-rate cutoff. On the other hand, the P m had more gaussian left-skewed distributions towards the minimum rain-rate cutoff, as more frequent light rain was registered in this mode. The discrepancies between PARS and 2DVD in the rain rate for the two rainfall modes at the COR and SGP sites were minor. Table 1 compiles the 10 l o g 10 R statistics for the three sites.
At SGP and COR, the pdfs of the rain rate were similar between PARS and 2DVD for L p m and P m . However, the SGP observations of the rain rate revealed slightly higher frequencies than those of COR and MAN for L p m , but very similar rain-rate distributions for P m to those of the COR site (Figure 3b–d). On the other hand, the MAN P m observations of the rain rate (Figure 3d) revealed slightly lower (higher) frequencies at 0–5 (10–15) d B R than those of the other two sites.
Figure 4a shows that the pdfs of D m without classification at the three sites were generally similar, but had some differences. The violet/blue D m distributions for COR were more skewed toward raindrop sizes of less than 1 mm. Thus, MAN and SGP showed their higher frequencies at diameters that were greater than 1 mm; both PARS distributions were similar and had higher frequencies near 1 mm than the slightly shifted SGP 2DVD distribution due to its peak near 1.3 mm.
Separating the D m distributions into precipitation modes, Figure 4b–d reveal comparable distributions across the three sites. For the L p m , more notable differences were apparent between the COR site and the other two sites, including the PARS, which showed higher discrepancies with the 2DVD. The confined distribution of PARS at the COR site had the most frequent values of D m , which were around 0.45 mm, while the 2DVD presented a broader D m peak that extended between 0.40 and 0.64 mm; both sensors recorded peaks at the second bin, however. The SGP L p m distributions showed D m peaks at 0.58 and 0.80 mm for PARS and at around 0.52 and 0.91 mm for the 2DVD. PARS showed higher frequencies of D m than the 2DVD, but the peaking in the third and fifth measurable size bins was similar for both instruments at the SGP site. The MAN L p m distribution presented the most frequent D m values at 0.68 and 0.83 mm, as well as peaks in the fourth and fifth measurable size bins.
The PARS/2DVD P m distributions of D m were comparable among the three sites, except for the much more left-skewed distributions at the COR site towards raindrop sizes of less than 1 mm—more precisely, near 0.63 mm (PARS) and around 0.55 and 0.80 mm (2DVD). The two disdrometers at COR and SGP showed good agreement, except for slight discrepancies at both ends of the spectrum. The SGP P m distributions showed D m peaks around 1.20 mm for PARS and around 1.40 mm for the 2DVD. Again, both SGP disdrometers exhibited slight disagreement between 1 and 2 mm. The MAN distribution had its most frequent D m value near 1.15 mm, similarly to that of SGP. Table 1 summarizes these D m statistics. Overall, in comparing the PARS and 2DVD estimates of D m , larger inter-instrument differences existed in light precipitation ( L p m ) than in heavier precipitation ( P m ), which could be due to the instruments’ different resolutions and sampling areas, which could be amplified for small droplets.
Figure 5 displays the l o g 10 N w pdfs. The COR site had significant differences with respect to the SGP and MAN in the N w breadth distributions without segregation (Figure 5a), which included the PARS/2DVD discrepancies in this parameter across the spectrum.
For the DSDs with segregation, the PARS/2DVD L p m observations at SGP (Figure 5c) showed relatively confined bimodal l o g 10 N w distributions with peaks around 3.70 and 4.45 (PARS) and 3.40 and 4.55 (2DVD), respectively. PARS showed somewhat higher frequencies of N w than those of the 2DVD at the SGP site. MAN (Figure 5d) also had a relatively confined but unimodal L p m distribution with a peak near l o g 10 N w = 3.55. COR had broader bimodal L p m N w distributions (Figure 5b), with peaks at 4.15 and 4.80 (PARS) and 4.0 and 5.20 (2DVD). PARS exposed a moderately higher frequency near l o g 10 N w = 4.80 than that of the 2DVD near l o g 10 N w = 5.20 at the COR site.
The P m distributions were similarly confined at the SGP and MAN sites (Figure 5c,d), with unimodal N w distributions peaking at 3.30 (SGP PARS), 3.20 (SGP 2DVD), and 3.80 (MAN PARS). The multimodal N w COR distributions (Figure 5b) exhibited the most frequent values around 4.0 and 5.0 (PARS) and 4.30 and 5.40 (2DVD). The PARS/2DVD discrepancies in the the normalized intercept parameter for P m at the COR and SGP sites were minor compared to those for L p m . Table 1 reviews these N w statistics.

3.2. Joint Distributions of DSD Parameters

To analyze the site-to-site co-variability of D S D parameters in the N w and D 0 space [114], Figure 6 and Figure 7 show joint histograms of l o g 10 N w (in B N w , where N w is in units of m 3 mm 1 ) versus mean raindrop diameter D 0 (in mm), separated by the L p m and P m rainfall modes. Furthermore, Figure 8 displays the P m joint histograms of liquid water content L W C as l o g 10 L W C (in B L W C , where L W C is in units of g m 3 ) versus the median raindrop diameter as l o g 10 D 0 (in B D 0 , where D 0 is in units of mm). These figures also include the convective–stratiform rainfall separator lines: l o g 10 N w = 1.6 D 0 + 6.3 (taken from Bringi et al. [39]) is in green, l o g 10 N w = 3.85 is shown with red dashed lines, and l o g 10 L W C = 4.0 D 0 0.9 is shown with gray dashed lines; the latter two were taken from Thompson et al. [40]. The colored/colored and dashed contours indicate the PARS/2DVD datasets.
All of the observations of N w - D 0 for L p m at the three sites were below the segregation line that was taken from Bringi et al. [39] (Figure 6). They would thus be categorized as stratiform, even though the radar observations that we examined showed that this was likely precipitation formed by shallow clouds and drizzle. Considering the convective–stratiform segregation criteria from Thompson et al. [40], most of the L p m observations would fall into the stratiform category; however, a minor fraction of the N w - D 0 observations above this segregation line would be classified as convective. Concerning the other sites, COR presented more variability in l o g 10 N w and a higher frequency of high values of l o g 10 N w around D 0 = 0.40 mm. The two disdrometers at COR and SGP showed good agreement, except for their discrepancies with the 2DVD in a fraction of the observations, which lower values of l o g 10 N w of around D 0 = 1–2 mm.
Figure 7 shows the co-variability of N w and D 0 for P m . Most of these observations at the three sites were below the line from Bringi et al. [39]. However, each site showed a general inverse relationship between l o g 10 N w and D 0 , as shown by previous studies and as expected given the sites’ locations in regions containing substantial amounts of deep convective precipitation [39,40,41,115]. The regions of the highest observed probability of N w and D 0 were close to each other at the SGP and MAN sites—near l o g 10 N w = 3.50 and D 0 = 1.10 mm—but the COR site peaked near l o g 10 N w = 4.25 and D 0 = 0.75 mm. Similarly to the results presented in the subsections above for P m , the values of D 0 among the sites occupied consonant ranges, but were less consistent for N w . The primary difference among the sites stood out: The large variability of N w at COR extended to the observations in the N w - D 0 space, with frequencies of N w observations that were above 10 5 mm 1 m 3 in both the PARS and 2DVD distributions. Again, the two disdrometers at the COR and SGP sites presented good agreement, except for the 2DVD discrepancies, which included a minor fraction of the observations with medium values of l o g 10 N w that were around D 0 = 2–4 mm above the line from Bringi et al. [39].
In terms of the relationship between L W C and D 0 for P m (Figure 8 and a single-variable analysis that is not shown), the midlatitude sites had similar discrepancies for both the PARS and 2DVD instruments. The segregation line from Thompson et al. [40] divided the observations into two regions. Furthermore, the distribution of observations for MAN extended to higher values of both L W C and D 0 , which was also noted in tropical sites (Tokay and Short [116], Yuter and Houze [117], Thompson et al. [40], Dolan et al. [38]). However, this relationship did not appear as clearly as it did in the multi-site DSD composites shown by Dolan et al. [38]. This possibly indicated the sometimes continental nature of the convection observed in the Amazon Basin despite its moniker as the “Green Ocean”, which has yielded a reputation of having maritime-like convective intensity characteristics [118].

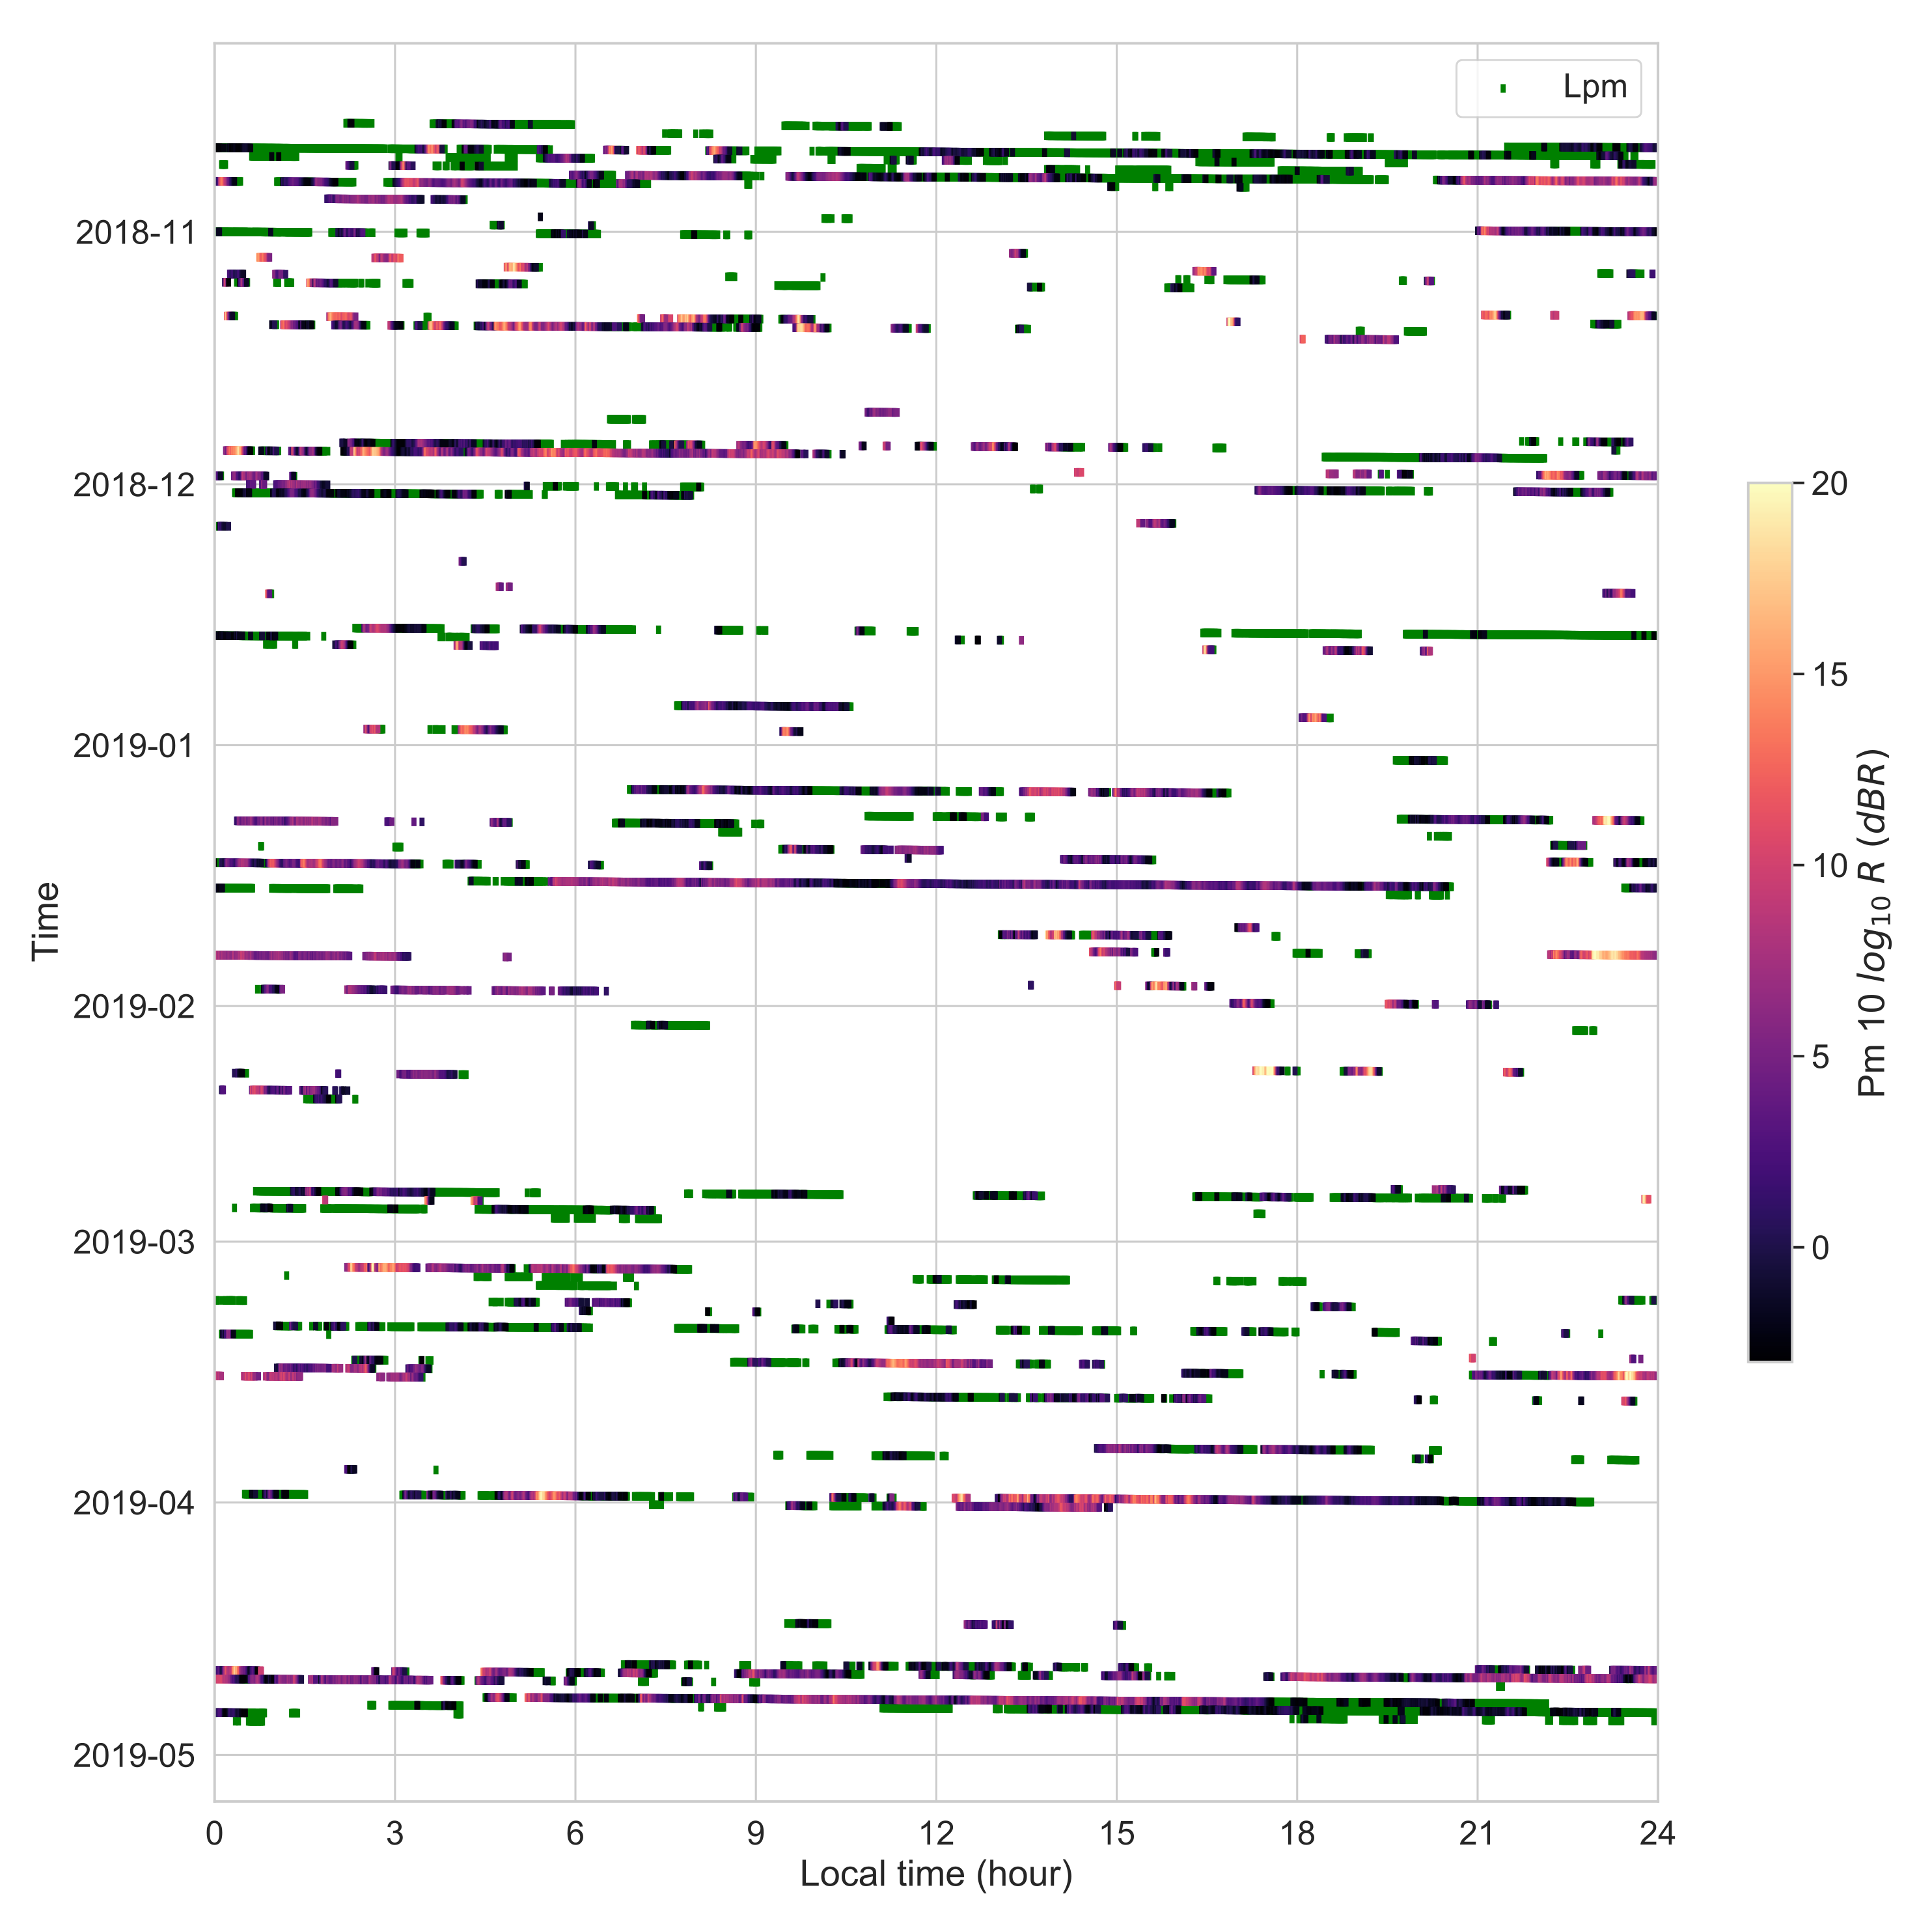
3.3. Lpm Observations during CACTI

To visualize the temporal patterns of L p m versus P m at the COR site as a function of the diurnal cycle, Figure 9 shows the occurrence of precipitation during the period of observation with PARS as a function of the day versus the local time of day. The time from the early afternoon to the overnight hours was when the precipitation mode was prevalent, consistently with an afternoon–midnight maximum in the continental diurnal cycle [119,120]. However, L p m tended to occur in several episodes that lasted several hours throughout the campaign. These L p m episodes did not seem to have a strong likelihood of occurring at a particular time of day; however, they were more likely to occur during events when heavier precipitation also occurred. Because the synoptic forcing in this region strongly modulated heavy precipitation, it was suggested that the flow associated with synoptic systems—coupled with the orographic forcing—plays a role in generating L p m precipitation, which would more likely tend to occur during the morning [62].
Table 2 shows the top 10 days with the highest frequency of L p m observations throughout the COR campaign according to PARS. Considering the period from December 2018 to February 2019, four of these ten events occurred during the summer season. Interestingly, several days with high numbers of L p m minutes occurred early in the CACTI campaign in late October (23–25 October; all appear in Table 2).
To explore the types of precipitating systems that contributed to the relatively high observed normalized size intercept values at the COR site, we present additional observations of the two days with the highest frequencies of L p m occurrence in Table 2. Figure 10 and Figure 11 provide ARM Ka-band Zenith-pointing Radar (KAZR) scans collected over the COR site to show the vertical structure of the radar echoes, as well as the corresponding DSD parameters observed by the PARS disdrometer. Figure 10 shows the case from 22 October 2018, where there were shallow precipitating clouds that were mostly below 2000 m above the site throughout much of the day, and were interrupted by deep convection that occurred between 06 and 12 UTC (03–09 local time). During these intense convective events, R exceeded 30 mm h 1 , D 0 exceeded 2 mm, and l o g 10 N w decreased to values of less than 3, which were consistent with convective precipitation [38]. Outside of the times with heavier precipitation, the rainfall was characterized by the shallow precipitation noted above, and much of it was classified as the L p m . There were some weak convective generating cells that appeared to be present in these warm clouds that contained drizzle (also in the Doppler velocity, which is not shown). The values of l o g 10 N w in m 3 mm 1 exceeded 5 throughout much of the event, with D 0 hovering around 0.5 mm and the rain rate remaining below 0.5 mm h 1 . It is interesting to note that this precipitation did not have any connection with the echoes aloft. The KAZR had a minimum detectable reflectivity of better than −35 dBZ at 1 km. For these cases, the KZAR could not detect any of the falling precipitation particles that acted in the seeder–feeder precipitation growth process for the L p m , as observed in the precipitation mechanisms in other mountain ranges, such as the southern Appalachian Mountains in the USA [62].
For the case that contained the second-highest number of daily L p m -classified periods, Figure 11 presents a case where a shallow L p m again exists between two deep convective core events. The first convective event occurred overnight near 0500 UTC or 0100 local time, with anvil clouds existing above 6 km for several hours and rain rates that were <2 mm h 1 , including some periods of L p m near-surface precipitation. The next day, another afternoon convective event occurred near 1900 UTC or 1700 local time. Between these events, clouds, drizzle, and light precipitation with high l o g 10 N w and low D 0 values occurred for more than 12 h. These clouds appeared to be shallower and less convective in the reflectivity and Doppler velocity observations than the clouds of the 22 October 2018 case. Again, the lack of a meteorological echo above the shallow cloud layer supported the lack of a seeder–feeder precipitation mechanism. An investigation of other cases and those presented here seemed to suggest that the microphysical generation mechanism for these events is shallow orographic upslope forcing. These particular DSD structures alongside their radar-determined vertical structures help support the COR observations’ certain uniqueness, especially regarding the shallow vertical structures and high N w values seen in both the L p m and P m rainfall modes in these cases.

4. Discussion

The results presented in Section 3 show the evaluation of a compilation of disdrometer datasets in order to compare DSDs and the DSD parameters among three sites in the Americas. Table 1 summarizes the l o g 10 N w peaks and most frequent values in the light precipitation mode ( L p m ) and the precipitation mode ( P m ), as described in Section 2.
Complementing the analysis performed earlier for the three sites (Figure 6), the L p m DSD parameters at the COR site included peak values of l o g 10 N w of around 4.15 and 4.80 for PARS and at 4.11 and 5.15 for the 2DVD. The SPG L p m distributions had its most frequent l o g 10 N w values at 3.70 and 4.40 for PARS and 3.40 and 4.55 for the 2DVD. The MAN L p m distribution had its most frequent l o g 10 N w values at 3.60 and 4.20.
More specifically, for L p m (Figure 6), the COR observations exhibited similarly high values of l o g 10 N w compared to the group that was categorized as having weak convection in Dolan et al. [38] (4.71 for the midlatitudes). However, the relatively smaller mean raindrop sizes observed ( D 0 ~ 0.45–0.55 mm for PARS and 2DVD) and the almost low rain rate and liquid water content placed some of the L p m observations in the group that represented vapor deposition in Dolan et al. [38] ( D 0 ~ 0.68 mm for the midlatitudes). Our investigation of these periods did not show the involvement of ice processes in the large majority of the L p m cases.
The COR site also presented higher numbers of rainy minutes for all precipitation modes than those of the MAN site in the PARS measurements. However, these rainy minutes did not comprise light precipitation, which the disdrometers could miss because of their inclination to underestimate the DSD for tiny/small drops, including fog and drizzle [44,104]. Avoiding this underestimation and characterizing the full DSD spectrum would also require measurements with higher-resolution instruments, such as the CACTI and GoAmazon G-1 aircraft imaging probes or other optical sensors that were used in previous studies [44,104,121].
Further, by using meteorological data and model outputs for the total observation period of GoAmazon (from 1 January 2014 to 31 December 2015) at the MAN site, Marengo et al. [80] showed that this campaign took place during a relatively dry period. Nevertheless, despite the surprisingly high precipitation frequency observed in Villa Yacanto during CACTI, it is left to future work to climatologically determine if the COR site or the MAN site has a higher precipitation frequency.

5. Summary and Conclusions

This study presents a comparison of the variabilities of raindrop size distribution parameters among three deep convective regions in the Americas: the US Southern Great Plains and west-central Argentina in the midlatitudes and the central Amazon in the tropics. Considering the lack of drop size distribution studies in South America, data from Parsivel disdrometers (and 2DVD disdrometers, where available) were analyzed here to characterize the raindrop size spectra in these climatically and hydrologically important regions, which were the focus of intensive field campaign operations. In order to analyze the variability of the DSD parameters at the three sites, the probability density functions (pdfs) of the rain rate R, mass-weighted mean diameter D m , and normalized droplet concentration N w were presented. The results were segregated into a precipitation mode ( P m , R > 0.5 mm h 1 ) and a light precipitation mode ( L p m , R < 0.5 mm h 1 ) to elucidate the differences in the drop size distribution parameters and the driving physical precipitation processes.
The primary results of this paper are as follows:
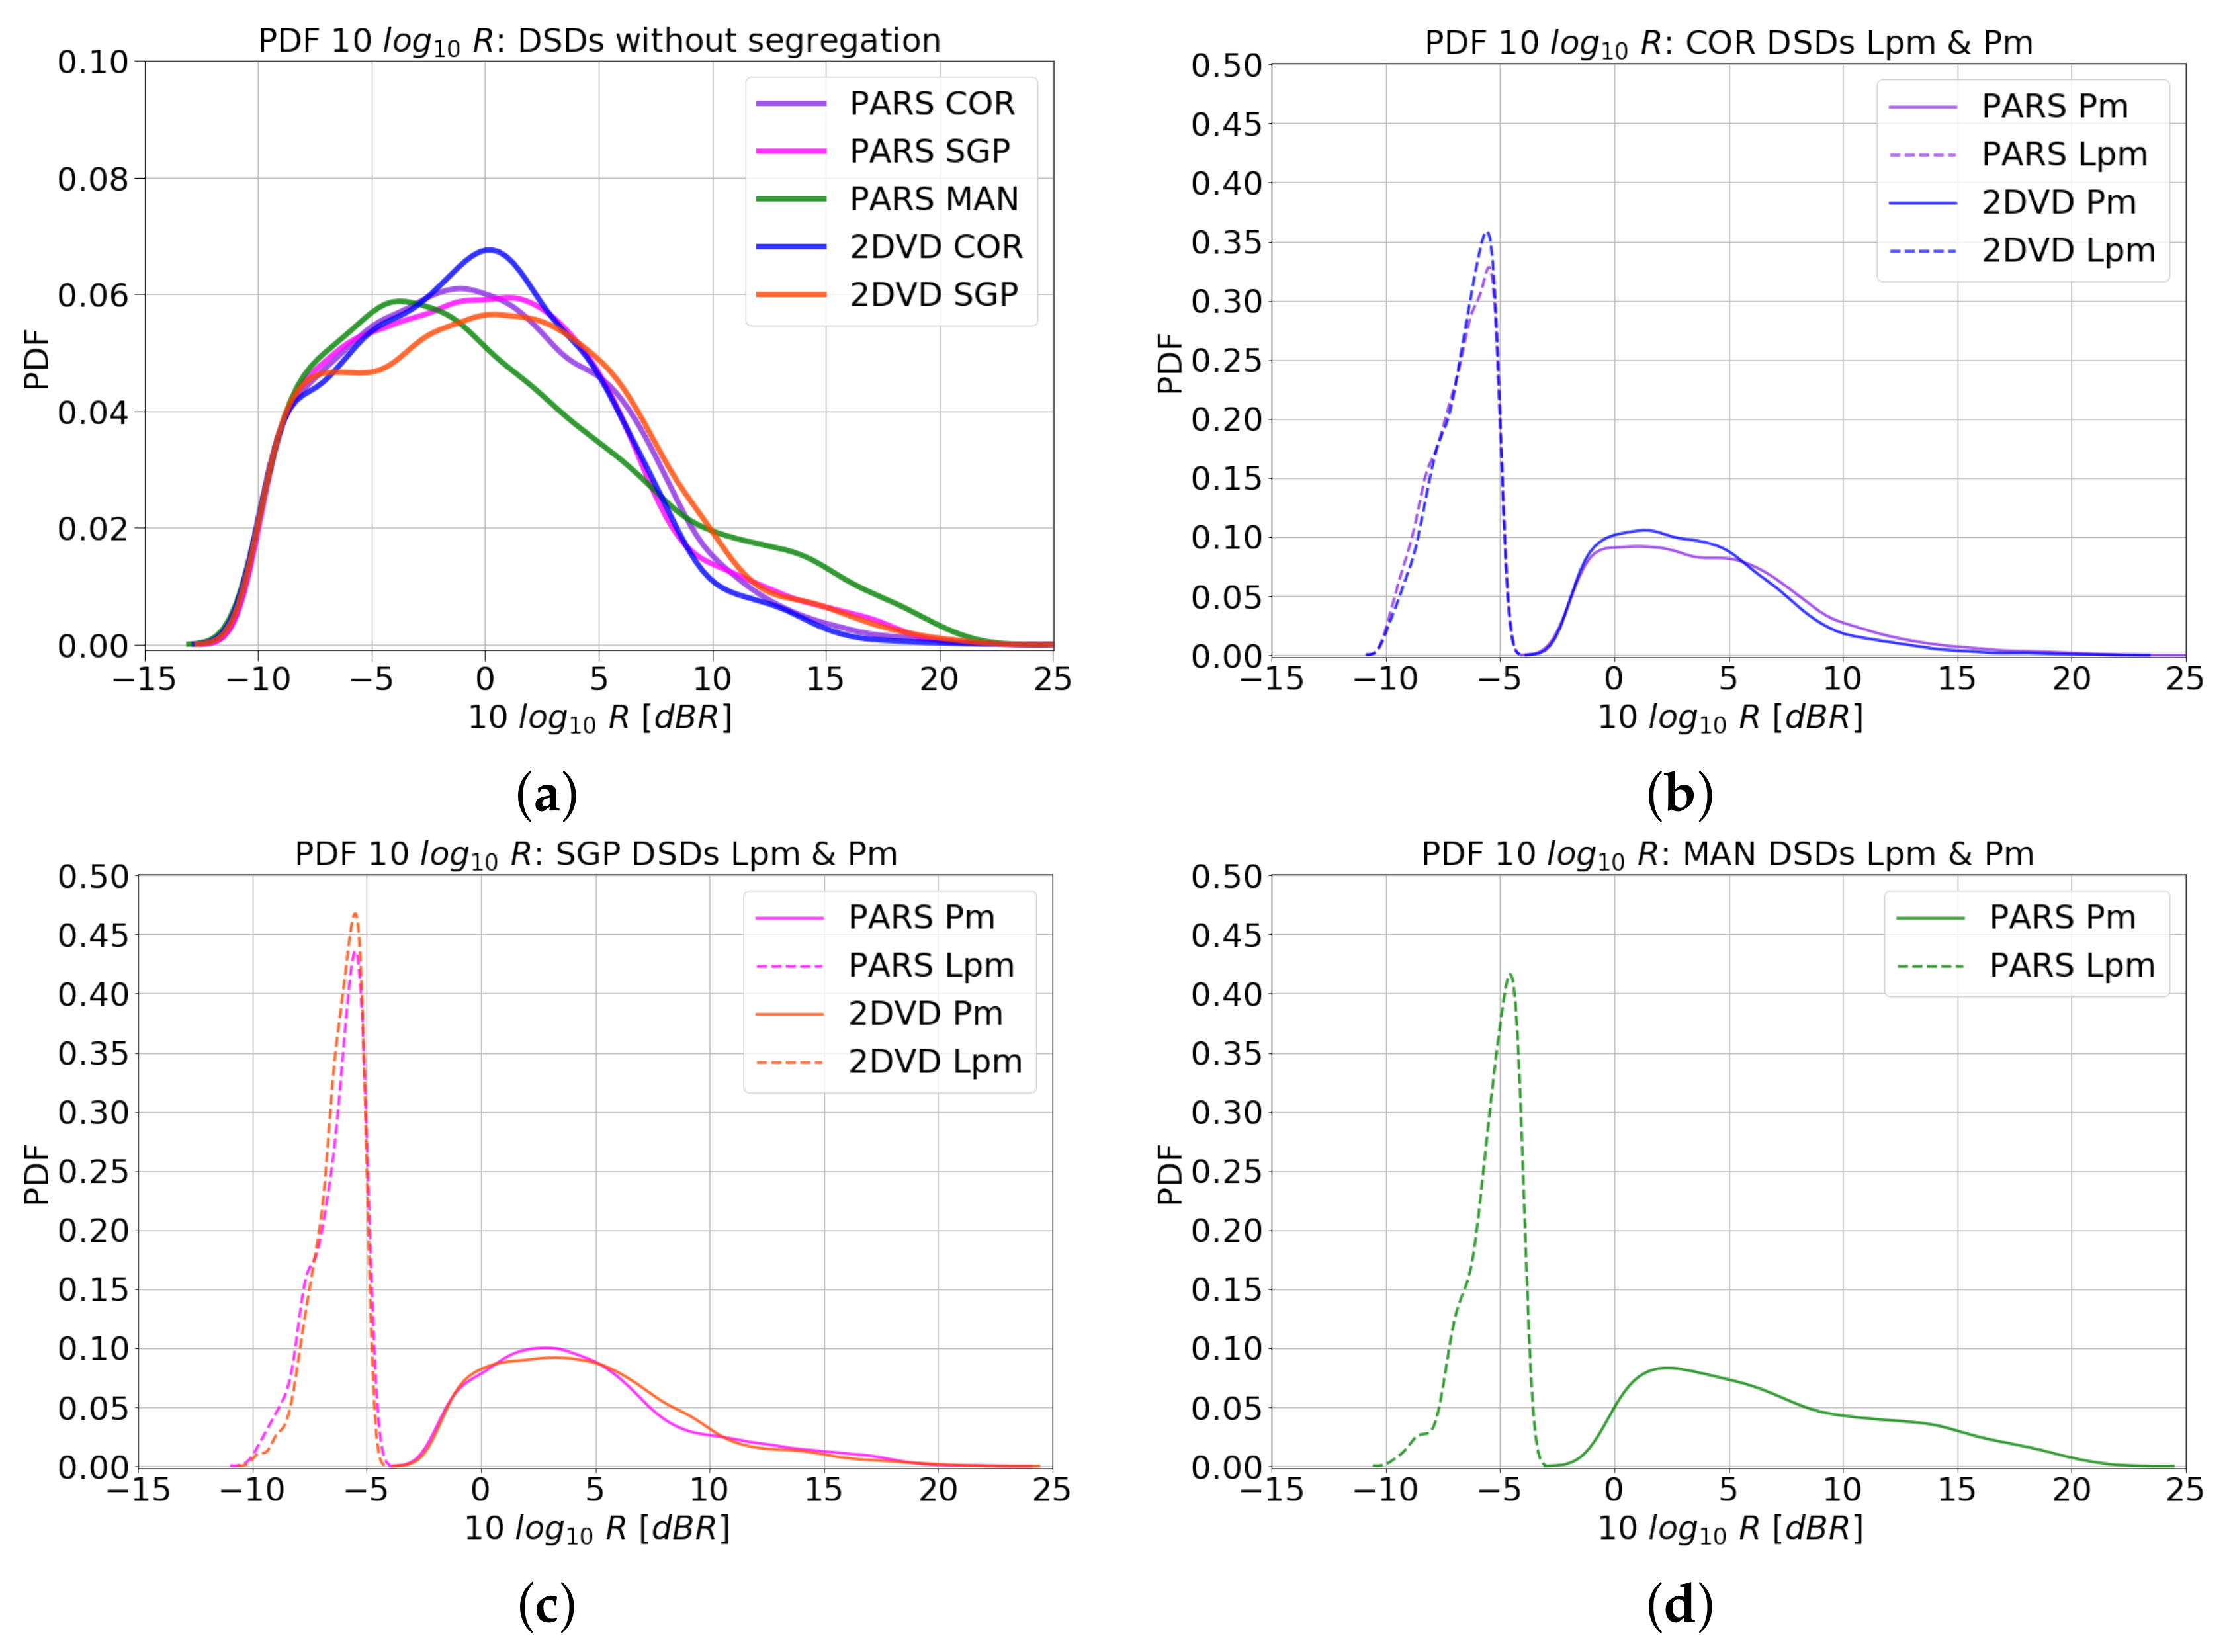
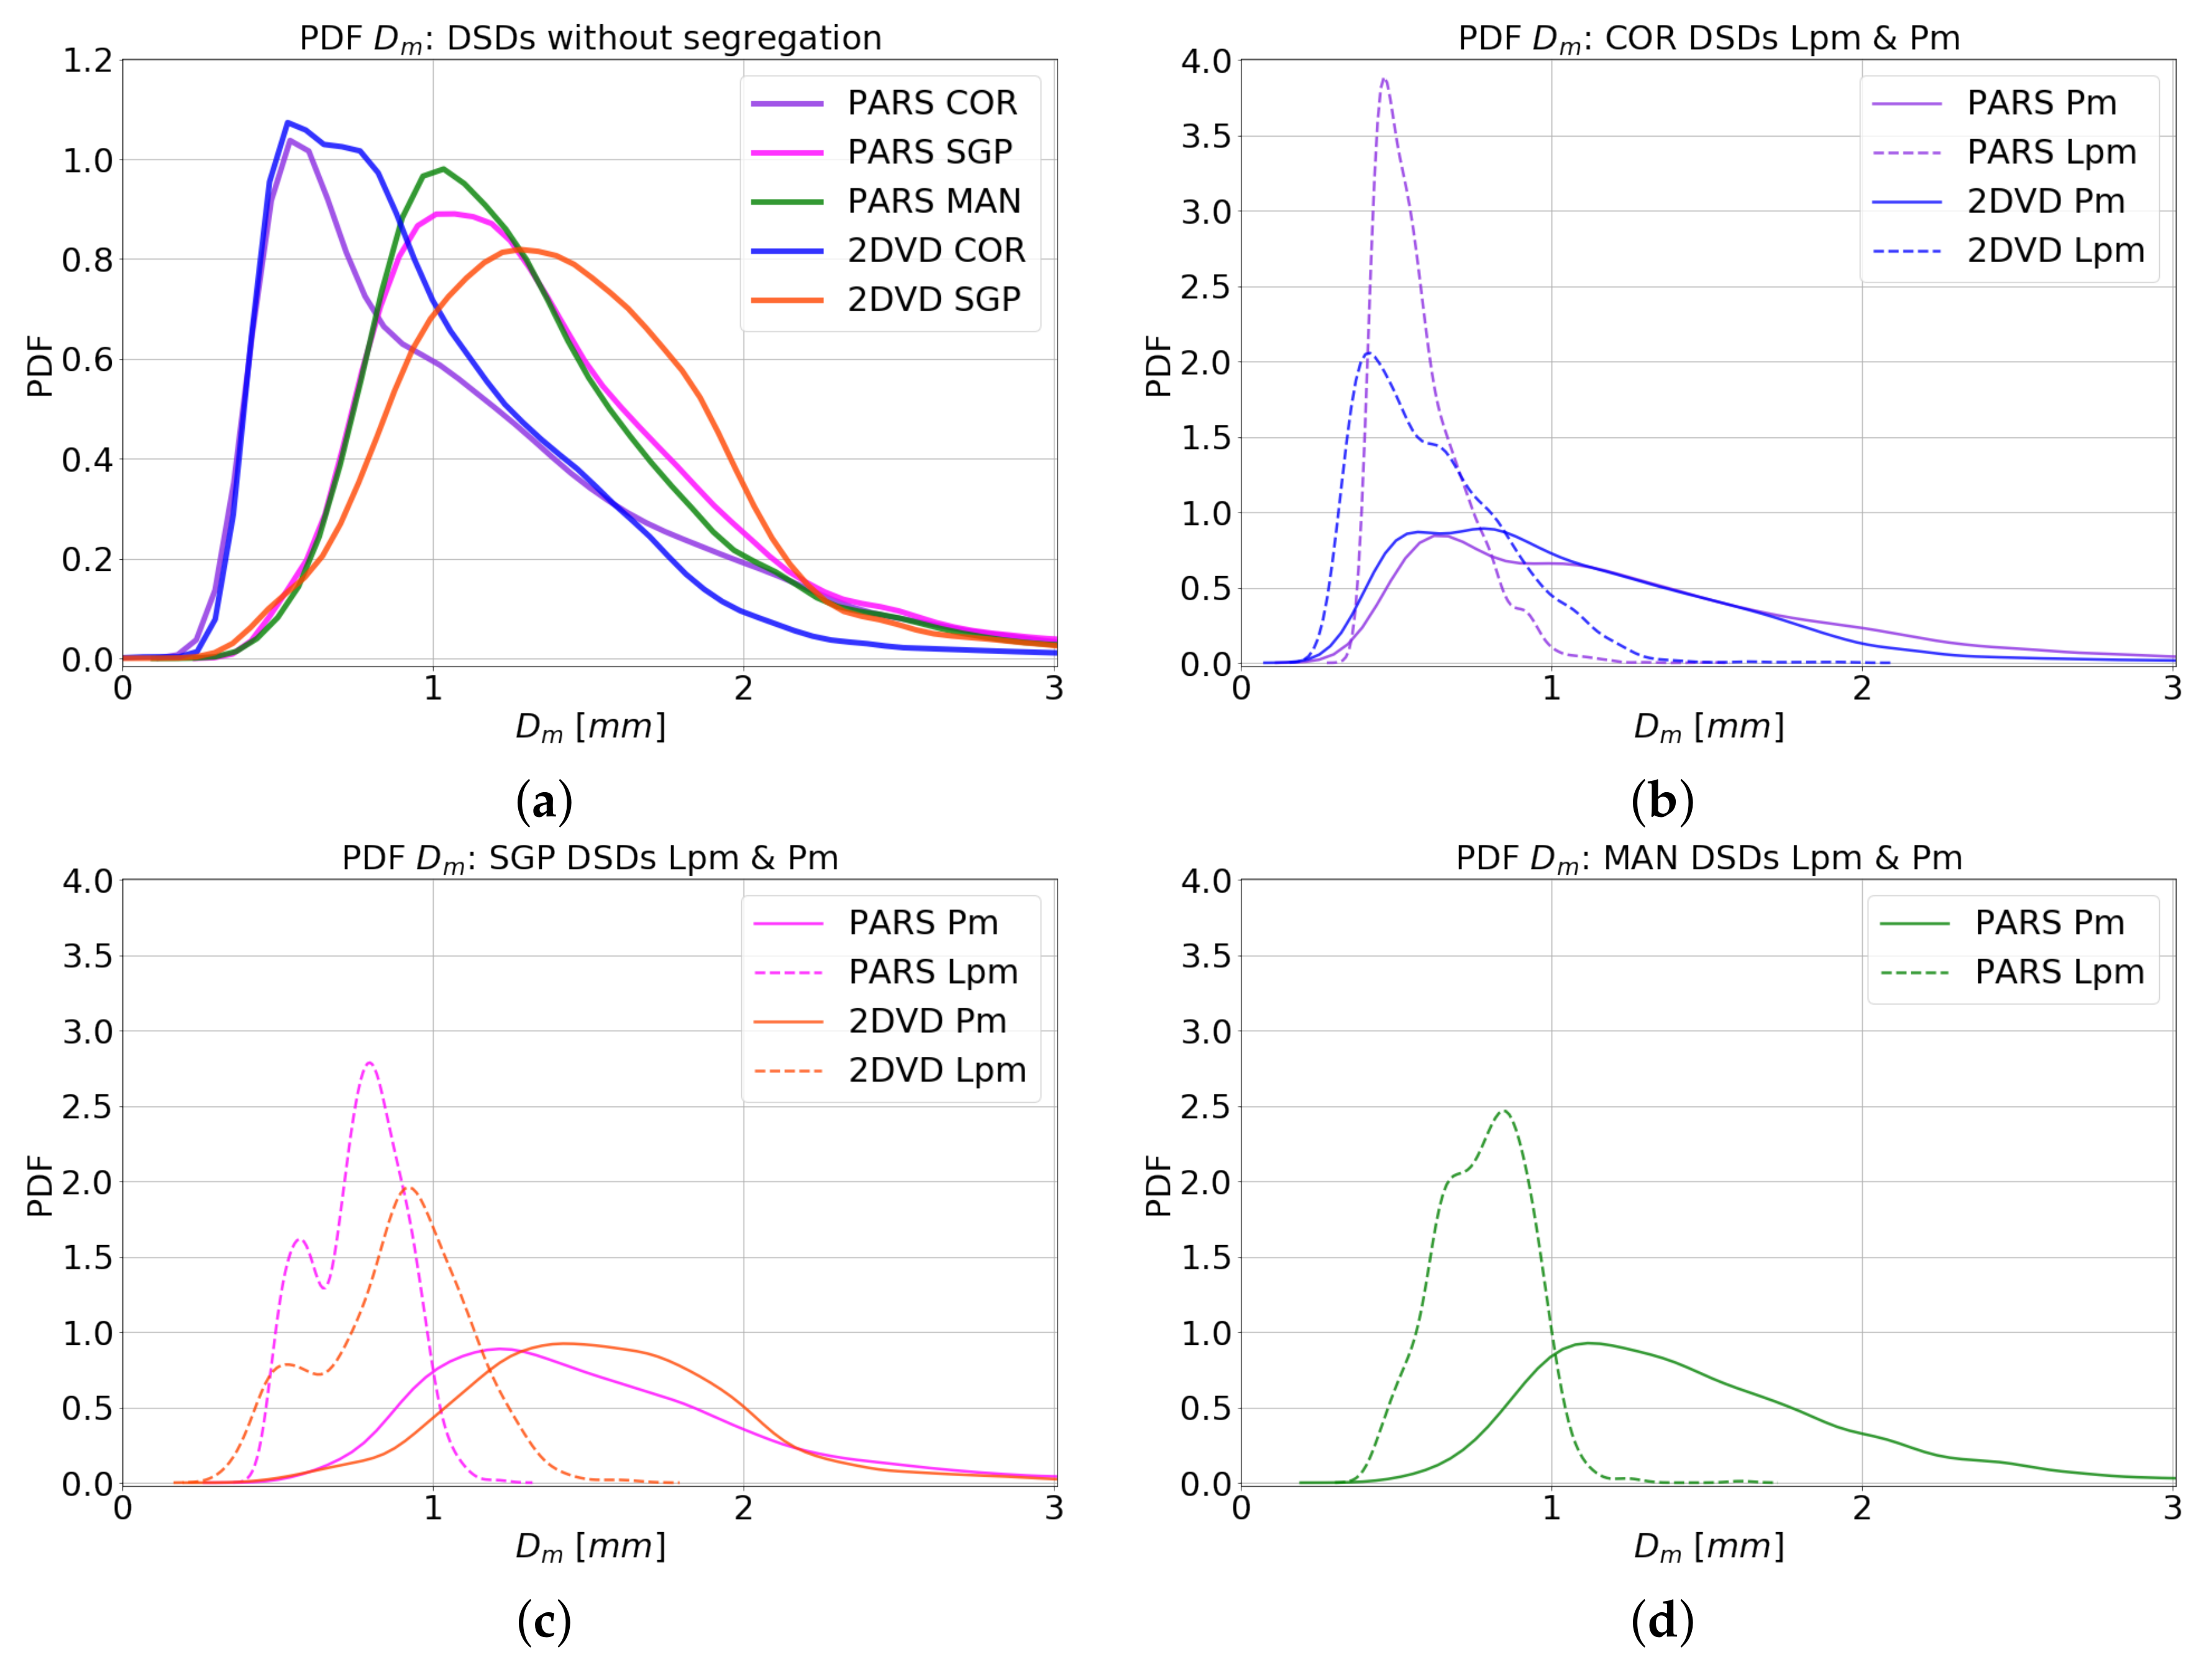
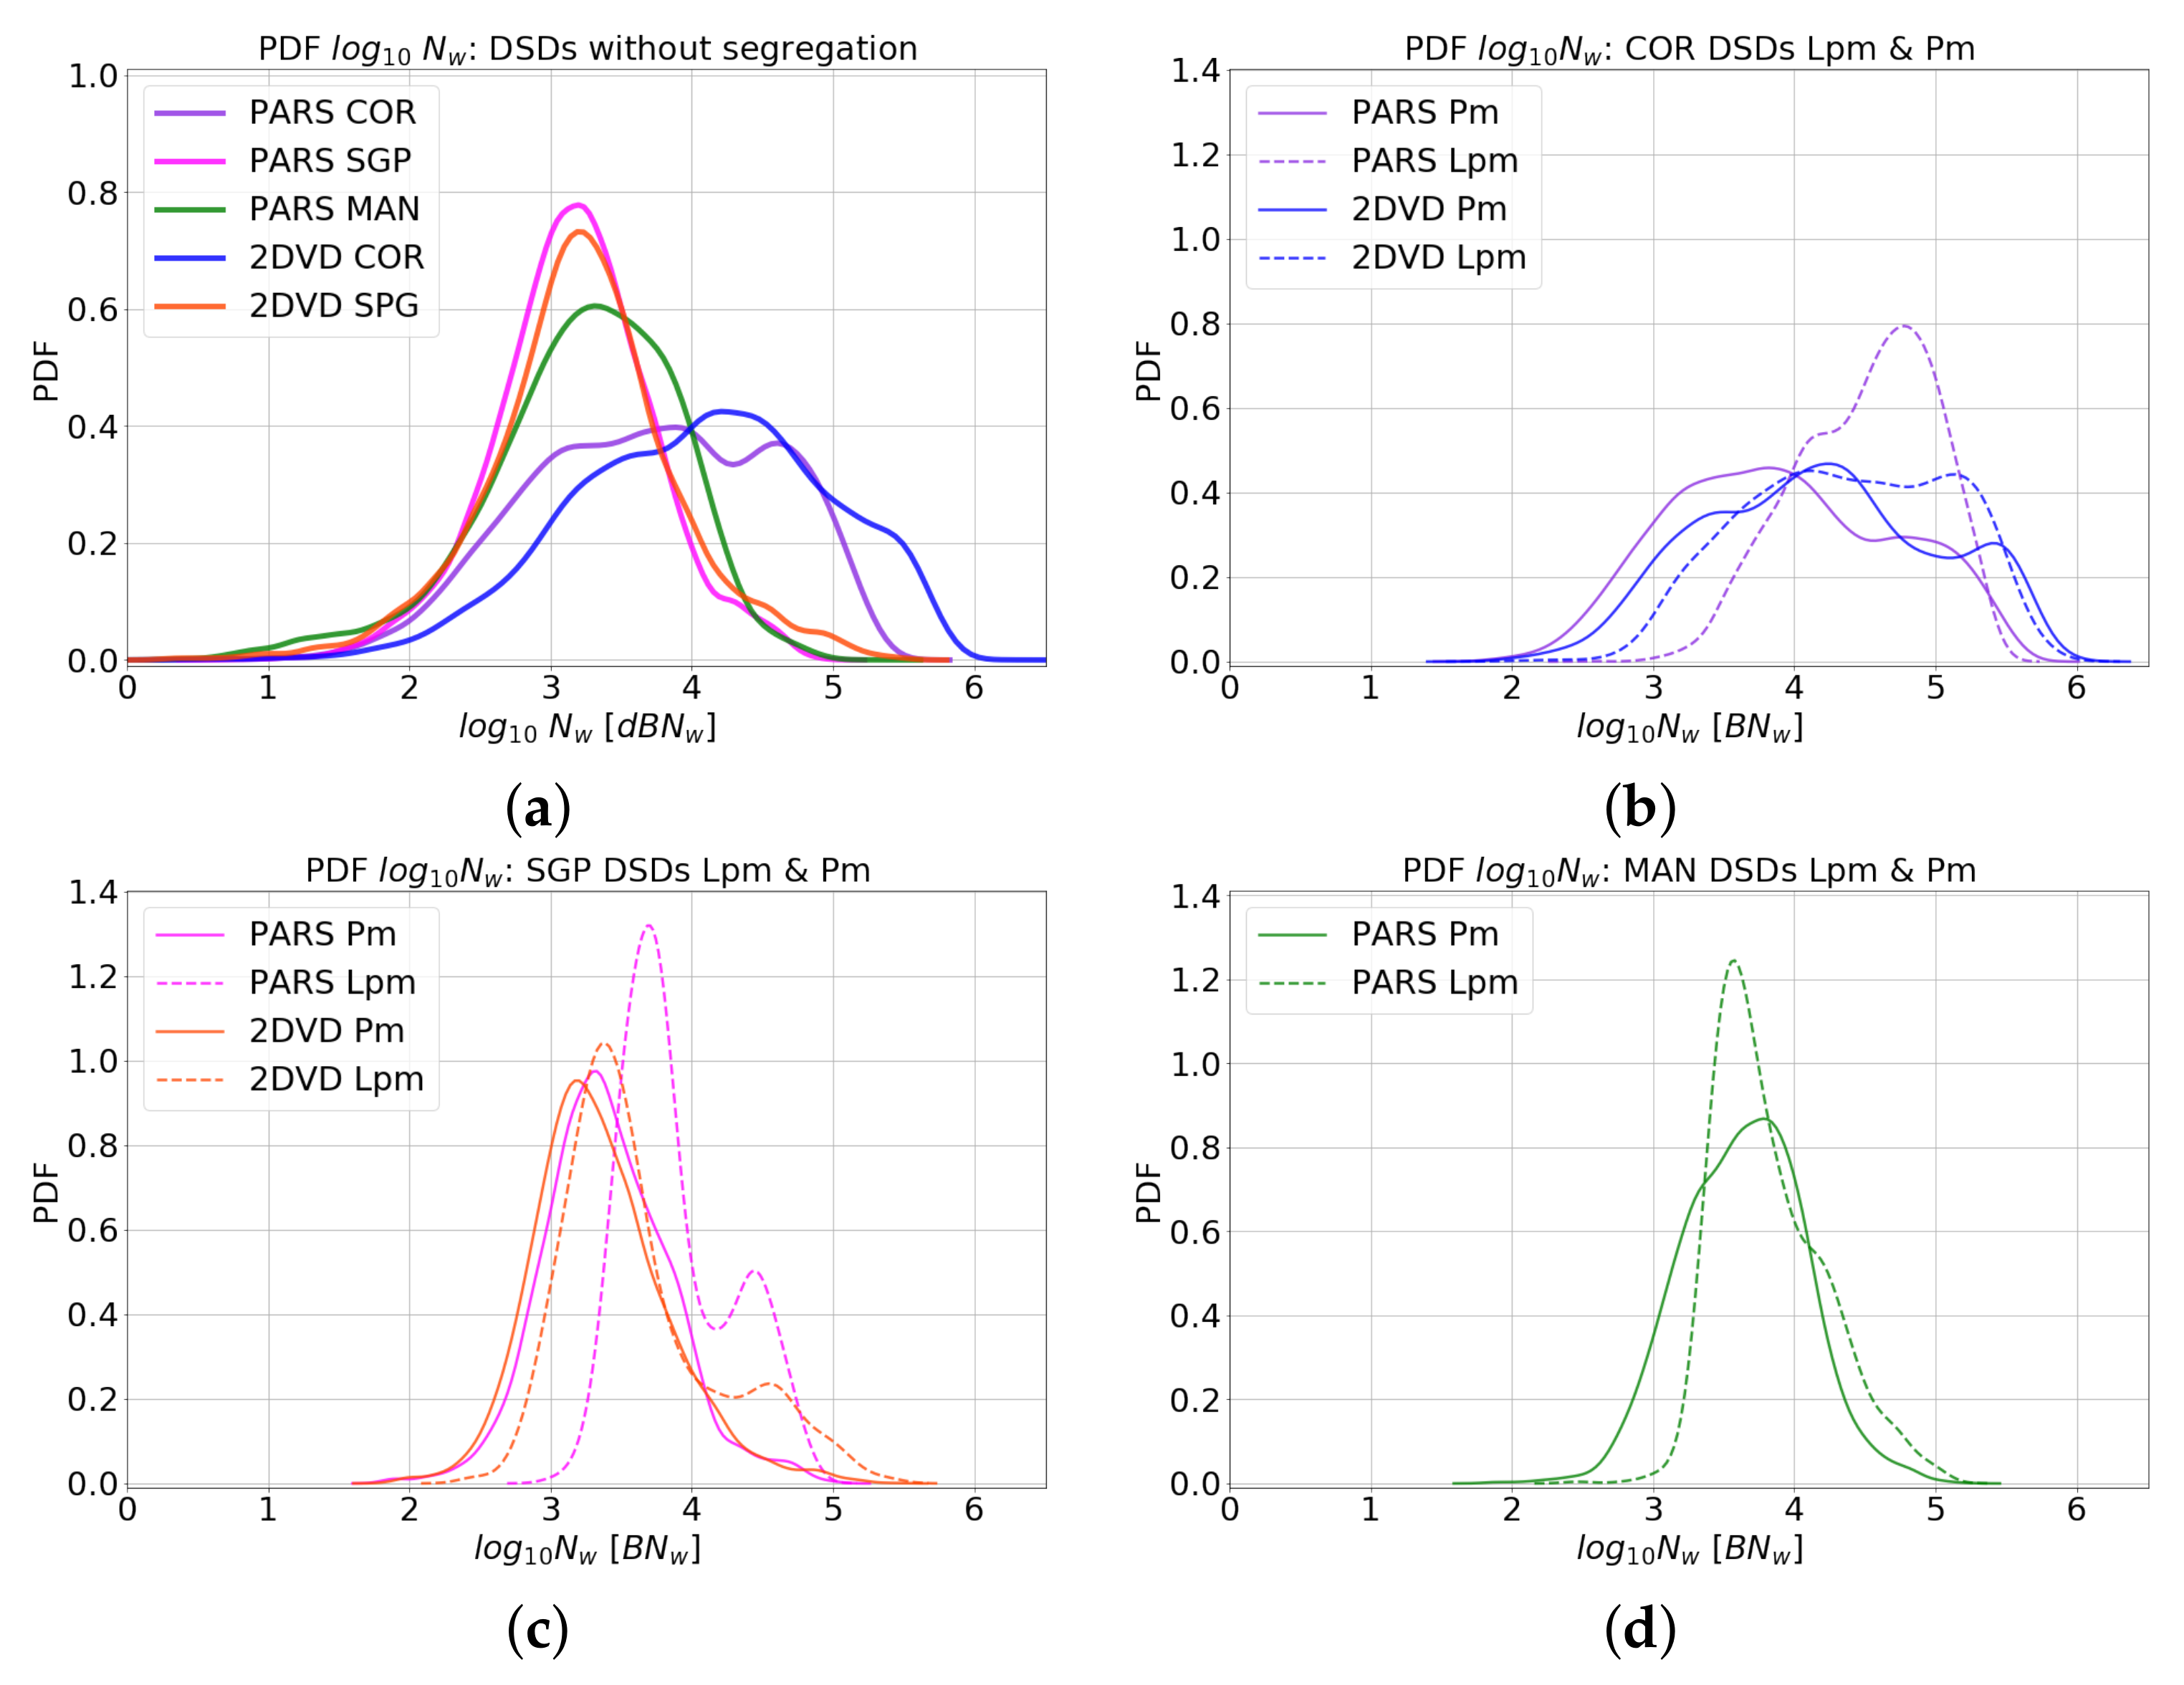
  • The comparison of the DSDs in terms of pdfs showed that the rain-rate distributions were similar between the midlatitude COR and SGP sites and were less frequent than heavy rains at the tropical MAN site. At the COR site, more frequent precipitation was found, with a smaller median mass diameter and a broader range of normalized droplet concentration.
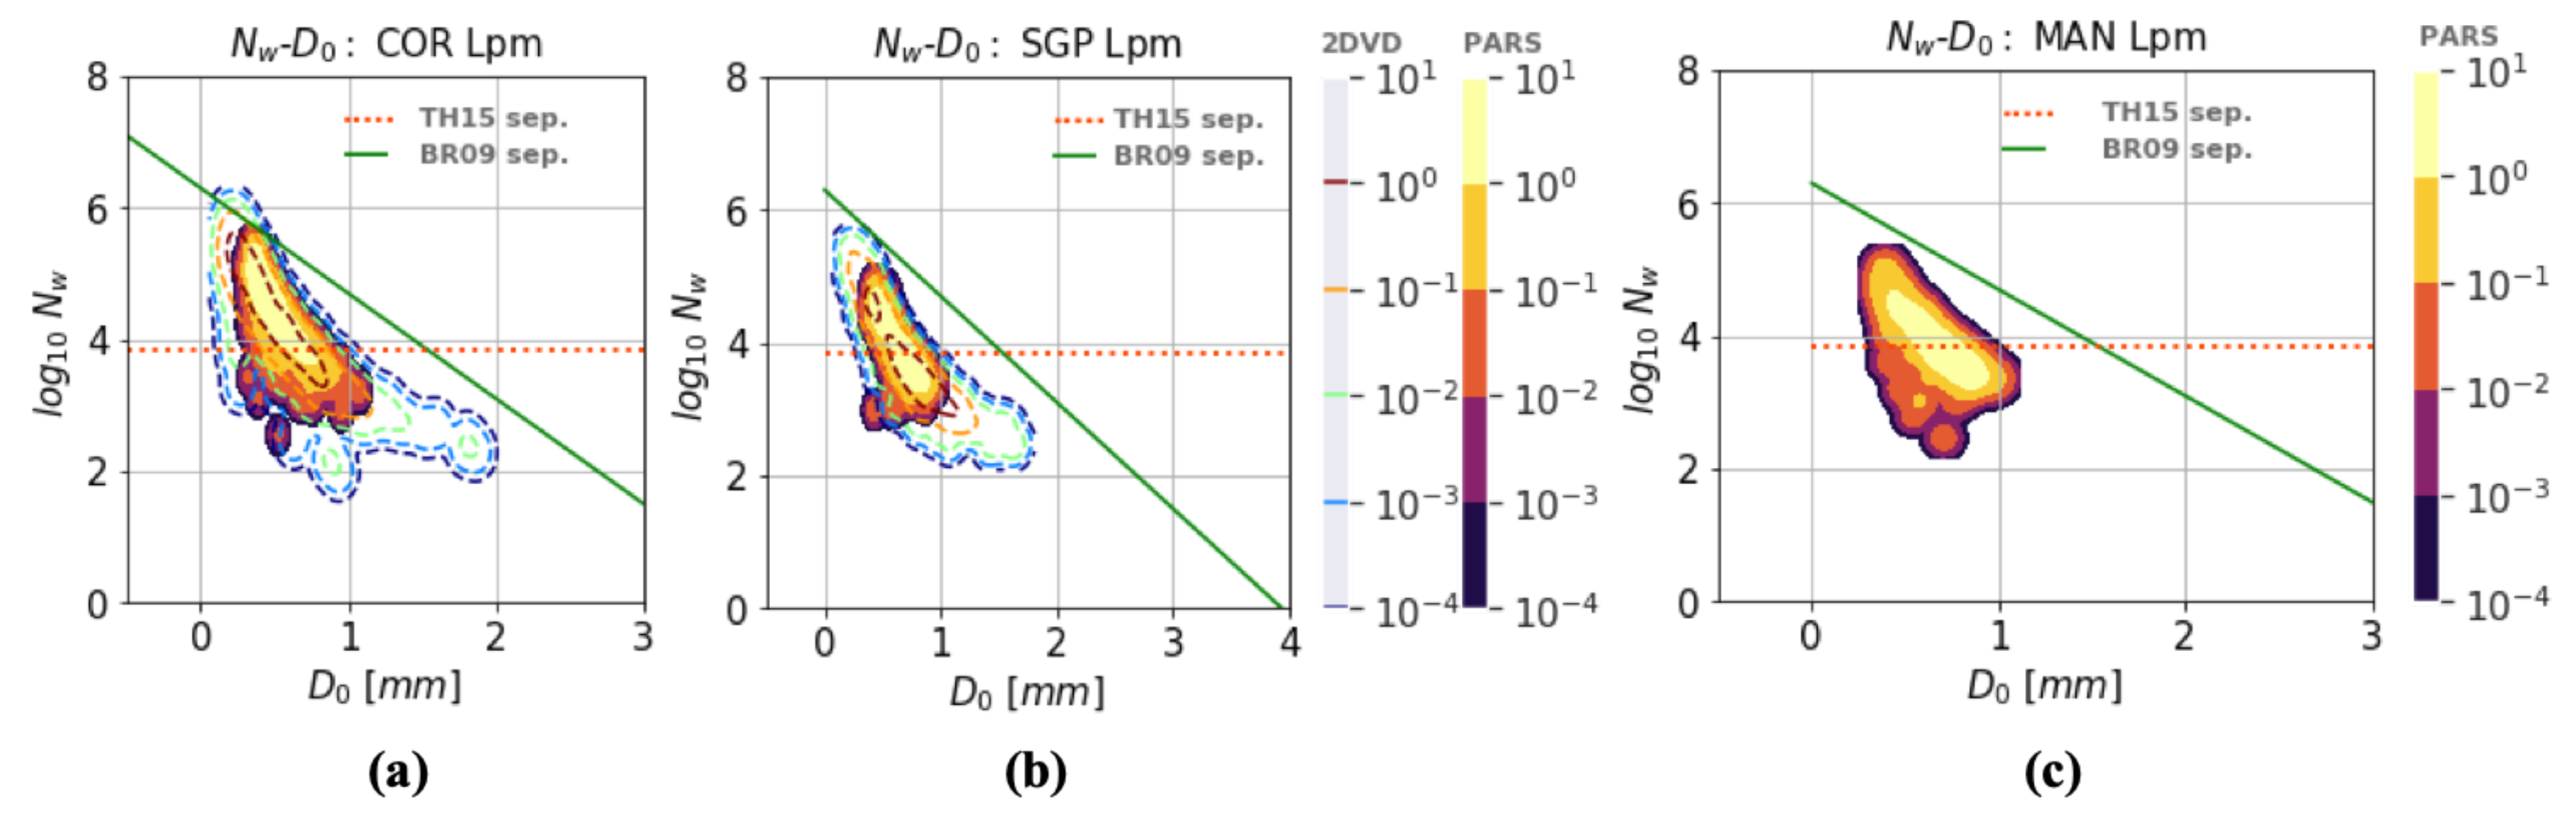
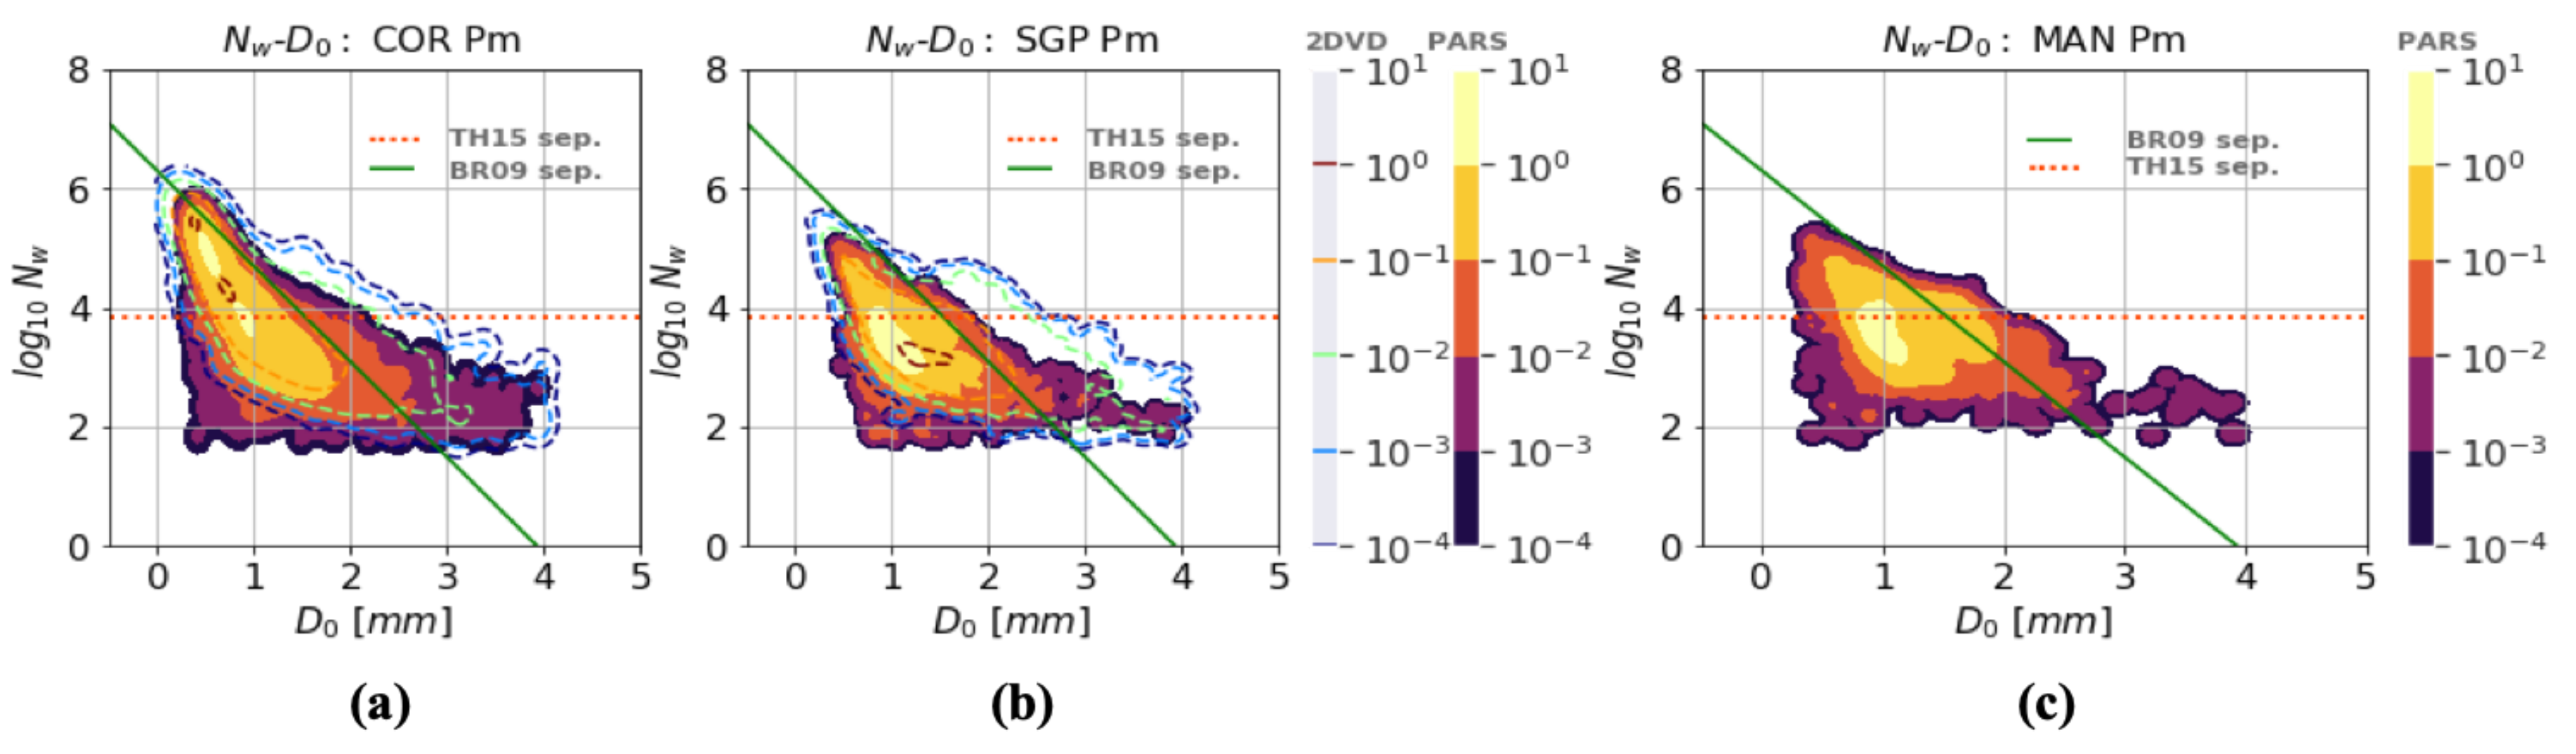
  • The two-dimensional histograms of the normalized droplet concentration N w revealed that COR exhibited a more considerable variability in the N w values for both the P m and L p m rainfall modes in comparison to SGP and MAN, and it had a higher frequency of high concentrations. These high concentrations of particle size distributions extended into the analysis of the N w - D 0 parameter space, where the high concentration numbers observed were associated with small D 0 values. However, the co-variability of L W C and D 0 appeared to be quite similar for the sites examined in the midlatitudes (COR and SGP), contrary to the co-variability at MAN, which appeared to be extended towards higher values of D 0 and L W C , which is a characteristic of tropical rainfall that was observed in previous studies and that is possibly related to enhanced collision–coalescence growth processes there [38,40,116,117].
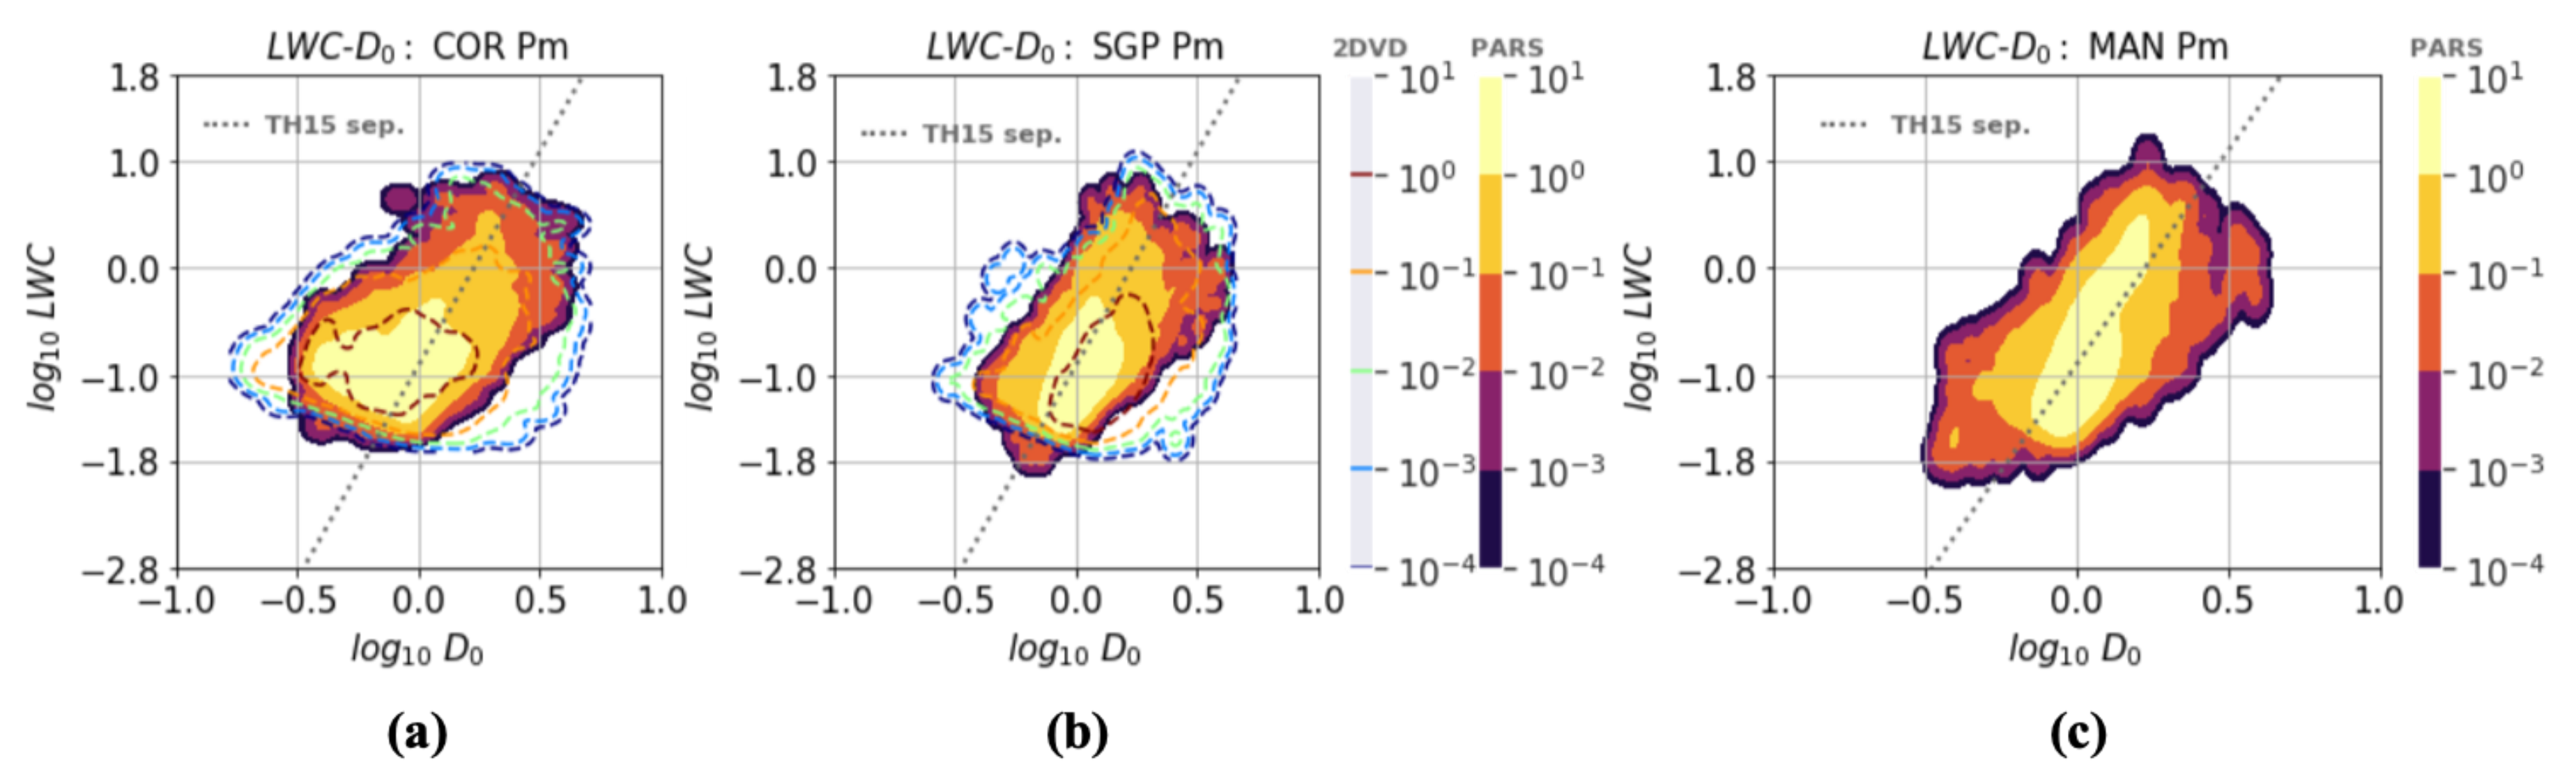
  • In examining cases with high N w and low D 0 values, these appeared to be associated with drizzle and light rain originating from shallow clouds. These warm clouds may be associated with periods of orographic upslope flow, but are not due to seeder–feeder processes, as found in prior studies of light precipitation in complex terrain [62]. Additionally, while some studies have noted that warm clouds may occupy this portion of the N w D 0 parameter space [62], which resembles both the weak convection and vapor deposition features from Dolan et al. [38] in the N w D 0 phase space (Section 4), this region occupies the stratiform region according to disdrometer-based convective–stratiform separation techniques; it is recommended to use these with caution in orographically influenced environments, such as that of the COR site.
These unique precipitation characteristics at the COR site and their relationship with the thermodynamic and kinematic environment are likely impacted by the site’s location in flows that are affected by the complex terrain, and they will be examined further in a future study. The results presented herein display the novel observations of precipitation processes that make the COR site potentially unique relative to previously studied orographically influenced sites. For future research, additional analysis of aircraft-based imaging probes, lidar measurements [122], soundings [123], the KAZR Doppler [108], and C-[124] and Ka-scanning [125] precipitation and cloud radar measurements will better characterize the microphysics of the rain processes in L p m at the COR site, may also be considered.

Author Contributions

Conceptualization, L.R.Z. and S.W.N.; methodology, L.R.Z. and S.W.N.; software, L.R.Z., S.W.N., A.L., and J.C.H.; validation, L.R.Z.; formal analysis, L.R.Z.; investigation, L.R.Z. and S.W.N.; resources, L.R.Z.; data curation, L.R.Z., S.W.N., A.L., and J.C.H.; writing—original draft preparation, L.R.Z.; writing—review and editing, L.R.Z., S.W.N., J.C.H., and A.V.; visualization, L.R.Z. and S.W.N.; supervision, S.W.N.; project administration, S.W.N.; funding acquisition, S.W.N. All authors have read and agreed to the published version of the manuscript.

Funding

This research was funded by the National Science Foundation (grant AGS-1661799), the Department of Energy Atmospheric Systems Research (subcontract 408,988 from the Pacific Northwest National Laboratory), and the BECAL Paraguay (contract 153/2017).

Acknowledgments

The authors thank the three anonymous reviewers and the assistant editor for reviewing and enhancing the manuscript. The authors are thankful for the fruitful scientific discussions with Randy Chase, Itinderjot Singh, Piyush Garg, Mary Jane Bartholomew, Marcelo Garcia, Paola Salio, Candela Casanovas, and Iván Arias. In addition, the authors thank Prateek Sharma for all of his technical support during the global pandemic period. In addition, the authors thank the RELAMPAGO-CACTI Science Team for the guidance and collaboration during the intensive observation period in Córdoba, Argentina. Furthermore, the authors thank all of the participants in the three field campaigns for their tireless efforts in collecting the data used in this study. The datasets were made available through the US Department of Energy as part of the Atmospheric Radiation Measurement Program.

Conflicts of Interest

The authors declare no conflict of interest.

Abbreviations

The following abbreviations are used in this manuscript:
ARMAtmospheric Radiation Measurement
AMF1ARM Mobile Facility 1
BECALProgram of Scholarships from the Government of Paraguay “Becas Carlos Antonio López”
CACTICloud, Aerosol, and Complex Terrain Interactions
CORCórdoba
DOAJDirectory of open-access journals
DOEDepartment of Energy
DSDDrop size distribution
2DVD2D-Video Disdrometer
GoAmazonGreen Ocean Amazon 2014/15
KAZRKa ARM Zenith Radar
MANManacapuru
MAOSMobile Aerosol Observing System
MDPIMultidisciplinary Digital Publishing Institute
NSFNational Science Foundation
PARSParsivel2 disdrometer
PARS/2DVDParsivel disdrometer and/or 2D-Video Disdrometer
ProvProvince
PSDParticle Size Distribution
RELAMPAGORemote sensing of Electrification, Lightning, And mesoscale/microscale Processes with Adaptive Ground Observations 2018/2019
SDCSierras de Córdoba
SGPSouthern Great Plains
TRMMTropical Rainfall Measuring Mission

Appendix A. DSD Parameter Relationships Used in the Data Processing

Appendix A.1. Lhermitte Terminal Velocity: vLhermitte

The terminal velocity of falling raindrops v L h e r m i t t e (in m s 1 ), which was calculated following Lhermitte (1988 [126]) and was considered in the ARM Parsivel2 Handbook [92], is shown in the equation below.
v L h e r m i t t e = 9.24 ( 1 e 6.8 ( D 10 ) 2 4.88 D 10 )

Appendix A.2. Mass Spectrum: m(D)

Following Williams et al. [25], the mass spectrum m ( D ) (in g mm 1 m 3 ) represents mass distribution as a function of the raindrop diameter, where ρ is the density of water and N(D) is the raindrop number concentration.
m ( D ) = π 6 x 10 3 ρ w N ( D ) D 3

Appendix A.3. Mass-Weighted Mean Diameter: Dm

The mass-weighted mean diameter or mass spectrum mean diameter D m (in mm ) corresponds to the first moment of the mass spectrum, as indicated by Williams et al. [25].
D m = D m i n D m a x N ( D ) D 4 d D D m i n D m a x N ( D ) D 3 d D = D m i n D m a x m ( D ) D d D D m i n D m a x m ( D ) d D

Appendix A.4. Mass Standard Deviation: σm

According to Williams et al. [25], the mass standard deviation σ m (in mm ) is the square root of the second moment of the mass spectrum or the mass spectrum variance σ m 2 (in mm 2 ).
σ m = D m i n D m a x ( D D m ) 2 N ( D ) D 3 d D D m i n D m a x N ( D ) D 3 d D = D m i n D m a x ( D D m ) 2 m ( D ) d D D m i n D m a x m ( D ) d D

Appendix A.5. Normalized Intercept Parameter: Nw

The normalized intercept parameter N w (in m 3 mm 1 ), which is normalized with respect to D m , is proportional to the density of water ρ w and the liquid water content L W C [25,32,105].
N w = 4 4 π ρ w L W C D m 4

Appendix A.6. Liquid Water Content: LWC

The liquid water content L W C (in g m 3 ) for a gamma-shaped DSD, where ρ w is the density of water, is given by the equation below, which was indicated by Williams et al. [25].
L W C = π 6 x 10 3 ρ w D m i n D m a x N ( D ) D 3 d D

Appendix A.7. Median Volume Diameter: D0

As documented by Williams (2011) [105], the median raindrop diameter D 0 (in mm ) represents the diameter that equally divides the total liquid water content into two equal portions and is given by the analytical solution of the integral equation below.
0 D 0 m ( D ) d D = 0.5 0 m ( D ) d D

References

  1. Baker, M. Cloud microphysics and climate. Science 1997, 276, 1072–1078. [Google Scholar] [CrossRef]
  2. Jakob, C.; Miller, M. Parameterization of physical processes: Clouds. In Encyclopedia of Atmospheric Sciences; Elsevier: Amsterdam, The Netherlands, 2003; pp. 1692–1698. [Google Scholar]
  3. Paukert, M.; Fan, J.; Rasch, P.J.; Morrison, H.; Milbrandt, J.; Shpund, J.; Khain, A. Three-moment representation of rain in a bulk microphysics model. J. Adv. Model. Earth Syst. 2019, 11, 257–277. [Google Scholar] [CrossRef] [Green Version]
  4. Lamb, D.; Verlinde, J. Physics and Chemistry of Clouds; Cambridge University Press: Cambridge, UK, 2011. [Google Scholar]
  5. Lloyd, G.; Dearden, C.; Choularton, T.; Crosier, J.; Bower, K. Observations of the origin and distribution of ice in cold, warm, and occluded frontal systems during the DIAMET campaign. Mon. Weather Rev. 2014, 142, 4230–4255. [Google Scholar] [CrossRef]
  6. Sui, C.H.; Tsay, C.T.; Li, X. Convective—Stratiform rainfall separation by cloud content. J. Geophys. Res. Atmos. 2007, 112. [Google Scholar] [CrossRef]
  7. Williams, E.R. Meteorological aspects of thunderstorms. Handb. Atmos. Electrodyn. 1995, 1, 27–60. [Google Scholar]
  8. Emanuel, K.A. Atmospheric Convection; Oxford University Press on Demand: Oxford, UK, 1994. [Google Scholar]
  9. Jakob, C. An improved strategy for the evaluation of cloud parameterizations in GCMs. Bull. Am. Meteorol. Soc. 2003, 84, 1387–1402. [Google Scholar] [CrossRef]
  10. Chandrasekar, V.; Bringi, V. Simulation of radar reflectivity and surface measurements of rainfall. J. Atmos. Ocean. Technol. 1987, 4, 464–478. [Google Scholar] [CrossRef] [Green Version]
  11. Atlas, D.; Ulbrich, C.W. Early foundations of the measurement of rainfall by radar. In Radar in Meteorology; Springer: New York, NY, USA, 1990; pp. 86–97. [Google Scholar]
  12. Joss, J.; Waldvogel, A.; Collier, C. Precipitation measurement and hydrology. In Radar in Meteorology; Springer: New York, NY, USA, 1990; pp. 577–606. [Google Scholar]
  13. Uijlenhoet, R.; Pomeroy, J. Raindrop size distributions and radar reflectivity-rain rate relationships for radar hydrology. Hydrol. Earth Syst. Sci. 2001, 5, 615–627. [Google Scholar] [CrossRef] [Green Version]
  14. Rosenfeld, D.; Ulbrich, C.W. Cloud microphysical properties, processes, and rainfall estimation opportunities. In Radar and Atmospheric Science: A Collection of Essays in Honor of David Atlas; Springer: New York, NY, USA, 2003; pp. 237–258. [Google Scholar]
  15. Bringi, V.; Chandrasekar, V. Polarimetric Doppler Weather Radar: Principles and Applications; Cambridge University Press: Cambridge, UK, 2001. [Google Scholar]
  16. Krajewski, W.; Smith, J.A. Radar hydrology: Rainfall estimation. Adv. Water Resour. 2002, 25, 1387–1394. [Google Scholar] [CrossRef]
  17. Berne, A.; Krajewski, W.F. Radar for hydrology: Unfulfilled promise or unrecognized potential? Adv. Water Resour. 2013, 51, 357–366. [Google Scholar] [CrossRef]
  18. Rauber, R.M.; Nesbitt, S.L. Radar Meteorology: A First Course; John Wiley & Sons: Hoboken, NJ, USA, 2018. [Google Scholar]
  19. Heinemann, G.; Reudenbach, C. Precipitation dynamics of convective clouds. In Dynamics of Multiscale Earth Systems; Springer: New York, NY, USA, 2003; pp. 186–198. [Google Scholar]
  20. Tao, W.K.; Lang, S.; Zeng, X.; Li, X.; Matsui, T.; Mohr, K.; Posselt, D.; Chern, J.; Peters-Lidard, C.; Norris, P.M.; et al. The Goddard Cumulus Ensemble model (GCE): Improvements and applications for studying precipitation processes. Atmos. Res. 2014, 143, 392–424. [Google Scholar] [CrossRef] [Green Version]
  21. Suzuki, K.; Stephens, G.; Bodas-Salcedo, A.; Wang, M.; Golaz, J.C.; Yokohata, T.; Koshiro, T. Evaluation of the warm rain formation process in global models with satellite observations. J. Atmos. Sci. 2015, 72, 3996–4014. [Google Scholar] [CrossRef]
  22. Tao, W.K.; Chern, J.; Iguchi, T.; Lang, S.; Lee, M.I.; Li, X.; Loftus, A.; Matsui, T.; Mohr, K.; Nicholls, S.; et al. Microphysics in Goddard Multi-scale Modeling Systems: A Review. In Current Trends in the Representation of Physical Processes in Weather and Climate Models; Springer: Singapore, 2019; pp. 253–316. [Google Scholar] [CrossRef]
  23. Rosewell, C.J. Rainfall kinetic energy in eastern Australia. J. Clim. Appl. Meteorol. 1986, 25, 1695–1701. [Google Scholar] [CrossRef] [Green Version]
  24. Caracciolo, C.; Napoli, M.; Porcù, F.; Prodi, F.; Dietrich, S.; Zanchi, C.; Orlandini, S. Raindrop Size Distribution and Soil Erosion. J. Irrig. Drain. Eng. 2012, 138, 461–469. [Google Scholar] [CrossRef]
  25. Williams, C.R.; Bringi, V.; Carey, L.D.; Chandrasekar, V.; Gatlin, P.N.; Haddad, Z.S.; Meneghini, R.; Joseph Munchak, S.; Nesbitt, S.W.; Petersen, W.A.; et al. Describing the shape of raindrop size distributions using uncorrelated raindrop mass spectrum parameters. J. Appl. Meteorol. Climatol. 2014, 53, 1282–1296. [Google Scholar] [CrossRef]
  26. Gong, X.; Zhu, D.; Zhang, L.; Zhang, Y.; Ge, M.; Yang, W. Drop size distribution of fixed spray-plate sprinklers with two-dimensional video disdrometer. Nongye Jixie Xuebao Trans. Chin. Soc. Agric. Mach. 2014, 45, 128–148. [Google Scholar]
  27. Vaughan, G.; Methven, J.; Anderson, D.; Antonescu, B.; Baker, L.; Baker, T.; Ballard, S.; Bower, K.; Brown, P.; Chagnon, J.; et al. Cloud banding and winds in intense European cyclones: Results from the DIAMET project. Bull. Am. Meteorol. Soc. 2015, 96, 249–265. [Google Scholar] [CrossRef]
  28. Duan, Q.; Pappenberger, F.; Wood, A.; Cloke, H.L.; Schaake, J. Handbook of Hydrometeorological Ensemble Forecasting; Springer: New York, NY, USA, 2019. [Google Scholar]
  29. Marshall, J.S.; Palmer, W.M.K. The distribution of raindrops with size. J. Meteorol. 1948, 5, 165–166. [Google Scholar] [CrossRef]
  30. Ulbrich, C.W. Natural variations in the analytical form of the raindrop size distribution. J. Clim. Appl. Meteorol. 1983, 22, 1764–1775. [Google Scholar] [CrossRef] [Green Version]
  31. Willis, P.T. Functional fits to some observed drop size distributions and parameterization of rain. J. Atmos. Sci. 1984, 41, 1648–1661. [Google Scholar] [CrossRef] [Green Version]
  32. Testud, J.; Oury, S.; Black, R.A.; Amayenc, P.; Dou, X. The concept of “normalized” distribution to describe raindrop spectra: A tool for cloud physics and cloud remote sensing. J. Appl. Meteorol. 2001, 40, 1118–1140. [Google Scholar] [CrossRef]
  33. Seliga, T.A.; Bringi, V. Potential use of radar differential reflectivity measurements at orthogonal polarizations for measuring precipitation. J. Appl. Meteorol. 1976, 15, 69–76. [Google Scholar] [CrossRef] [Green Version]
  34. Ulbrich, C.W.; Atlas, D. The rain parameter diagram: Methods and applications. J. Geophys. Res. Ocean. 1978, 83, 1319–1325. [Google Scholar] [CrossRef]
  35. Wilson, J.W.; Brandes, E.A. Radar measurement of rainfall—A summary. Bull. Am. Meteorol. Soc. 1979, 60, 1048–1060. [Google Scholar] [CrossRef] [Green Version]
  36. Bringi, V.; Chandrasekar, V.; Hubbert, J.; Gorgucci, E.; Randeu, W.; Schoenhuber, M. Raindrop size distribution in different climatic regimes from disdrometer and dual-polarized radar analysis. J. Atmos. Sci. 2003, 60, 354–365. [Google Scholar] [CrossRef]
  37. Deo, A.; Walsh, K.J. Contrasting tropical cyclone and non-tropical cyclone related rainfall drop size distribution at Darwin, Australia. Atmos. Res. 2016, 181, 81–94. [Google Scholar] [CrossRef]
  38. Dolan, B.; Fuchs, B.; Rutledge, S.; Barnes, E.; Thompson, E. Primary modes of global drop size distributions. J. Atmos. Sci. 2018, 75, 1453–1476. [Google Scholar] [CrossRef]
  39. Bringi, V.; Williams, C.; Thurai, M.; May, P. Using dual-polarized radar and dual-frequency profiler for DSD characterization: A case study from Darwin, Australia. J. Atmos. Ocean. Technol. 2009, 26, 2107–2122. [Google Scholar] [CrossRef]
  40. Thompson, E.J.; Rutledge, S.A.; Dolan, B.; Thurai, M. Drop size distributions and radar observations of convective and stratiform rain over the equatorial Indian and west Pacific Oceans. J. Atmos. Sci. 2015, 72, 4091–4125. [Google Scholar] [CrossRef]
  41. Thurai, M.; Bringi, V.; May, P. CPOL radar-derived drop size distribution statistics of stratiform and convective rain for two regimes in Darwin, Australia. J. Atmos. Ocean. Technol. 2010, 27, 932–942. [Google Scholar] [CrossRef]
  42. Penide, G.; Kumar, V.V.; Protat, A.; May, P.T. Statistics of drop size distribution parameters and rain rates for stratiform and convective precipitation during the north Australian wet season. Mon. Weather Rev. 2013, 141, 3222–3237. [Google Scholar] [CrossRef]
  43. Gatlin, P.N.; Thurai, M.; Bringi, V.; Petersen, W.; Wolff, D.; Tokay, A.; Carey, L.; Wingo, M. Searching for large raindrops: A global summary of two-dimensional video disdrometer observations. J. Appl. Meteorol. Climatol. 2015, 54, 1069–1089. [Google Scholar] [CrossRef]
  44. Thurai, M.; Gatlin, P.; Bringi, V.; Petersen, W.; Kennedy, P.; Notaroš, B.; Carey, L. Toward completing the raindrop size spectrum: Case studies involving 2D-video disdrometer, droplet spectrometer, and polarimetric radar measurements. J. Appl. Meteorol. Climatol. 2017, 56, 877–896. [Google Scholar] [CrossRef]
  45. Bumke, K.; Seltmann, J. Analysis of measured drop size spectra over land and sea. ISRN Meteorol. 2012, 2012, 296575. [Google Scholar] [CrossRef] [Green Version]
  46. Chen, B.; Wang, J.; Gong, D. Raindrop size distribution in a midlatitude continental squall line measured by Thies optical disdrometers over East China. J. Appl. Meteorol. Climatol. 2016, 55, 621–634. [Google Scholar] [CrossRef]
  47. Chase, R.; Nesbitt, S.; McFarquhar, G. Evaluation of the microphysical assumptions within GPM-DPR using ground-based observations of rain and snow. Atmosphere 2020, 11, 619. [Google Scholar] [CrossRef]
  48. Seidel, J.; Trachte, K.; Orellana-Alvear, J.; Figueroa, R.; Célleri, R.; Bendix, J.; Fernandez, C.; Huggel, C. Precipitation characteristics at two locations in the tropical Andes by means of vertically pointing micro-rain radar observations. Remote Sens. 2019, 11, 2985. [Google Scholar] [CrossRef] [Green Version]
  49. Guyot, A.; Pudashine, J.; Protat, A.; Uijlenhoet, R.; Pauwels, V.; Seed, A.; Walker, J.P. Effect of disdrometer type on rain drop size distribution characterisation: A new dataset for south-eastern Australia. Hydrol. Earth Syst. Sci. 2019, 23, 4737–4761. [Google Scholar] [CrossRef] [Green Version]
  50. Tokay, A.; Kruger, A.; Krajewski, W.F.; Kucera, P.A.; Pereira Filho, A.J. Measurements of drop size distribution in the southwestern Amazon basin. J. Geophys. Res. Atmos. 2002, 107, LBA-19. [Google Scholar] [CrossRef]
  51. Martins, R.C.; Machado, L.A.; Costa, A.A. Characterization of the microphysics of precipitation over Amazon region using radar and disdrometer data. Atmos. Res. 2010, 96, 388–394. [Google Scholar] [CrossRef]
  52. Tokay, A.; Petersen, W.A.; Gatlin, P.; Wingo, M. Comparison of raindrop size distribution measurements by collocated disdrometers. J. Atmos. Ocean. Technol. 2013, 30, 1672–1690. [Google Scholar] [CrossRef]
  53. Giangrande, S.E.; Toto, T.; Jensen, M.P.; Bartholomew, M.J.; Feng, Z.; Protat, A.; Williams, C.R.; Schumacher, C.; Machado, L. Convective cloud vertical velocity and mass-flux characteristics from radar wind profiler observations during GoAmazon2014/5. J. Geophys. Res. Atmos. 2016, 121, 12–891. [Google Scholar] [CrossRef]
  54. Martin, S.; Mei, F.; Alexander, L.; Artaxo, P.; Barbosa, H.; Bartholomew, M.J.; Biscaro, T.; Buseck, P.; Chand, D.; Comstock, J.; et al. Campaign Datasets for Observations and Modeling of the Green Ocean Amazon (GOAMAZON). 2016. Available online: https://www.osti.gov/dataexplorer/biblio/dataset/1346559 (accessed on 29 July 2021).
  55. Wang, D.; Giangrande, S.E.; Bartholomew, M.J.; Hardin, J.; Feng, Z.; Thalman, R.; Machado, L.A. The Green Ocean: Precipitation insights from the GoAmazon2014/5 experiment. Atmos. Chem. Phys. Discuss. (Online) 2018, 18. [Google Scholar] [CrossRef] [Green Version]
  56. Varble, A.C.; Nesbitt, S.W.; Salio, P.; Hardin, J.C.; Bharadwaj, N.; Borque, P.; DeMott, P.J.; Feng, Z.; Hill, T.C.; Marquis, J.N.; et al. Utilizing a Storm-Generating Hotspot to Study Convective Cloud Transitions: The CACTI Experiment. Bull. Am. Meteorol. Soc. 2021, 1–67. [Google Scholar] [CrossRef]
  57. Nesbitt, S.W.; Salio, P.V.; Ávila, E.; Bitzer, P.; Carey, L.; Chandrasekar, V.; Deierling, W.; Dominguez, F.; Dillon, M.E.; Garcia, C.M.; et al. A storm safari in Subtropical South America: Proyecto RELAMPAGO. Bull. Am. Meteorol. Soc. 2021, 1–64. [Google Scholar] [CrossRef]
  58. Mulholland, J.P.; Nesbitt, S.W.; Trapp, R.J.; Rasmussen, K.L.; Salio, P.V. Convective storm life cycle and environments near the Sierras de Córdoba, Argentina. Mon. Weather Rev. 2018, 146, 2541–2557. [Google Scholar] [CrossRef]
  59. Mulholland, J.P.; Nesbitt, S.W.; Trapp, R.J. A Case Study of Terrain Influences on Upscale Convective Growth of a Supercell. Mon. Weather Rev. 2019, 147, 4305–4324. [Google Scholar] [CrossRef]
  60. Varble, A.; Nesbitt, S.; Salio, P.; Avila, E.; Borque, P.; DeMott, P.; McFarquhar, G.; van den Heever, S.; Zipser, E.; Gochis, D.; et al. Cloud, Aerosol, and Complex Terrain Interactions (CACTI) Field Campaign Report; Technical Report; ARM Data Center, Oak Ridge National Laboratory (ORNL): Oak Ridge, TN, USA, 2019. [Google Scholar]
  61. Cancelada, M.; Salio, P.; Vila, D.; Nesbitt, S.W.; Vidal, L. Backward Adaptive Brightness Temperature Threshold Technique (BAB3T): A methodology to determine extreme convective initiation regions using satellite infrared imagery. Remote. Sens. 2020, 12, 337. [Google Scholar] [CrossRef] [Green Version]
  62. Wilson, A.M.; Barros, A.P. An Investigation of Warm Rainfall Microphysics in the Southern Appalachians: Orographic Enhancement via Low-Level Seeder–Feeder Interactions. J. Atmos. Sci. 2014, 71, 1783–1805. [Google Scholar] [CrossRef]
  63. Zipser, E.J.; Cecil, D.J.; Liu, C.; Nesbitt, S.W.; Yorty, D.P. Where are the most intense thunderstorms on Earth? Bull. Am. Meteorol. Soc. 2006, 87, 1057–1072. [Google Scholar] [CrossRef] [Green Version]
  64. Nesbitt, S.W.; Cifelli, R.; Rutledge, S.A. Storm morphology and rainfall characteristics of TRMM precipitation features. Mon. Weather Rev. 2006, 134, 2702–2721. [Google Scholar] [CrossRef] [Green Version]
  65. Romatschke, U.; Houze, R.A., Jr. Extreme summer convection in South America. J. Clim. 2010, 23, 3761–3791. [Google Scholar] [CrossRef]
  66. Rasmussen, K.L.; Houze, R.A., Jr. Orogenic convection in subtropical South America as seen by the TRMM satellite. Mon. Weather Rev. 2011, 139, 2399–2420. [Google Scholar] [CrossRef]
  67. Rasmussen, K.L.; Zuluaga, M.D.; Houze, R.A., Jr. Severe convection and lightning in subtropical South America. Geophys. Res. Lett. 2014, 41, 7359–7366. [Google Scholar] [CrossRef]
  68. Rasmussen, K.L.; Chaplin, M.; Zuluaga, M.; Houze, R., Jr. Contribution of extreme convective storms to rainfall in South America. J. Hydrometeorol. 2016, 17, 353–367. [Google Scholar] [CrossRef]
  69. Rutledge, S.A.; Houze, R.A., Jr.; Biggerstaff, M.I.; Matejka, T. The Oklahoma–Kansas Mesoscale Convective System of 10–11 June 1985: Precipitation Structure and Single-Doppler Radar Analysis. Mon. Weather Rev. 1988, 116, 1409–1430. [Google Scholar] [CrossRef] [Green Version]
  70. Casanovas, C.; Salio, P.; Galligani, V.; Dolan, B.; Nesbitt, S.W. Drop Size Distribution Variability in Central Argentina during RELAMPAGO-CACTI. Remote Sens. 2021, 13, 2026. [Google Scholar] [CrossRef]
  71. Karl, T.R.; Knight, R.W. Secular trends of precipitation amount, frequency, and intensity in the United States. Bull. Am. Meteorol. Soc. 1998, 79, 231–242. [Google Scholar] [CrossRef]
  72. Wolf, A.T.; Natharius, J.A.; Danielson, J.J.; Ward, B.S.; Pender, J.K. International river basins of the world. Int. J. Water Resour. Dev. 1999, 15, 387–427. [Google Scholar] [CrossRef]
  73. Barraqué, B. The common property issue in flood control through land use in F rance. J. Flood Risk Manag. 2017, 10, 182–194. [Google Scholar] [CrossRef]
  74. Houze, R.A., Jr.; Smull, B.F.; Dodge, P. Mesoscale organization of springtime rainstorms in Oklahoma. Mon. Weather Rev. 1990, 118, 613–654. [Google Scholar] [CrossRef]
  75. Nobre, C.A. The Amazon and Climate. 1984. Available online: https://ntrs.nasa.gov/api/citations/19840014047/downloads/19840014047.pdf (accessed on 29 July 2021).
  76. Gat, J.R.; Matsui, E. Atmospheric water balance in the Amazon Basin: An isotopic evapotranspiration model. J. Geophys. Res. Atmos. 1991, 96, 13179–13188. [Google Scholar] [CrossRef]
  77. Valverde, M.C.; Marengo, J.A. Extreme rainfall indices in the hydrographic basins of Brazil. Open J. Mod. Hydrol. 2014, 2014, 41739. [Google Scholar] [CrossRef] [Green Version]
  78. Nesbitt, S.W.; Zipser, E.J.; Cecil, D.J. A census of precipitation features in the tropics using TRMM: Radar, ice scattering, and lightning observations. J. Clim. 2000, 13, 4087–4106. [Google Scholar] [CrossRef] [Green Version]
  79. Nunes, A.M.; Silva Dias, M.A.; Anselmo, E.M.; Morales, C.A. Severe convection features in the Amazon Basin: A TRMM-based 15-year evaluation. Front. Earth Sci. 2016, 4, 37. [Google Scholar] [CrossRef] [Green Version]
  80. Marengo, J.A.; Fisch, G.F.; Alves, L.M.; Sousa, N.V.; Fu, R.; Zhuang, Y. Meteorological context of the onset and end of the rainy season in Central Amazonia during the GoAmazon2014/5. Atmos. Chem. Phys. 2017, 17, 7671. [Google Scholar] [CrossRef] [Green Version]
  81. Braga, R.C.; Rosenfeld, D.; Weigel, R.; Jurkat, T.; Andreae, M.O.; Wendisch, M.; Pöschl, U.; Voigt, C.; Mahnke, C.; Borrmann, S.; et al. Aerosol concentrations determine the height of warm rain and ice initiation in convective clouds over the Amazon basin. Atmos. Chem. Phys. (ACP) 2017, 17, 14433–14456. [Google Scholar] [CrossRef] [Green Version]
  82. Martin, S.; Artaxo, P.; Machado, L.; Manzi, A.; Souza, R.; Schumacher, C.; Wang, J.; Andreae, M.; Barbosa, H.; Fan, J.; et al. Introduction: Observations and modeling of the Green Ocean Amazon (GoAmazon2014/5). Atmos. Chem. Phys. 2016, 16, 4785–4797. [Google Scholar] [CrossRef] [Green Version]
  83. Lozada, J.M.D.; García, C.M.; Herrero, H.; Barchiesi, G.M.; Romagnoli, M.; Portapila, M.; Lopez, F.; Castelló, E.; Cossavella, A.; Brarda, J.P. Cuantificación del escurrimiento superficial de la cuenca del Río Carcarañá. Rev. Fac. Cienc. Exactas Físicas Nat. 2015, 2, 59–72. [Google Scholar]
  84. LeFevre, K. Stormy Vineyards. p. 52. Available online: https://earthdata.nasa.gov/learn/sensing-our-planet/stormy-vineyards (accessed on 29 July 2021).
  85. Stenta, H.; Riccardi, G.; Basile, P.A. Modelación distribuida del Escurrimiento Superficial en la Cuenca del río Tercero-Carcaraña. Available online: https://rephip.unr.edu.ar/handle/2133/7172 (accessed on 29 July 2021).
  86. Bazán, R.; García, M.; Lozada, J.M.D.; Chalimond, M.L.; Herrero, H.; Bonansea, M.; Bonfanti, E.; Busso, F.; Cossavella, A. Estudio multidisciplinario e interinstitucional de dos fuentes principales de agua potable para la Provincia de Córdoba. Rev. Fac. Cienc. Exactas Físicas Nat. 2018, 5, 57. [Google Scholar]
  87. Pal, S.; Dominguez, F.; Dillon, M.E.; Alvarez, J.; Garcia, C.M.; Nesbitt, S.W.; Gochis, D. Hydrometeorological Observations and Modeling of an Extreme Rainfall Event using WRF and WRF-Hydro during the RELAMPAGO Field Campaign in Argentina. J. Hydrometeorol. 2020, 22, 331–351. [Google Scholar] [CrossRef]
  88. Varble, A.; Hardin, J.C.; Bharadwaj, N.; Feng, Z.; Marquis, J.; Nesbitt, S.W.; Zhang, Z. Sensitivity of deep convective upscale growth to precipitation properties and ambient environmental conditions during the CACTI field campaign. AGUFM 2019, 2019, A53U-3042. [Google Scholar]
  89. Hardin, J.; Hunzinger, A.; Schuman, E.; Matthews, A.; Bharadwaj, N.; Varble, A.; Johnson, K.; Giangrande, S. CACTI Radar b1 Processing: Corrections, Calibrations, and Processing Report. 2020. Available online: https://arm.gov/publications/brochures/doe-sc-arm-tr-244.pdf (accessed on 29 July 2021).
  90. Marzuki, M.; Randeu, W.L.; Schönhuber, M.; Bringi, V.N.; Kozu, T.; Shimomai, T. Raindrop size distribution parameters of distrometer data with different bin sizes. IEEE Trans. Geosci. Remote Sens. 2010, 48, 3075–3080. [Google Scholar] [CrossRef]
  91. Löffler-Mang, M.; Joss, J. An optical disdrometer for measuring size and velocity of hydrometeors. J. Atmos. Ocean. Technol. 2000, 17, 130–139. [Google Scholar] [CrossRef]
  92. Bartholomew, M. Parsivel2 Handbook. 2014. Available online: https://www.arm.gov/publications/tech_reports/handbooks/ldis_handbook.pdf (accessed on 29 July 2021).
  93. Tokay, A.; Wolff, D.B.; Petersen, W.A. Evaluation of the new version of the laser-optical disdrometer, OTT Parsivel2. J. Atmos. Ocean. Technol. 2014, 31, 1276–1288. [Google Scholar] [CrossRef]
  94. Giangrande, S.E.; Wang, D.; Bartholomew, M.J.; Jensen, M.P.; Mechem, D.B.; Hardin, J.C.; Wood, R. Midlatitude oceanic cloud and precipitation properties as sampled by the ARM Eastern North Atlantic Observatory. J. Geophys. Res. Atmos. 2019, 124, 4741–4760. [Google Scholar] [CrossRef]
  95. Schumacher, C. Observations and Modeling of the Green Ocean Amazon 2014/15: Parsivel2 Field Campaign Report. 2016. Available online: https://www.arm.gov/publications/programdocs/doe-sc-arm-16-042.pdf (accessed on 29 July 2021).
  96. Schönhuber, M.; Günter, L.; Randeu, W. The 2D-Video-Disdrometer; Springer Science & Business Media: Heidelberg, Germany, 2008; pp. 4–22. [Google Scholar]
  97. Thurai, M.; Petersen, W.; Tokay, A.; Schultz, C.; Gatlin, P. Drop size distribution comparisons between Parsivel and 2-D video disdrometers. Adv. Geosci. 2011, 30, 3–9. [Google Scholar] [CrossRef] [Green Version]
  98. Bartholomew, M. Two-Dimensional Video Disdrometer (VDIS) Instrument Handbook. 2017. Available online: https://www.arm.gov/publications/tech_reports/handbooks/vdis_handbook.pdf (accessed on 29 July 2021).
  99. Hardin, J.; Giangrande, S.; Zhou, A. Laser Disdrometer Quantities (LDQUANTS) and Video Disdrometer Quantities (VDISQUANTS) Value-Added Products Report. 2020. Available online: https://www.arm.gov/capabilities/instruments/vdis (accessed on 29 July 2021).
  100. Lin, L.; Bao, X.; Zhang, S.; Zhao, B.; Xia, W. Correction to raindrop size distributions measured by PARSIVEL disdrometers in strong winds. Atmos. Res. 2021, 260, 105728. [Google Scholar] [CrossRef]
  101. Lhermitte, R.M. Centimeter & Millimeter Wavelength Radars in Meteorology. 2002. Available online: https://books.google.com.hk/books/about/Centimeter_Millimeter_Wavelength_Radars.html?id=UzpPAAAACAAJ&redir_esc=y (accessed on 29 July 2021).
  102. Hardin, J. PyDisdrometer Version v1.0. 2014. Available online: https://zenodo.org/record/9991#.YQJLeEARXIU (accessed on 29 July 2021).
  103. Caracciolo, C.; Porcu, F.; Prodi, F. Precipitation classification at mid-latitudes in terms of drop size distribution parameters. Adv. Geosci. 2008, 16, 11–17. [Google Scholar] [CrossRef] [Green Version]
  104. Gultepe, I.; Rabin, R.; Ware, R.; Pavolonis, M. Light snow precipitation and effects on weather and climate. In Advances in Geophysics; Elsevier: Amsterdam, The Netherlands, 2016; Volume 57, pp. 147–210. [Google Scholar]
  105. Williams, C.R. Documenting DSD Parameter Relationships. 2011. Available online: https://www.dsd.gov.hk/EN/Files/Technical_Manual/technical_manuals/Stormwater_Drainage_Manual_Eurocodes.pdf (accessed on 29 July 2021).
  106. Zhang, G. Comments on “Describing the shape of raindrop size distributions using uncorrelated raindrop mass spectrum parameters”. J. Appl. Meteorol. Climatol. 2015, 54, 1970–1976. [Google Scholar] [CrossRef]
  107. Tacchino, A.; Ingaramo, R.; Rodriguez, A.; Saffe, J.; Martina, A.; Petroli, G.; Capone, E.; Montamat, I.; Zigaran, G.; Furbato, C.; et al. Comparative Analysis of Hydrometeorological Events in the Province of Córdoba, Argentina, Monitored by Remote Sensors (Aws, Meteorological Radar and Satellite). Available online: https://program.eventact.com/Agenda/Lecture/194111?code=4154961 (accessed on 29 July 2021).
  108. Lindenmaier, I.; Bharadwaj, N.; Johnson, K.; Nelson, D.; Isom, B.; Hardin, J.; Matthews, A.; Wendler, T.; Castro, V. Ka ARM Zenith Radar (KAZRCFRMD). Atmospheric Radiation Measurement (ARM) User Facility. Available online: https://www.arm.gov/publications/tech_reports/doe-sc-arm-tr-203.pdf (accessed on 29 July 2021).
  109. Rémillard, J.; Kollias, P.; Luke, E.; Wood, R. Marine boundary layer cloud observations in the Azores. J. Clim. 2012, 25, 7381–7398. [Google Scholar] [CrossRef] [Green Version]
  110. Bartholomew, M. Rain Gauges Handbook; Technical Report; DOE ARM Climate Research Facility: Washington, DC, USA, 2016. [Google Scholar]
  111. Bartholomew, M.J. Weighing Bucket Rain Gauge Instrument Handbook; Technical Report; ARM Data Center, Oak Ridge National Laboratory (ORNL): Oak Ridge, TN, USA, 2019. [Google Scholar]
  112. Liu, X.; Gao, T.; Liu, L. A comparison of rainfall measurements from multiple instruments. Atmos. Meas. Tech. 2013, 6, 1585–1595. [Google Scholar] [CrossRef] [Green Version]
  113. Wang, D.; Bartholomew, M. Rain Gauge (RAINTB). Available online: https://www.arm.gov/capabilities/instruments/rain (accessed on 29 July 2021).
  114. Dolan, B.; Rutledge, S.A.; Fuchs, B.R. GPM Ground Validation DSD Variability as Revealed from Empirical Orthogonal Function Analysis. Available online: https://ui.adsabs.harvard.edu/abs/2016AGUFM.H13R..08D/abstract (accessed on 29 July 2021).
  115. Bringi, V.; Thurai, M.; Nakagawa, K.; Huang, G.; Kobayashi, T.; Adachi, A.; Hanado, H.; Sekizawa, S. Rainfall estimation from C-band polarimetric radar in Okinawa, Japan: Comparisons with 2D-video disdrometer and 400 MHz wind profiler. J. Meteorol. Soc. Jpn. Ser. II 2006, 84, 705–724. [Google Scholar] [CrossRef] [Green Version]
  116. Tokay, A.; Short, D.A. Evidence from tropical raindrop spectra of the origin of rain from stratiform versus convective clouds. J. Appl. Meteorol. 1996, 35, 355–371. [Google Scholar] [CrossRef] [Green Version]
  117. Yuter, S.E.; Houze, R.A., Jr. Measurements of raindrop size distributions over the Pacific warm pool and implications for Z–R relations. J. Appl. Meteorol. 1997, 36, 847–867. [Google Scholar] [CrossRef] [Green Version]
  118. Williams, E.; Rosenfeld, D.; Madden, N.; Gerlach, J.; Gears, N.; Atkinson, L.; Dunnemann, N.; Frostrom, G.; Antonio, M.; Biazon, B.; et al. Contrasting convective regimes over the Amazon: Implications for cloud electrification. J. Geophys. Res. Atmos. 2002, 107, LBA 50-1–LBA 50-19. [Google Scholar] [CrossRef] [Green Version]
  119. Nesbitt, S.W.; Zipser, E.J. The Diurnal Cycle of Rainfall and Convective Intensity according to Three Years of TRMM Measurements. J. Clim. 2003, 16, 1456–1475. [Google Scholar] [CrossRef] [Green Version]
  120. Rasmussen, K.L.; Choi, S.L.; Zuluaga, M.D.; Houze, R.A. TRMM precipitation bias in extreme storms in South America. Geophys. Res. Lett. 2013, 40, 3457–3461. [Google Scholar] [CrossRef]
  121. Gultepe, I.; Agelin-Chaab, M.; Komar, J.; Elfstrom, G.; Boudala, F.; Zhou, B. A meteorological supersite for aviation and cold weather applications. Pure Appl. Geophys. 2019, 176, 1977–2015. [Google Scholar] [CrossRef]
  122. Newsom, R.; Krishnamurthy, R. Doppler Lidar (DLPPI). Atmospheric Radiation Measurement (ARM) User Facility. Available online: https://www.osti.gov/biblio/1025186 (accessed on 29 July 2021).
  123. Keeler, E.; Kyrouac, J. Balloon-Borne Sounding System (SONDEWNPN). Atmospheric Radiation Measurement (ARM) User Facility. Available online: https://www.osti.gov/dataexplorer/biblio/dataset/1021460 (accessed on 29 July 2021).
  124. Collis, S.; Giangrande, S. Corrected Moments in Antenna Coordinates, Version 2 (CSAPR2CMACPPI). Atmospheric Radiation Measurement (ARM) User Facility. Available online: https://www.osti.gov/dataexplorer/biblio/dataset/1668872 (accessed on 29 July 2021).
  125. Lindenmaier, I.; Bharadwaj, N.; Johnson, K.; Nelson, D.; Isom, B.; Hardin, J.; Matthews, A.; Wendler, T.; Castro, V. Ka-Band Scanning ARM Cloud Radar (KASACRCFRPPIV). Atmospheric Radiation Measurement (ARM) User Facility. Available online: https://www.osti.gov/dataexplorer/biblio/dataset/1482699 (accessed on 29 July 2021).
  126. Lhermitte, R.M. Observation of rain at vertical incidence with a 94 GHz Doppler radar: An insight on Mie scattering. Geophys. Res. Lett. 1988, 15, 1125–1128. [Google Scholar] [CrossRef]
Figure 1. Map of the Americas and the three sites examined in this study: SGP, MAN, and COR. SGP is the Southern Great Plains grassland site in central Oklahoma within the Mississippi River Basin (red), US (2017–2019). MAN is the rainforest site from the GoAmazon experiment in Manacapuru, which is part of the Amazon River Basin (green), Brazil (2014–2015). Finally, COR is the CACTI experiment’s complex terrain site in Villa Yacanto at the La Plata River Basin (cyan), Argentina (2018–2019). Frequently organized convection contributes to most rainfall in the Americas’ largest river basins, where the La Plata and Amazon regions have a predominant lack of routine DSD observations and their integrated variables.
Atmosphere 12 00979 g001
Figure 2. Map of subtropical South America displaying an overview of the Córdoba study area, a region near the east of the Sierras de Córdoba (SDC) and the Andes in Argentina. The CACTI experiment collected observations at the US Department of Energy (DOE) Atmospheric Radiation Measurement (ARM) site in Villa Yacanto (black star). This C3S Land Cover map is available through the C3S Climate Data Store (CDS) and can be accessed at https://cds.climate.copernicus.eu/ (accessed on 29 July 2021).
Atmosphere 12 00979 g002
Figure 3. Rain rate (R) according to 10 l o g 10 R pdfs at (a) the COR, SGP, and MAN sites without segregation. In addition, the 10 l o g 10 R pdfs for the DSDs were classified into the light precipitation mode ( L p m : R < 0.5 mm h 1 ; dashed lines) and the precipitation mode ( P m : R > 0.5 mm h 1 ; solid lines) at (b) COR (violet/blue lines), (c) SGP (magenta/orange lines), and (d) MAN (green lines). Units: 10 l o g 10 (mm h 1 ) = [ d B R ]|R = [mm h 1 ].
Atmosphere 12 00979 g003
Figure 4. Mass-weighted mean diameter ( D m ) pdfs at (a) the COR, SGP, and MAN sites without classification. In addition, the D m pdfs for the DSDs were classified into the light precipitation mode ( L p m : R < 0.5 mm h 1 ; dashed lines) and the precipitation mode ( P m : R > 0.5 mm h 1 ; solid lines) at (b) COR (violet/blue lines); (c) SGP (magenta/orange lines), and (d) MAN (green lines). Units: D m = [mm].
Atmosphere 12 00979 g004
Figure 5. Normalized droplet concentration N w with the l o g 10 N w pdfs at (a) COR, SGP, and MAN without classification. In addition, the l o g 10 N w pdfs for the DSDs were classified into the light precipitation mode ( L p m : R < 0.5 mm h 1 ; dashed lines) and the precipitation mode ( P m : R > 0.5 mm h 1 ; solid lines) at (b) COR (violet/blue lines), (c) SGP (magenta/orange lines), and (d) MAN (green lines). Units: l o g 10 ( m 3 mm 1 ) = [ B N w ] | N w = [ m 3 mm 1 ].
Atmosphere 12 00979 g005
Figure 6. Joint histograms for the normalized droplet concentration ( l o g 10 N w ) and median raindrop diameter ( D 0 ) in the light precipitation mode ( L p m : R < 0.5 mm h 1 ) at the (a) COR, (b) SGP, and (c) MAN sites. The colored contours indicate the PARS and the colored and dashed contours indicate the 2DVD. The convective–stratiform segregation lines are from B R 09 (green solid) and T H 15 (red dashed). Units: l o g 10 ( m 3 mm 1 ) = [ B N w ] | N w = [ m 3 mm 1 ] | D 0 = [mm].
Atmosphere 12 00979 g006
Figure 7. Joint histograms for the normalized droplet concentration ( l o g 10 N w ) versus mean raindrop diameter ( D 0 ) in the precipitation mode ( P m : R > 0.5 mm h 1 ) at the (a) COR, (b) SGP, and (c) MAN sites. The colored contours are for the PARS and the colored and dashed contours are for the 2DVD. The convective–stratiform segregation lines are from B R 09 (green solid) and T H 15 (red dashed).
Atmosphere 12 00979 g007
Figure 8. Joint histograms for the liquid water content as l o g 10 L W C versus the mean raindrop diameter as l o g 10 D 0 in the precipitation mode ( P m : R > 0.5 mm h 1 ) at the (a) COR, (b) SGP, and (c) MAN sites. The colored contours are for the PARS and the colored and dashed contours are for the 2DVD. The convective–stratiform segregation line is from T H 15 (gray dashed). Units: l o g 10 (g m 3 ) = [ B L W C ] | L W C =[g m 3 ] | l o g 10 (mm) = [B D 0 ] | D 0 = [mm].
Atmosphere 12 00979 g008
Figure 9. PARS observations at the COR site during CACTI, separated by the precipitation mode as a function of the day (vertical axis) and local time (UTC-3, horizontal axis). The values of the rain rate (R, in units of d B R ) in the P m are shaded (color bar on the right), while the occurrence of L p m is shaded in green.
Atmosphere 12 00979 g009
Figure 10. (a) The KAZR reflectivity time–height scans over the COR site during CACTI, collocated with (b) the DSD parameter calculations using the PARS data from 00 UTC 22 October to 00 UTC 23 October 2018.
Atmosphere 12 00979 g010
Figure 11. As in Figure 10, but for the period 00 UTC 23 Feb–00 UTC 24 February 2019.
Atmosphere 12 00979 g011
Table 1. Disdrometer information for the three sites is presented with the corresponding campaign, location, coordinates, type of source instrument, and observation period. In addition, an overview of the data segregated by rain mode ( L p m : R < 0.5 mm h 1 , and P m : R > 0.5 mm h 1 ) is presented with the respective numbers of rainy minutes, and the values of 10 l o g 10 R, D m , and l o g 10 N w corresponding to the highest frequencies of occurrence or peaks were determined subjectively.
SiteCampaignCity,
State/Prov,
Country
Latitude,
Longitude,
Altitude
Observation Period
[Day Month Year]
Source
[ PARS /
2 DVD ]
Rain
Mode
[ Lpm / Pm ]
No.
Rainy
[minutes]
10 log 10 R
[dBR]
D m
[mm]
log 10 N w
[ BN w ]
S G P S o u t h e r n G r e a t P l a i n s L a m o n t ,
O k l a h o m a ,
U n i t e d S t a t e s
36.666 °
−97.624 °
311.50 m
15 April–30 September 2017
15 April–30 September 2018
15 April–11 September 2019
P A R S L p m 8414−5.500.58
0.80
3.70
4.45
P m 12,0112.901.203.30
36.605 °
−97.485 °
318.0 m
15 April–30 September 2017
15 April–30 September 2018
15 April–11 September 2019
2 D V D L p m 16,409−5.520.52
0.91
3.40
4.55
P m 10,7613.001.403.20
M A N G o A m a z o n M a n a c a p u r u ,
A m a z o n i a ,
B r a z i l
−3.213 ° −60.698 ° 50.0 m15 October 2014–30 April 2015
15 October–01 December 2015
P A R S L p m 16,037−4.850.68
0.83
3.55
P m 98212.101.153.80
C O R C A C T I -
R E L A M P A G O
V i l l a Y a c a n t o ,
C o r d o b a ,
A r g e n t i n a
−32.126 °
−64.728 °
1141.0 m
15 October 2018–30 April 2019 P A R S L p m 20,517−5.590.454.15
4.80
P m 10,8331.250.634.0
5.0
−32.126 °
−64.728 °
1141.0 m
15 October 2018–30 April 2019 2 D V D L p m 14,295−5.390.40
0.64
4.0
5.20
P m 72311.250.55
0.80
4.30
5.40
Table 2. Number of minutes per day (UTC time) of L p m in the PARS data at the COR site.
DateNumber of Minutes (00-00 UTC)
22 October 2018795
23 February 2019461
25 April 2019437
11 March 2019430
23 October 2018386
25 October 2018350
18 December 2018338
24 October 2018276
19 December 2018258
25 February 2019247
Publisher’s Note: MDPI stays neutral with regard to jurisdictional claims in published maps and institutional affiliations.

