Abstract
Having an extreme topography and heterogeneous climate, the Upper Indus Basin (UIB) is more likely to be affected by climate change and it is a crucial area for climatological studies. Based on the monthly minimum temperature (Tmin), maximum temperature (Tmax) and precipitation from nine meteorological stations, the spatiotemporal variability of temperature and precipitation were analyzed on monthly, seasonal, and annual scales. Results show a widespread significant increasing trend of 0.14 °C/decade for Tmax, but a significant decreasing trend of −0.08 °C/decade for Tmin annually, during 1955–2016 for the UIB. Seasonally, warming in Tmax is stronger in winter and spring, while the cooling in Tmin is greater in summer and autumn. Results of seasonal Tmax indicate increasing trends in winter, spring and autumn at rates of 0.38, 0.35 and 0.05 °C/decade, respectively, while decreasing in summer with −0.14 °C/decade. Moreover, seasonal Tmin results indicate increasing trends in winter and spring at rates of 0.09 and 0.08 °C/decade, respectively, while decreasing significantly in summer and autumn at rates of −0.21 and −0.22 °C/decade respectively for the whole the UIB. Precipitation exhibits an increasing trend of 2.74 mm/decade annually, while, increasing in winter, summer and autumn at rates of 1.18, 2.06 and 0.62 mm/decade respectively. The warming in Tmax and an increase in precipitation have been more distinct since the mid-1990s, while the cooling in Tmin is observed in the UIB since the mid-1980s. Warming in the middle and higher altitude (1500–2800 m and >2800 m) are much stronger, and the increase is more obvious in regions with elevation >2800 m. The wavelet analysis illustrated sporadic inter-annual covariance of seasonal Tmax, Tmin and precipitation with ENSO, NAO, IOD and PDO in the UIB. The periodicities were usually constant over short timescales and discontinuous over longer timescales. This study offers a better understanding of the local climate characteristics and provides a scientific basis for government policymakers.
1. Introduction
Global climate change receives substantial attention from scholars and practitioners due to its effects in temperature and precipitation [1]. Precipitation is one of the most essential variables due to its critical significance in global climate systems and energy cycles [2]. Changes in precipitation have an impact on hydrological, ecological, and biogeochemical processes, either directly or indirectly [2,3]. Temperature change has a great impact on climate variability, and it is especially essential because of its role in the global climate system and energy cycles [4]. As a result of the increased moisture content in the atmosphere, global warming may have an impact on the global hydrological cycle [5]. Due to this, it is indispensable to quantify changes in temperature and precipitation to understand climate influence on various aspects of the environment.
The Upper Indus Basin (UIB) stretches through the watershed of Hindukush-Karakoram-Himalaya (HKH) and Tibetan plateau (TP), as this region holds the largest number of glaciers outside the polar region [6], also referred to as the “water tower of Asia” [7]. These glaciers feed a number of rivers and are a source of freshwater down streams. Three distinct weather systems influence the Karakoram mountains; the western winds, summer monsoon, and anti-cyclonic clear weather patterns. Glaciers in this region show features of both summer and winter accumulation forms [8,9,10]. Analyses indicated an increase in winter precipitation and falling mean and minimum summer temperatures since the early 1960s. The latter is possibly attributed to further summer storms, although no periodic rise in summer precipitation has been measured [9]. Compared to other glaciated regions worldwide, the glaciers in the Karakoram have average neutral mass balances and are characterized by a significant number of surging glaciers [11]. This glacier stability and development suggested by [9] in this region is called the Karakoram anomaly. Debris covers almost ~10% of the glaciers in the HKH region [12]. A thin debris layer of 0.5 cm does not accelerate melting compared to clear ice [13]. As the thickness of the debris layer rises, the melting rate drops. Similarly, there was no net mass loss in the glaciers of the Astore basin between 2000 and 2016 [14].
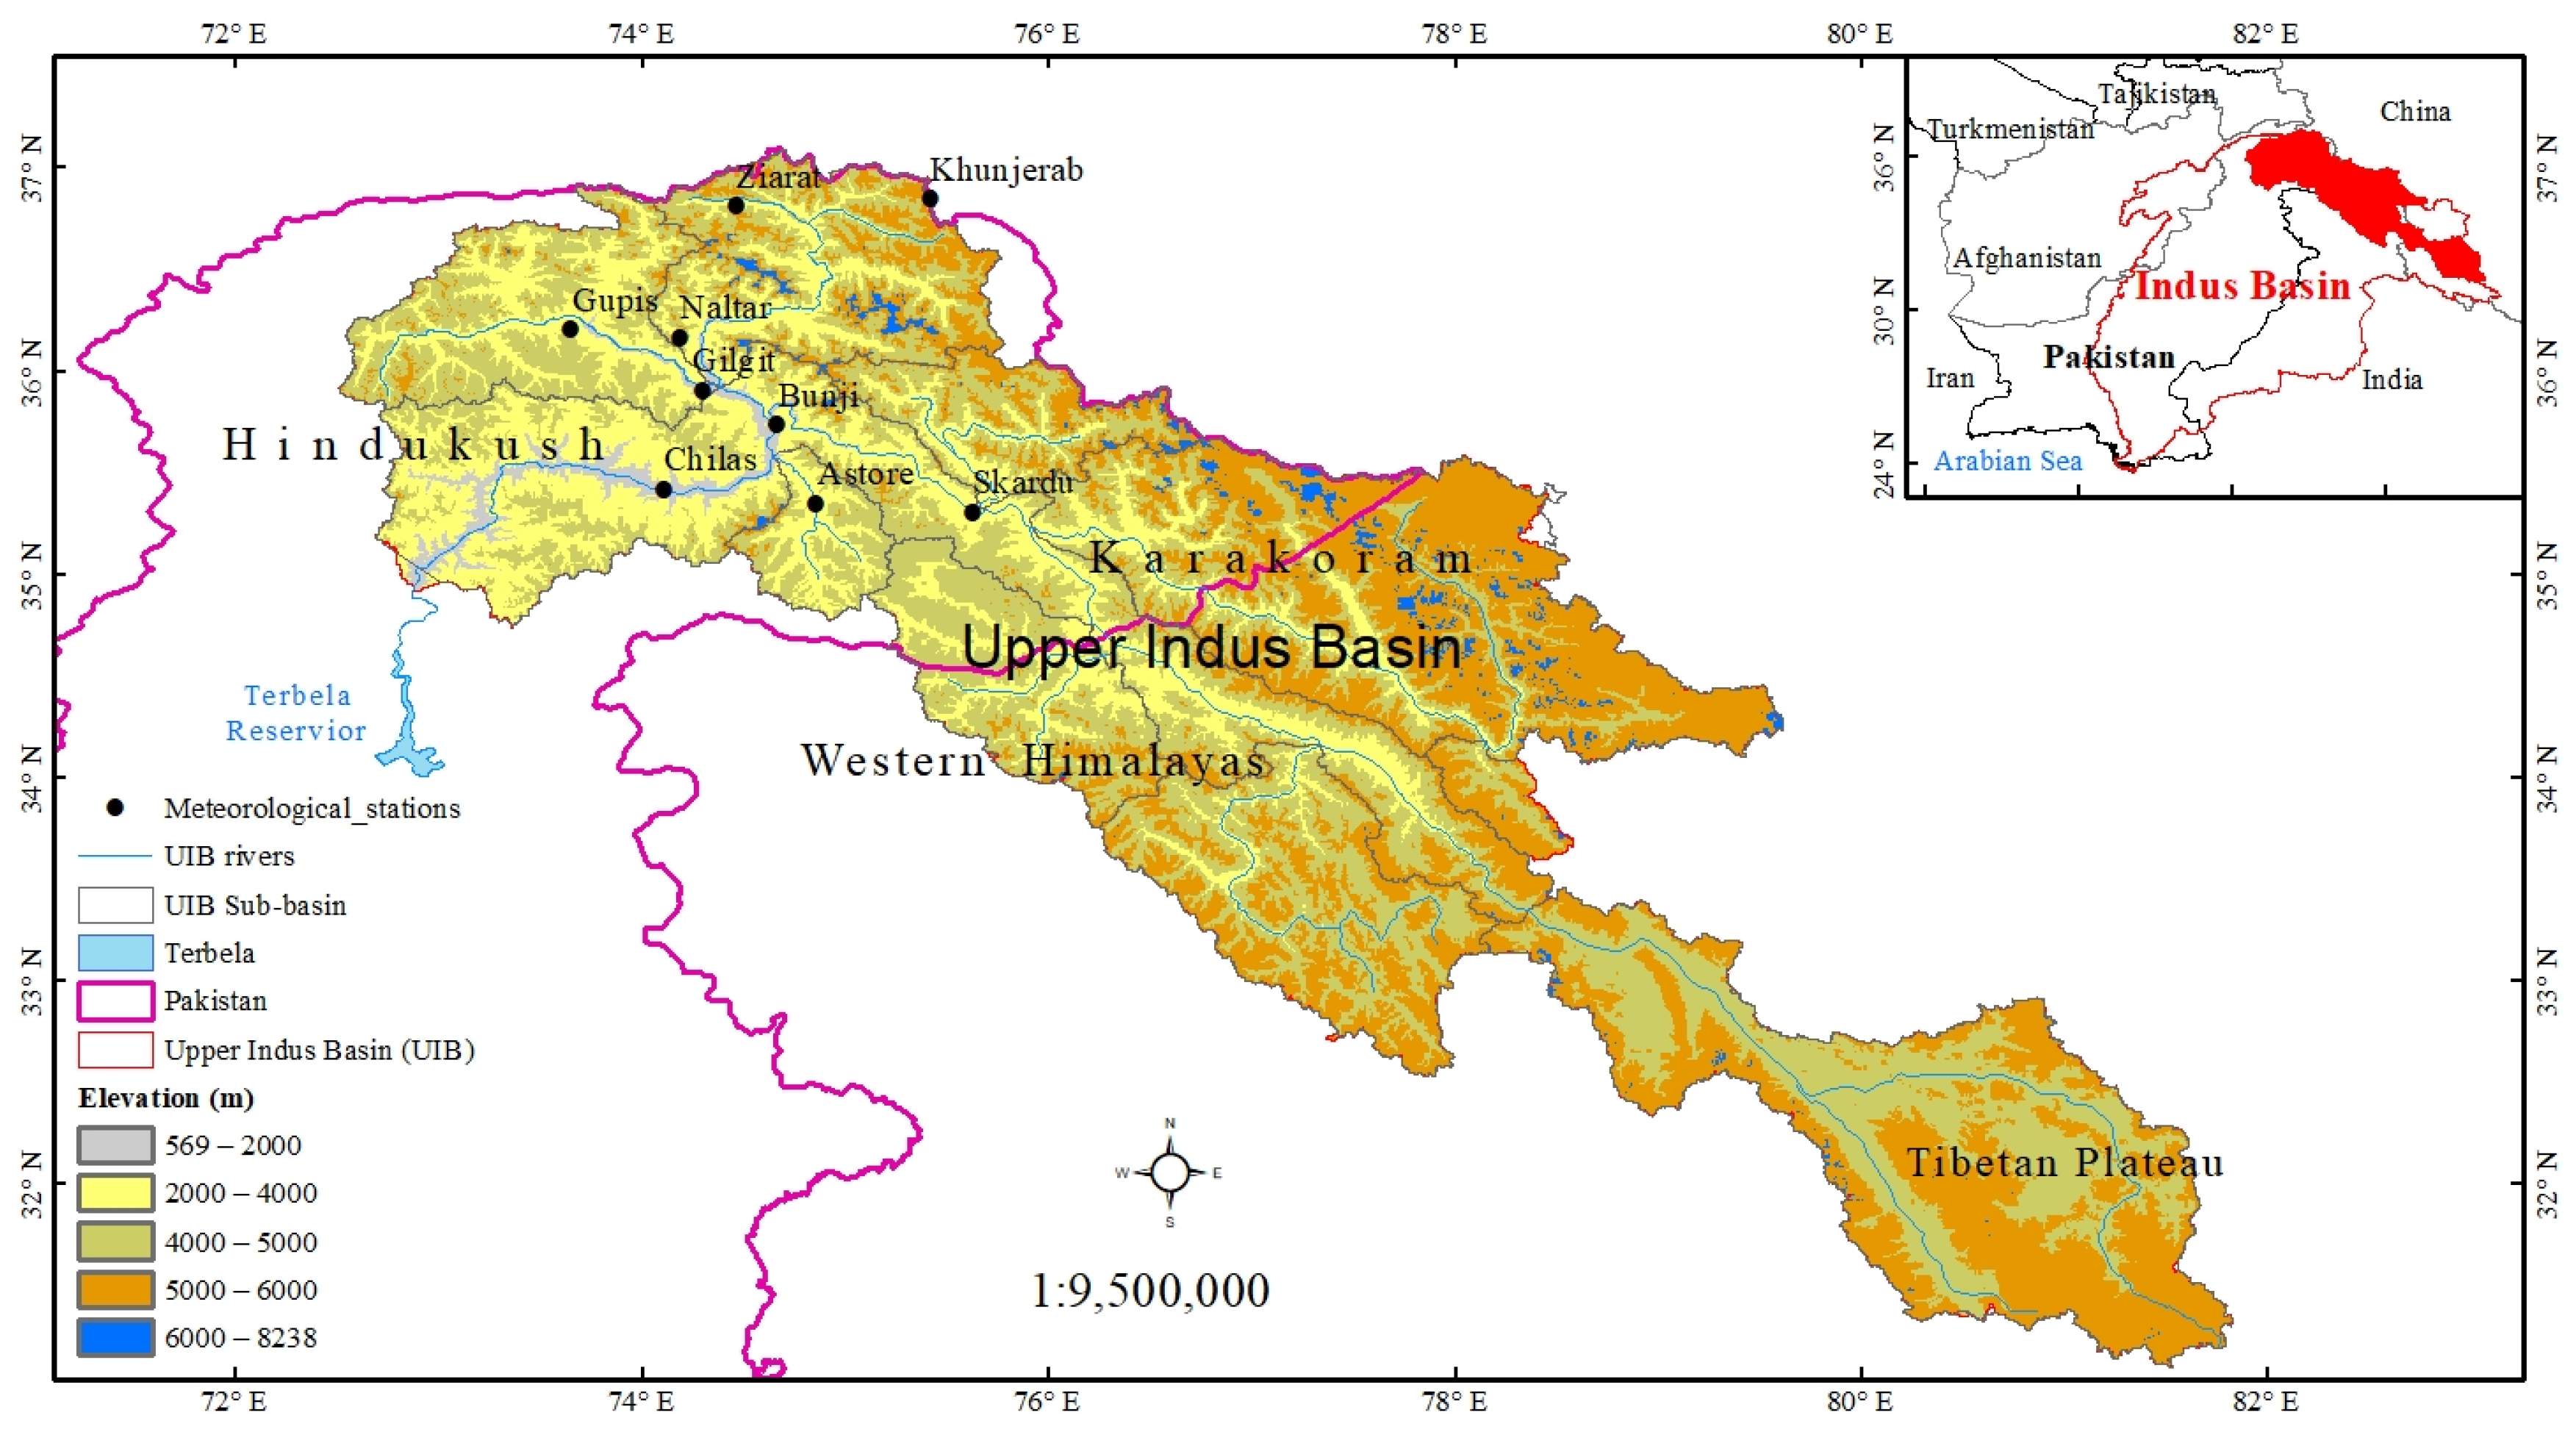
The Indus River basin originates from the Western TP in China, runs through India and enters into Pakistan in the north, and ends in the Arabian Sea [15,16,17]. Pakistan highly relies on this river being an agrarian country, and around 85% of wheat and rice receive water from the Indus River. It is the lifeline of Pakistan [18]. The water coming from the Indus River is stored at the Terbela Reservoir for energy and agriculture purposes in Pakistan. From its source at the Western TP to this reservoir, this area is known as the UIB [19] (Figure 1). Having an extreme topography and heterogeneous climate, natural resources and mountain livelihood in this region are entirely vulnerable to climate change effects. Temperature rises and heavy rains trigger extreme meteorological circumstances linked to glacial lake outburst floods, and the frequency of such events has increased in recent decades [20]. Research has been carried out in the UIB to identify climate trends over the time. Numerous researchers analyzed the historical trends of maximum temperature (Tmax), minimum temperature (Tmin) and precipitation in the UIB [17,21,22,23,24]. The authors of Ref. [21] observed increasing (and decreasing) Tmax (Tmin) in the UIB during 1961–2000. [22] Also witnessed an increase in the diurnal temperature range during 1986–2015 at a rate of 0.34 °C/decade. The author of Ref. [23] observed an increase in winter temperature at a rate of 1.79 °C per 39 years. Gilgit and Hunza sub-basin indicated trends consistent with warming, which are under the influence of the monsoon and westerlies circulation system. Astore basin is under the influence of the monsoon circulation [16], where decreases in annual and summer mean temperature were observed [25]. This shows that the temperature variations showed largely regional and seasonal differences in UIB.
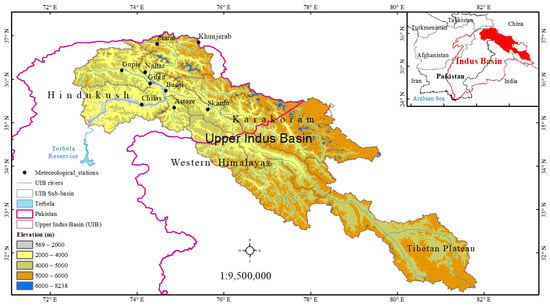
Figure 1.
Location of meteorological stations in the Upper Indus Basin (UIB).
Precipitation variations at different time periods are previously highlighted in the UIB [23,26,27]. The authors of Ref. [26] detected significant increasing trends in winter, summer and annual precipitation during 1961–1999 while contrasting results were detected by [24] during 1980–2006. Furthermore, Ref. [17] observed a precipitation increase in western UIB during 1995–2012. Moreover, Ref. [28] observed a more robust decreasing precipitation at higher elevations. These contrasting responses of precipitation observed by different researchers observed using different time-period data, need to be assessed using the available historical records in the UIB.
On the other hand, The North Atlantic Oscillation (NAO) and El Niño Southern Oscillation (ENSO), Indian Ocean Dipole (IOD) and Pacific Decadal Oscillations (PDO) have broad implications in the regional climate of the UIB. These four climate indices need a better understanding of local Tmax, Tmin and precipitation in this region. Here, NAO is an indicator of oscillations from the Atlantic Ocean (mid-latitude westerlies). At the same time, ENSO and PDO are the influence index from the Pacific Oscillations and IOD as an index from the Indian Ocean, respectively. The 2010 floods in Pakistan were associated to a strong La Niña [29]. The authors of Ref. [29] identified the positive and negative correlation of NAO with winter and summer precipitation, respectively, in the UIB [26]. The authors of Ref. [30] explained the winter precipitation and ENSO connections where they found the stable disparity is between higher winter precipitation in El Niño years and condensed early winter precipitation in La Niña years. Furthermore, Ref. [31] explained the effects of NAO on winter precipitation and Southern Oscillation Index (SOI) on the monsoon in the adjoining Himalayas. He further explained the correlation between temperature and precipitation until the 1960s which weakened due to quasi-biennial oscillations, ENSO and sunspot cycles, in this period.
According to the aforementioned studies, many researchers studied the trends and variability in temperature and precipitation. Yet, there are different contrasting results at different timescales. The identified gaps in previous studies are as follows: First, most of the previous studies focused on the trends either the inter-annual or the seasonal variations. Second, most of the studies were only limited to trends. In this study, the available climate data are employed to assess the trends and magnitudes in monthly, seasonal, and annual scales. The motivation and main reason this study is novel from previously published research are: First, the time series anomalies were assessed for temperature and precipitation in the UIB. Second, start of trend, abrupt change, and significant trends were assessed for annual and seasonal variation in the whole UIB. Third, accessing the homogeneity and single change-point detection for all stations on annual and seasonal scale. Fourth, the wavelet analysis is used to comprehensively assess the significant periodicity modes and their connections with global climate indices, i.e., ENSO, NAO, IOD and PDO’s influence in the regional temperature and precipitation of the UIB. We intend to offer and assess the detailed information on temperature and precipitation variability and change point analysis in both time and space in the UIB during 1955–2016, and its association with atmospheric circulation. Such information can help the government policymakers better understand the local and global climate variation characteristics and provide a theoretical basis for effectively adapting and mitigating climate change in the UIB.
2. Study Area
The UIB spans from latitude 31 to 37° N and longitude 72 to 82° E in the HKH, with the Hindukush region in the west and the TP in the east, the Himalayan and Karakoram ranges are in the south and north respectively (Figure 1). The UIB is home to the most extensive perennial ice (22,000 km2) outside the polar region [30]. The elevation range within the UIB is extreme, spreading from the second highest point in the world, 8611 m at the K-2 Peak, to just over 569 m in the valleys [32]. Topographic altitude typically greatly affects climatic variables. The northern valley floors of the UIB are thus arid, with an annual precipitation of just 100–200 mm, which rises to 600 mm at an altitude of 4400 m, and glaciological studies indicate annual accumulation peaks of 1500 to 2000 mm at 5500 m for higher altitudes [32,33]. With its minimum in the summer snow melt season (June–September) and its high in the winter snow accumulation period (December–February), the average annual snow cover area in the UIB varies from 10% to 70% [34]. The extreme climate events, e.g., flash floods, GLOFs and droughts, are becoming more common in this region from the last decade making the survival of mountain livelihood very difficult and endangered [35].
3. Data and Methodology
3.1. Data
Monthly Tmax, Tmin and precipitation data of 9 meteorological stations were collected from Pakistan Meteorological Department (PMD) and Water and Power Development Authority (WAPDA) (Table 1). The spatial distribution of meteorological stations is displayed in Figure 1. Out of the nine stations, three locates were in high-altitude (>2800 m), these stations were installed by WAPDA in 1995, and the data are available from the period 1995–2012. These stations installed by WAPDA are automated weather stations, known as data collection platform (DCPs), that measure snow in millimeters of the water equivalent [36]. The remaining six stations were in the elevation of 1250–2210 m and the time period in these stations was from 1955 to 2016. Climate data before 1955 was missing values in the six stations; therefore, we used the data from 1955 onwards which had no missing values. The authors of Ref. [37] and Ref. [17] also used data from 1960 onwards due to these inconsistencies. However, there were no missing values in the data of three high-altitude climate stations from 1995 to 2012 [17]. The seasons were classified as follows: winter (December, January, February); spring (March, April, May); summer (June, July, August) and autumn (September, October, November). The regional mean Tmax, Tmin and precipitation of annual and seasonal time series were calculated by taking the average values of all stations. For regional means, only six stations with data from 1960 to 2016 were considered, because the remaining three stations with data from 1995 to 2012 were affecting the time series.

Table 1.
Description of meteorological stations in the Upper Indus Basin used in analysis, (Lat.: latitude; Lon.: longitude; Elev.: elevation).
3.2. Autocorrelation Test
Autocorrelation method is a very valuable tool in the study of a climatological time series [38]. Prior to running a pattern evaluation, the time series of Tmax, Tmin and precipitation data must be checked for autocorrelation [39]. The findings may be greatly changed by the use of nonparametric tests to identify patterns. Both Tmax, Tmin and precipitation time series data were then first checked for the presence of an autocorrelation coefficient [40]. The autocorrelation coefficient value was evaluated at a 95% confidence interval against the null hypothesis, using a two-tailed test. Tmax, Tmin and precipitation time series data were then first checked for the presence of an autocorrelation coefficient (r1) at a 5% significance level using a two-tailed test [40].
If r1 falls between the upper and lower confidence level limits (lag-1 ≥ 0.254 or lag-1 ≤ −0.254), the Mann-Kendall test can be applied directly prior to any pre-processing for removal of autocorrelation. However, if there is any autocorrelation persist in the time series, it can be removed using (X2 − r1X1, X3 − r2X2 …. Xn − rnXn) [27]. The significant autocorrelations were removed using the pre-whitening method [27].
3.3. Mann-Kendall (MK) Test and Sen’s Slope Estimator
The non-parametric MK test [41,42] is used to detect meteorological variables statistically significant trends. It requires independent data, whereas this technique is robust against outliers and missing values [27]. This test was used earlier to detect trends in climate related studies [2,4,15,43,44]. This test’s null hypothesis suggests no trend in the time series, while the alternate hypothesis indicates an increasing or decreasing trend. We used 95% (±1.96) significance level for statistically significant results. In contrast, the negative values indicate a decreasing trend in the time series [45]. Sen’s slope estimator [46] is used to find the magnitude of slope in the meteorological variables [43,44,47].
3.4. Sequential Mann-Kendall (SQMK) Test
The SQMK test developed by [48] is used to define the start of a trend, abrupt change, and significant trend time in a time series [49]. The forward (UFK) series and backward (UBK) lines estimate the significant trend and abrupt change. UFK in this study is a standardized variable with a standard deviation of zero mean and function. Hence, its sequential activity fluctuates around the point of zero. UFK is similar to the Z values that start from the first to the last data point. Likewise, UBK’s value is computed backward, starting from the endpoint to the first time-series point. This test considers the relative value of all terms in the time series (x1, x2, …, xn). UFK and UBK’s declining values specify a negative trend, whereas the increasing values characterize a positive trend in the time series. The point where both UFK and UBK intersect each other is a possible significant change in that year in the time series. The threshold values in this study are ±1.96 (p = 0.05) significance level [50].
3.5. Pettitt’s Test
The Pettitt’s test [51] is widely used to detect a single change point in continuous hydro-climatological time-series data. This test is most commonly used to detect a significant shift in a climatic time series [3]. In this test, the null hypothesis denotes homogenous data, whereas the alternate hypothesis denotes the occurrence of failure in the time series under consideration [52]. This change point is deemed statistically significant if the computed p value is less than 0.05.
3.6. Continuous Wavelet (CWT) and Cross Wavelet Transform (XWT)
Wavelet analysis provides excellent knowledge about different frequency intervals; thus, it is an appropriate tool to study the low-frequency events and the nature of a time series [53,54]. It is a suitable tool for assessing the local variations in power in a time series [55]. The CWT [55] emphasizes the one-dimensional variable (e.g., precipitation). Therefore, we used it in this study to assess the climatic time series in the time-frequency domain [56]. Meteorological studies typically apply the Morlet function as a mother wavelet because it provides a good compromise between the time and frequency resolution [56,57]. The Cross wavelet transform (XWT) is another method to assess geophysical time series data on different levels. It can effectively evaluate the correlation between two signals and display the phase structure and particulars of the signal in the time domain and frequency [58]. More details about the theoretical background of XWT power spectra are explained by [55,56].
4. Results
4.1. Autocorrelation Exclusion
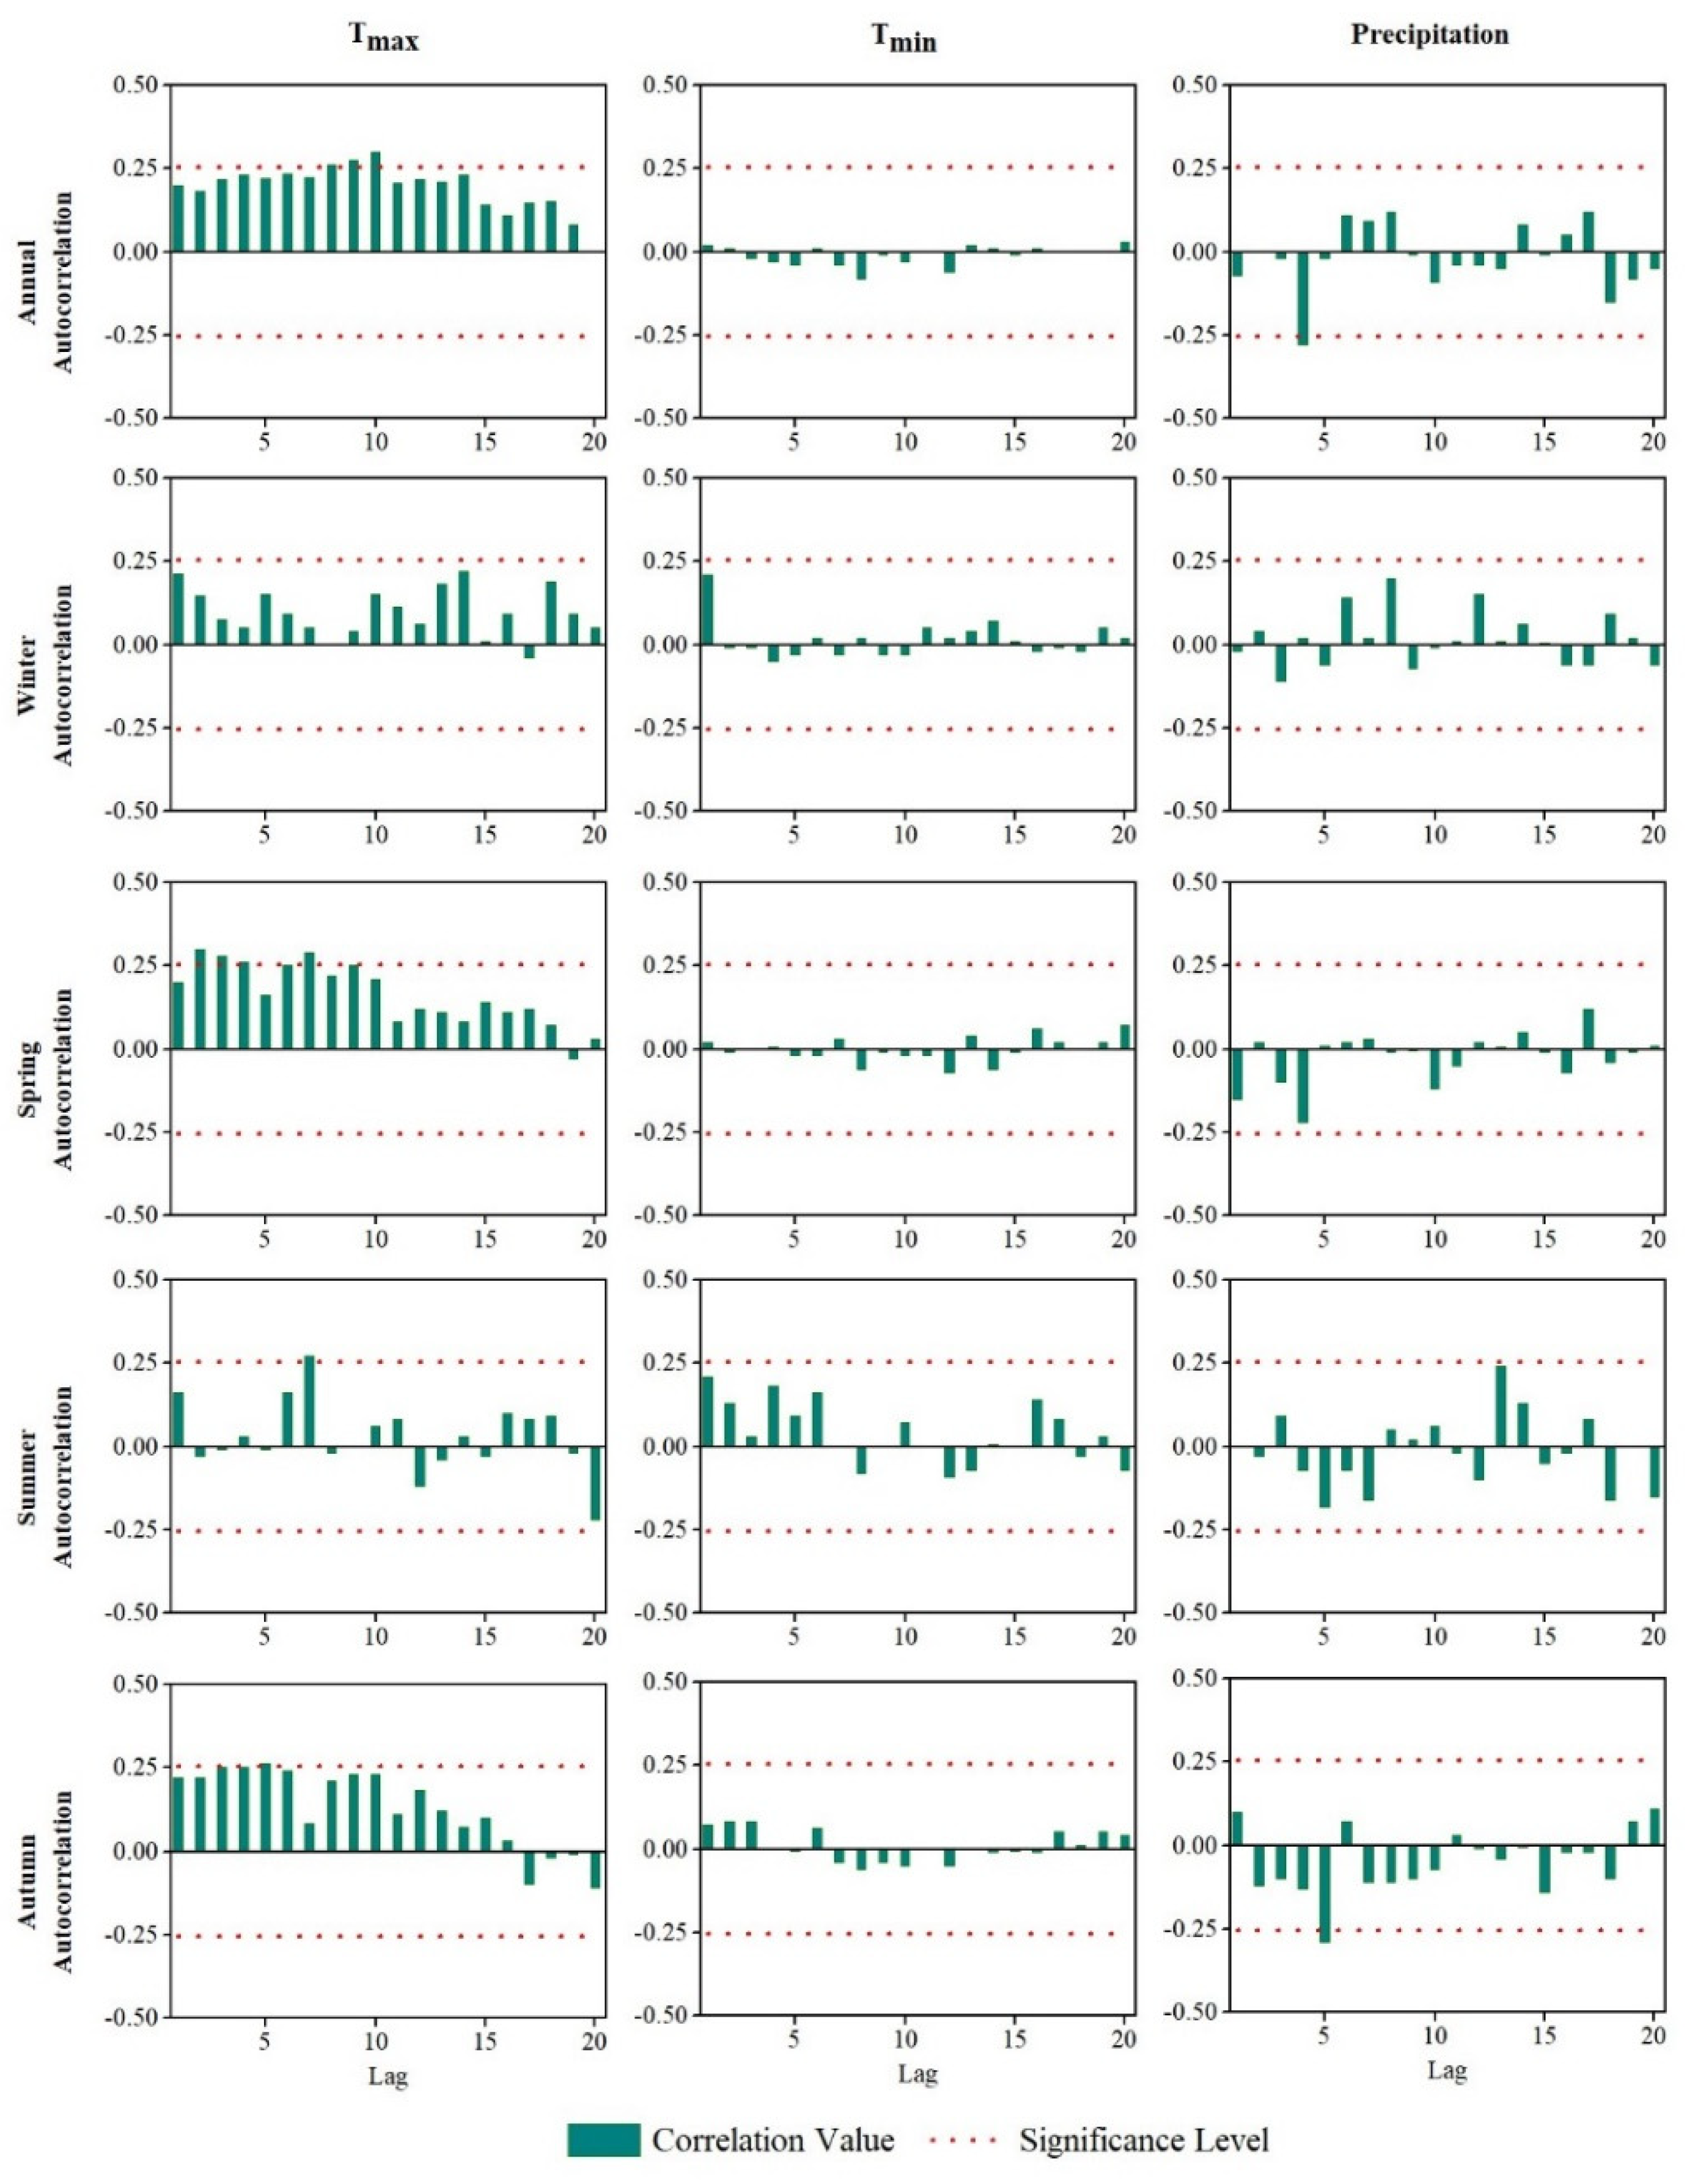
Autocorrelation was applied before using the MK test to ensure any significant serial correlation in temperature and precipitation; results of annual and seasonal autocorrelation at different time lags are presented in Figure 2. The results obtained from autocorrelation for temperature and precipitation showed no significant autocorrelation at the first lag, however, a few significant correlations persist at the later lags. Therefore, to advert the possible effects of autocorrelation on an MK test, all the significant autocorrelations were removed.
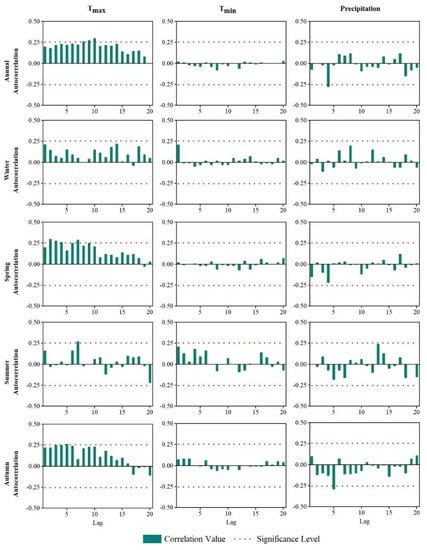
Figure 2.
Autocorrelation of annual and seasonal time series for Tmax, Tmin and precipitation.
4.2. Basic Information of Tmax, Tmin and Precipitation
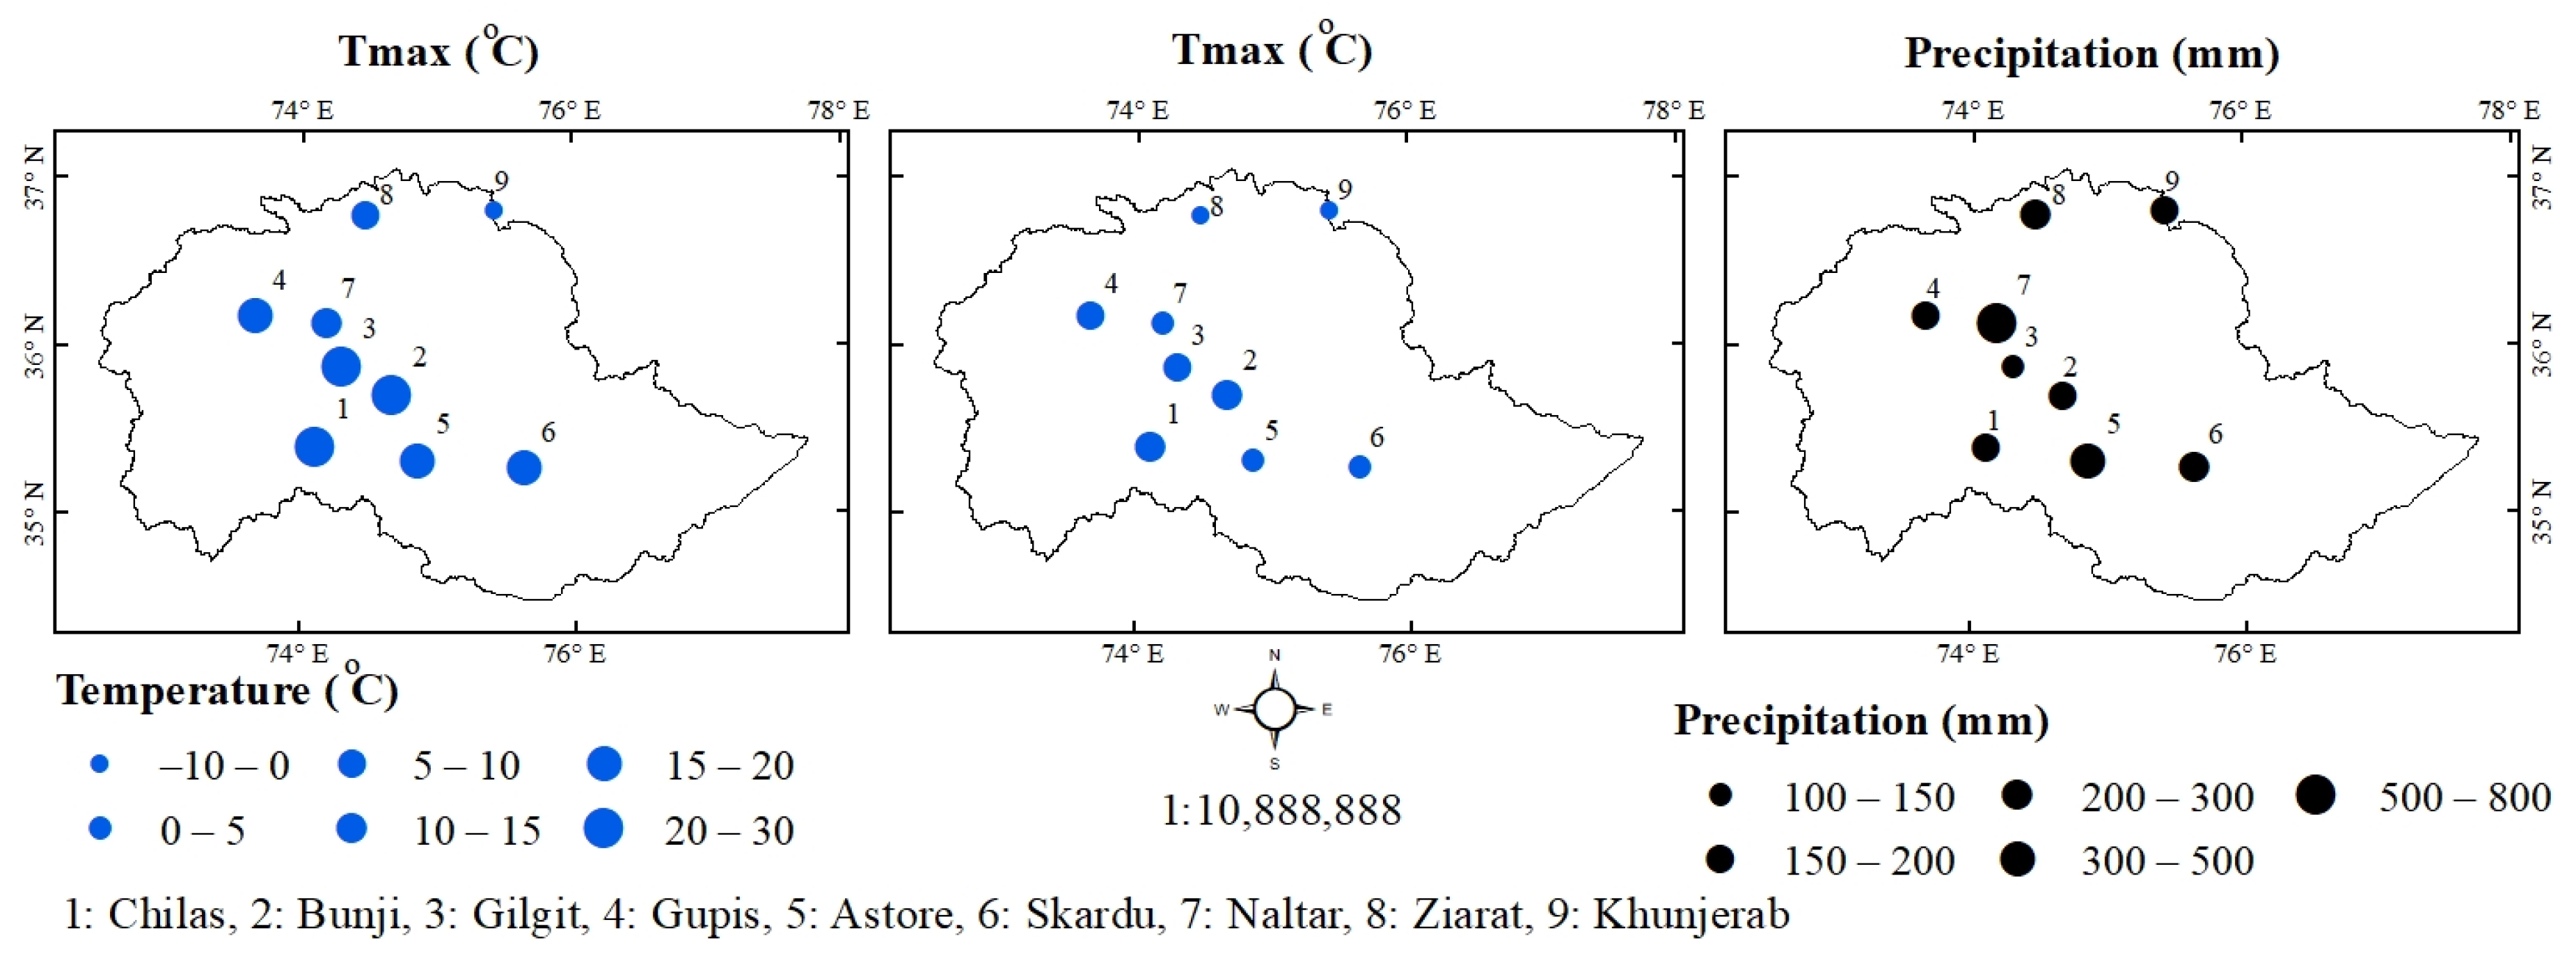
Mean annual Tmax, Tmin and precipitation in the UIB is displayed in Figure 3. Tmax in region of elevation below 1500 m varies between 20 and 30 °C, while Gupis, Astore and Skardu in the Hindukush and Himalayan region reaches 15–20 °C. However, stations with a high-altitude >2800 m in Karakoram region show big regional differences, with Tmax in Khunjerab below 0 °C, while Naltar reach up to 10–15 °C. The changing pattern of Tmin is obvious owing to the altitude effects. Tmin in stations of elevations above 2800 m is below 0 °C except Naltar. However, it is 10–15 °C in the stations with low elevations. All the stations with elevation more than 1500 m in the Karakoram and Himalayan region receive precipitation in the form of snow during late autumn, winter and sometimes in the advent of spring as well. Naltar receives a higher precipitation of 800 mm due to both snow and rainfall. However, the valley-based stations with elevation below 1500 m, etc. Gilgit, Bunji and Chilas receive precipitation less than 200 mm.
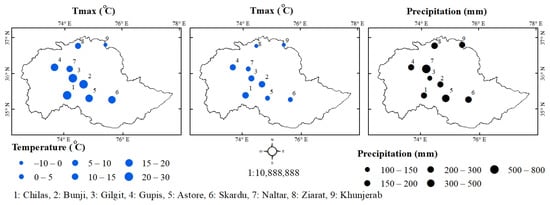
Figure 3.
Spatial distribution of mean Tmax, Tmin and precipitation.
4.3. Spatial Distribution of the Trends in Tmax and Tmin
4.3.1. Trends in Monthly Tmax and Tmin
Results of Sen’s slope and the Mann-Kendall analysis of monthly Tmax and Tmin are presented in Table 2 and Table 3, respectively. Tmax is cooling on a regional scale in July–September, with a significant trend of −0.36 °C/decade for the whole UIB in August (Table 2). However, the remaining months mostly have significant warming trends. Tmax variations also show largely spatiotemporal disparities. The greater significant warming trends usually occur in January and February with a trend of 0.44 and 0.35 °C/decade for Skardu and Gilgit, respectively. While the larger cooling magnitudes are detected in September with significant decreases of −1.63 and −1.70 °C/decade for Naltar and Ziarat, respectively. Compared to Tmax, the discrepancy patterns of Tmin in the UIB demonstrate better consistency spatially. The prominent trend for most stations is increasing from January to May, while a downward trend is evident in most stations during the remaining months (Table 3). Geographically, stations in higher elevations generally exhibit larger magnitudes, indicating more rapid warming in this region.

Table 2.
Sen’s estimator for monthly Tmax (°C/decade). Bold indicates significant trend at 5% level.

Table 3.
Sen’s estimator for monthly Tmin (°C/decade). Bold indicates significant trend at 5% level.
4.3.2. Trends in Annual, Seasonal Tmax and Tmin
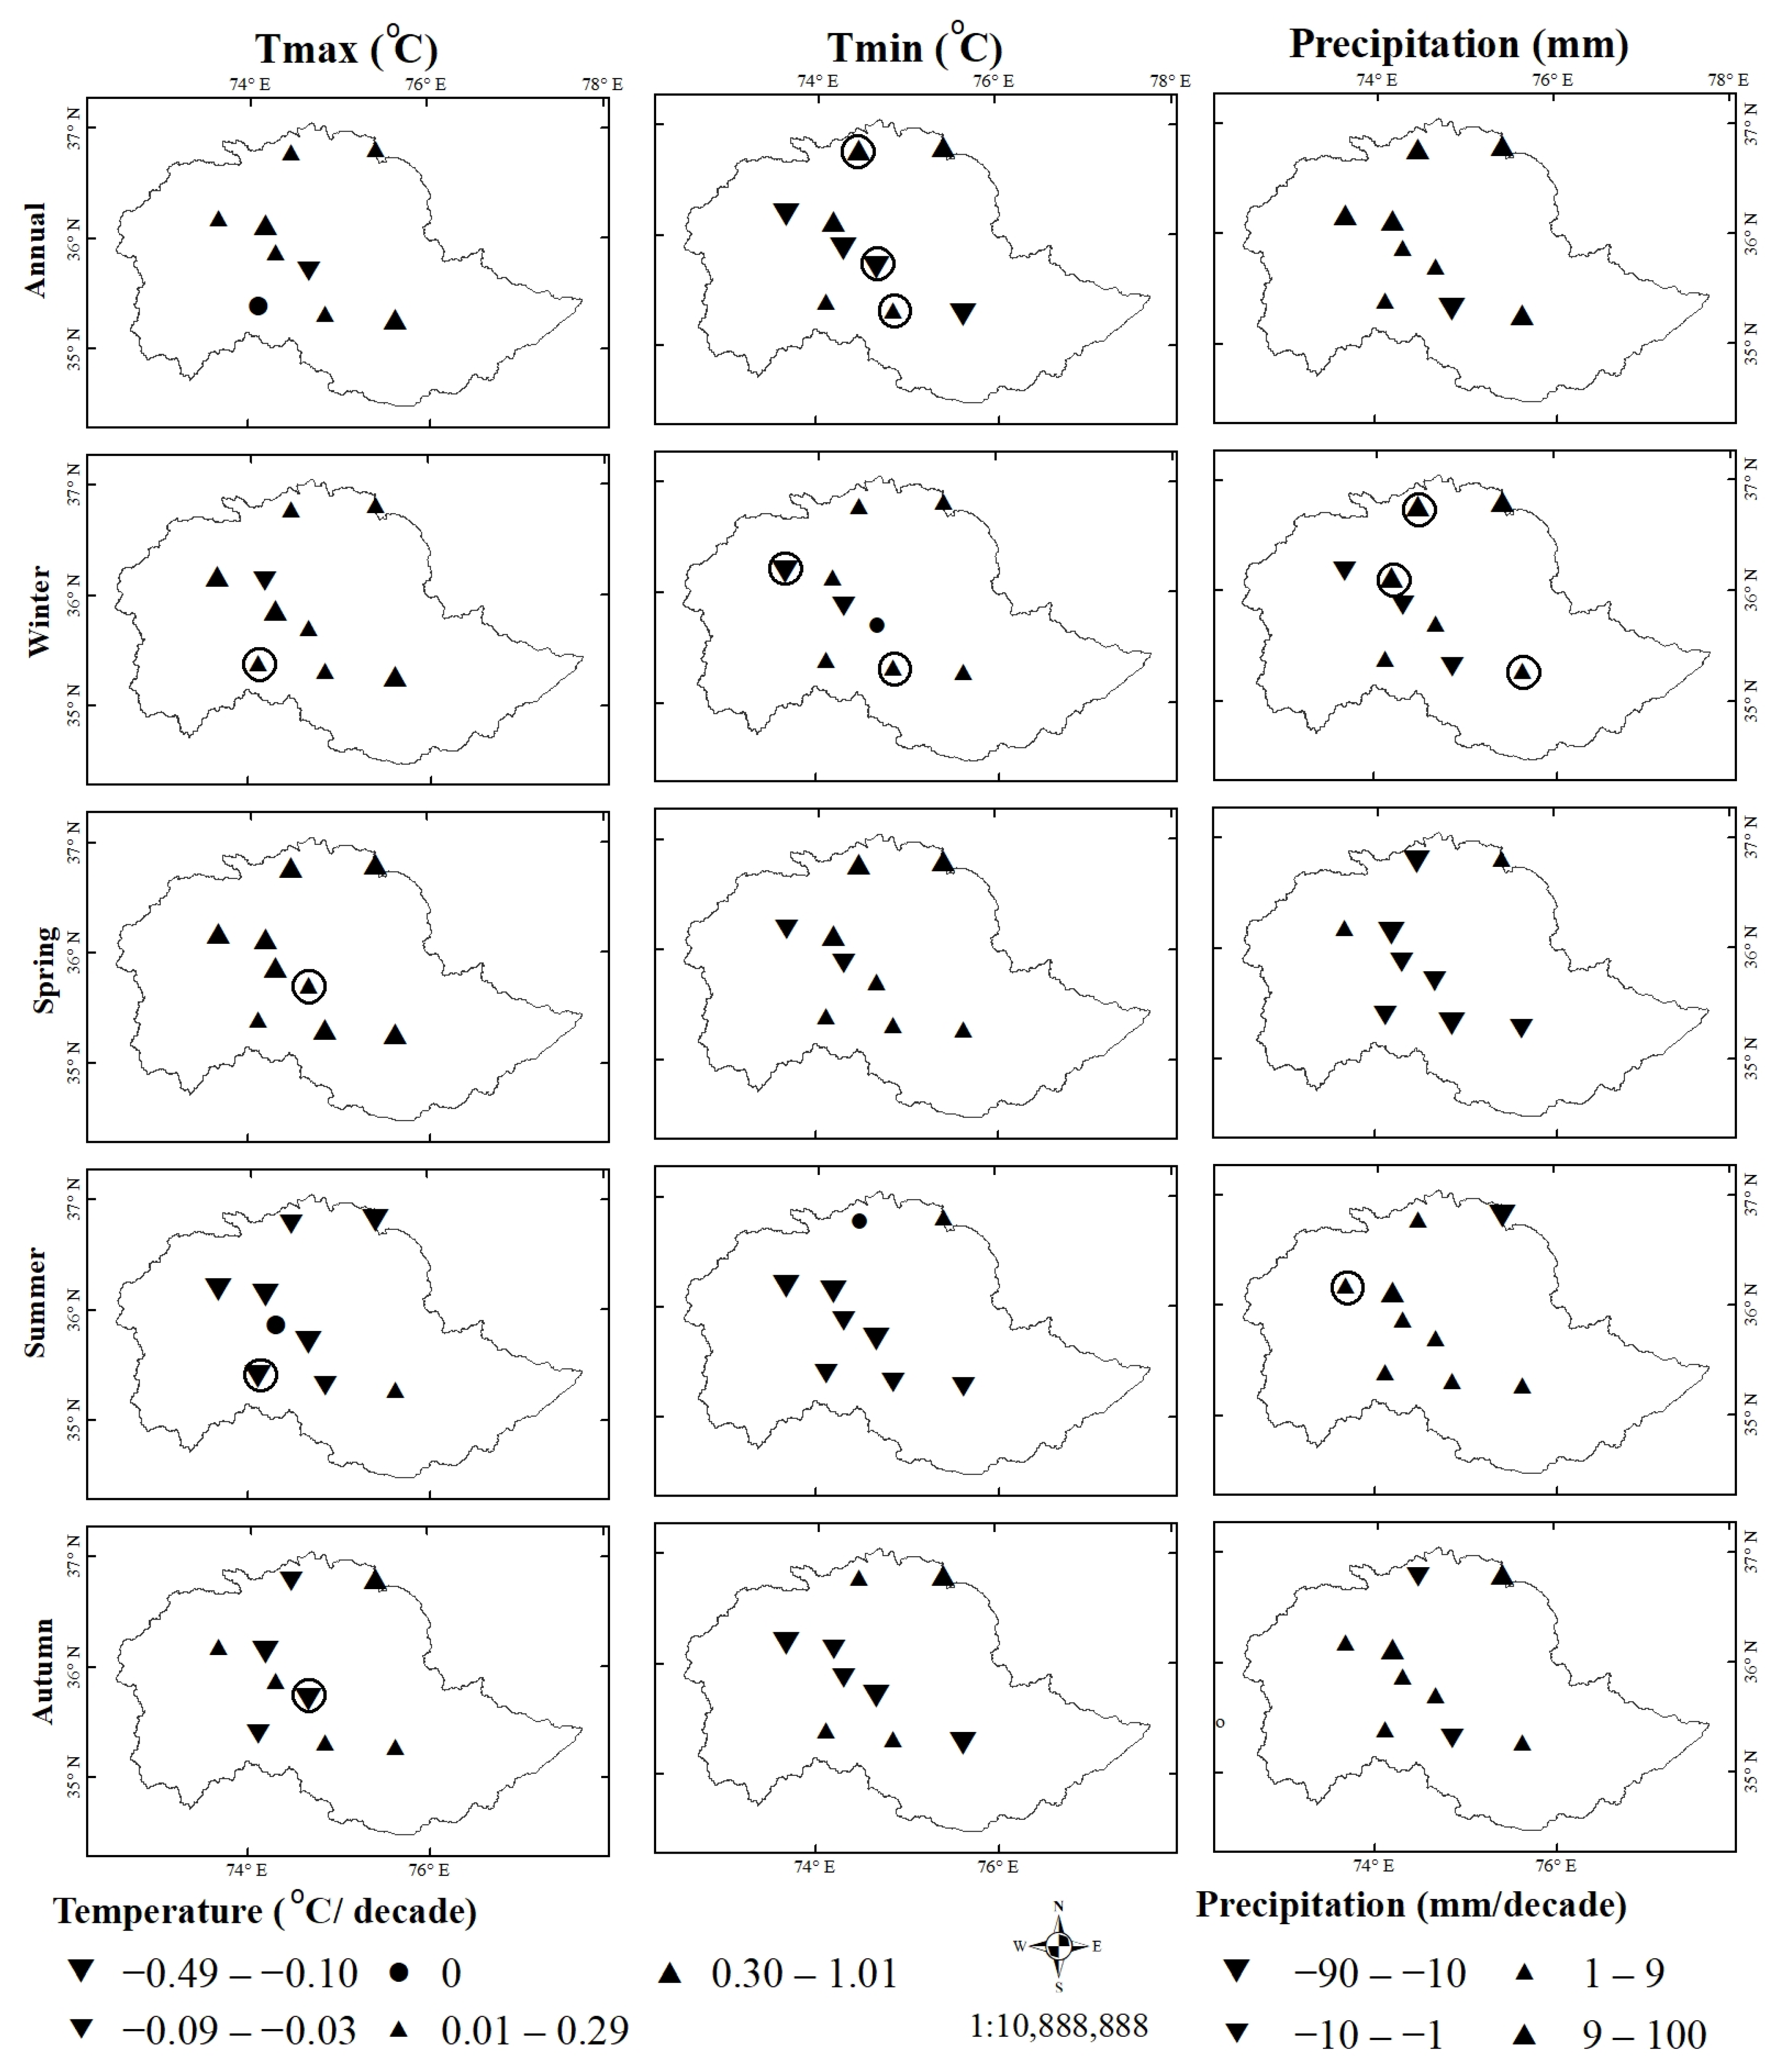
For more information and profound insights of temperature changes at different timescales, trends in annual and seasonal temperature were also calculated. Figure 4 depicts the spatial distribution of the Mann-Kendall test for annual and seasonal Tmax at 9 meteorological stations in the UIB. Observed results of annual Tmax indicate clear warming with a significant increasing trend of 0.14 °C/decade in the UIB. However, the same increasing significant trend for whole UIB is evident in winter and spring at the rates of 0.38 and 0.35 °C/decade (Table 4). On seasonal scale, all the stations display widespread warming in both winter and spring (Figure 4). This implies that warming in the two seasons contributes the most for the annual warming. More significant warming appears in Chilas during winter at a rate of 0.16 °C/decade and in Bunji during spring at a rate of 0.20 °C/decade, all these stations are located in low elevations. The cooling trends are dominated by summer, with the most significant trend of −0.22 °C/decade occurring in Chilas. For autumn, the variation trends of Tmax were less spatially consistent throughout UIB, with mixed downward and upward trends being detected.
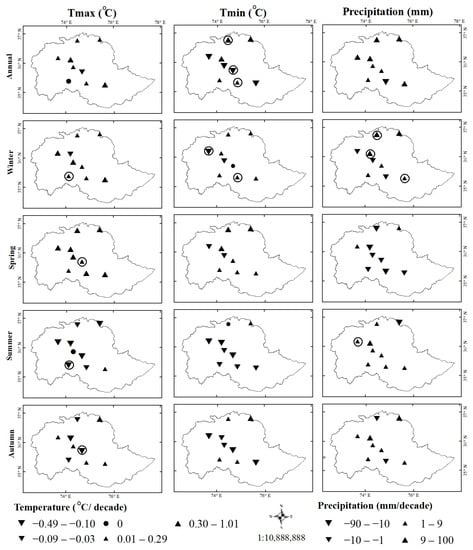
Figure 4.
Spatial distribution of stations with Mann-Kendall and Sen’s test for annual and seasonal Tmax, Tmin and precipitation. Black circles indicate significance level at 5%.

Table 4.
Sen’s estimator for annual and seasonal Tmax, Tmin (°C/decade) and precipitation (mm/decade) during 1955–2016 in the UIB. Bold indicates significant trend at 5% level.
Observed results of annual Tmin indicate significant decreasing trend in annual at rate of −0.08 °C/decade in the UIB. The same negative significant trend for whole UIB is evident in summer and autumn at the rates of −0.21 and −0.22 °C/decade, except in winter and spring with non-significant positive trends for the whole UIB (Table 4). For Tmin, winter and spring are in a synchronous condition with Tmax (Figure 4). However, there are less stations showing increasing trends for Tmin compared to Tmax. Summer cooling is also common in Tmax and Tmin, but the trend magnitudes are stronger in Tmin at most stations. No dominated trend is detected for autumn (Figure 4). Tmin shows large spatial heterogeneity with a mixed pattern of increasing and decreasing trends. Naltar, Ziarat and Khunjerab demonstrate warming trends of 0.61, 0.58 and 0.85 °C/decade, respectively; indicating warming is more prominent in higher elevations. As mentioned earlier, the UIB has the most snow and ice outside of the Polar Regions. Warming in higher elevation region may cause far-reaching eco-environmental problems such as glacier melting, permafrost degradation and vegetation change [4]. Overall, warming in Tmax is more pronounced than Tmin for winter and spring, while the cooling in Tmin is more pronounced than Tmax for summer.
4.4. Spatial Distribution of the Trends in Precipitation
4.4.1. Trends in Monthly Precipitation
Precipitation is not changing much with significant trends at a few stations (Table 5). Regional trends of precipitation for the UIB are increasing in all months with significant positive trend of 1.18 and 1.30 mm/decade is observed in June and September respectively. Precipitation at Khunjerab increased significantly in February and December with trends of 5.67 and 8 mm/decade. Such significant trends are also found in Ziarat in July and September at rates of 14.13 and 10.75 mm/decade, respectively. Further, no significant increasing/decreasing trends are observed in the low- and mid-altitude (<2800 m) stations during October and February.

Table 5.
Sen’s estimator for monthly precipitation (mm/decade). Bold indicates significant trend at 5% level.
4.4.2. Trends in Annual and Seasonal Precipitation
Results of Mann-Kendall test and Sen’s estimator for annual and seasonal precipitation in the UIB are displayed in Figure 4. The annual mean precipitation in the UIB is increasing in all stations, except in Astore, and greater magnitudes occur at high-altitude (>2800 m), such as Naltar and Khunjerab. However, winter has the largest number of stations with significant increasing trends among all seasons. Yet, a precipitation decrease is noticeable only in spring in the region, and a trend of −0.15 mm/decade is observed as a whole. In summer and autumn, most stations have consistently upward trends with only a significant trend of 4.39 mm/decade being observed in Gupis. In spring, an insignificant decrease is observed in Naltar and Astore during spring months, while the same scenario is evident in Khunjerab during summer.
4.5. Temporal Variations in Anomaly Time Series for Temperature and Precipitation
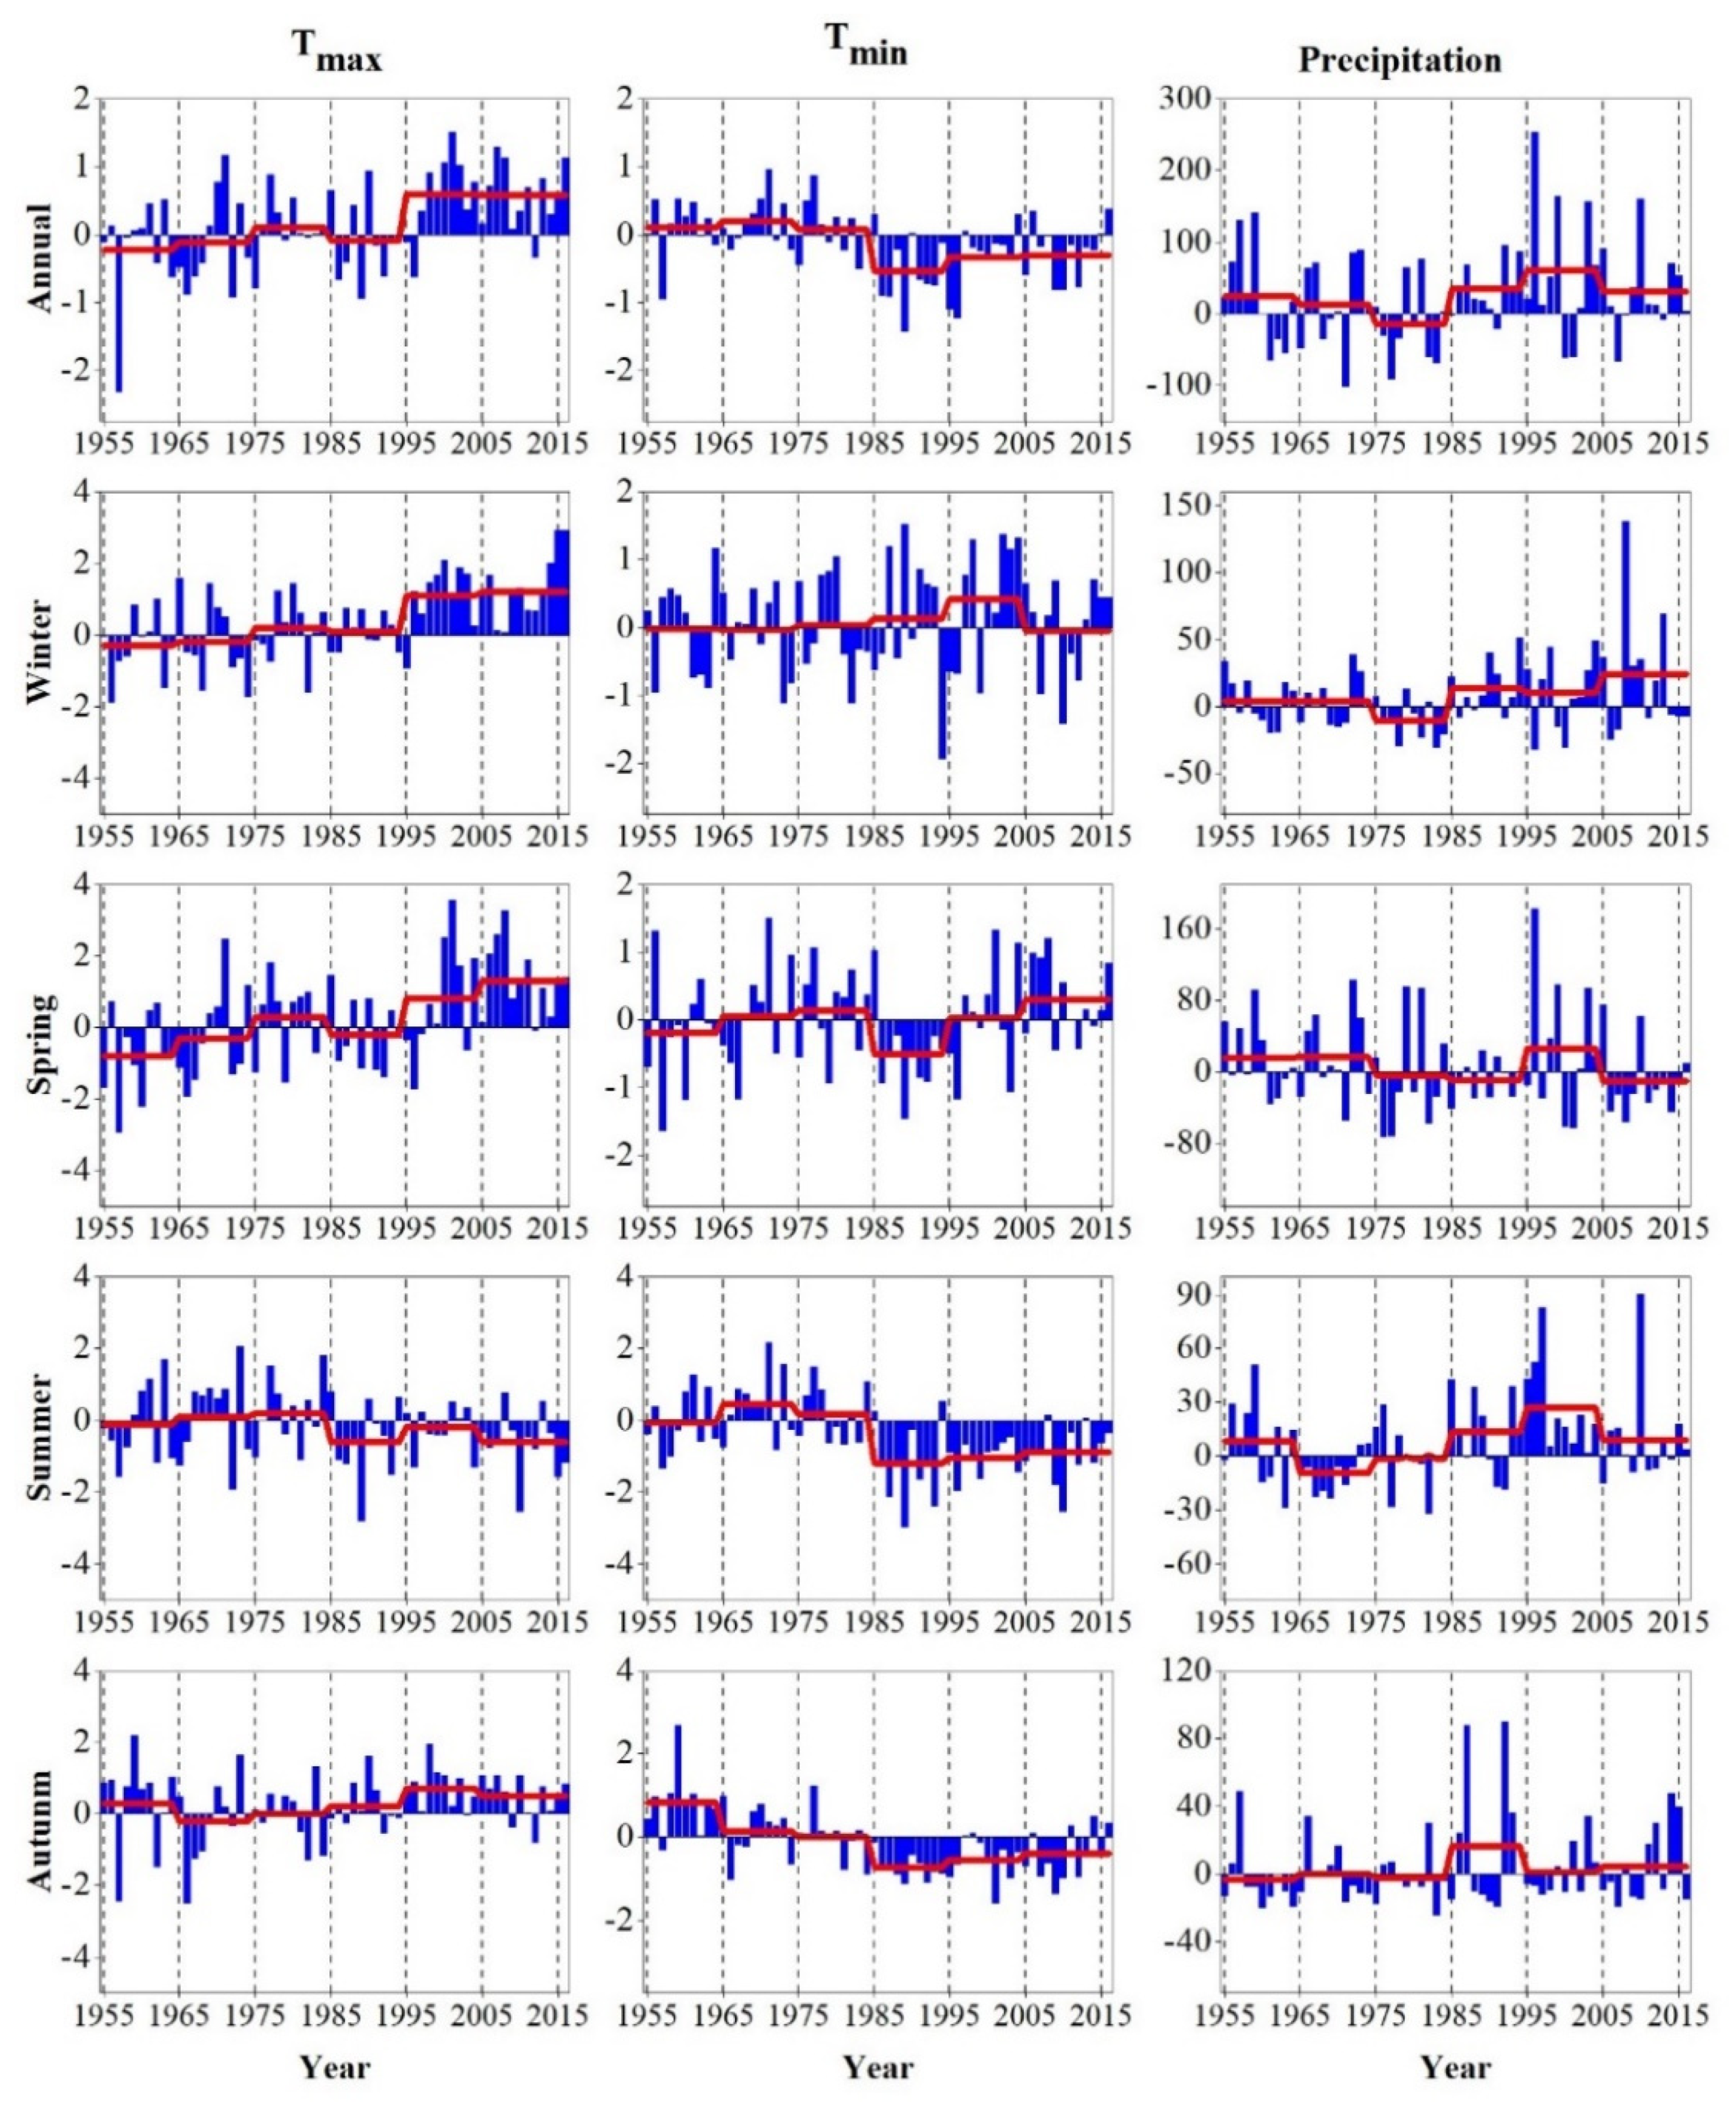
Anomalies for annual and seasonal Tmax and Tmin are presented in Figure 5. Overall, the anomaly series of Tmax exhibited increasing trend during 1955–2016, except in summer. A prominent increasing trend occurred during 1996−2016 with positive values, except in 2012 (Figure 5). The changing patterns in winter, spring and autumn, to a large extent, are very similar to those in a year. The only difference is that warming in autumn is a little earlier since the mid-1980s. The anomaly series in summer indicates a well-balanced fluctuant pattern until 1985, but a cooling tendency thereafter. Observed anomalies of Tmin are presented in Figure 5. The UIB annually experienced a warming trend from 1955 to the mid-1980s, but a variable cooling trend afterwards. Such variations also occurred in summer and autumn. Here, winter and spring exhibited neither a stable nor a gradual pattern during the entire time period.
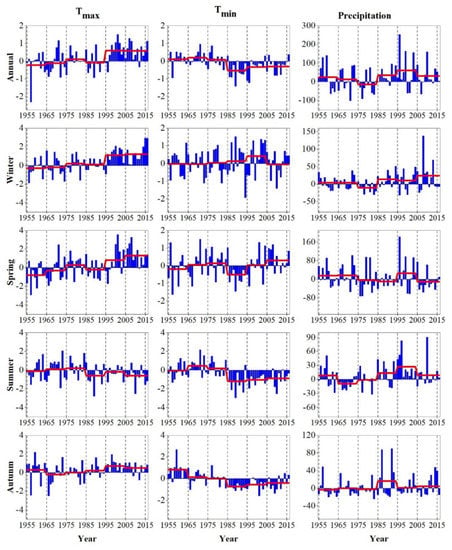
Figure 5.
Annual and seasonal time series anomalies relative to 1961–1990 mean values for Tmax, Tmin and precipitation, while smooth line indicates decadal means to the long-term mean.
Anomalies for annual and seasonal precipitation are shown in Figure 5. No clear patterns are observed in the UIB for the annual precipitation until the mid-1980s, but an increasing trend is apparent during 1985–2016. Such increasing patterns also exists in winter and summer with the anomalies being dominated by positive values from mid-1980s to 2016. For spring and autumn, the anomaly values keep changing, without any clear trend.
4.6. Abrupt Changes in Annual and Seasonal Tmax, Tmin and Precipitation in the UIB
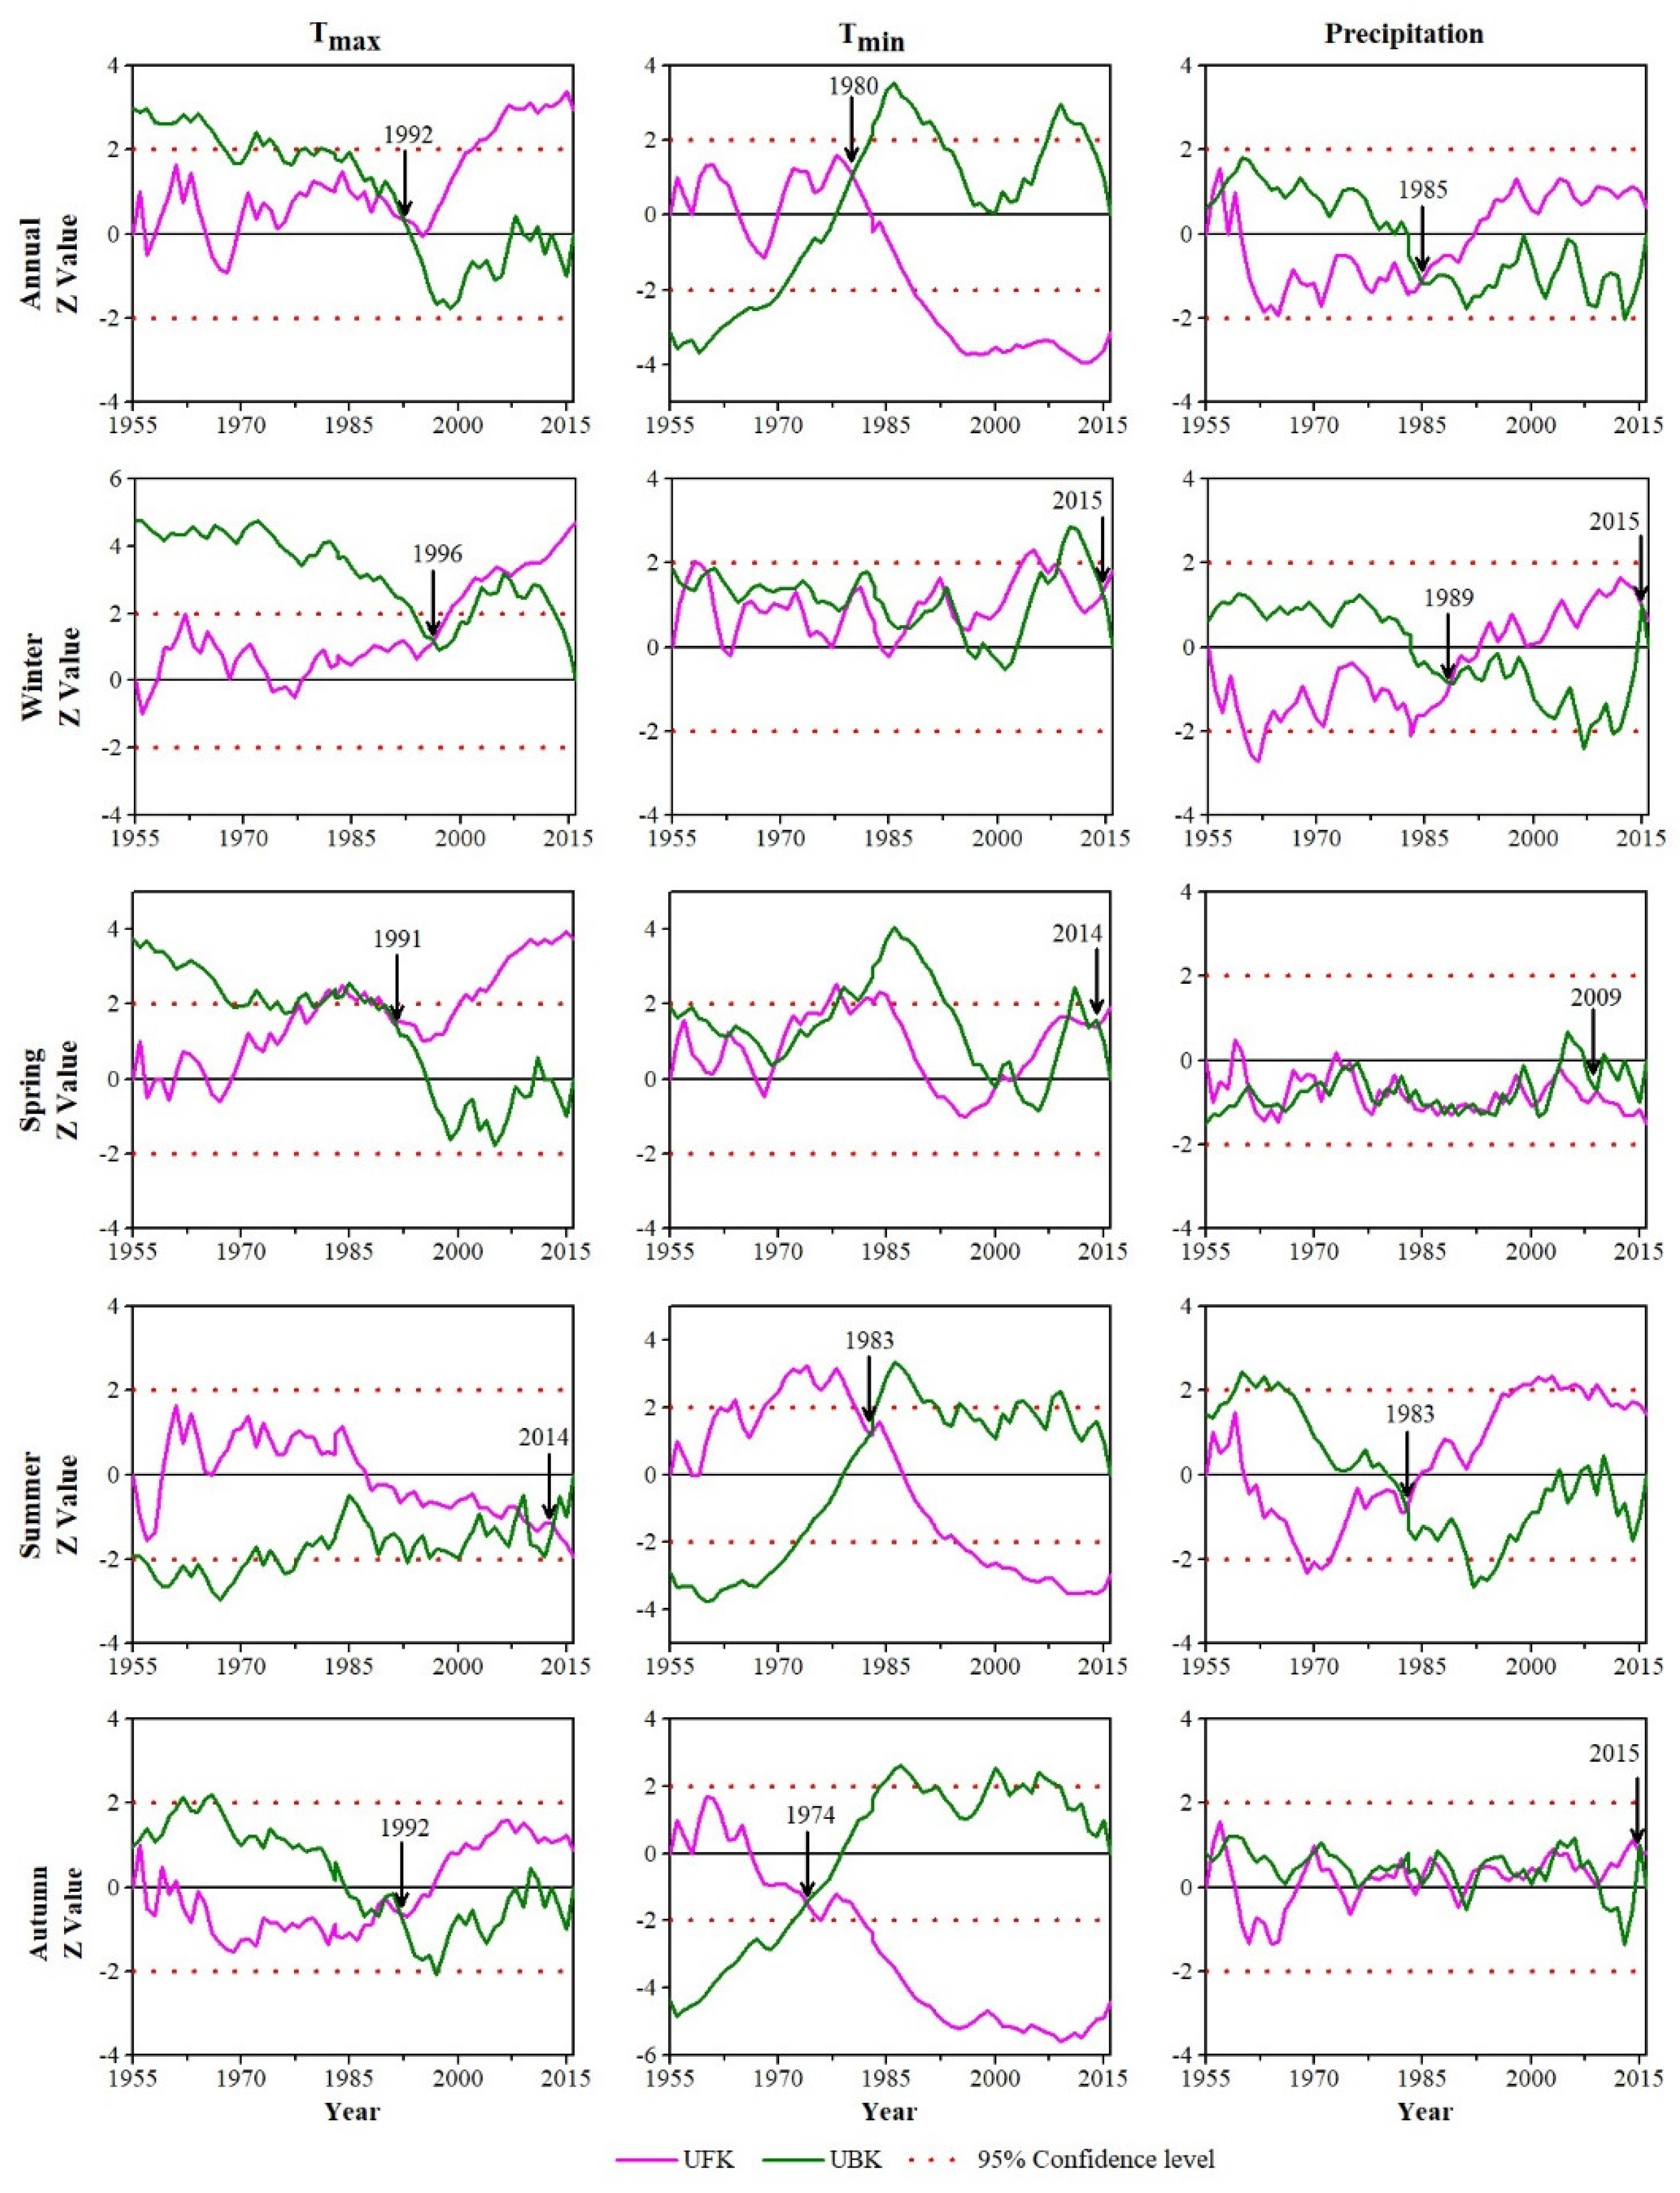
The SQMK analysis provides a detailed picture for start of trend, abrupt changes and significant trends as presented in Figure 6. The intersection of a forward (UFK) and backward (UBK) line represents a significant change point. The major significant change points are marked with an arrow. In general, 1955–1995 is the period where the trends in the annual and seasonal Tmax are decreasing, however, increasing afterwards except a constant decrease in summer during 1955–2016.
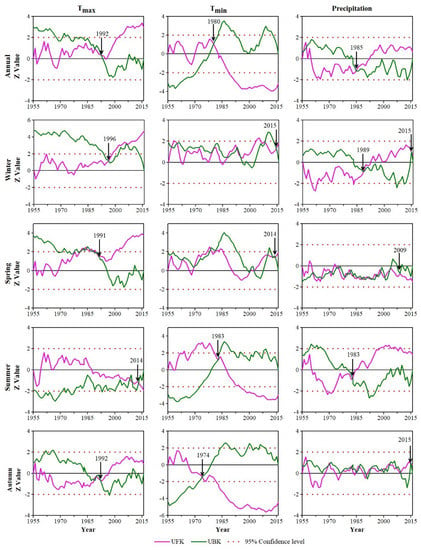
Figure 6.
Start of trend, abrupt change and significant trend as determined by sequential Mann-Kendall test for annual and seasonal Tmax, Tmin and precipitation in the UIB during 1955–2016.
The abrupt change points for annual, winter, spring, summer and autumn Tmax occurred in 1992, 1996, 1991, 2014 and 1992 respectively. The abrupt change and significant trends for annual, winter, spring and autumn occurred during 1990–2000, except for summer. However, the abrupt change and significant trends for Tmin began in the mid-1970s. Overall, Tmin showed a decreasing trend earlier for annual, summer and autumn starting from the 1980s to mid-1995. The abrupt change points for annual, winter, spring, summer and autumn Tmin occurred in 1980, 2015, 2014, 1983 and 1974 respectively. In the UIB, temporal variation in annual and seasonal precipitation were more complex in behavior than Tmax and Tmin. Precipitation in the UIB in general displayed a decreasing trend during 1955–1990 for annual, winter and summer. However, there is a general rise in summer from the mid-1990s. Here, the abrupt change points for annual, spring, summer and autumn occurred in 1985, 2009, 1983 and 2015 respectively. However, winter has two abrupt change points, 1989 and 2015.
4.7. Change Point in Annual and Seasonal Tmax, Tmin and Precipitation at Various Stations
Change point results for annual and seasonal Tmax, Tmin and precipitation are shown in Table 6. For Tmax, there is an upward trend after the mid-1990s in all stations, except Skardu, during annual, winter and spring. Chilas and Bunji displayed a negative trend after 1985. However, Skardu revealed positive trends in Tmax annually and seasonally during 1975–1985. For Tmin, the negative trends for seasonal and annual trends were prominent during 1970–1980 in all stations, except in Astore and Chilas. These both stations displayed positive trends after their respective change point years. Furthermore, precipitation unveiled steady trend patterns in seasonal and annually in various stations. Here, Gilgit and Astore displayed negative trends after change points from 1973 and 1975 respectively. However, Gupis displayed positive trends annually and in summer after 1991 and 1992 respectively.

Table 6.
Change point analysis in annual and seasonal Tmax, Tmin (°C/decade) and precipitation (mm/decade) during 1955–2016.
4.8. Relationship between Temperature and Precipitation with Elevation
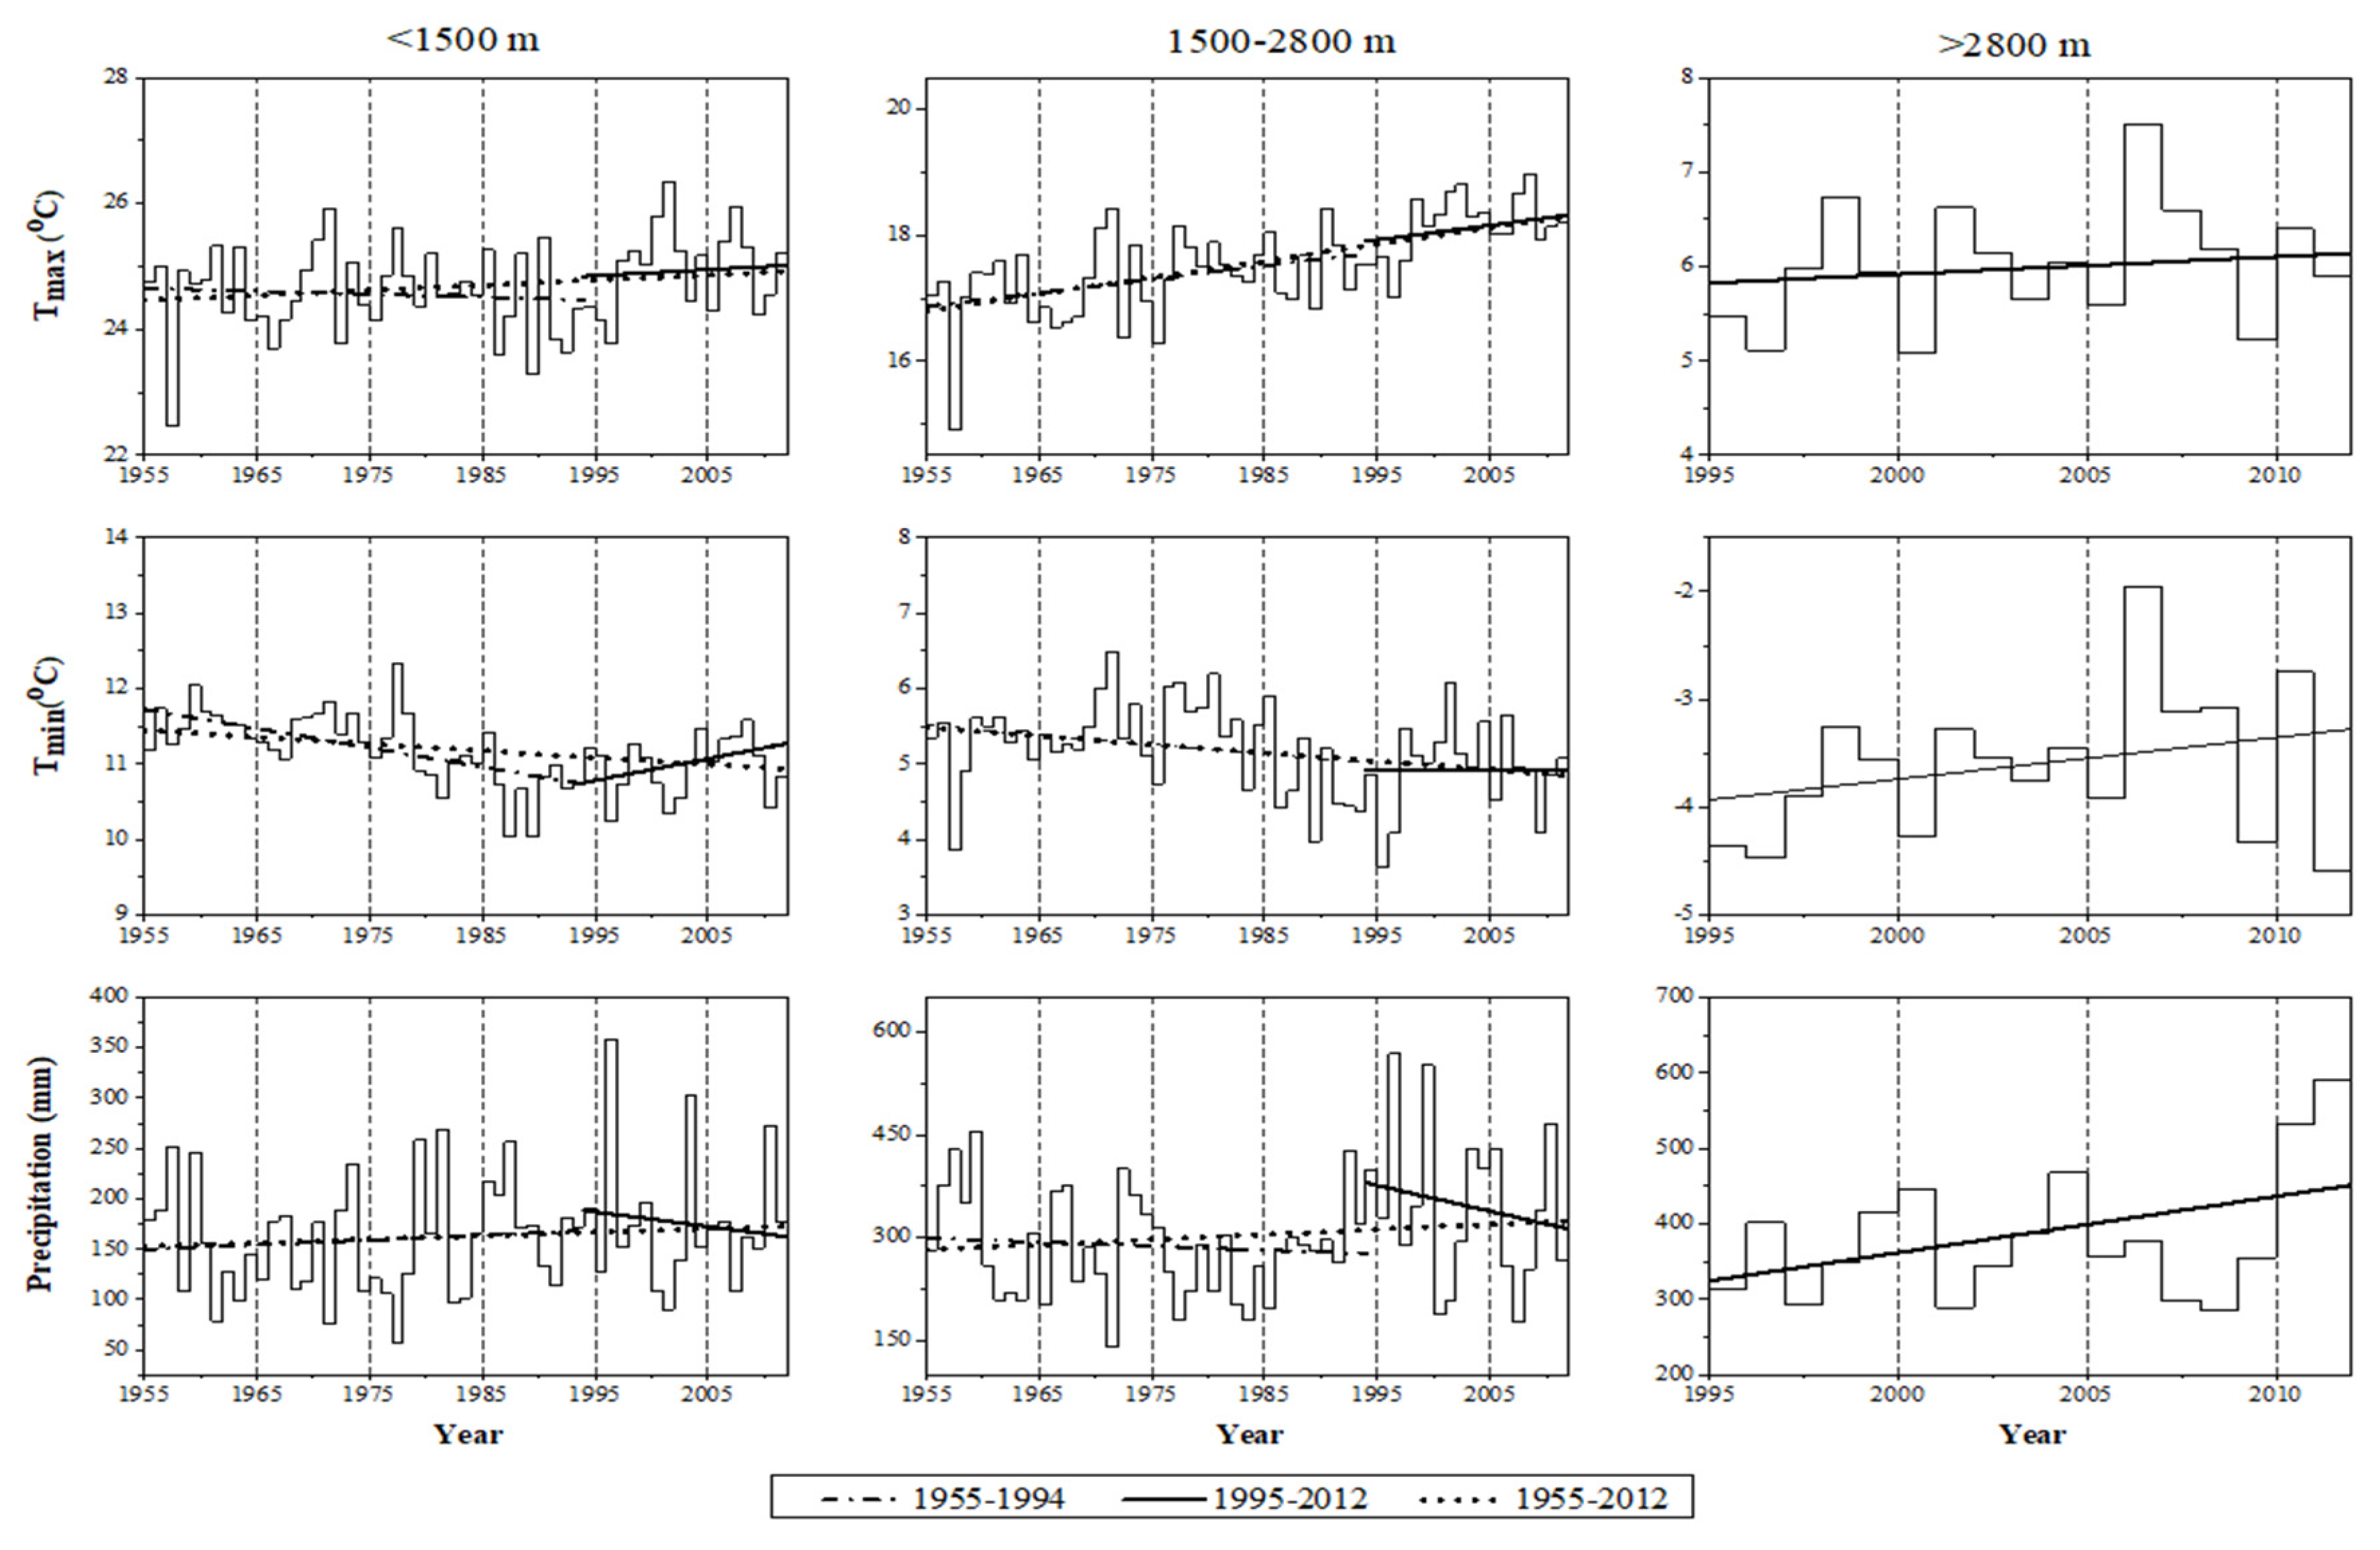
The elevation dependency of climatic warming was found in many previous studies [4,59,60,61]. To further investigate the impacts of elevation variation on climate, the trends of annual Tmax, Tmin and precipitation in different elevations (<1500 m, 1500–2800 m, >2800 m) are computed (Figure 7). Warming in Tmax is more pronounced since the mid-1990s, the variations during three time periods (1955–1994, 1995–2012 and 1955–2012) are also analyzed for more details. Compared to regions with altitudes <1500 m, the regional trends for Tmax, Tmin and precipitation were greater in regions with elevation of 1500–2800 m at the trends of 0.25 °C/decade, −0.12 °C/decade and 6.84 mm/decade during 1955–2012 (Figure 7). During 1955–1994, Tmax increased, while precipitation decreased at <2800 m (Figure 7). In addition, the impacts of elevation variation on precipitation were more distinct during 1995–2012. Precipitation decreased in regions with altitudes <2800 m, and increased in higher elevation (>2800 m). Overall, the effects of elevation variation on climate are obvious. Temperature and precipitation in the UIB exhibit obvious changes in different phases. As shown in Figure 7, the regional trends for Tmin were negative during 1955–2012 in <1500 m. However, clear warming trends of 0.20 and 0.48 °C/decade are observed for Tmin during 1995–2012 in <1500 m and >2800 m.
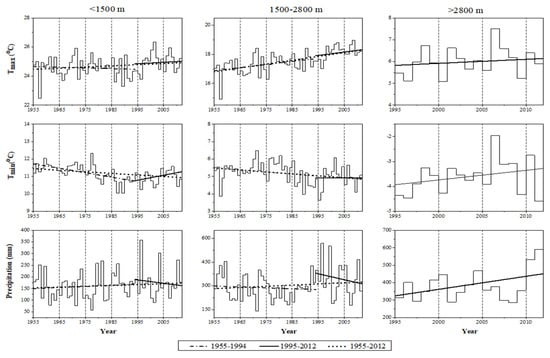
Figure 7.
Trends of annual Tmax, Tmin and precipitation in different elevations (<1500 m, 1500–2800 m, >2800 m) during 1955–1994, 1995–2012 and 1955–2012. Corresponding slope during various periods are also mentioned. Temperature and precipitation slopes are mentioned in °C/decade and mm/decade respectively.
4.9. Monthly Tmax, Tmin and Precipitation Variability Modes
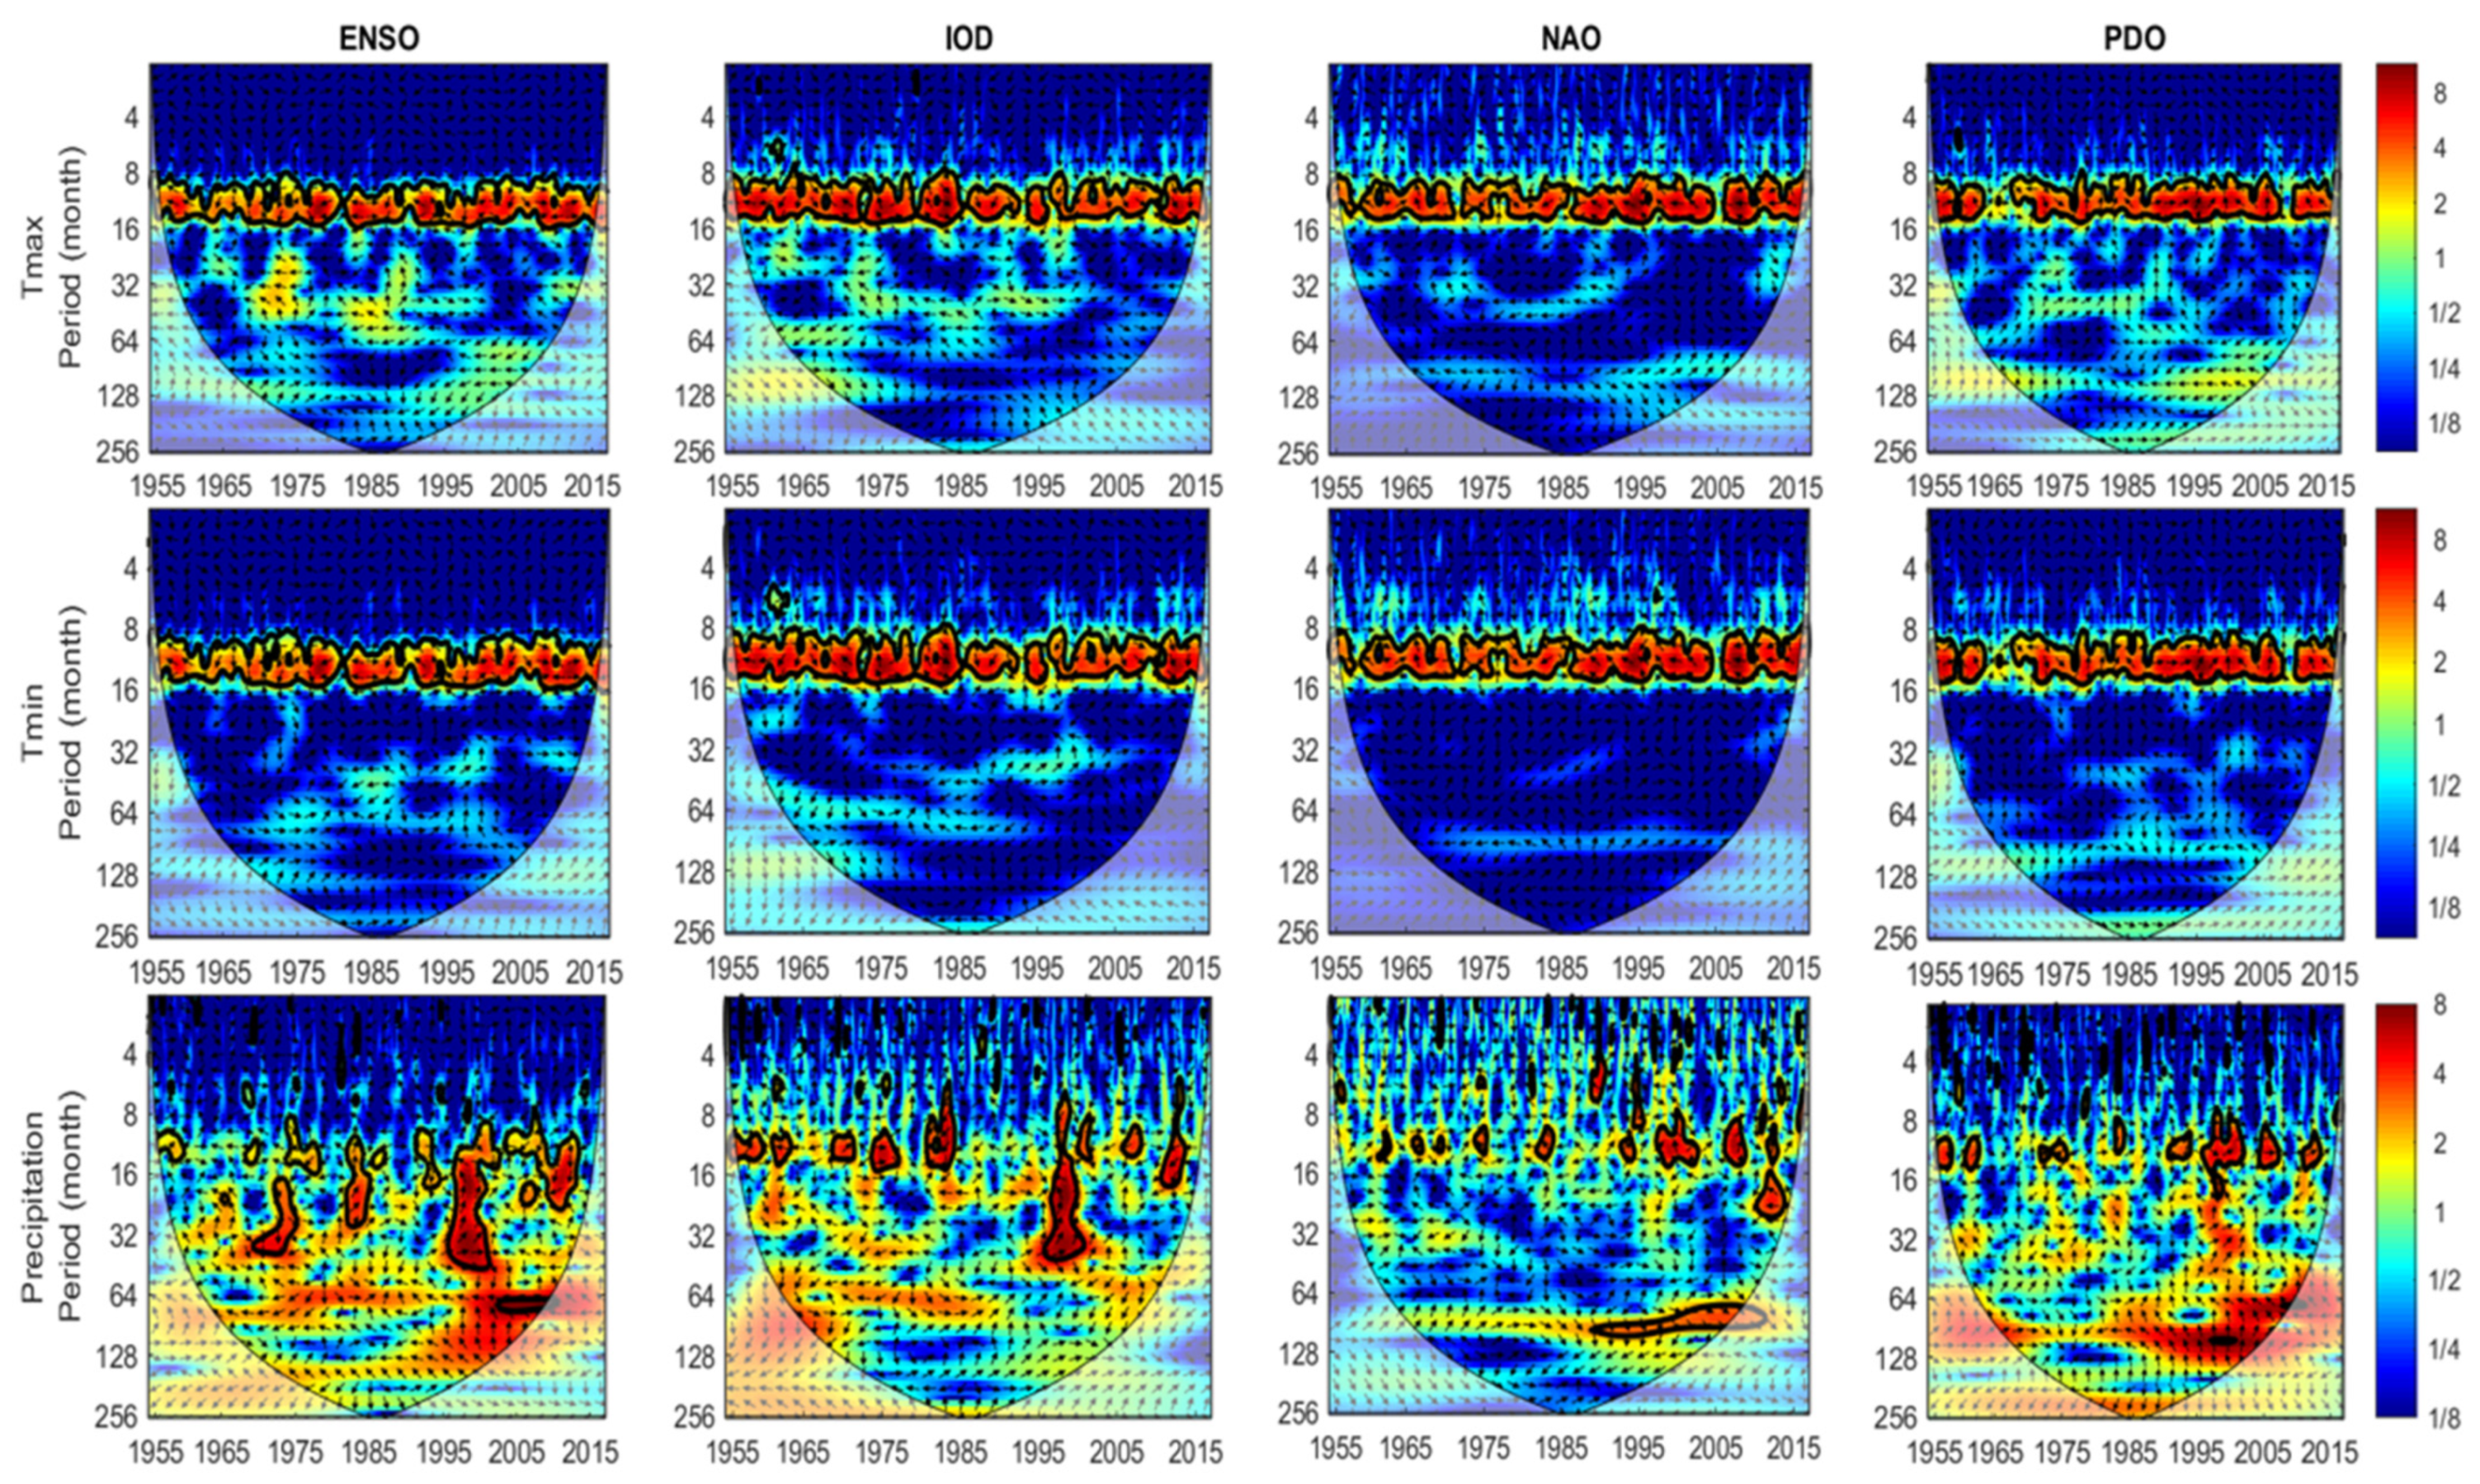
The periodic results of regionally averaged monthly Tmax, Tmin and precipitation were analyzed by using CWT spectra in the UIB displayed in Figure 8. Observed wavelet spectra results reveal periodic inter-annual significant oscillations for various periods during 1955–2016 in the UIB. Sporadic significant inter-annual oscillations for Tmax and Tmin for the entire period ranged from 8 to 16 months (i.e., 0.8–1.4 years). However, the significant inter-annual oscillations for precipitation occurred on a time scale of 8–16 months (0.6–1.3 years)., and one during 2005 at 64 months, (5.3 years). Precipitation showed sporadic but significant oscillations during a <1-year time span.

Figure 8.
Continuous wavelet transform (CWT) of Tmax, Tmin and precipitation time series during 1955–2016. Thick contours denote 5% significance levels against red noise.
4.10. Association between Climate Indices with Monthly Tmax, Tmin and Precipitation
Figure 9 displays the XWT between Tmax, Tmin and precipitation with ENSO, IOD, NAO and PDO during 1955–2016 in the UIB. Both Tmax and Tmin share almost the same inter-annual coherence of 8–16 months (i.e., 0.8–1.4 years) with all climate indices. However, precipitation in the UIB shared multiple sporadic significant coherence periods ranging from inter-annual to inter-decadal time scale with ENSO, IOD, NAO and PDO. Among all climate indices, ENSO shared the most intermittent significant oscillation followed by IOD and NAO. However, PDO shared the least significant periods among the listed indices. ENSO had numerous periodic oscillations during 1955–2016 ranging from 8 to 64 months, while, IOD had the same significant coherence from 8 to 40 months. However, NAO shared a significant inter-decadal coherence from 8 to 128 months (i.e., 1–10 years). There is inter-decadal significant coherence in PDO and monthly precipitation in the range of ~128 months; however, these significant coherence periods are smaller compared to those in NAO in the corresponding period.
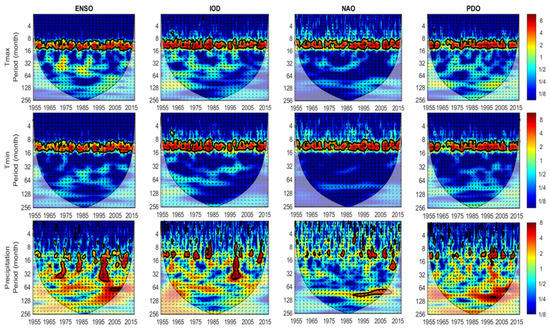
Figure 9.
Cross wavelet transform (XWT) of Tmax, Tmin and precipitation with ENSO, IOD, NAO and PDO during 1955–2016. Right-pointing arrows indicate that the two signals are in phase, while left is for anti-phase signals. Thick contours denote 5% significance levels against red noise.
5. Discussion
With the background of global warming, both Tmax and Tmin show consistent warming at a regional and global scale in recent decades, with the latter warming faster than the former [4,62,63,64,65]. However, climate change in UIB exhibits incomplete synchronization. This study reveals widespread significant warming for Tmax but cooling for Tmin during 1955–2016 (Figure 4 and Figure 5). These warming and cooling results in Tmax and Tmin are consistent with the results of [21,22]. The warming in Tmax is more obvious during 1995–2016 compared to the whole time period, especially in high-altitude stations. Further, warming in Tmax is particularly evident in winter and spring, while cooling in Tmin is much stronger in summer and autumn which supports the findings of [17]. The authors of Ref. [5] Observed winter warming in the neighboring region of Gansu, China. Where, such warming is ascribed to greenhouse gas emission [7]. Rate of deforestation increased during the recent decade, which leads to an increase in surface temperature [66]. The cloud condition, particularly the longwave radiation changes are also causing the temperature increase in the UIB, which has a considerable influence in the near ground surface temperature [67].
Summer cooling was identified for both Tmax and Tmin in this paper, which was in line with the findings of [17] in UIB. The authors of Ref. [68] observed summer cooling in surface temperature due to rapid increase in irrigation. Results of monthly Tmax indicate warming from November to May, both in low-altitude and high-altitude stations. This summer cooling also associates the positive mass balance of glaciers, especially in the Karakoram [9,13,69]. On the other hand, Ref. [14] found no significant mass loss in the glaciers of the Astore basin in the North-West Himalayan area, which is adjacent to the Karakoram region. This might be attributed to changes in the local climate of this location. Furthermore, Tmax and Tmin also suggests summer cooling in Astore with increasing precipitation. The authors of Ref. [70] observed increased streamflow in winter and spring, and decreased during the summer and fall seasons in the UIB. This further indicates that the influence of prevailing climatic trends and their influential status in this region, which is mentioned above in associations to the glaciers mass balance.
In the UIB, the increasing trends are observed in annual and seasonal precipitation except spring (Figure 4). These results are in good agreement with previous studies conducted in the UIB [23,27], and in neighboring regions [5,71]. The authors of Ref. [27] observed a mixed pattern of increasing and decreasing trends in the winter precipitation in the UIB, but our results indicate a significant positive trend of 2.3 mm/decade. Winter precipitation in the UIB is transported through the westerly winds. The HKH and TP mountain ranges in the UIB act as a barrier to the westerly; therefore, downpours substantial precipitation that accounts for concentrated snowfall during winters in the UIB [36]. The increasing precipitation indicates that monsoons in the region is becoming stronger. In some regions of South Asia, the monsoons are becoming less frequent but more intense in summer, and this increases the risk of climate extreme events in the region [72]. Precipitation increase (and decrease) throughout winter (spring) is owing to changes in westerly winds; spring drying is primarily related with the strengthening and northward movement of the mid-latitude storm, as well as an increase in the number of dry days [73]. It demonstrates that changes in the time periods may lead to inconsistencies in findings. The ongoing climate changes exert adverse effects on river flows, ecosystem services, biodiversity and glacial melting.
Our results displayed a strong correlation between regional climate with ENSO, NAO, IOD and PDO. Tmax and Tmin share almost a same inter-annual coherence of ~1–1.4 years with all climate indices. Moreover, precipitation shared significant coherence ranging from inter-annual to inter-decadal time scale. Among them, ENSO and IOD had inter-annual periodic coherences, while NAO and PDO also shared significant inter-decadal periods ranging from ~1 to 10 years. A recent study conducted by [74] reveals the impact of ENSO on temperature extremes in Pakistan. He also demonstrates that the frequency of daylight (and nighttime) warm extremes is favored during La Niña events, when the anomalous Pacific Ocean SSTs are warmer than normal at 20° C. Furthermore, [75] found a significant influence of ENSO in the year-round precipitation in Pakistan. They further observed the influence of AMO and PDO in the UIB. Furthermore, [76] found major correlations between the mean temperature and global teleconnections during spring with NAO and ENSO. They further explained that the NAO might have implications on the certain monsoon months, particularly in August. In addition, another study on the temperature patterns over Pakistan observed a strong correlation of NAO in the spring in central and northern Pakistan; particularly with Tmax in the UIB, while ENSO affects from mid to late spring [77]. The NAO and ENSO play a significant role in winter precipitation in the southern parts of Central Asia. At the same time, the warm phase of the AMO can significantly affect the Indian monsoon rainfall, which affects the southern part of Central Asia [78,79]. Another study explains the NAO and ENSO precipitation signal in the Central Southwest Asia are mostly linked with an intensification through westerlies originating in the Eastern Mediterranean and Middle East regions and moving eastward across the Central Southwest Asia region (including northern Pakistan) during the positive NAO and the warm ENSO phases [80]. Both ENSO and NAO have effects on the winter precipitation in the Central Southwest Asia [81]. The increase in northward moisture transport across the Arabian Sea is believed to be the cause of Pakistan’s strong upward trend in rainfall in the central monsoon area [82]. The authors of Ref. [26] observed a strong positive correlation between winter NAO and the winter precipitation in Karakoram and a negative correlation between the monthly NAO index and the summer rainfall at some stations in the UIB. Although we concluded our findings regarding the selected climate indices with the monthly Tmax, Tmin and precipitation in the UIB, the general behavior is much more complicated than observed. Therefore, further research is required to investigate the characteristics of regional climatic patterns contemporary with the global atmospheric patterns. This region needs more attention to assess the complex climatic patterns and their teleconnections with large-scale climate oscillations.
6. Conclusions
Based on the monthly temperature and precipitation datasets from nine meteorological stations in the UIB, the non-parametric Mann-Kendall and Sen’s slope estimator are applied to analyze the spatial-temporal variations in Tmax, Tmin, and precipitation during 1955–2016. Observed results present different characteristics in both time and space as well as under different altitudes.
- A widespread warming for Tmax and a cooling with large spatial heterogeneity for Tmin are detected during 1955–2016, which is not in a parallel direction to that of global findings on global warming, as Tmax (Tmin) in the UIB increased (and decreased) significantly between 1955 and 2016.
- For Tmin, warming trends are more prominent in stations located at above 2800 m.
- For Tmax, warming in winter and spring contributes the most for the warming year-around, while for Tmin, cooling in summer and autumn especially in November is much stronger. Summer cooling is identified for both Tmax and Tmin.
- The total precipitation amount does not change significantly in UIB during 1960–2012 against its large inter-annual and inter-decadal variability.
- On the temporal scale, the warming in Tmax is more obvious during 1995–2016. The decreasing trends in Tmin become clear from mid-1980s.
- Increasing trends for Tmax and precipitation occur in regions with elevations of 1500–2800 m compared to elevations <1500 m during 1955–2012.
- The results of wavelet transform illustrated strong correlations between ENSO, NAO, IOD and PDO with monthly Tmax, Tmin and precipitation in the UIB.
- Significant inter-annual oscillations for Tmax and Tmin ranged from ~1 to 1.4 years, and ~1–6 years for precipitation. In general, the periodicities in the CWT observations were spatially continuous.
- The XWT results for Tmax and Tmin share nearly the same inter-annual coherence of 8–16 months (i.e., 0.8–1.4 years) with all climate indices. However, precipitation in the UIB shared inter-annual to inter-decadal significant coherences.
- ENSO shared most intermittent significant periods followed by IOD and NAO. However, PDO shared the least significant periods among the listed indices.
- ENSO and IOD had inter-annual periodic coherences, while NAO and PDO shared significant inter-decadal periods ranging from ~1 to 10 years.
This study is only limited to the climate data of nine meteorological stations in the region. More studies are suggested to better understand the variability, trends and change points using updated in situ data (1995–2021) from 20 high meteorological stations (DCPs) installed over various altitudes of the UIB. A detailed research on the influence of large-scale climate variability controls is also mandatory to better explore the prevailing influences of climate indices in this region.
Author Contributions
Conceptualization, J.Z.; Data curation, A.H. and Y.G.; Formal analysis, A.H. and I.H.; Funding acquisition, Y.G. and J.Z.; Investigation, X.W.; Methodology, I.H., M.A. and Y.G.; Project administration, J.C. and J.Z.; Resources, J.Z.; Software, M.A. and Y.G.; Supervision, J.C., X.W. and J.Z.; Validation, S.B.; Visualization, A.H. and X.W.; Writing—original draft, A.H.; Writing—review and editing, J.C. and S.B. All authors have read and agreed to the published version of the manuscript.
Funding
This study is founded by the National Natural Science Foundation of China (Grant No. 41601279), the Special Fund for Forest Scientific Research in the Public Welfare (No. 201504401), and the Fundamental Research Funds for the Central Universities (2016ZCQ06 and 2015ZCQ-SB-01).
Institutional Review Board Statement
Not applicable.
Informed Consent Statement
Not applicable.
Acknowledgments
The authors would like to acknowledge Pakistan Meteorology Department (PMD) and Surface Water Hydrology Project of Water and Power Development Authority (SWHP-WAPDA) of Pakistan for providing temperature and precipitation data. Thanks to Safi Ullah for his guidance and support during manuscript revision.
Conflicts of Interest
The authors declare no conflict of interest.
References
- Shrestha, A.B.; Bajracharya, S.R.; Sharma, A.R.; Duo, C.; Kulkarni, A. Observed trends and changes in daily temperature and precipitation extremes over the Koshi river basin 1975–2010. Int. J. Climatol. 2017, 37, 1066–1083. [Google Scholar] [CrossRef] [Green Version]
- Guan, Y.; Zheng, F.; Zhang, X.; Wang, B. Trends and variability of daily precipitation and extremes during 1960–2012 in the Yangtze River Basin, China. Int. J. Climatol. 2017, 37, 1282–1298. [Google Scholar] [CrossRef]
- Salehi, S.; Dehghani, M.; Mortazavi, S.M.; Singh, V.P. Trend analysis and change point detection of seasonal and annual precipitation in Iran. Int. J. Climatol. 2020, 40, 308–323. [Google Scholar] [CrossRef]
- Guan, Y.; Zhang, X.; Zheng, F.; Wang, B. Trends and variability of daily temperature extremes during 1960–2012 in the Yangtze River Basin, China. Glob. Planet. Chang. 2015, 124, 79–94. [Google Scholar] [CrossRef] [Green Version]
- Wen, X.; Wu, X.; Gao, M. Spatiotemporal variability of temperature and precipitation in Gansu Province (Northwest China) during 1951–2015. Atmos. Res. 2017, 197, 132–149. [Google Scholar] [CrossRef]
- Dahri, Z.H.; Ludwig, F.; Moors, E.; Ahmad, B.; Khan, A.; Kabat, P. An appraisal of precipitation distribution in the high-altitude catchments of the Indus basin. Sci. Total Environ. 2016, 548, 289–306. [Google Scholar] [CrossRef] [Green Version]
- You, Q.-L.; Ren, G.-Y.; Zhang, Y.-Q.; Ren, Y.-Y.; Sun, X.-B.; Zhan, Y.-J.; Shrestha, A.B.; Krishnan, R. An overview of studies of observed climate change in the Hindu Kush Himalayan (HKH) region. Adv. Clim. Chang. Res. 2017, 8, 141–147. [Google Scholar] [CrossRef]
- Bashir, F.; Zeng, X.; Gupta, H.; Hazenberg, P. A hydrometeorological perspective on the Karakoram anomaly using unique valley-based synoptic weather observations. Geophys. Res. Lett. 2017, 44, 10470–10478. [Google Scholar] [CrossRef] [Green Version]
- Hewitt, K. The Karakoram anomaly? Glacier expansion and the ‘elevation effect’, Karakoram Himalaya. Mt. Res. Dev. 2005, 25, 332–341. [Google Scholar] [CrossRef] [Green Version]
- Hewitt, K. Hazards to water resources development in high mountain regions. The Himalayan sources of the Indus. In Hydrology of Disasters, Proceedings of the World Meteorological Organization Technical Conference Held in Geneva, Switzerland, November 1988; World Meteorological Organization: Geneva, Switzerland, 2014; p. 294. [Google Scholar]
- Lutz, A.F.; Immerzeel, W.W.; Kraaijenbrink, P.D.; Shrestha, A.B.; Bierkens, M.F. Climate change impacts on the upper Indus hydrology: Sources, shifts and extremes. PLoS ONE 2016, 11, e0165630. [Google Scholar] [CrossRef] [Green Version]
- Bolch, T.; Kulkarni, A.; Kääb, A.; Huggel, C.; Paul, F.; Cogley, J.G.; Frey, H.; Kargel, J.S.; Fujita, K.; Scheel, M. The state and fate of Himalayan glaciers. Science 2012, 336, 310–314. [Google Scholar] [CrossRef] [Green Version]
- Muhammad, S.; Tian, L.; Ali, S.; Latif, Y.; Wazir, M.A.; Goheer, M.A.; Saifullah, M.; Hussain, I.; Shiyin, L. Thin debris layers do not enhance melting of the Karakoram glaciers. Sci. Total Environ. 2020, 746, 141119. [Google Scholar] [CrossRef]
- Muhammad, S.; Tian, L.; Nüsser, M. No significant mass loss in the glaciers of Astore Basin (North-Western Himalaya), between 1999 and 2016. J. Glaciol. 2019, 65, 270–278. [Google Scholar] [CrossRef] [Green Version]
- Hussain, D.; Kuo, C.-Y.; Hameed, A.; Tseng, K.-H.; Jan, B.; Abbas, N.; Kao, H.-C.; Lan, W.-H.; Imani, M. Spaceborne Satellite for Snow cover and Hydrological Characteristic of the Gilgit River Basin, Hindukush–Karakoram Mountains, Pakistan. Sensors 2019, 19, 531. [Google Scholar] [CrossRef] [Green Version]
- Anjum, M.N.; Ding, Y.; Shangguan, D. Simulation of the projected climate change impacts on the river flow regimes under CMIP5 RCP scenarios in the westerlies dominated belt, northern Pakistan. Atmos. Res. 2019, 227, 233–248. [Google Scholar] [CrossRef]
- Hasson, S.; Böhner, J.; Lucarini, V. Prevailing climatic trends and runoff response from Hindukush–Karakoram–Himalaya, upper Indus Basin. Earth Syst. Dyn. 2017, 8, 337–355. [Google Scholar] [CrossRef] [Green Version]
- Forsythe, N.; Fowler, H.; Blenkinsop, S.; Burton, A.; Kilsby, C.; Archer, D.; Harpham, C.; Hashmi, M. Application of a stochastic weather generator to assess climate change impacts in a semi-arid climate: The Upper Indus Basin. J. Hydrol. 2014, 517, 1019–1034. [Google Scholar] [CrossRef] [Green Version]
- Farhan, S.B.; Zhang, Y.; Aziz, A.; Gao, H.; Ma, Y.; Kazmi, J.; Shahzad, A.; Hussain, I.; Mansha, M.; Umar, M. Assessing the impacts of climate change on the high-altitude snow-and glacier-fed hydrological regimes of Astore and Hunza, the sub-catchments of Upper Indus Basin. J. Water Clim. Chang. 2018, 2, 479–490. [Google Scholar] [CrossRef]
- Amin, M.; Bano, D.; Hassan, S.S.; Goheer, M.A.; Khan, A.A.; Khan, M.R.; Hina, S.M. Mapping and monitoring of glacier lake outburst floods using geospatial modelling approach for Darkut valley, Pakistan. Meteorol. Appl. 2020, 27, e1877. [Google Scholar] [CrossRef]
- Fowler, H.; Archer, D. Conflicting signals of climatic change in the Upper Indus Basin. J. Clim. 2006, 19, 4276–4293. [Google Scholar] [CrossRef] [Green Version]
- Waqas, A.; Athar, H. Observed diurnal temperature range variations and its association with observed cloud cover in northern Pakistan. Int. J. Climatol. 2018, 38, 3323–3336. [Google Scholar] [CrossRef]
- Khattak, M.S.; Babel, M.; Sharif, M. Hydro-meteorological trends in the upper Indus River basin in Pakistan. Clim. Res. 2011, 46, 103–119. [Google Scholar] [CrossRef]
- Steinbauer, M.; Zeidler, J. Climate Change in the Northern Areas Pakistan Impacts on Glaciers, Ecology and Livelyhoods; World Wide Fund for Nature-Pakistan Gilgit Conservation and Information Center (GCIC): Gilgit, Pakistan, 2008. [Google Scholar]
- Farhan, S.B.; Zhang, Y.; Ma, Y.; Guo, Y.; Ma, N. Hydrological regimes under the conjunction of westerly and monsoon climates: A case investigation in the Astore Basin, Northwestern Himalaya. Clim. Dyn. 2015, 44, 3015–3032. [Google Scholar] [CrossRef]
- Archer, D.R.; Fowler, H.J. Spatial and temporal variations in precipitation in the Upper Indus Basin, global teleconnections and hydrological implications. Hydrol. Earth Syst. Sci. Discuss. 2004, 8, 47–61. [Google Scholar] [CrossRef] [Green Version]
- Ullah, S.; You, Q.; Ullah, W.; Ali, A. Observed changes in precipitation in China-Pakistan economic corridor during 1980–2016. Atmos. Res. 2018, 210, 1–14. [Google Scholar] [CrossRef]
- Latif, Y.; Yaoming, M.; Yaseen, M. Spatial analysis of precipitation time series over the Upper Indus Basin. Theor. Appl. Climatol. 2018, 131, 761–775. [Google Scholar] [CrossRef] [Green Version]
- Shi, P.; Yang, T.; Xu, C.-Y.; Yong, B.; Shao, Q.; Li, Z.; Wang, X.; Zhou, X.; Li, S. How do the multiple large-scale climate oscillations trigger extreme precipitation? Glob. Planet. Chang. 2017, 157, 48–58. [Google Scholar] [CrossRef]
- Fowler, H.J.; Archer, D.R. Hydro-climatological variability in the Upper Indus Basin and implications for water resources. Reg. Hydrol. Impacts Clim. Chang. Impact Assess. Decis. Mak. 2005, 295, 131–138. [Google Scholar]
- Bhutiyani, M.R.; Kale, V.S.; Pawar, N. Climate change and the precipitation variations in the northwestern Himalaya: 1866–2006. Int. J. Climatol. A J. R. Meteorol. Soc. 2010, 30, 535–548. [Google Scholar] [CrossRef]
- Khan, A.J.; Koch, M. Correction and informed regionalization of precipitation data in a high mountainous region (Upper Indus Basin) and its effect on SWAT-modelled discharge. Water 2018, 10, 1557. [Google Scholar] [CrossRef] [Green Version]
- Wake, C.P. Glaciochemical investigations as a tool for determining the spatial and seasonal variation of snow accumulation in the central Karakoram, northern Pakistan. Ann. Glaciol. 1989, 13, 279–284. [Google Scholar] [CrossRef] [Green Version]
- Khan, A.J.; Koch, M.; Tahir, A.A. Impacts of Climate Change on the Water Availability, Seasonality and Extremes in the Upper Indus Basin (UIB). Sustainability 2020, 12, 1283. [Google Scholar] [CrossRef] [Green Version]
- Ashraf, A.; Naz, R.; Roohi, R. Glacial lake outburst flood hazards in Hindukush, Karakoram and Himalayan Ranges of Pakistan: Implications and risk analysis. Geomat. Nat. Hazards Risk 2012, 3, 113–132. [Google Scholar] [CrossRef] [Green Version]
- Hasson, S.; Lucarini, V.; Khan, M.R.; Petitta, M.; Bolch, T.; Gioli, G. Early 21st century snow cover state over the western river basins of the Indus River system. Hydrol. Earth Syst. Sci. 2014, 18, 4077–4100. [Google Scholar] [CrossRef] [Green Version]
- Sheikh, M.M.; Manzoor, N.; Adnan, M.; Ashraf, J.; Khan, A.M. Climate Profile and Past Climate Changes in Pakistan; GCISE report No. RR-01; Global Change Impact Studies Centre: Islamabad, Pakistan, 2009. [Google Scholar]
- Chattopadhyay, S.; Jhajharia, D.; Chattopadhyay, G. Univariate modelling of monthly maximum temperature time series over northeast India: Neural network versus Yule–Walker equation based approach. Meteorol. Appl. 2011, 18, 70–82. [Google Scholar] [CrossRef]
- Piyoosh, A.K.; Ghosh, S.K. Effect of autocorrelation on temporal trends in rainfall in a valley region at the foothills of Indian Himalayas. Stoch. Environ. Res. Risk Assess. 2017, 31, 2075–2096. [Google Scholar] [CrossRef]
- Ahmad, I.; Tang, D.; Wang, T.; Wang, M.; Wagan, B. Precipitation trends over time using Mann-Kendall and spearman’s rho tests in swat river basin, Pakistan. Adv. Meteorol. 2015, 2015, 431860. [Google Scholar] [CrossRef] [Green Version]
- Mann, H.B. Nonparametric tests against trend. Econom. J. Econom. Soc. 1945, 13, 245–259. [Google Scholar] [CrossRef]
- Kendall, M.G. Rank Correlation Methods, 3rd ed.; Griffin, C., Ed.; Hafner Publishing Co.: Oxford, UK, 1962. [Google Scholar]
- Gocic, M.; Trajkovic, S. Analysis of changes in meteorological variables using Mann-Kendall and Sen’s slope estimator statistical tests in Serbia. Glob. Planet. Chang. 2013, 100, 172–182. [Google Scholar] [CrossRef]
- Jain, S.; Kumar, V.; Saharia, M. Analysis of rainfall and temperature trends in northeast India. Int. J. Climatol. 2013, 33, 968–978. [Google Scholar] [CrossRef]
- Barry, A.; Caesar, J.; Klein Tank, A.; Aguilar, E.; McSweeney, C.; Cyrille, A.M.; Nikiema, M.; Narcisse, K.; Sima, F.; Stafford, G. West Africa climate extremes and climate change indices. Int. J. Climatol. 2018, 38, e921–e938. [Google Scholar] [CrossRef]
- Sen, P.K. Estimates of the regression coefficient based on Kendall’s tau. J. Am. Stat. Assoc. 1968, 63, 1379–1389. [Google Scholar] [CrossRef]
- Ullah, S.; You, Q.; Ali, A.; Ullah, W.; Jan, M.A.; Zhang, Y.; Xie, W.; Xie, X. Observed changes in maximum and minimum temperatures over China-Pakistan economic corridor during 1980–2016. Atmos. Res. 2019, 216, 37–51. [Google Scholar] [CrossRef]
- Sneyers, S. On the Statistical Analysis of Series of Observations; Technical note no. 143, WMO No. 725 415; Secretariat of the World Meteorological Organization: Geneva, Switzerland, 1990. [Google Scholar]
- Zhao, J.; Huang, Q.; Chang, J.; Liu, D.; Huang, S.; Shi, X. Analysis of temporal and spatial trends of hydro-climatic variables in the Wei River Basin. Environ. Res. 2015, 139, 55–64. [Google Scholar] [CrossRef] [PubMed]
- Cia, T.; Xia, G.; Wilson, L.T.; Chen, W.; Chi, D. Trend and cycle analysis of annual and seasonal precipitation in Liaoning, China. Adv. Meteorol. 2016, 2016, 5170563. [Google Scholar]
- Pettitt, A.N. A non-parametric approach to the change-point problem. J. R. Stat. Soc. Ser. C Appl. Stat. 1979, 28, 126–135. [Google Scholar] [CrossRef]
- Ahmadi, F.; Nazeri Tahroudi, M.; Mirabbasi, R.; Khalili, K.; Jhajharia, D. Spatiotemporal trend and abrupt change analysis of temperature in Iran. Meteorol. Appl. 2018, 25, 314–321. [Google Scholar] [CrossRef] [Green Version]
- Szolgayova, E.; Parajka, J.; Blöschl, G.; Bucher, C. Long term variability of the Danube River flow and its relation to precipitation and air temperature. J. Hydrol. 2014, 519, 871–880. [Google Scholar] [CrossRef]
- Lau, K.; Weng, H. Interannual, decadal–interdecadal, and global warming signals in sea surface temperature during 1955–97. J. Clim. 1999, 12, 1257–1267. [Google Scholar] [CrossRef]
- Torrence, C.; Compo, G.P. A practical guide to wavelet analysis. Bull. Am. Meteorol. Soc. 1998, 79, 61–78. [Google Scholar] [CrossRef] [Green Version]
- Grinsted, A.; Moore, J.C.; Jevrejeva, S. Application of the cross wavelet transform and wavelet coherence to geophysical time series. Nonlinear Process. Geophys. 2004, 11, 561–566. [Google Scholar] [CrossRef]
- Ciria, T.P.; Chiogna, G. Intra-catchment comparison and classification of long-term streamflow variability in the Alps using wavelet analysis. J. Hydrol. 2020, 587, 124927. [Google Scholar] [CrossRef]
- Li, Y.; Wen, Y.; Lai, H.; Zhao, Q. Drought response analysis based on cross wavelet transform and mutual entropy. Alex. Eng. J. 2020, 59, 1223–1231. [Google Scholar] [CrossRef]
- Liu, X.; Cheng, Z.; Yan, L.; Yin, Z.-Y. Elevation dependency of recent and future minimum surface air temperature trends in the Tibetan Plateau and its surroundings. Glob. Planet. Chang. 2009, 68, 164. [Google Scholar] [CrossRef]
- Beniston, M.; Rebetez, M. Regional behavior of minimum temperatures in Switzerland for the period 1979–1993. Theor. Appl. Climatol. 1996, 53, 231–243. [Google Scholar] [CrossRef]
- You, Q.; Kang, S.; Pepin, N.; Flügel, W.-A.; Yan, Y.; Behrawan, H.; Huang, J. Relationship between temperature trend magnitude, elevation and mean temperature in the Tibetan Plateau from homogenized surface stations and reanalysis data. Glob. Planet. Chang. 2010, 71, 124–133. [Google Scholar] [CrossRef]
- Alexander, L.V.; Zhang, X.; Peterson, T.C.; Caesar, J.; Gleason, B.; Klein Tank, A.; Haylock, M.; Collins, D.; Trewin, B.; Rahimzadeh, F. Global observed changes in daily climate extremes of temperature and precipitation. J. Geophys. Res. Atmos. 2006, 111, D05109. [Google Scholar] [CrossRef] [Green Version]
- Klein Tank, A.M.G.; Peterson, T.C.; Quadir, D.A.; Dorji, S.; Zou, X.; Tang, H.; Santhosh, K.; Joshi, U.R.; Jaswal, A.K.; Kolli, R.K.; et al. Climate and Dynamics-D16105-central and south Asia. J. Geophys. Res. Part D Atmos. 2006, 111, D16105. [Google Scholar]
- You, Q.; Kang, S.; Aguilar, E.; Pepin, N.; Flügel, W.-A.; Yan, Y.; Xu, Y.; Zhang, Y.; Huang, J. Changes in daily climate extremes in China and their connection to the large-scale atmospheric circulation during 1961–2003. Clim. Dyn. 2011, 36, 2399–2417. [Google Scholar] [CrossRef]
- Skansi, M.M.; Brunet, M.; Sigró, J.; Aguilar, E.; Groening, J.A.A.; Bentancur, O.J.; Geier, Y.R.C.; Amaya, R.L.C.; Jácome, H.; Ramos, A.M. Warming and wetting signals emerging from analysis of changes in climate extreme indices over South America. Glob. Planet. Chang. 2013, 100, 295–307. [Google Scholar] [CrossRef]
- Hussain, A.; Ali, S.; Begum, S.; Hussain, I.; Ali, H. Climate change perspective in mountain area: Impacts and adaptations in Naltar valley, Western Himalaya, Pakistan. Fresenius Environ. Bulliten. 2019, 28, 6683–6691. [Google Scholar]
- Forsythe, N.; Hardy, A.; Fowler, H.; Blenkinsop, S.; Kilsby, C.; Archer, D.; Hashmi, M. A detailed cloud fraction climatology of the Upper Indus Basin and its implications for near-surface air temperature. J. Clim. 2015, 28, 3537–3556. [Google Scholar] [CrossRef] [Green Version]
- Kang, S.; Eltahir, E.A. Impact of irrigation on regional climate over Eastern China. Geophys. Res. Lett. 2019, 46, 5499–5505. [Google Scholar] [CrossRef] [Green Version]
- Minora, U.; Bocchiola, D.; D’Agata, C.; Maragno, D.; Mayer, C.; Lambrecht, A.; Vuillermoz, E.; Senese, A.; Compostella, C.; Smiraglia, C. Glacier area stability in the Central Karakoram National Park (Pakistan) in 2001–2010: The “Karakoram Anomaly” in the spotlight. Prog. Phys. Geogr. 2016, 40, 629–660. [Google Scholar] [CrossRef]
- Yaseen, M.; Ahmad, I.; Guo, J.; Azam, M.I.; Latif, Y. Spatiotemporal Variability in the Hydrometeorological Time-Series over Upper Indus River Basin of Pakistan. Adv. Meteorol. 2020, 2020, 5852760. [Google Scholar] [CrossRef]
- Mullick, M.R.A.; Nur, R.M.; Alam, M.J.; Islam, K.A. Observed trends in temperature and rainfall in Bangladesh using pre-whitening approach. Glob. Planet. Chang. 2019, 172, 104–113. [Google Scholar] [CrossRef]
- Auffhammer, M.; Ramanathan, V.; Vincent, J.R. Climate change, the monsoon, and rice yield in India. Clim. Chang. 2012, 111, 411–424. [Google Scholar] [CrossRef]
- Hasson, S. Future water availability from Hindukush-Karakoram-Himalaya Upper Indus Basin under conflicting climate change scenarios. Climate 2016, 4, 40. [Google Scholar] [CrossRef] [Green Version]
- Saleem, F.; Zeng, X.; Hina, S.; Omer, A. Regional changes in extreme temperature records over Pakistan and their relation to Pacific variability. Atmos. Res. 2021, 250, 105407. [Google Scholar] [CrossRef]
- Iqbal, M.F.; Athar, H. Variability, trends, and teleconnections of observed precipitation over Pakistan. Theor. Appl. Climatol. 2018, 134, 613–632. [Google Scholar] [CrossRef]
- del Río, S.; Anjum Iqbal, M.; Cano-Ortiz, A.; Herrero, L.; Hassan, A.; Penas, A. Recent mean temperature trends in Pakistan and links with teleconnection patterns. Int. J. Climatol. 2013, 33, 277–290. [Google Scholar] [CrossRef]
- Iqbal, M.A.; Penas, A.; Cano-Ortiz, A.; Kersebaum, K.C.; Herrero, L.; del Río, S. Analysis of recent changes in maximum and minimum temperatures in Pakistan. Atmos. Res. 2016, 168, 234–249. [Google Scholar] [CrossRef]
- Li, S.; Perlwitz, J.; Quan, X.; Hoerling, M.P. Modelling the influence of North Atlantic multidecadal warmth on the Indian summer rainfall. Geophys. Res. Lett. 2008, 35. [Google Scholar] [CrossRef]
- de Beurs, K.M.; Henebry, G.M.; Owsley, B.C.; Sokolik, I.N. Large scale climate oscillation impacts on temperature, precipitation and land surface phenology in Central Asia. Environ. Res. Lett. 2018, 13, 065018. [Google Scholar] [CrossRef]
- Syed, F.S.; Giorgi, F.; Pal, J.; Keay, K. Regional climate model simulation of winter climate over Central–Southwest Asia, with emphasis on NAO and ENSO effects. Int. J. Climatol. A J. R. Meteorol. Soc. 2010, 30, 220–235. [Google Scholar] [CrossRef]
- Syed, F.; Giorgi, F.; Pal, J.; King, M. Effect of remote forcings on the winter precipitation of central southwest Asia part 1: Observations. Theor. Appl. Climatol. 2006, 86, 147–160. [Google Scholar] [CrossRef]
- Latif, M.; Syed, F.; Hannachi, A. Rainfall trends in the South Asian summer monsoon and its related large-scale dynamics with focus over Pakistan. Clim. Dyn. 2017, 48, 3565–3581. [Google Scholar] [CrossRef]
Publisher’s Note: MDPI stays neutral with regard to jurisdictional claims in published maps and institutional affiliations. |
© 2021 by the authors. Licensee MDPI, Basel, Switzerland. This article is an open access article distributed under the terms and conditions of the Creative Commons Attribution (CC BY) license (https://creativecommons.org/licenses/by/4.0/).

