Article

Turbulent Momentum Flux Behavior above a Fire Front in an Open-Canopied Forest

1
USDA Forest Service, Northern Research Station, 3101 Technology Blvd., Suite F, Lansing, MI 48910, USA
2
USDA Forest Service, Northern Research Station, Silas Little Experimental Forest, 501 Four Mile Road, New Lisbon, NJ 08064, USA
3
Department of Geography, Environment and Spatial Sciences, Michigan State University, East Lansing, MI 48824, USA
4
USDA Forest Service, Northern Research Station, 180 Canfield Street, Morgantown, WV 26505, USA
*
Author to whom correspondence should be addressed.
Atmosphere 2021, 12(8), 956; https://doi.org/10.3390/atmos12080956
Submission received: 10 June 2021 / Revised: 21 July 2021 / Accepted: 23 July 2021 / Published: 24 July 2021
(This article belongs to the Section Biometeorology)

Abstract

:
Atmospheric turbulent circulations in the vicinity of wildland fire fronts play an important role in the transfer of momentum into and out of combustion zones, which in turn can potentially affect the behavior and spread of wildland fires. The vertical turbulent transfer of momentum is accomplished via individual sweep, ejection, outward interaction, and inward interaction events, collectively known as sweep-ejection dynamics. This study examined the sweep-ejection dynamics that occurred before, during, and after the passage of a surface fire front during a prescribed fire experiment conducted in an open-canopied forest in the New Jersey Pine Barrens. High-frequency (10 Hz), tower-based, sonic anemometer measurements of horizontal and vertical wind velocity components in the vicinity of the fire front were used to assess the relative frequencies of occurrence of the different types of momentum-flux events, their contributions to the overall momentum fluxes, and their periodicity patterns. The observational results suggest that the presence of surface fire fronts in open-canopied forests can substantially change the sweep-ejection dynamics that typically occur when fires are not present. In particular, sweep events resulting in the downward transport of high horizontal momentum air from above were found to be more prominent during fire-front-passage periods.

1. Introduction

The behavior of wildland fires, which often occur in forested environments, is influenced by a variety of factors. Fuel type, fuel loading, fuel moisture, topography, the presence or absence of overstory vegetation, and ambient and fire-induced atmospheric conditions all contribute to the manner in which wildland fires spread across landscapes. Regarding the latter atmospheric-related factors, several observational studies of atmospheric interactions with wildland fires at spatial and temporal scales relevant to fire behavior and combustion processes have been carried out in recent years (e.g., [1,2,3,4,5,6,7,8,9]). These studies have yielded new insights into the roles that lower atmospheric boundary-layer dynamics and vegetation–atmosphere interactions can play in affecting fire behavior.
The connections between wildland-fire behavior and lower atmospheric boundary-layer dynamics are largely rooted in the atmospheric turbulent circulations that develop in the vicinity of fire fronts, whether induced by the fire fronts or associated with the ambient turbulence regimes imbedded in the lower boundary layer. The spatial and temporal scales that characterize most of the turbulent circulations in the lower boundary layer including those atmospheric layers containing forest overstory vegetation, generally range from ~0.001 to 100 m (micro δ scale to micro β scale) and ~1 s or less to 10 min, respectively [10,11]. They overlap with the range of spatial and temporal scales over which fire spread/behavior variability is often measured and relevant for some of the more local and short duration aspects of tactical fire management (10 s of meters, minutes) [12,13,14]. This overlap in scales has prompted observational and modeling efforts to identify the specific atmospheric turbulence mechanisms and properties that could potentially contribute to highly variable wildland-fire spread in forested, grassland, and complex terrain environments (e.g., [5,6,15,16,17,18,19,20,21,22,23]).
Building upon these previous studies and to further support the development of physics-based fire-behavior and coupled fire-atmospheric dynamics models, a project focused on multi-scale analyses of wildland-fire combustion processes in open-canopied forests is underway within the U.S. Department of Defense–Strategic Environmental Research Program (SERDP) (https://www.serdp-estcp.org/Program-Areas/Resource-Conservation-and-Resiliency/Air-Quality/Fire-Emissions/RC-2641, accessed on 19 May 2021). A key component of this project are analyses of the effects of ambient, fire-induced, and forest-canopy-induced turbulent circulations on turbulent heat and momentum fluxes above and in the vicinity of wildland fire combustion zones. Turbulent heat and momentum fluxes, in turn, are responsible for much of the transfer of heat and momentum into and out of combustion zones, potentially contributing factors to spatial and temporal variations in fire spread rates [24,25].
For this paper, we specifically examined the sweep-ejection dynamics [26] for the turbulent momentum fluxes that occurred in the vicinity of an advancing fire line during a management-scale prescribed fire experiment conducted at the Silas Little Experimental Forest within the Brendan T. Byrne State Forest in New Jersey on 13 March 2019, one of many laboratory-scale to management-scale fire experiments being conducted as part of the overall SERDP project. Although sweep-ejection dynamics associated with turbulent momentum fluxes have been studied extensively in forested and non-forested environments, few studies of momentum-flux sweep-ejection dynamics above and in the vicinity of wildland fire-fronts have been carried out. Within dense canopy layers, previous observational and modeling studies have shown that sweeps, or the downward flux of higher horizontal-momentum air from above, tend to be the dominant turbulent momentum transfer process [27,28,29,30], whereas in sparse canopy layers, ejections (upward flux of lower horizontal-momentum air from below) tend to dominate [29,31]. Heilman et al. [32], in a study of sweep-ejection dynamics during understory and grassland fire events in 2006, 2011, and 2012, suggested that a spreading wildland fire beneath forest overstory vegetation with its associated buoyancy and turbulent circulations may substantially change the prevalence of sweep and ejection events and their contributions to overall turbulent momentum fluxes compared to what is typically observed in the absence of fire. In particular, they found that outward interaction events (upward flux of higher horizontal-momentum air from below) as well as sweep events were frequent and strong contributors to overall turbulent momentum fluxes above fire lines. However, additional observations and analyses of momentum-flux sweep-ejection dynamics during wildland fire events are needed to bolster those findings and to further advance our understanding of the potential connections between turbulent momentum fluxes near fire fronts and fire behavior.
The sections below provide a summary of the 2019 SERDP management-scale prescribed fire experiment and the atmospheric and fire-spread monitoring strategies employed, a description of the sweep-ejection dynamics analyses that were performed, a presentation of the sweep-ejection dynamics analysis results, and a concluding discussion of the relevance of the results for understanding how atmospheric boundary-layer turbulence can potentially impact wildland fire behavior.

2. Materials and Methods

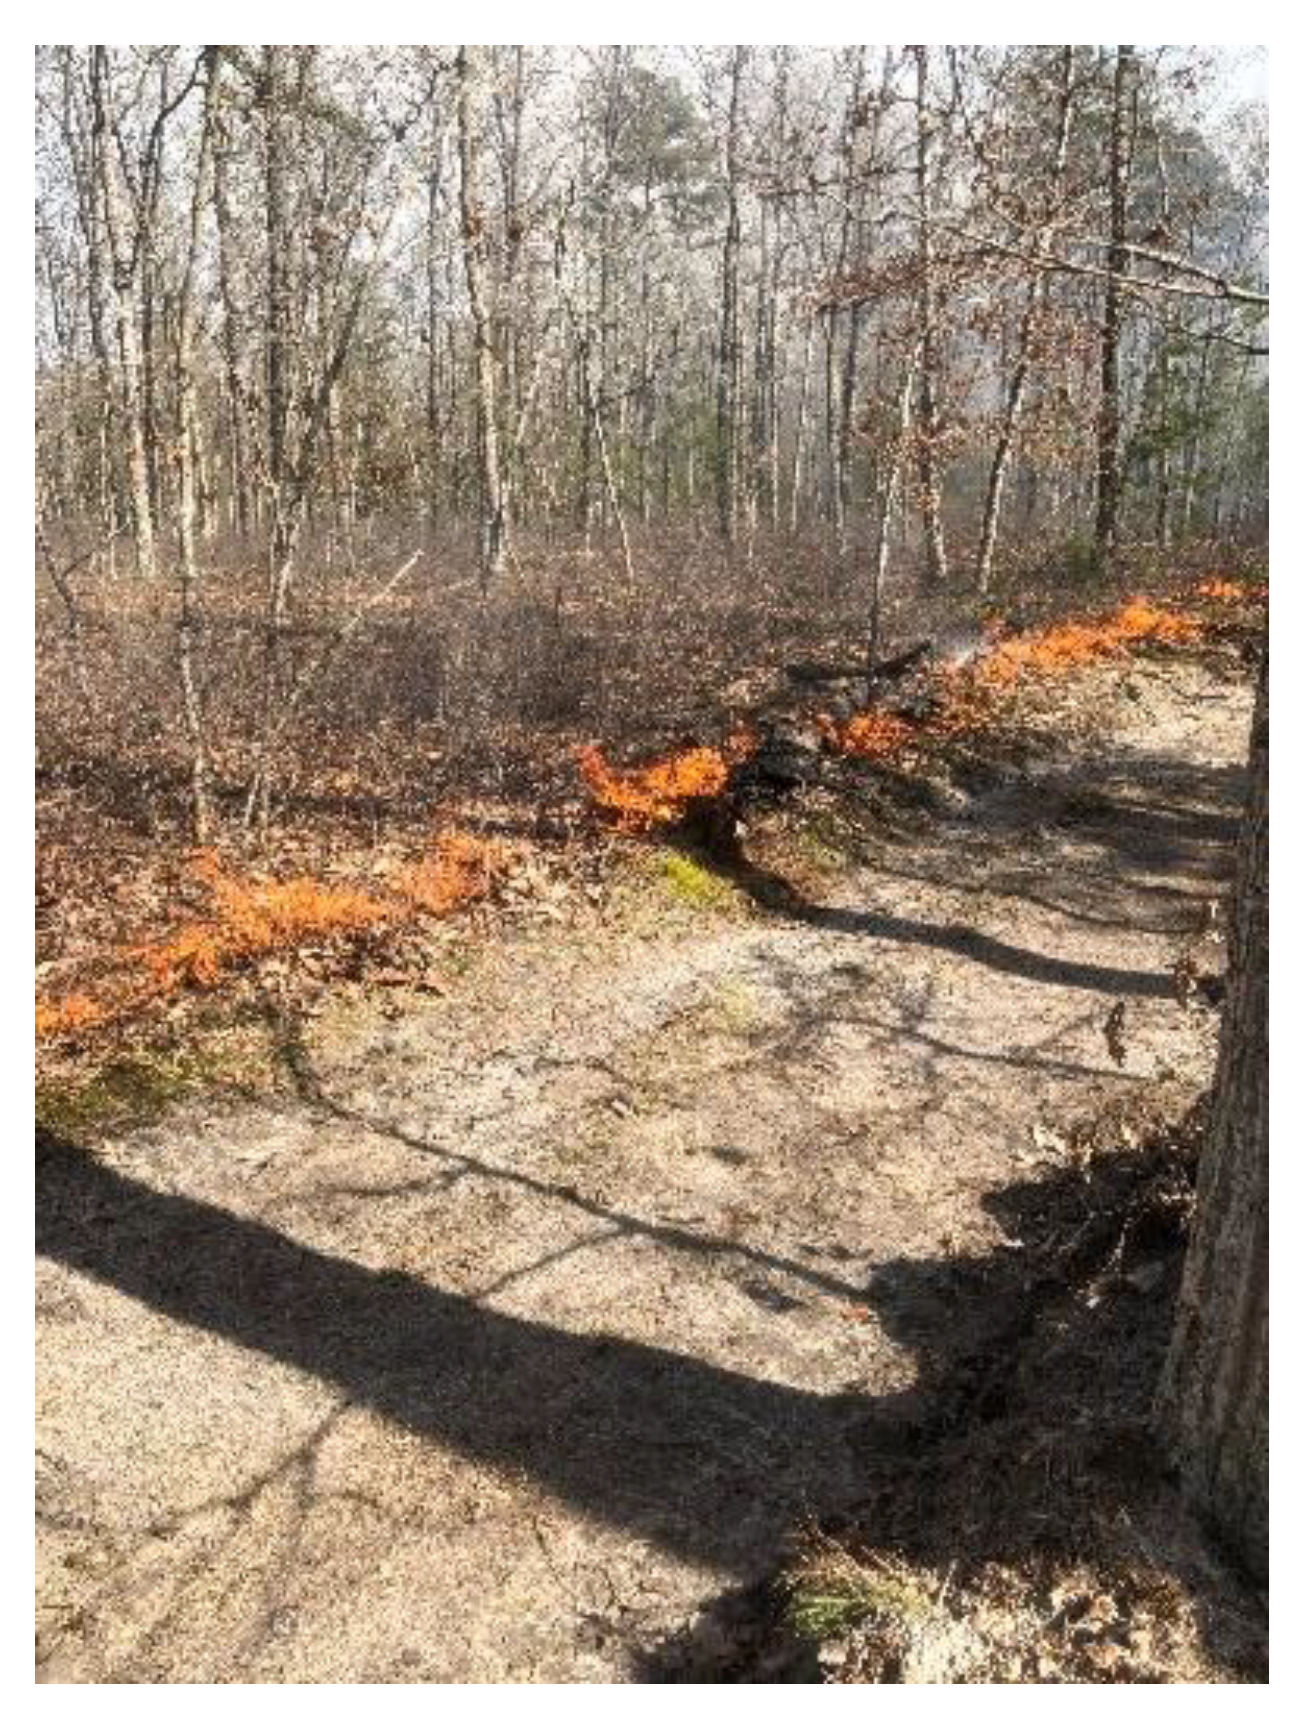
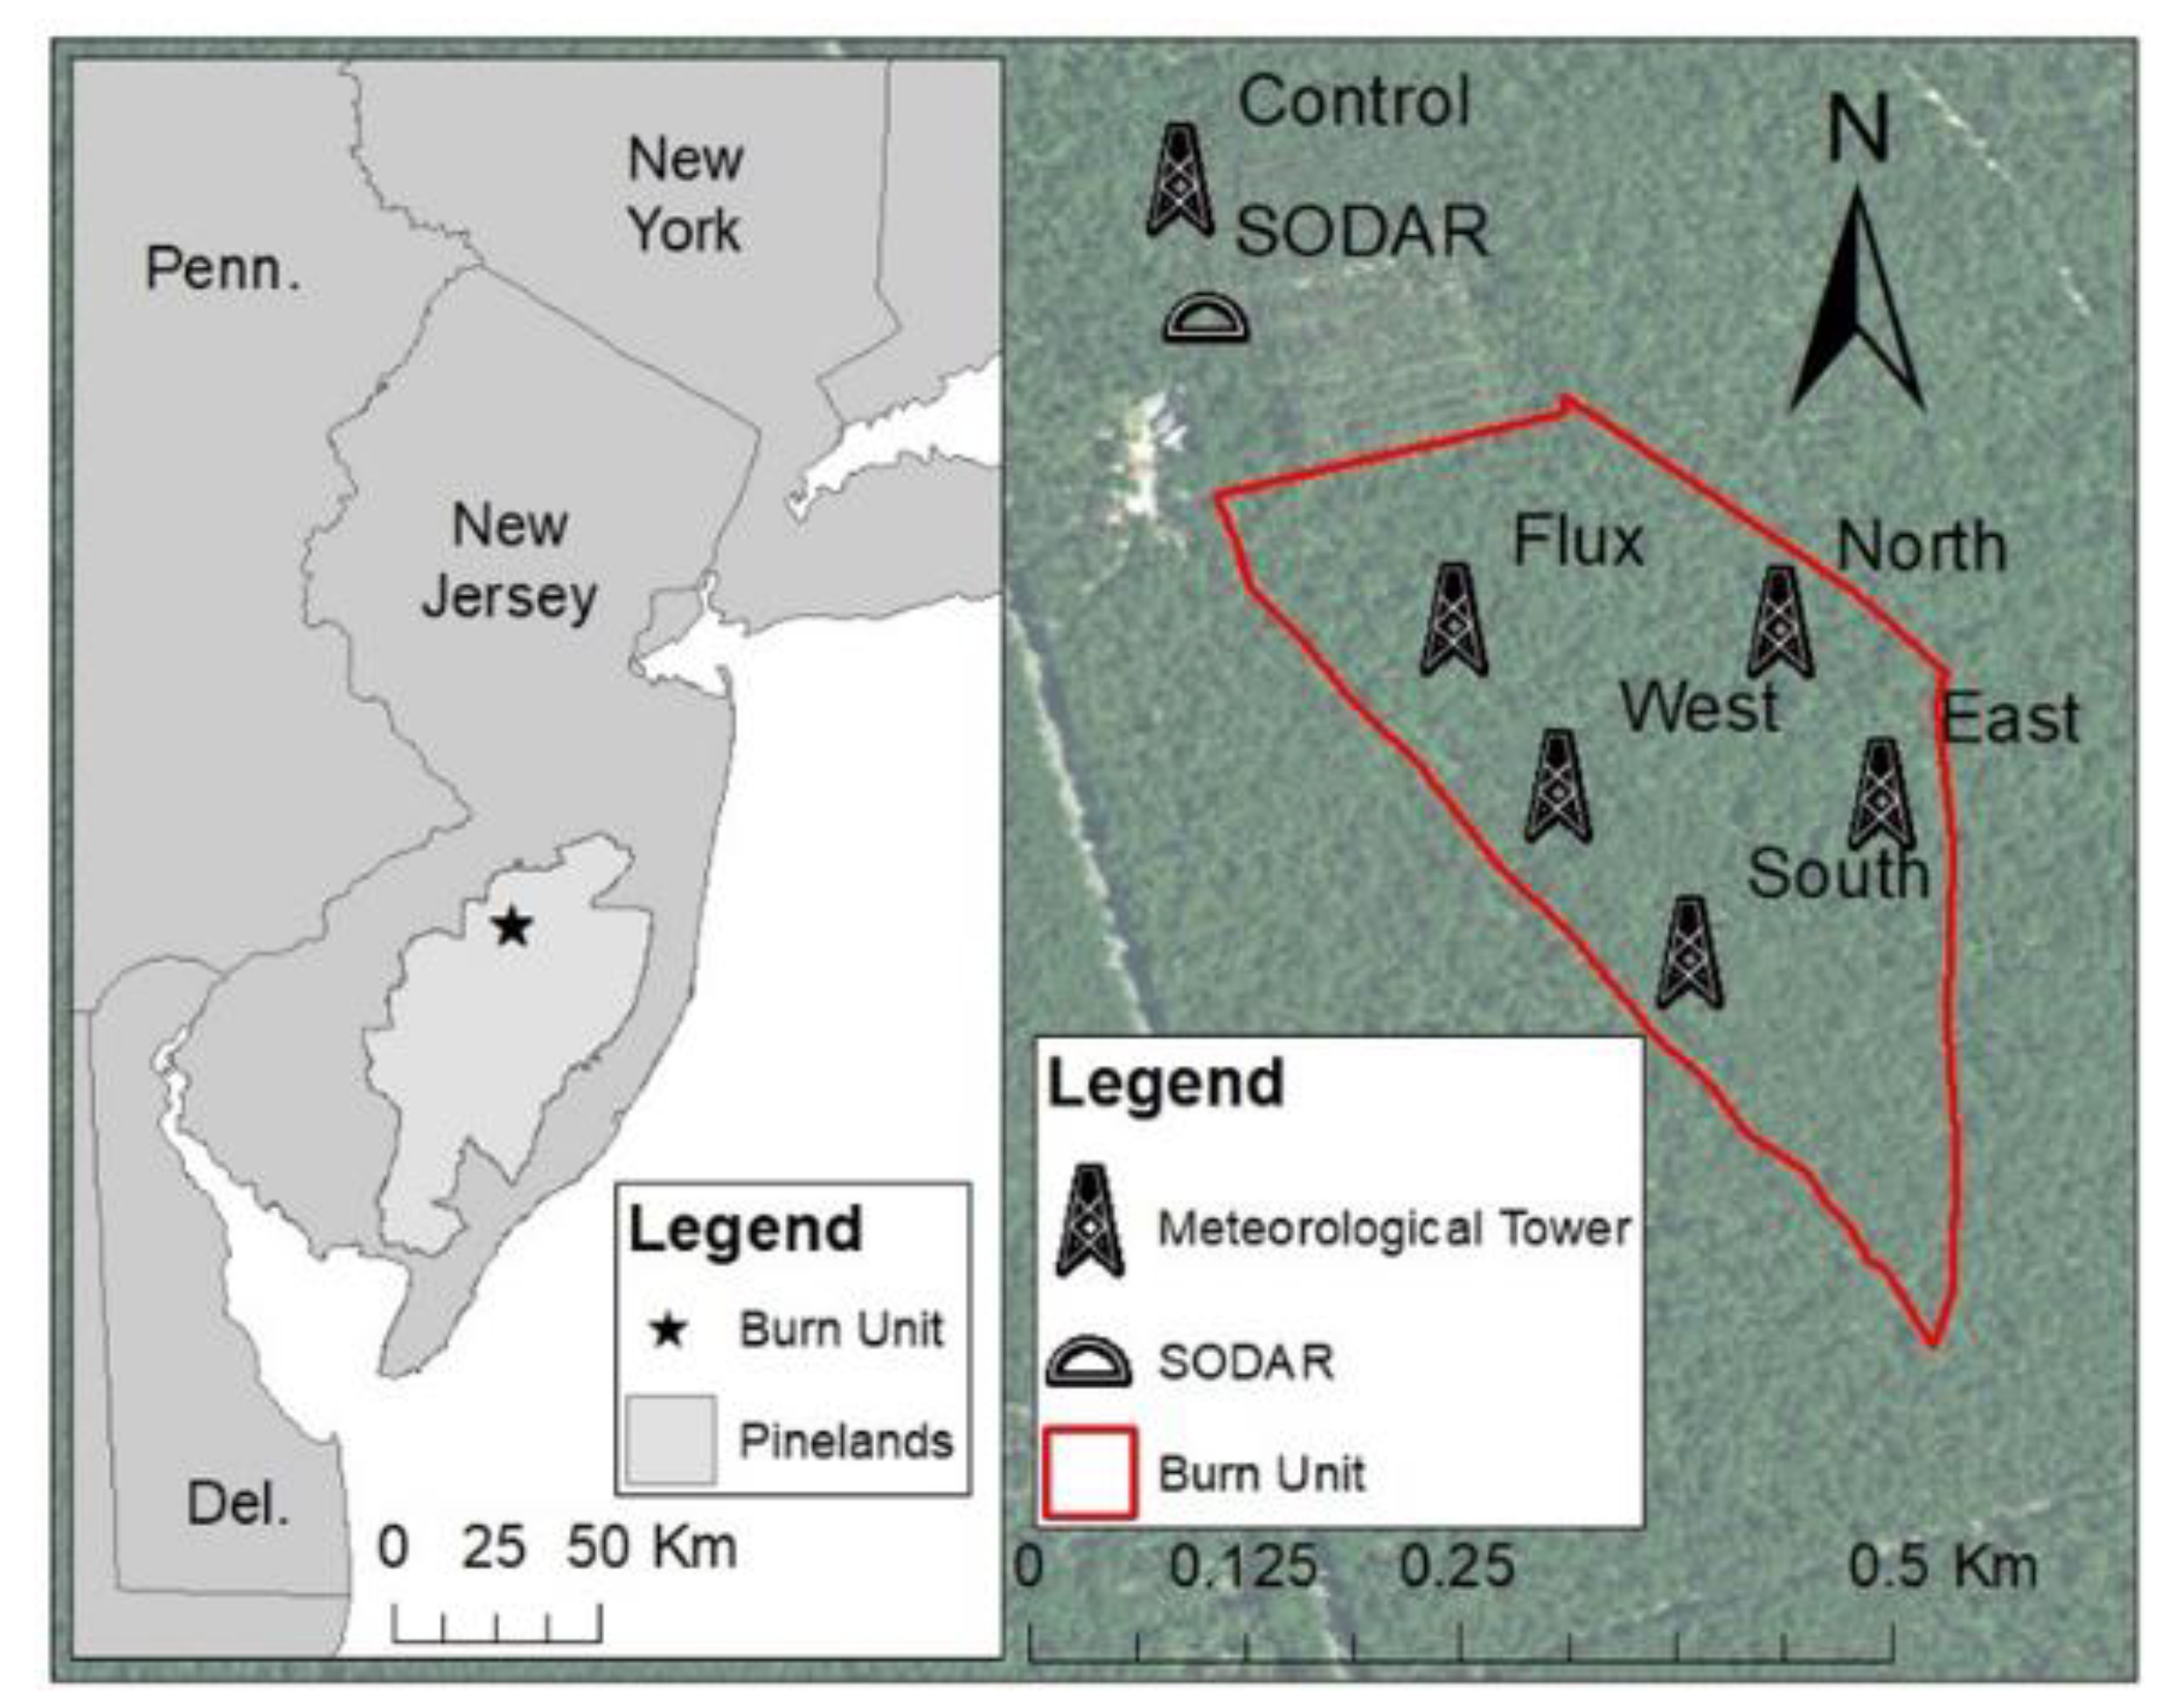
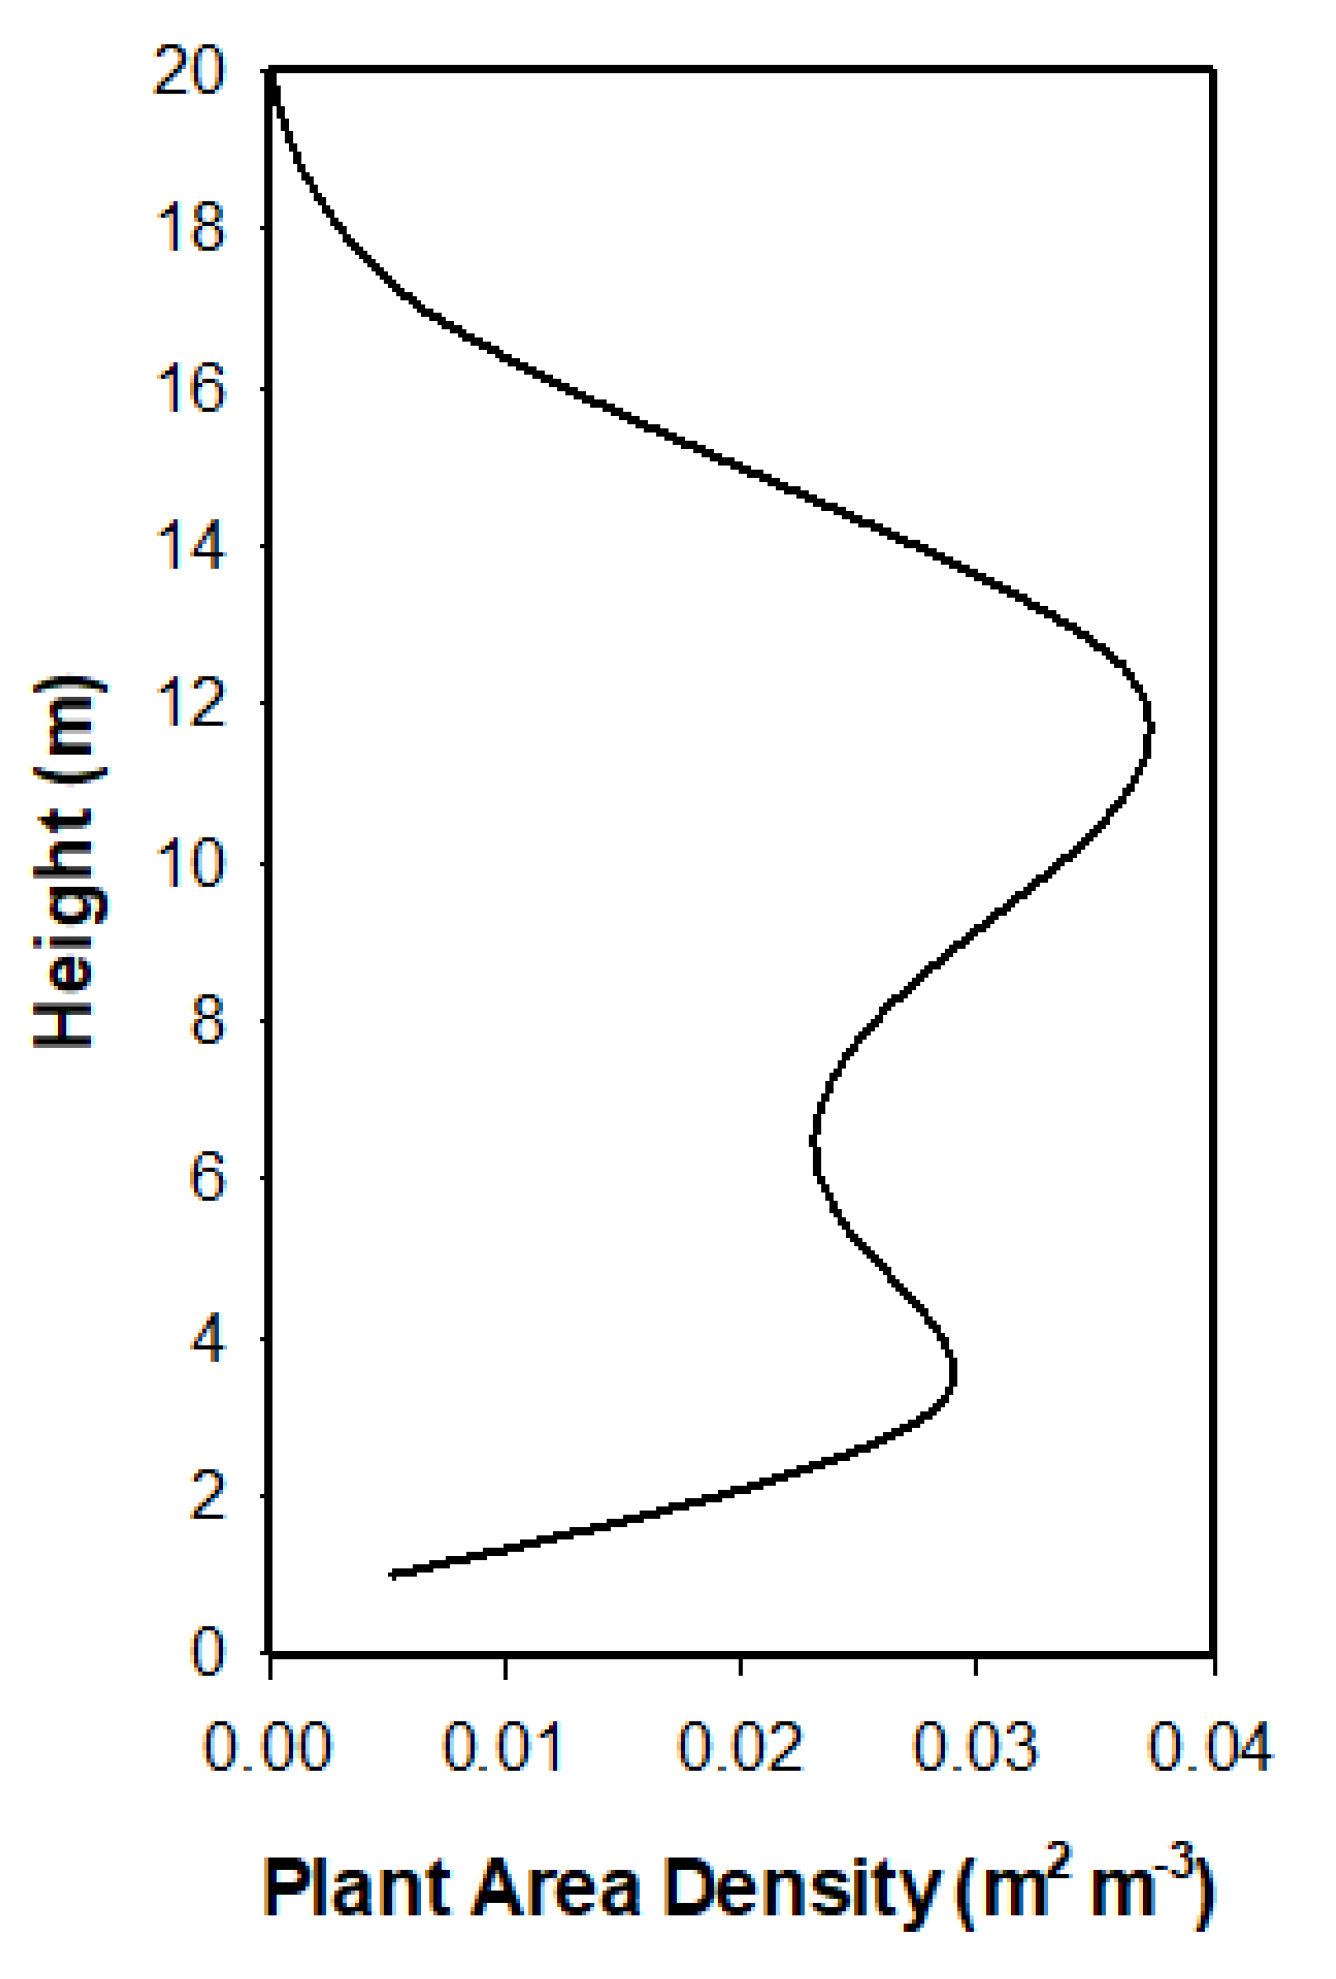
2.1. Site Description

The prescribed fire experiment for this study was carried out on 13 March 2019 on an 11.25-ha burn unit located at the Silas Little Experimental Forest (39°54′56.27″ N, 74°35′44.00″ W) within the New Jersey Pinelands National Reserve, New Lisbon, New Jersey, USA (Figure 1). The burn unit reflected dormant-season conditions of a temperate deciduous forest of the Atlantic Coastal Plain, being comprised of a mixed oak–pine stand, with chestnut (Q. prinus L.), black (Q. velutina Lam.), white (Q. alba L.), and scarlet (Q. coccinea Münchh.) oaks, and shortleaf (P. echinata Mill.) and pitch (P. rigida Mill.) pines in the canopy. Dominant trees in the burn unit were approximately 105 years old, and the maximum height of the overstory vegetation was ~19 m. Total basal area was approximately 15.5 m2 ha−1, with oak trees and saplings and pine trees and saplings accounting for 62% and 38% of the total, respectively [33]. The average plant-area-density profile of the overstory vegetation within the burn unit, as derived from aerial Lidar measurements of vegetation structure [34], was characterized by relative maxima at approximately 12 m (0.037 m2 m−3) and 3.5 m (0.029 m2 m−3) above ground level (AGL) (Figure 2). Understory vegetation consisted of shrubs, primarily huckleberry (Gaylussacia spp.) and blueberry (Vaccinium spp.). Bear (Q. ilicifolia Wangenh.) and blackjack (Q. marilandica Münchh.) oak, sedges (Carex Pensylvanica Lam.), and mosses were also present. The litter layer consisted of a mixed fine litter of oaks, pines and understory vegetation, fine stems, and reproductive material, primarily pinecones. The pre-burn mean surface fuel loading (determined from 0.5-m2 fuel sampling plots within the burn plot), which included understory stems, sedges, fine litter, 1-h and 10-h wood, and reproductive material was 1.347 ± 0.338 kg m−2. Pre-ignition mean fuel moisture content for the understory stems, 1-h fine fuel, 1-h plus 10-h wood, and 10-h fuel moisture sticks was 53.0 ± 8.0%, 25.6 ± 6.8%, 21.5 ± 9.0%, and 12.1 ± 1.5%, respectively.

2.2. Atmospheric and Fire Spread Monitoring Network

Within the 11.25-ha burn unit, a network of five 20-m meteorological towers was set up to monitor atmospheric conditions before the prescribed fire ignition, during the spread of the fire through the burn unit, and after the active burning period (Figure 1). On each tower, sonic anemometers were mounted at the 3-, 10-, and 19-m levels and aligned in the true-north direction to measure the high-frequency (10 Hz) variations in the three-dimensional wind velocity components ( U : zonal component, V : meridional component, W : vertical component) and temperature ( T ). Data were recorded using dataloggers. A control tower located in an unburned area 185 m from the northern edge of the burn unit was also instrumented with an identical sensor array as the within-burn-unit towers to measure and to characterize the ambient wind velocities and temperatures during the experiment. The sonic anemometer wind velocity and temperature measurements on all towers were augmented with additional temperature measurements via thermocouples mounted at the 0.25-m, 0.5-m, 1.0-m, 2.5-m, 5.0-m, 10.0-m, and 15.0-m levels on each tower. All thermocouples were logged at 10 Hz using dataloggers. A DOPPLER SOnic Detection and Ranging (SODAR) wind profiler was set up near the control tower and within 100 m of the northern edge of the burn unit to measure lower atmospheric boundary-layer wind speeds and directions (0–400 m AGL) at 20-m intervals every five minutes for the duration of the fire experiment.
In order to spatially characterize the spread of the prescribed fire through the burn plot, an array of 68 fire-tracker sensors was installed at ground level throughout the plot in a grid with approximately 40-m spacing between sensors. The sensors consisted of 1.5-mm diameter K-type thermocouples attached to dataloggers with thermocouple amplifiers and GPS antennas to time stamp and provide the location for each sensor. All fire-tracker data were logged at a frequency of 2 Hz.

2.3. Prescribed Fire Description

At approximately 1445 LT on 13 March 2019, the New Jersey Forest Fire Service ignited the burn unit with single continuous linear ignition along the entire southwest side of the unit using a single drip torch, beginning at the unit’s southern point (Figure 3). The near-surface (3 m AGL) ambient mean wind speed, wind direction, temperature, and relative humidity in the plot during the 30-min period before ignition was 0.41 m s−1, 228° (southwesterly winds), 11.28 °C, and 24.90%, respectively. The line fire progressed without involvement of the canopy as a surface head fire (i.e., spreading with the wind) from the southwestern boundary through the burn unit and through the in situ towers in a generally northeastward direction until ~1645 LT when active burning ended. The average rate of spread of the line fire based on the fire-tracker measurements (see Section 2.2) was 1.7 m min−1.

2.4. Data Processing

The raw sonic anemometer data collected during the experiment and used for the momentum flux sweep-ejection analyses were subjected to a quality-control procedure that involved the removal of wind-velocity and temperature values that exceeded six standard deviations from the running 1-h velocity component and temperature means [22]. A double-rotation tilt-correction routine [35] was applied to the vertical wind-velocity-component data to correct the raw data for systematic errors that can stem from errors in the physical leveling of sonic anemometers during the field installation.
Using the corrected sonic anemometer temperature data at the 3-m level at each in situ tower, individual fire-front-passage (FFP) periods were subjectively determined for each tower based on when the 10 Hz temperature time series began to clearly display an increasing trend from ambient conditions and when temperatures then returned approximately to ambient conditions. The subjective analysis yielded fire-front-passage periods lasting 15 min at the flux and east towers and 20 min at the south, west, and north towers. The 30-min-long periods before (pre-FFP) and after (post-FFP) the FFP periods were then delineated at each tower based on the defined FFP periods. The exact time periods for the defined pre-FFP, FFP, and post-FFP periods at each tower are shown in Table 1.
Following the tilt-correction, data despiking, and fire-period delineation procedures, horizontal streamwise velocities (S) at each 0.1 s were computed as follows:
S = ( U 2 + V 2 ) 0.5
Mean horizontal streamwise velocities ( S ¯ ); mean zonal ( U ¯ ), meridional ( V ¯ ), and vertical ( W ¯ ) velocities; and mean temperatures ( T ¯ ) for the 30-min-long pre-FFP and post-FFP periods were then computed at each measurement level on each tower and used as the basis for calculating perturbation horizontal streamwise velocities ( s ); perturbation zonal ( u ), meridional ( v ), and vertical ( w ) velocities; and perturbation temperatures ( t ) at each 0.1 s within the different periods:
s = S S ¯
u = U U ¯
v = V V ¯
w = W W ¯
t = T T ¯
Note that perturbation velocities and temperatures computed during the defined FFP periods at each tower were computed using the pre-FFP mean velocities and temperatures to allow for a better representation of the turbulence generated by the fire, a procedure consistent with the methodology of [5,22].

2.5. Sweep-Ejection Dynamics Analysis

The momentum-flux sweep-ejection analysis for this study was carried out using the quadrant analysis approach, as summarized by [36]. Tower- and height-specific kinematic vertical turbulent fluxes of horizontal momentum ( s w ) at each 0.1 s were computed from the perturbation velocities calculated in Equations (2) and (5), and then classified as sweep, ejection, outward interaction, or inward interaction events as follows:
Sweep :   s > 0 ,   w < 0 ;   s w < 0 Ejection : s < 0 ,   w > 0 ;   s w < 0 Outward   Interaction :   s > 0 ,   w > 0 ;   s w > 0 Inward   Interaction : s < 0 ,   w < 0 ;   s w > 0 .
Sweeps (downward flux of high horizontal momentum air from above) and ejections (upward flux of low horizontal momentum air from below) contribute to negative momentum fluxes; outward interactions (upward flux of high horizontal momentum air from below) and inward interactions (downward flux of low horizontal momentum air from above) contribute to positive momentum fluxes. The frequency of occurrence of each type of event and the contribution of each type of event to the overall momentum fluxes within the defined pre-FFP, FFP, and post-FFP periods were determined. Frequencies and contributions were assessed at each in situ tower location and monitoring level (3, 10, and 19 m AGL). The periodicity characteristics of the four types of events during the different periods were also examined using the Lomb-Scargle periodogram spectral analysis technique appropriate for unevenly spaced time series data [37], which was the case for this study where limited and sporadic missing data values characterized some of the sonic anemometer measurements during FFP periods.

3. Results

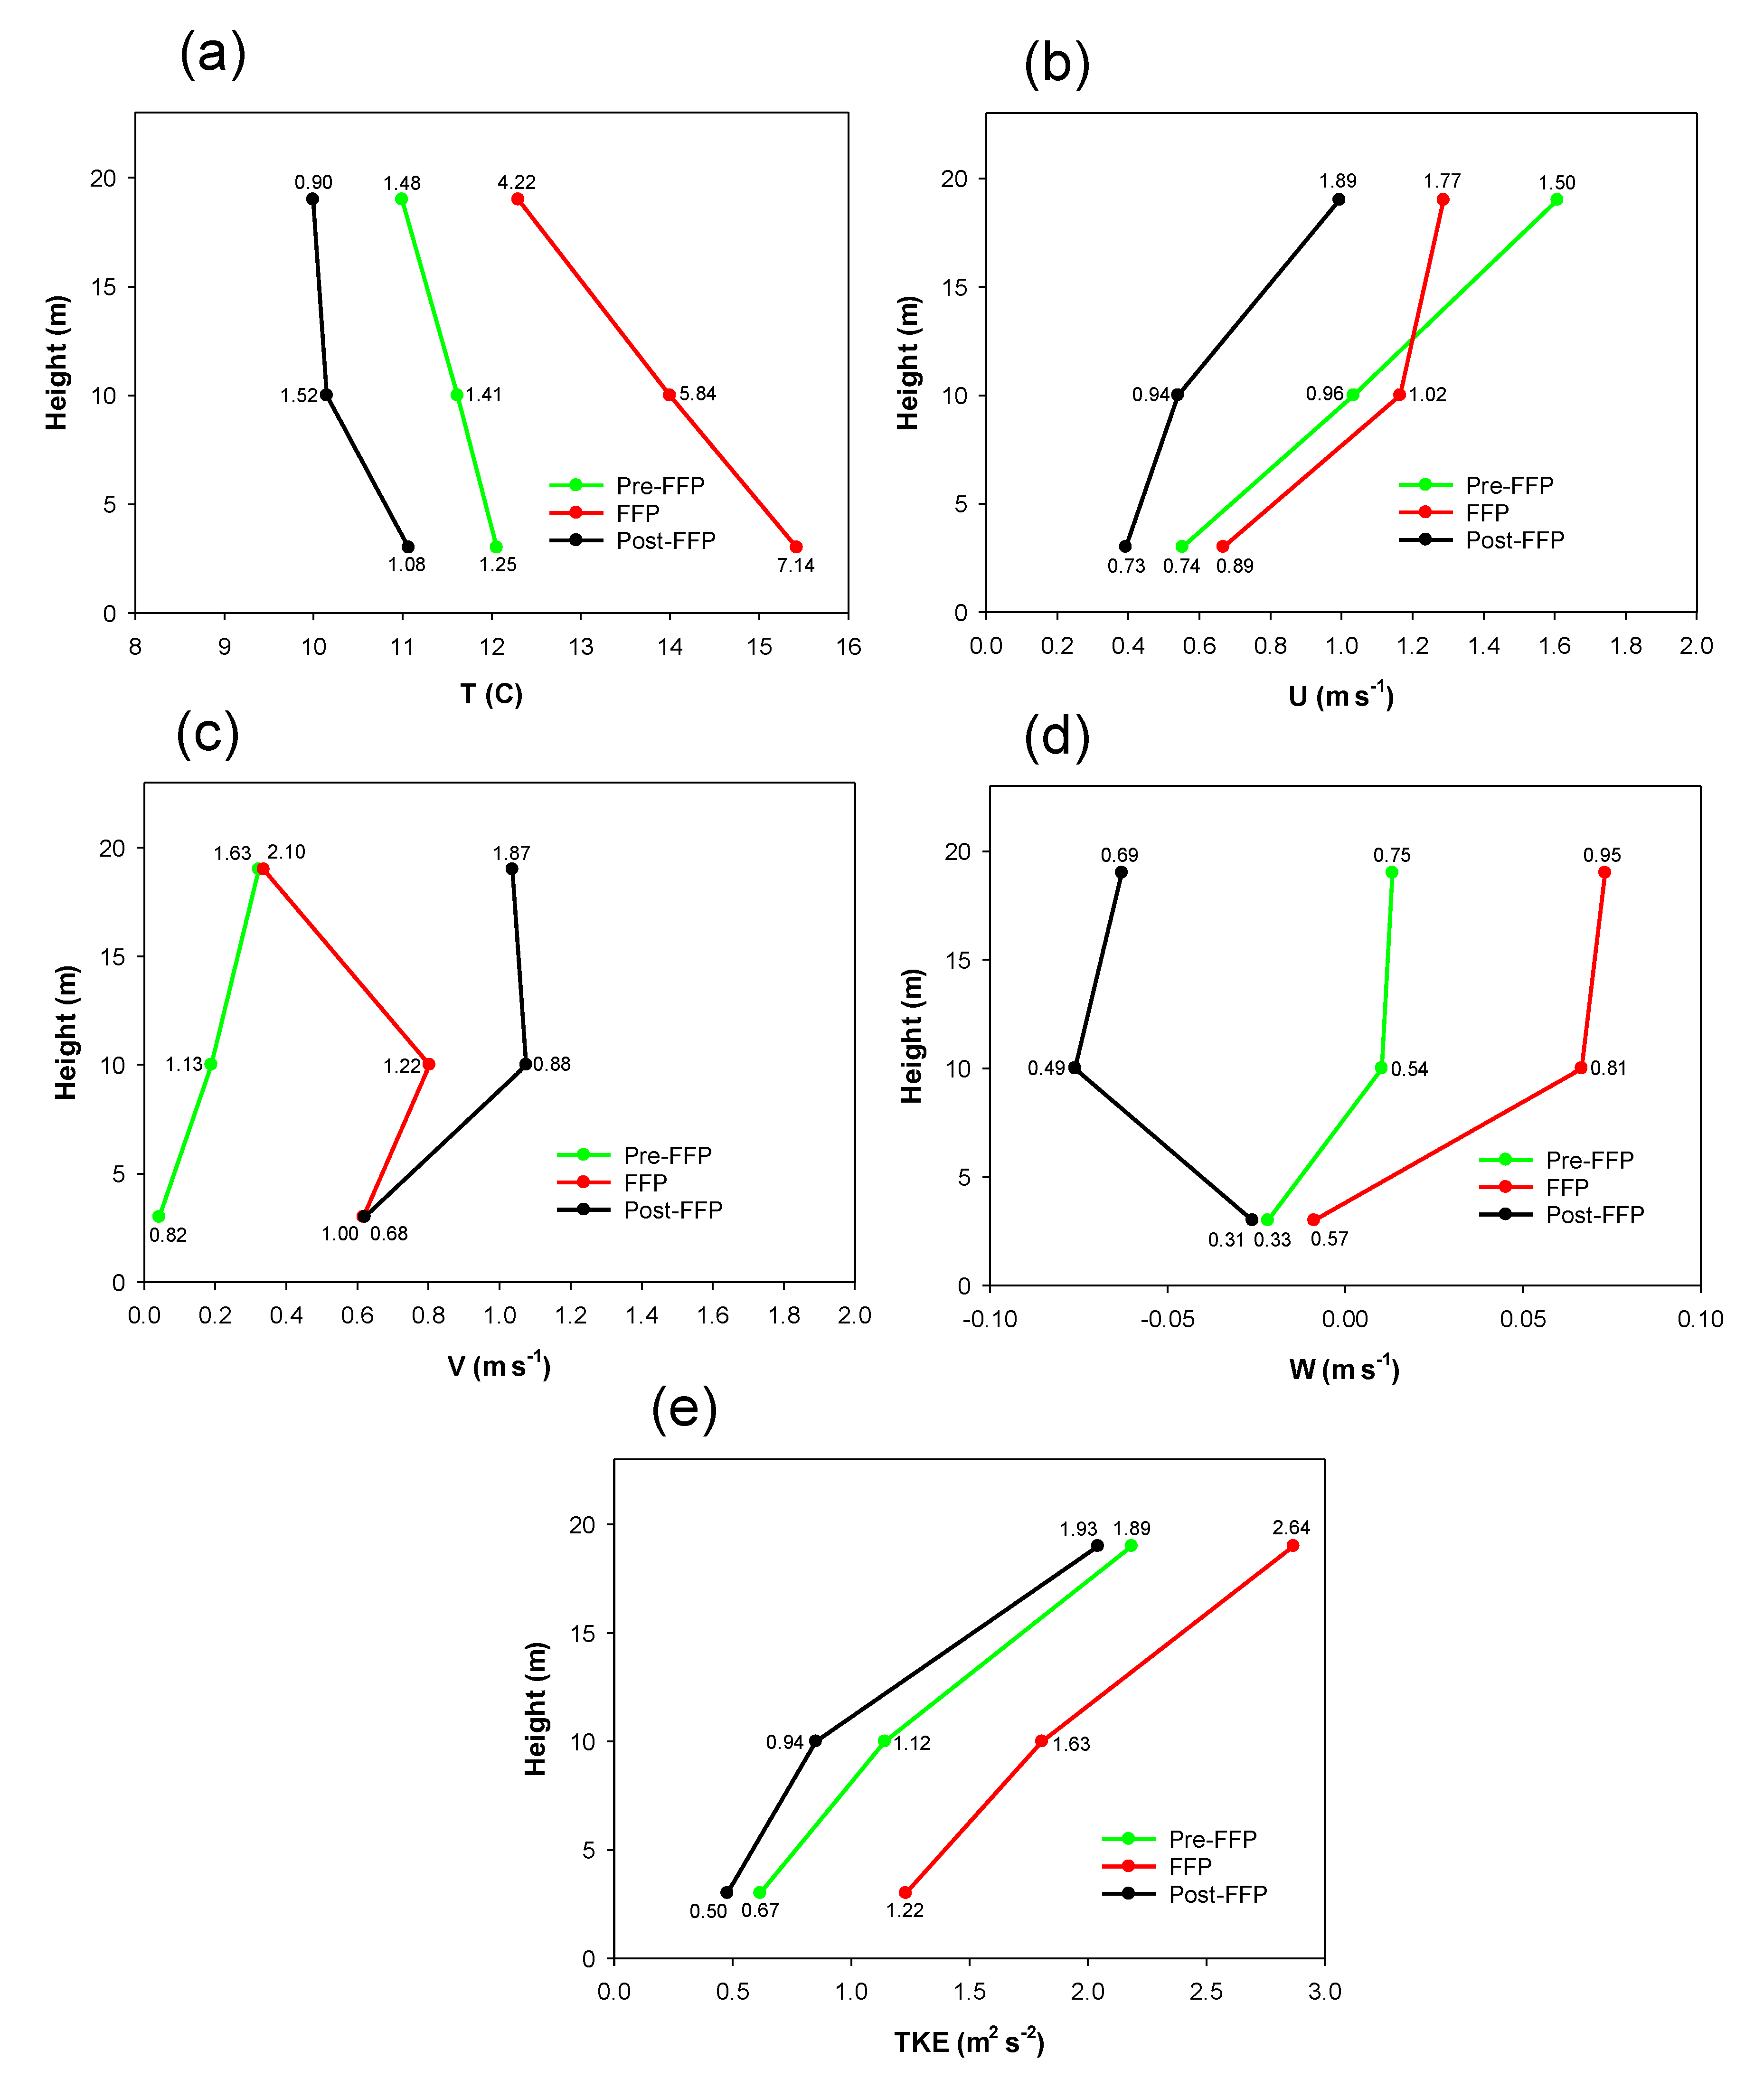
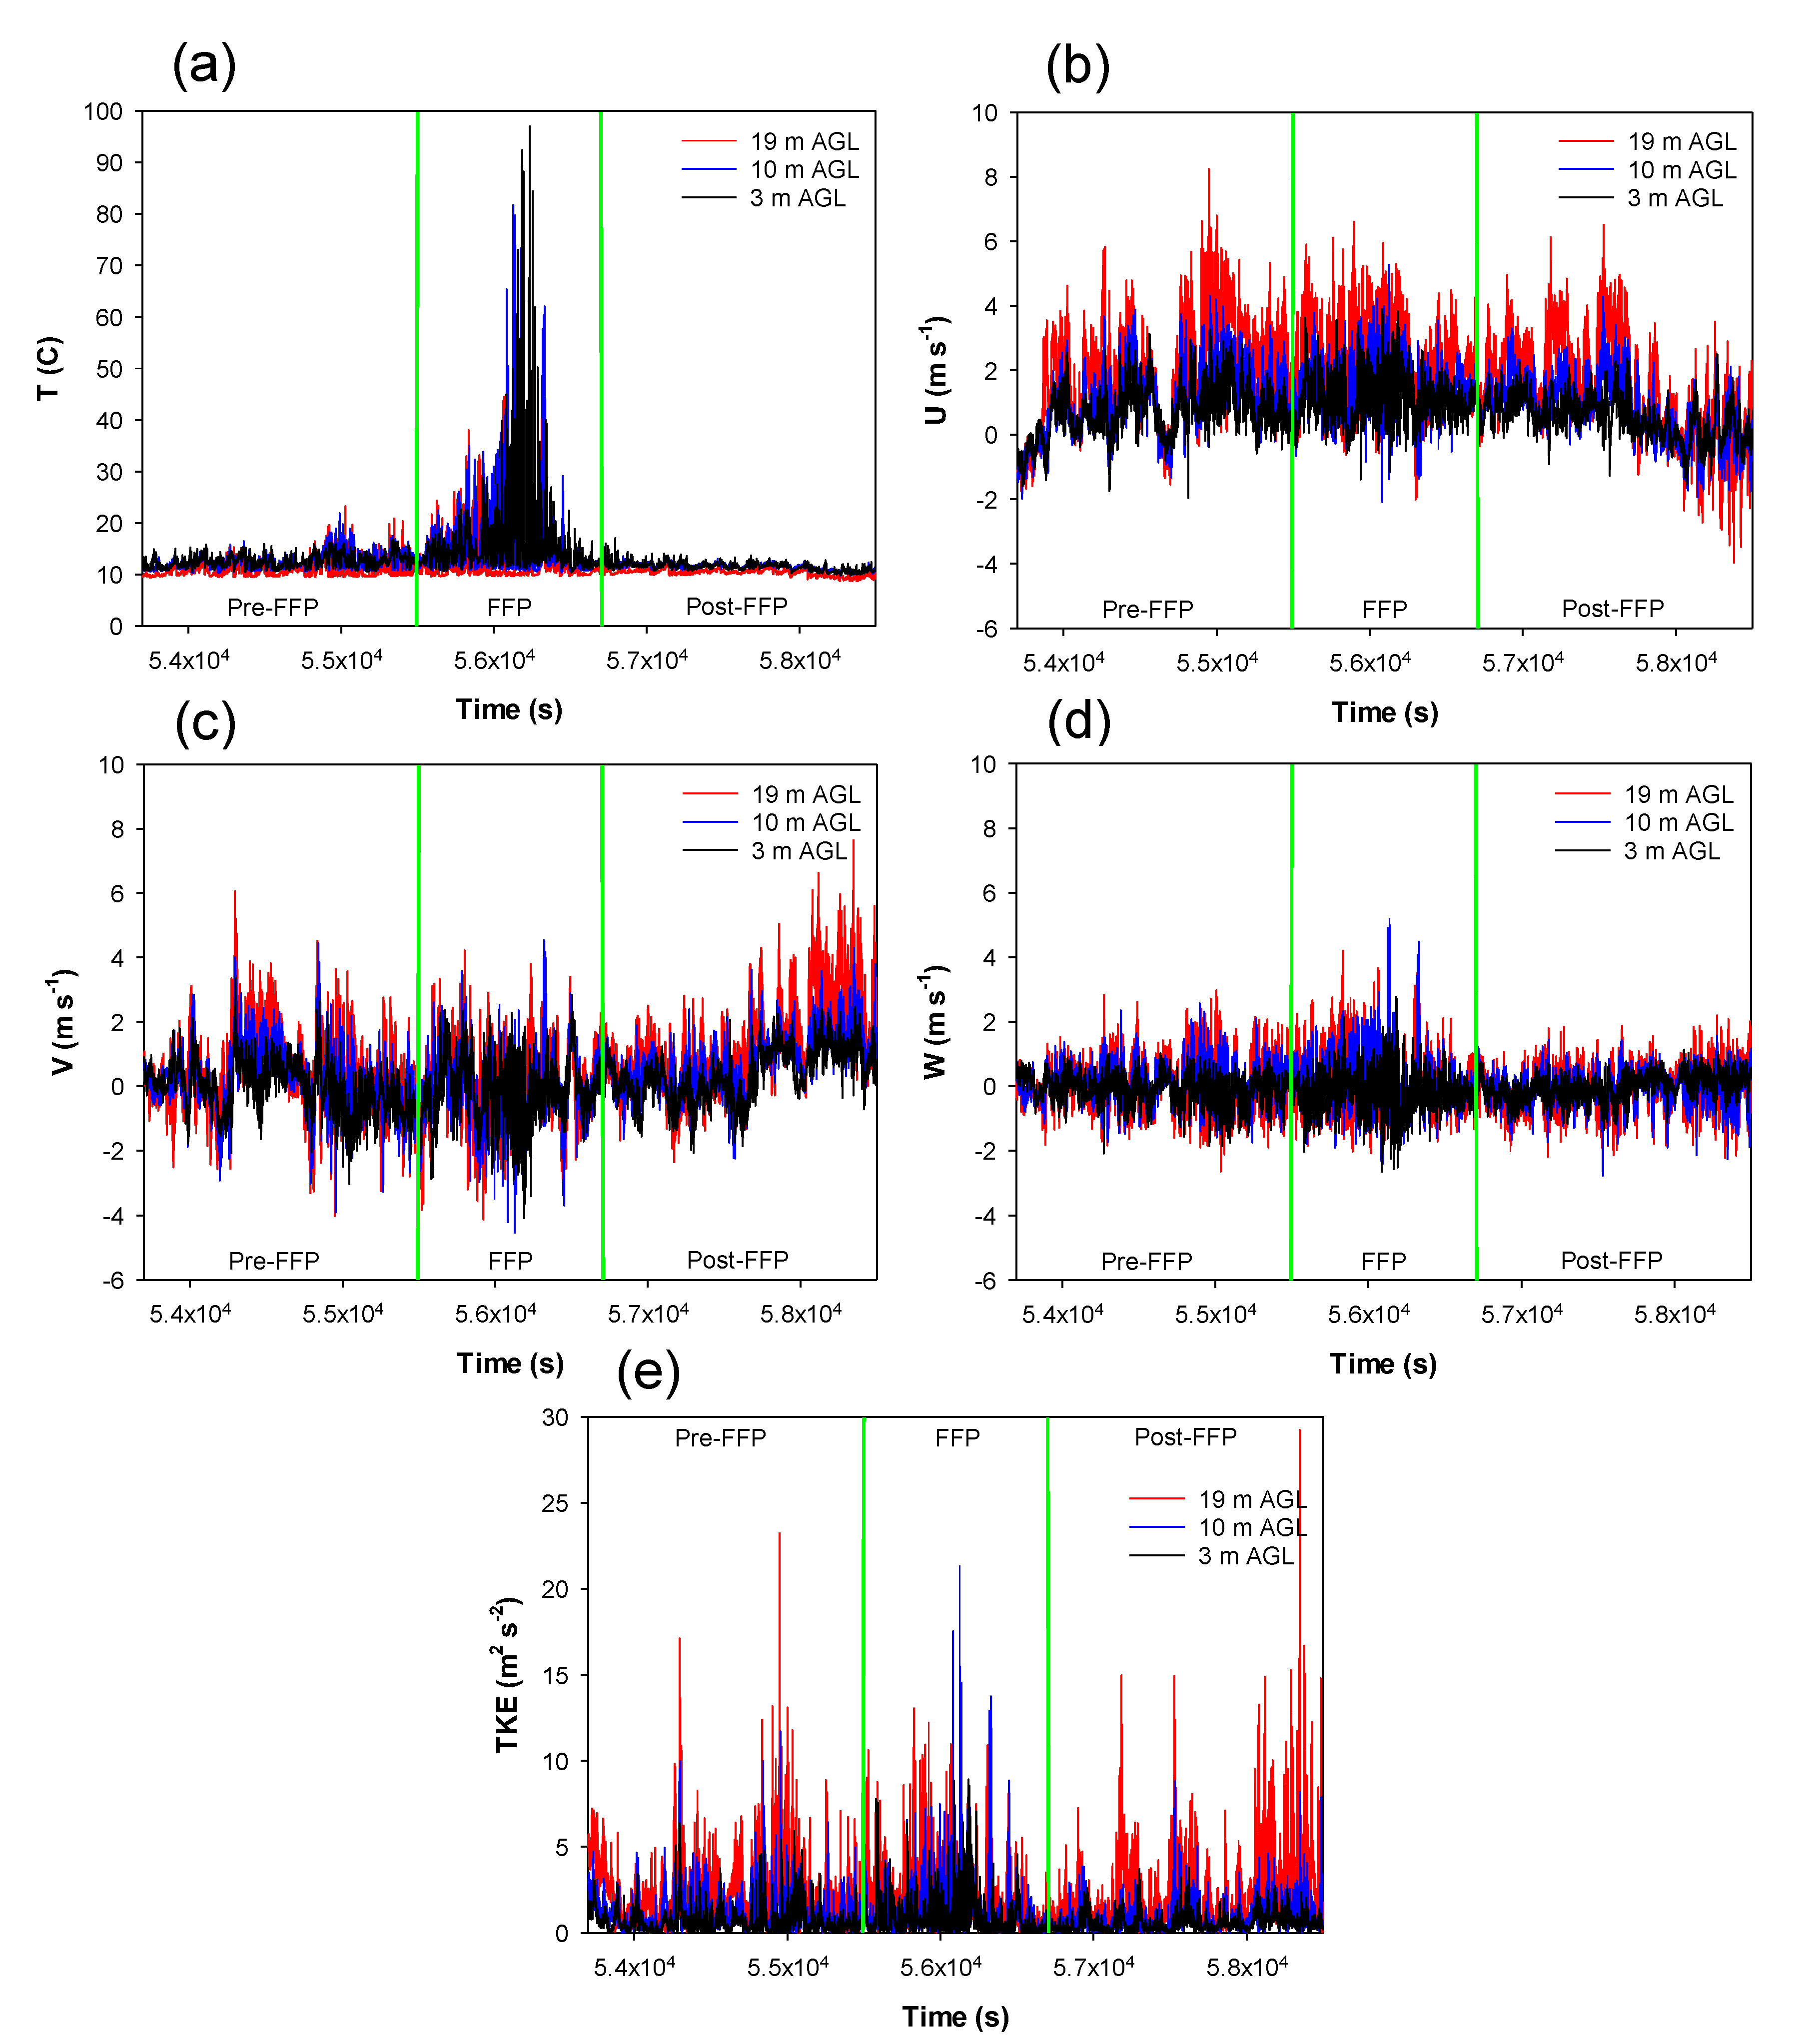
3.1. Ambient and Fire-Induced Meteorology

The northeastward spreading head fire induced temperature, wind velocity, and turbulence variations near the fire front that extended from the surface upward through the top of the forest overstory vegetation, as evident in profile data of conditions from the five in situ towers. Example time series of the 10-Hz temperature; zonal, meridional, and vertical velocity components; and turbulent kinetic energy ( T K E = 0.5 ( u 2 + v 2 + w 2 ) ) at the 3-, 10-, and 19-m levels on the west tower are shown in Figure 4; these are representative of the general impact the advancing line fire had on atmospheric conditions at all the tower locations. During much of the 30-min pre-FFP period at the west tower (1455–1524 LT), instantaneous temperatures ranged from ~10–15 °C, generally decreasing with height from the 3-m to the 19-m level (Figure 4a). About 15 min before the beginning of the FFP period, some instantaneous temperatures at the 10- and 19-m levels reached ~20 °C due to the downwind transport of the convective plume generated by the upwind fire front. During the 20-min FFP period, instantaneous temperatures above 90 °C were observed at the 3-m level. Temperatures generally returned to pre-FFP values during the 30-min post-FFP period, although the variability in the post-FFP temperatures was noticeably less than the pre-FFP variability due in part to reduced solar radiation and surface sensible heat flux later in the day. For example, at 3 m AGL, the temperature standard deviation decreased from 1.17 °C during the pre-FFP period to 0.76 °C during the post-FFP period. The zonal (Figure 4b) and meridional (Figure 4c) velocity component time series indicate northwesterly to southwesterly wind-direction fluctuations over most of the pre-FFP to post-FFP period, with wind speeds increasing with height through the overstory vegetation and most of the horizontal velocity response to the line fire during the FFP period occurring at the 3-m and 10-m levels. The FFP period was characterized by enhanced updrafts leading up to and during the time when the fire front passed through the west tower location, and enhanced downdrafts for a short period of time after the front passed the tower (Figure 4d). Finally, although the average energy of the turbulent circulations ( T K E ) during the FFP period was higher near the canopy top (19 m AGL) than at the levels below, episodes of very high T K E values at the 10-m mid-canopy level were prominent; a maximum T K E value exceeding 20 m2 s−2 occurred there (Figure 4e). Additionally noteworthy is the more quiescent turbulence regime at the 3- and 10-m levels during the post-FFP period compared to the pre-FFP period; T K E standard deviations at the 3-m and 10-m levels decreased from 0.66 m2 s−2 and 1.00 m2 s−2 to 0.47 m2 s−2 and 0.78 m2 s−2, respectively.
The overall temperature, wind velocity, and turbulence characteristics observed at the west tower during the three periods were also exhibited at the remaining four in situ tower locations. Mean pre-FFP, FFP, and post-FFP temperatures, wind velocity components, and T K E values (and standard deviations) at the three monitoring levels computed from all the in situ towers are shown in Figure 5. Features of the period means include (1) the tendency for post-FFP temperatures to fall below pre-FFP temperatures (Figure 5a) due in part to downdrafts behind the fire front (Figure 5d), slight cooling associated with the diurnal cycle, and the passage of a westward moving sea-breeze front from the Atlantic coast through the burn unit location between 1530 LT and 1600 LT; (2) a general shift toward more southerly winds in moving from the pre-FFP periods through the FFP periods and into the post-FFP periods, particularly at the 3- and 10-m levels (Figure 5b,c); (3) the tendency for T K E values to increase with height, even during FFP periods when atmospheric temperature perturbations are at a maximum near the surface (Figure 5e); and (4) the substantial weakening of the turbulence regime in moving from the FFP environment to the post-FFP environment, with post-FFP mean T K E values dropping below pre-FFP means at all monitoring levels (Figure 5e). Temporal variability (as quantified by the standard deviation values shown in Figure 5) for the velocity components and T K E increased with height during all three periods whereas temperature variability was at a maximum at the 3-m and 10-m levels during the FFP and post-FFP periods, respectively.
Additional turbulence statistics are shown in Table 2 and provide a general summary (averages across all the in situ towers) of the height-dependent impacts of the spreading surface line fire on the temporal means of the T K E components ( u 2 ¯ , v 2 ¯ , w 2 ¯ ), turbulence anisotropy ( w 2 ( 2 T K E ) 1 ¯ ), the kinematic horizontal and vertical momentum fluxes ( u v ¯ , u w ¯ , v w ¯ ), and the kinematic horizontal and vertical heat fluxes ( u t ¯ , v t ¯ , w t ¯ ) during the pre-FFP, FFP, and post-FFP periods. The T K E component and anisotropy statistics clearly show that most of the energy of the turbulent circulations at all height levels during the fire experiment was associated with the horizontal velocity perturbations as opposed to the vertical velocity perturbations, even during the highly buoyant FFP periods; average anisotropy values were always less than the 0.33 isotropic value. Averaged anisotropy was always most pronounced at the 3-m level. The kinematic momentum-flux magnitudes almost always increased with height within the overstory vegetation layer. It is noteworthy that during the FFP and post-FFP periods, horizontal momentum-flux ( u v ¯ ) magnitudes tended to exceed the vertical momentum-flux ( u w ¯ , v w ¯ ) magnitudes at all height levels. The observed horizontal ( u t ¯ , v t ¯ ) and vertical ( w t ¯ ) kinematic heat-flux magnitudes did not always increase with height. At the 3-m level during FFP periods and at the 3- and 10-m levels during the post-FFP periods, horizontal heat-flux magnitudes tended to exceed vertical heat-flux magnitudes.
Included also in Table 2 are the height-dependent, tower-averaged, horizontal, and vertical velocity distribution skewness values ( S k u = u 3 ¯ σ u 3 , S k v = v 3 ¯ σ v 3 , S k w = w 3 ¯ σ w 3 ; where σ u , σ v , and σ w are the standard deviations of the U , V , and W velocities, respectively) for the three periods. The skewness values underscore the impacts a wildland fire in a forested environment can have on inducing non-Gaussian turbulence regimes. During the pre-FFP periods, S k u and S k v values at all height levels tended to be positive, with tower-averaged values ranging from 0.10 to 0.42. S k w values tended to be negative within the forest overstory vegetation at the 3- and 10-m levels and slightly positive near the canopy top at 19 m AGL. Tower-averaged S k w values were −0.46, −0.16, and 0.08 at the 3-, 10- and 19-m levels, respectively. The highly buoyant FFP periods were characterized by positively skewed horizontal and vertical velocity distributions at all height levels. During the post-FFP periods, vertical velocity distributions tended to be even more negatively skewed than during the pre-FFP periods, as indicated by the tower-averaged S k w value of −0.76 at the mid-canopy 10-m level.

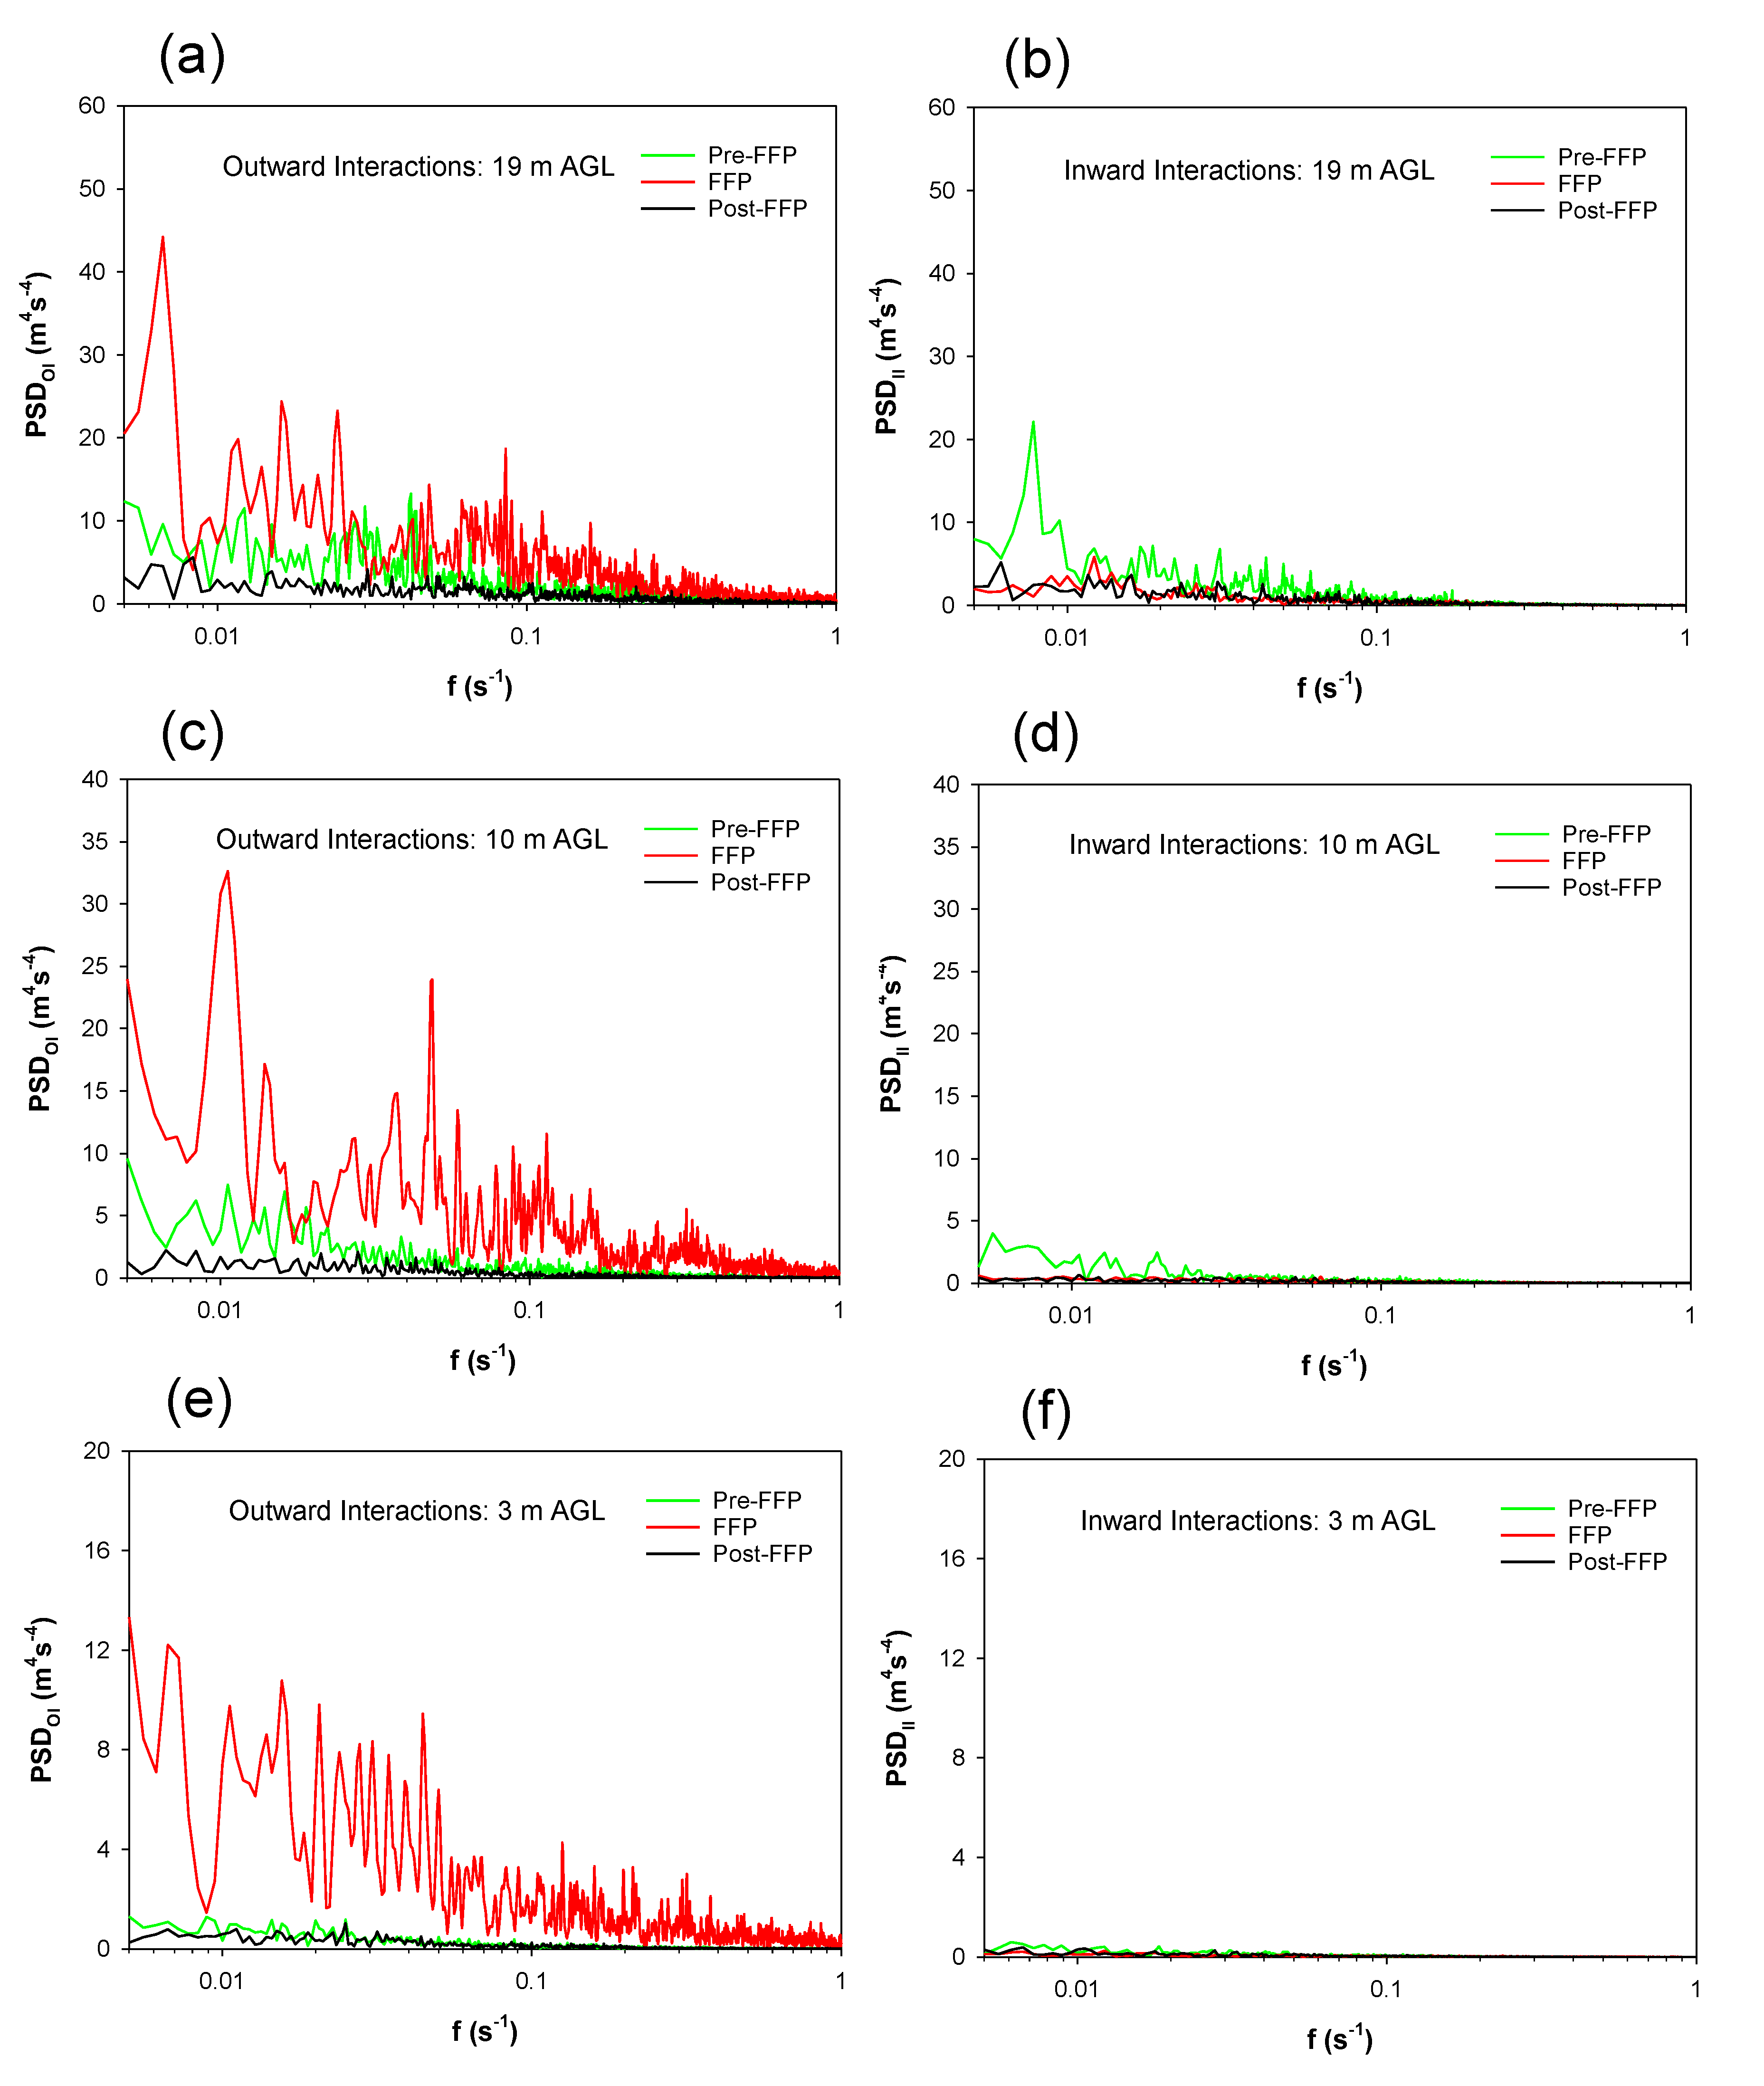
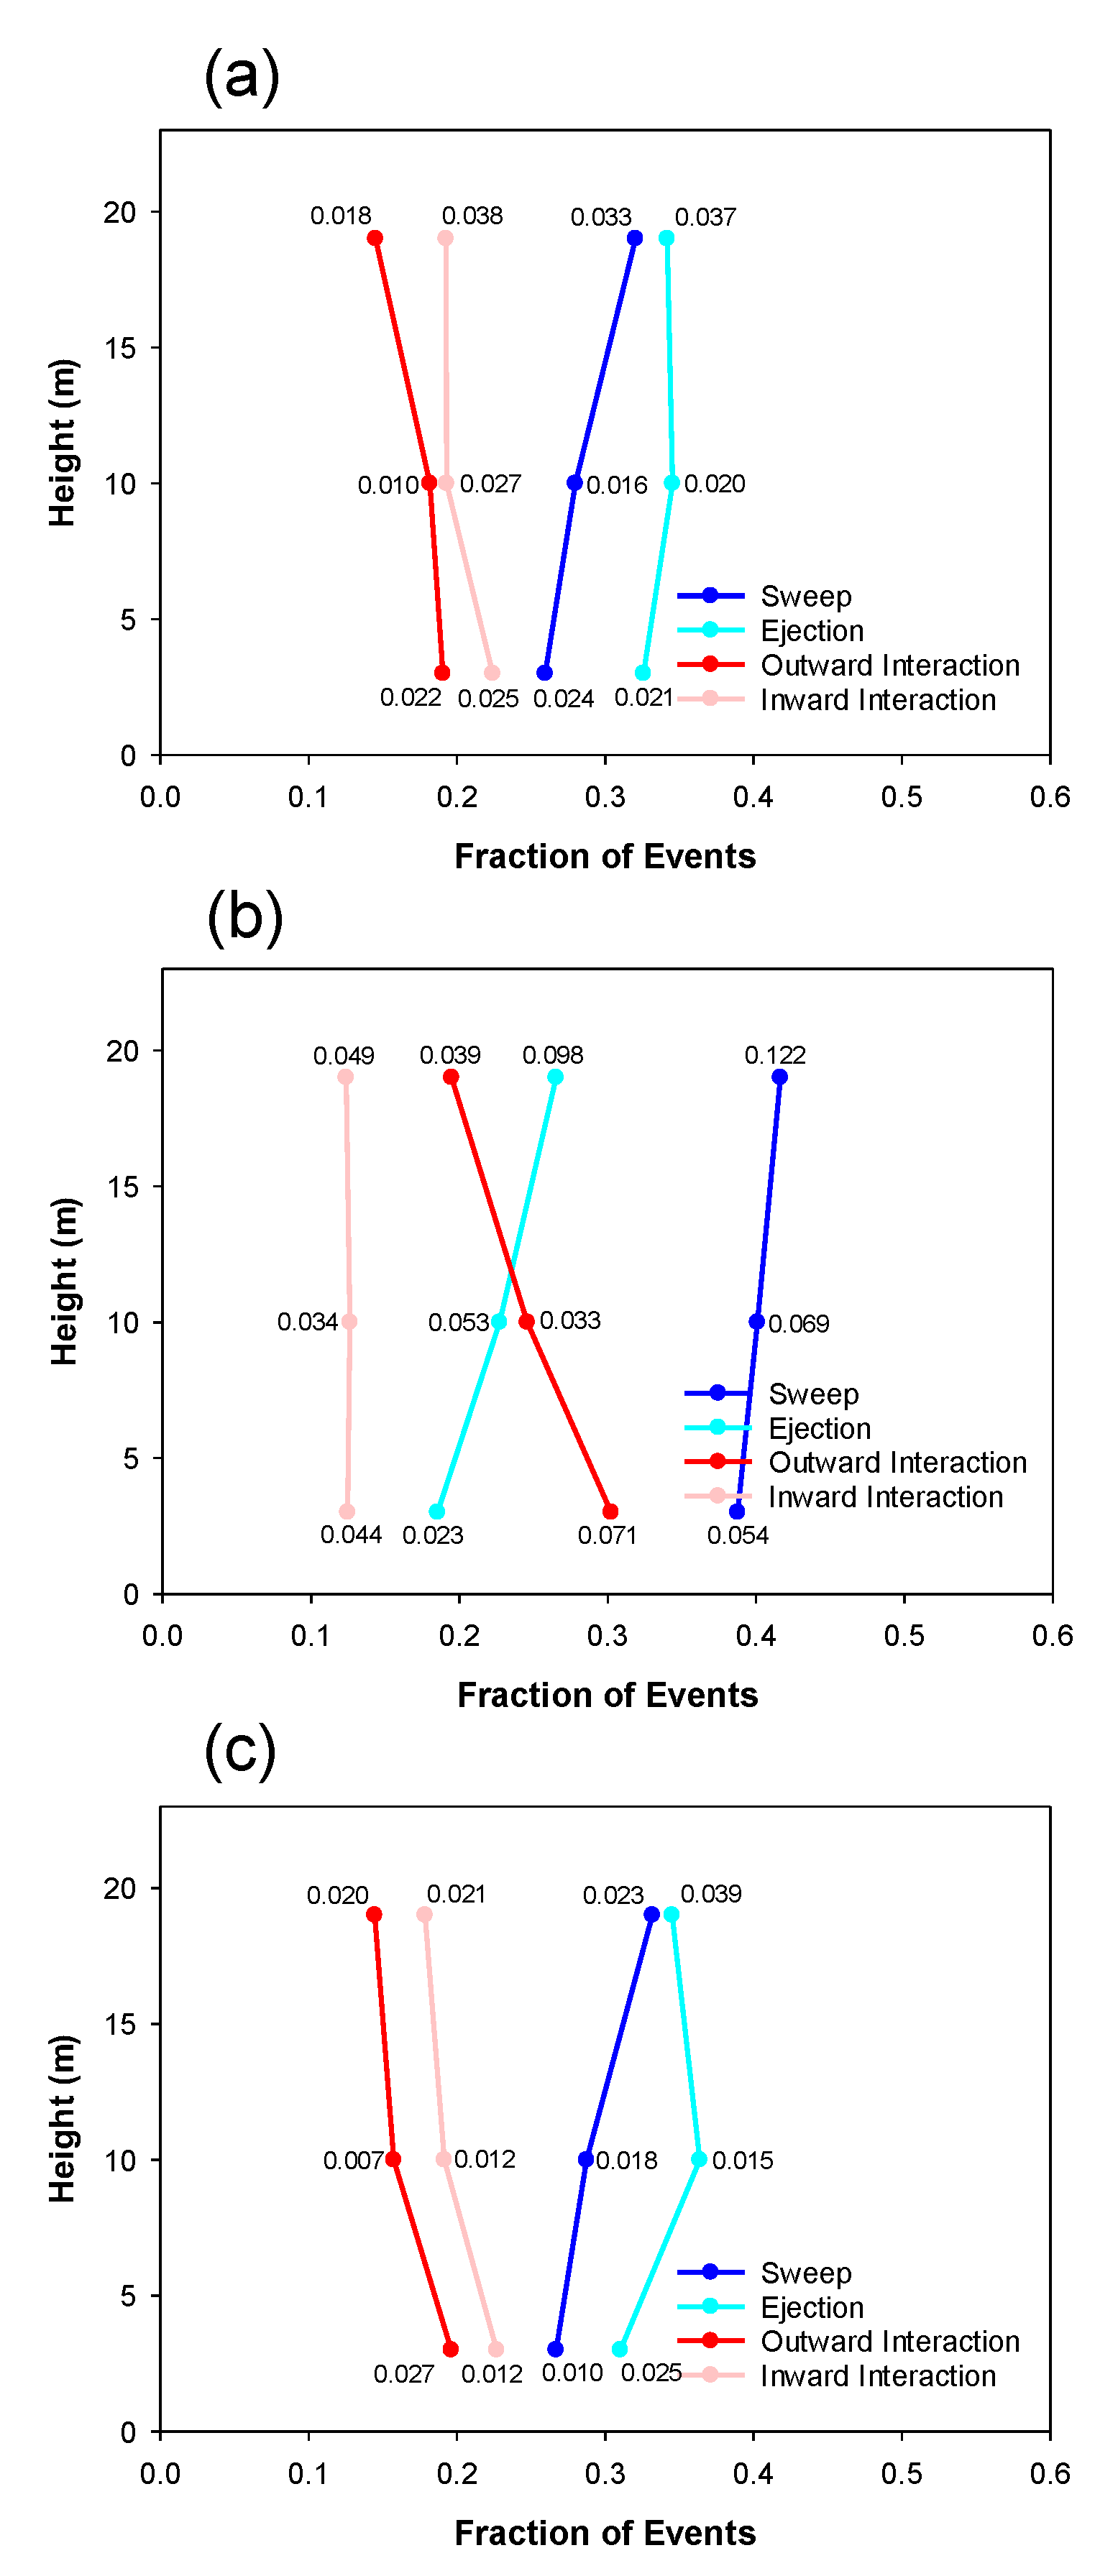
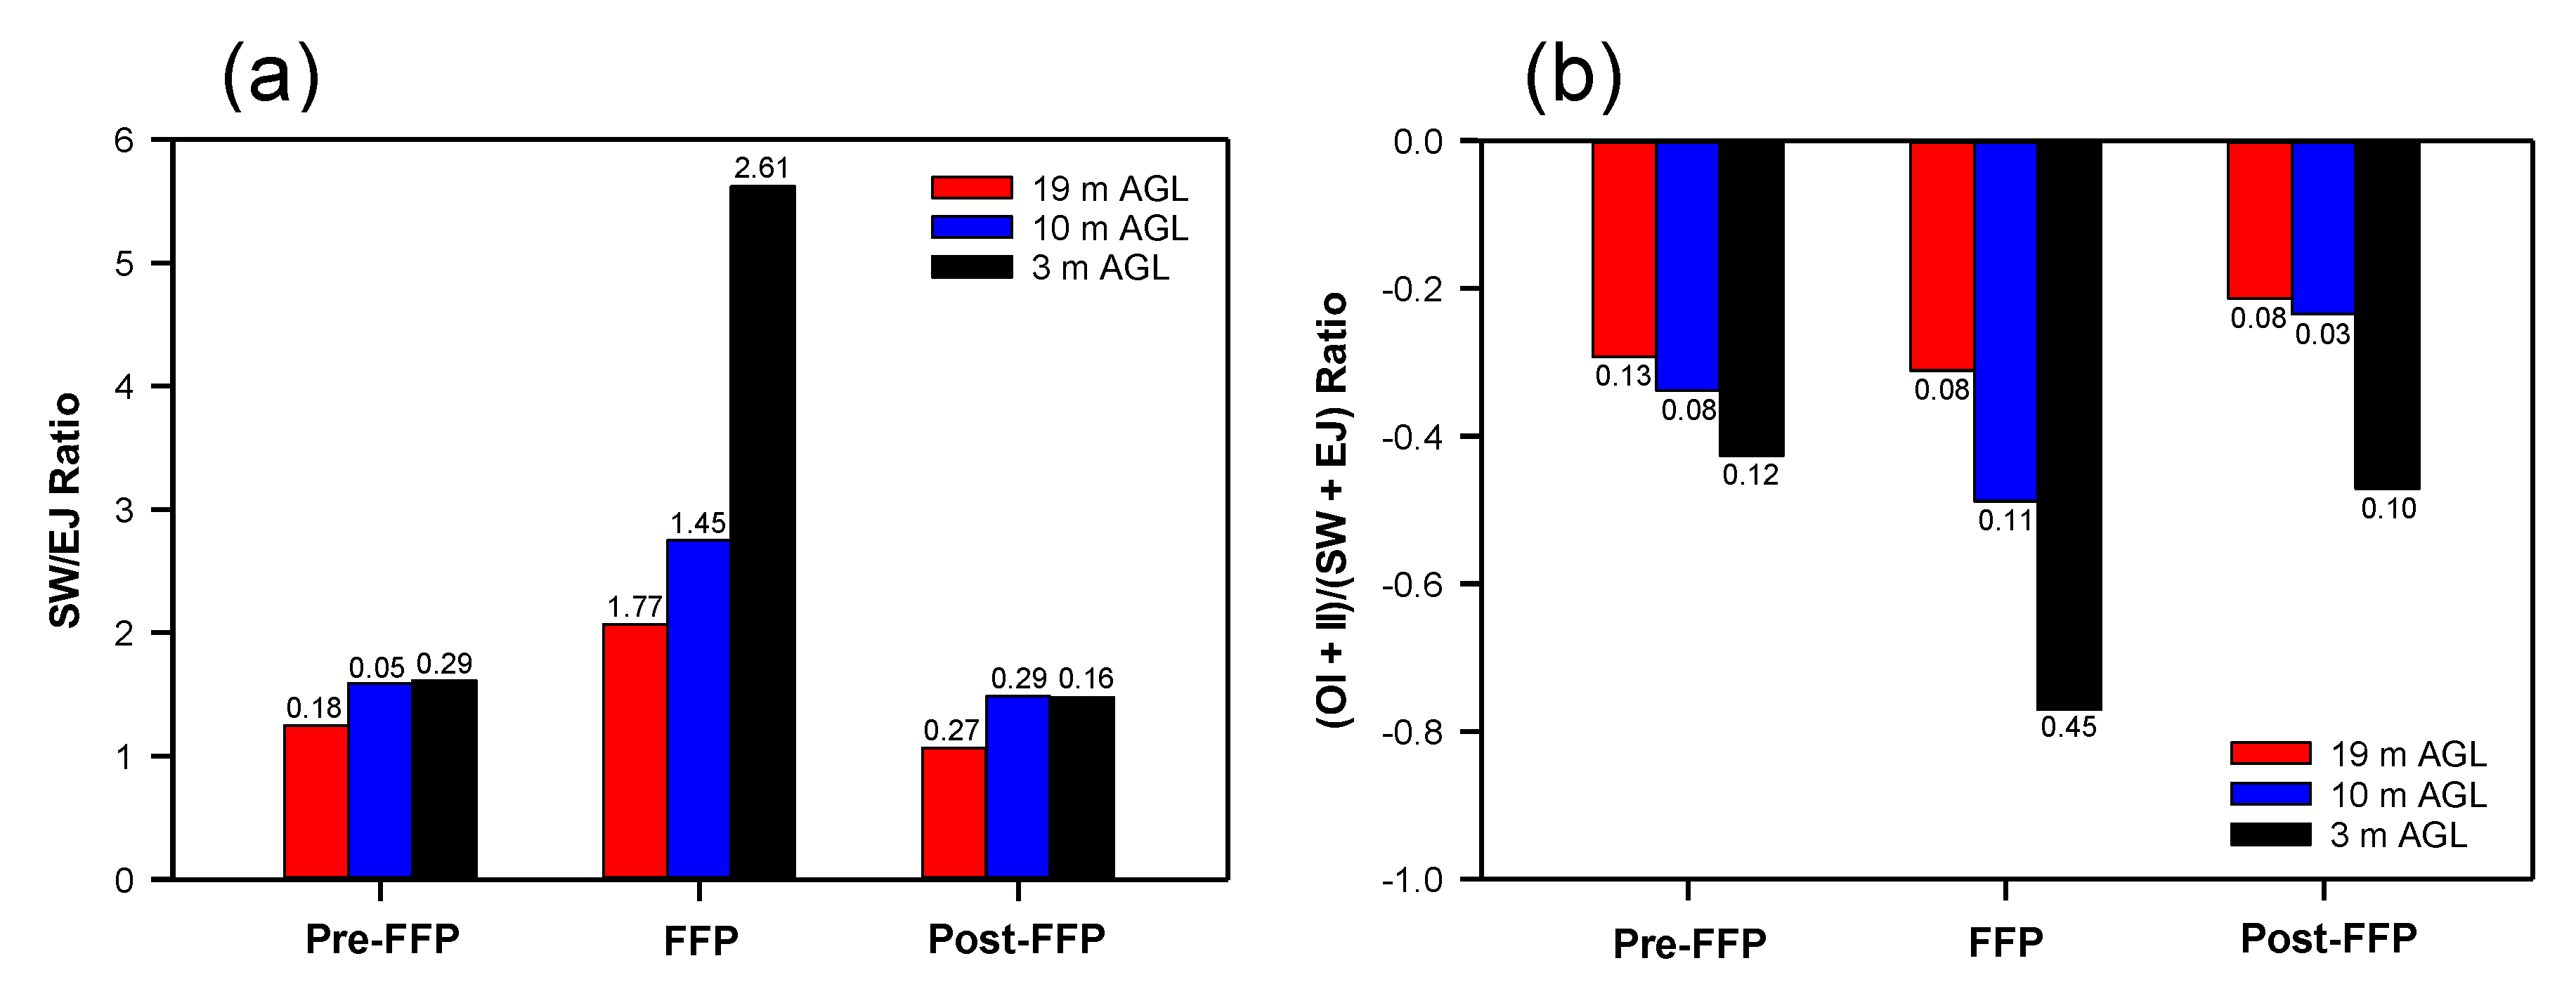
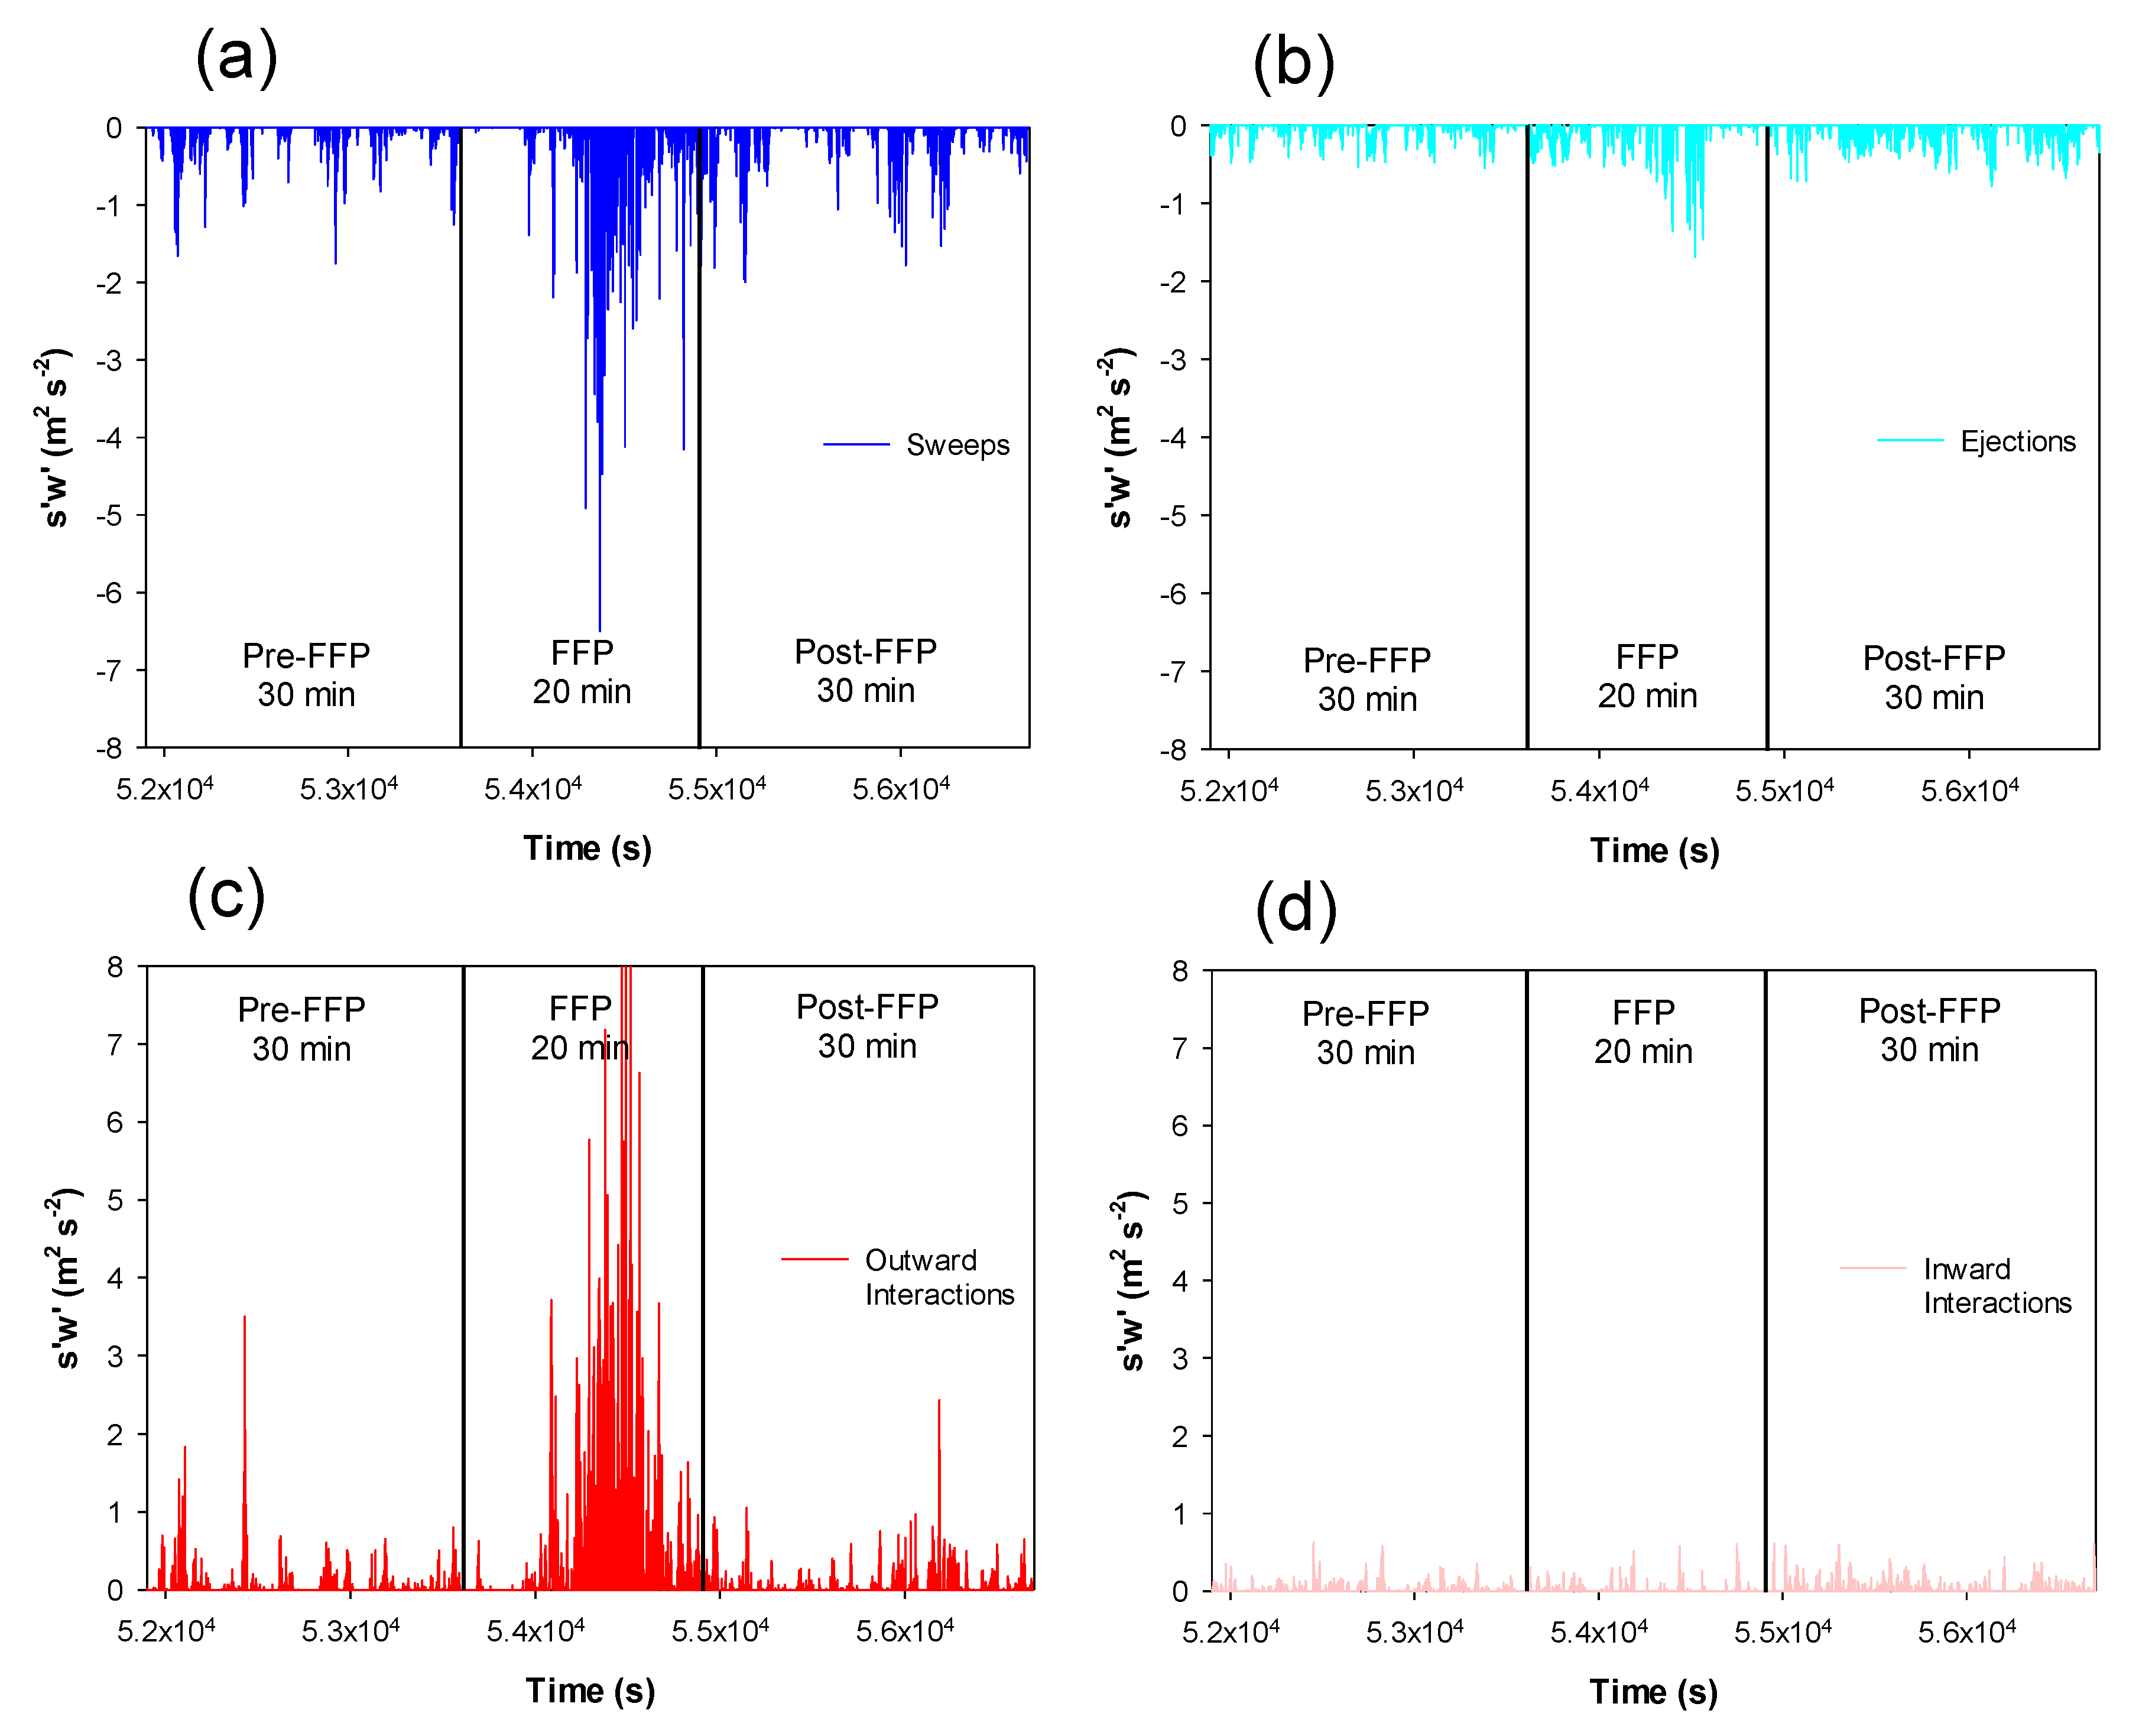
3.2. Momentum-Flux Sweep-Ejection Dynamics

The general temperature, wind velocity, and turbulence regimes that characterized the pre-FFP, FFP, and post-FFP periods at the in situ towers, as described in the previous section, set the context for an analysis of the momentum-flux sweep-ejection dynamics that occurred during the fire experiment. Associated with the ambient and/or fire-induced wind-velocity and temperature variations during the three periods were variations in the vertical turbulent fluxes of horizontal momentum throughout the vertical extent of the forest overstory vegetation. Sweep, ejection, outward interaction, and inward interaction events all contributed to the mean momentum fluxes that characterized the pre-FFP, FFP, and post-FFP periods. However, the relative number of occurrences of the different types of events and their relative contributions to the period-specific mean momentum fluxes varied substantially among periods.
Figure 6 shows the mean fractional number of sweep, ejection, outward interaction, and inward interaction events at the three monitoring heights on the in situ towers during the pre-FFP, FFP, and post-FFP periods based on the 10 Hz sonic anemometer measurements. The pre-FFP and post-FFP periods (Figure 6a,c) at all monitoring heights were dominated by ejection (upward flux of lower horizontal momentum air from below) and sweep (downward flux of higher horizontal momentum air from above) events. Both types of events contributed to negative vertical momentum fluxes ( s w < 0 ). The frequencies of occurrence of outward interaction (upward flux of higher horizontal momentum air from below) and inward interaction (downward flux of lower horizontal momentum air from above) events during these periods were much lower, with both of those events contributing to positive vertical momentum fluxes ( s w > 0 ). In contrast to the pre- and post-FFP periods, the FFP periods at the tower locations were dominated by sweep events at all height levels, with outward interaction events also being relatively frequent at the 3-m height level (Figure 6b). The increases in the number of sweep and outward interaction events primarily came at the expense of ejection events. The number of inward interaction events were also at a minimum during the FFP periods compared to the pre- and post-FFP periods.
The individual sweep, ejection, outward interaction, and inward interaction events with their varying levels of occurrence collectively contributed to the average vertical turbulent momentum fluxes that characterized each period at the different tower locations. As with the occurrence analyses shown in Figure 6, the relative flux contributions of the different types of events varied among periods (Figure 7). Although ejection events were the most common type of event during the pre- and post-FFP periods at all height levels (Figure 6a.c), sweep events actually made the largest contributions to the mean momentum fluxes at all levels in those periods (Figure 7a,c). Even during the highly buoyant FFP periods, sweep events were usually of sufficient strength throughout the vertical extent of the forest overstory vegetation layer to maintain negative vertical momentum fluxes at all levels (Figure 7b). The more frequent outward interaction events during the FFP periods, particularly at the 3- and 10-m levels (Figure 6b), mitigated the flux contribution effects of the sweep events and reduced the magnitudes of the negative vertical momentum fluxes in the FFP periods. At one of the towers (south tower), outward interaction events during the FFP period were actually strong enough to lead to an overall positive mean momentum flux (0.091 m2 s−2) at the 3-m level for the period.
Comparisons of the contributions of the four types of events to the overall momentum fluxes that occurred during the pre-FFP, FFP, and post-FFP periods at the tower locations are further summarized in Figure 8. Mean sweep/ejection contribution ratios (Figure 8a) exceeded 1 at all height levels and in all periods. The ratios increased at all height levels during the FFP periods, but especially at the 3-m level where the ratio was 5.6. The relative contributions of outward plus inward interactions compared to sweeps plus ejections (also known as exuberance [27]) also increased during the FFP periods, again most notably at the 3-m level (Figure 8b), with outward interactions causing most of the exuberance change.

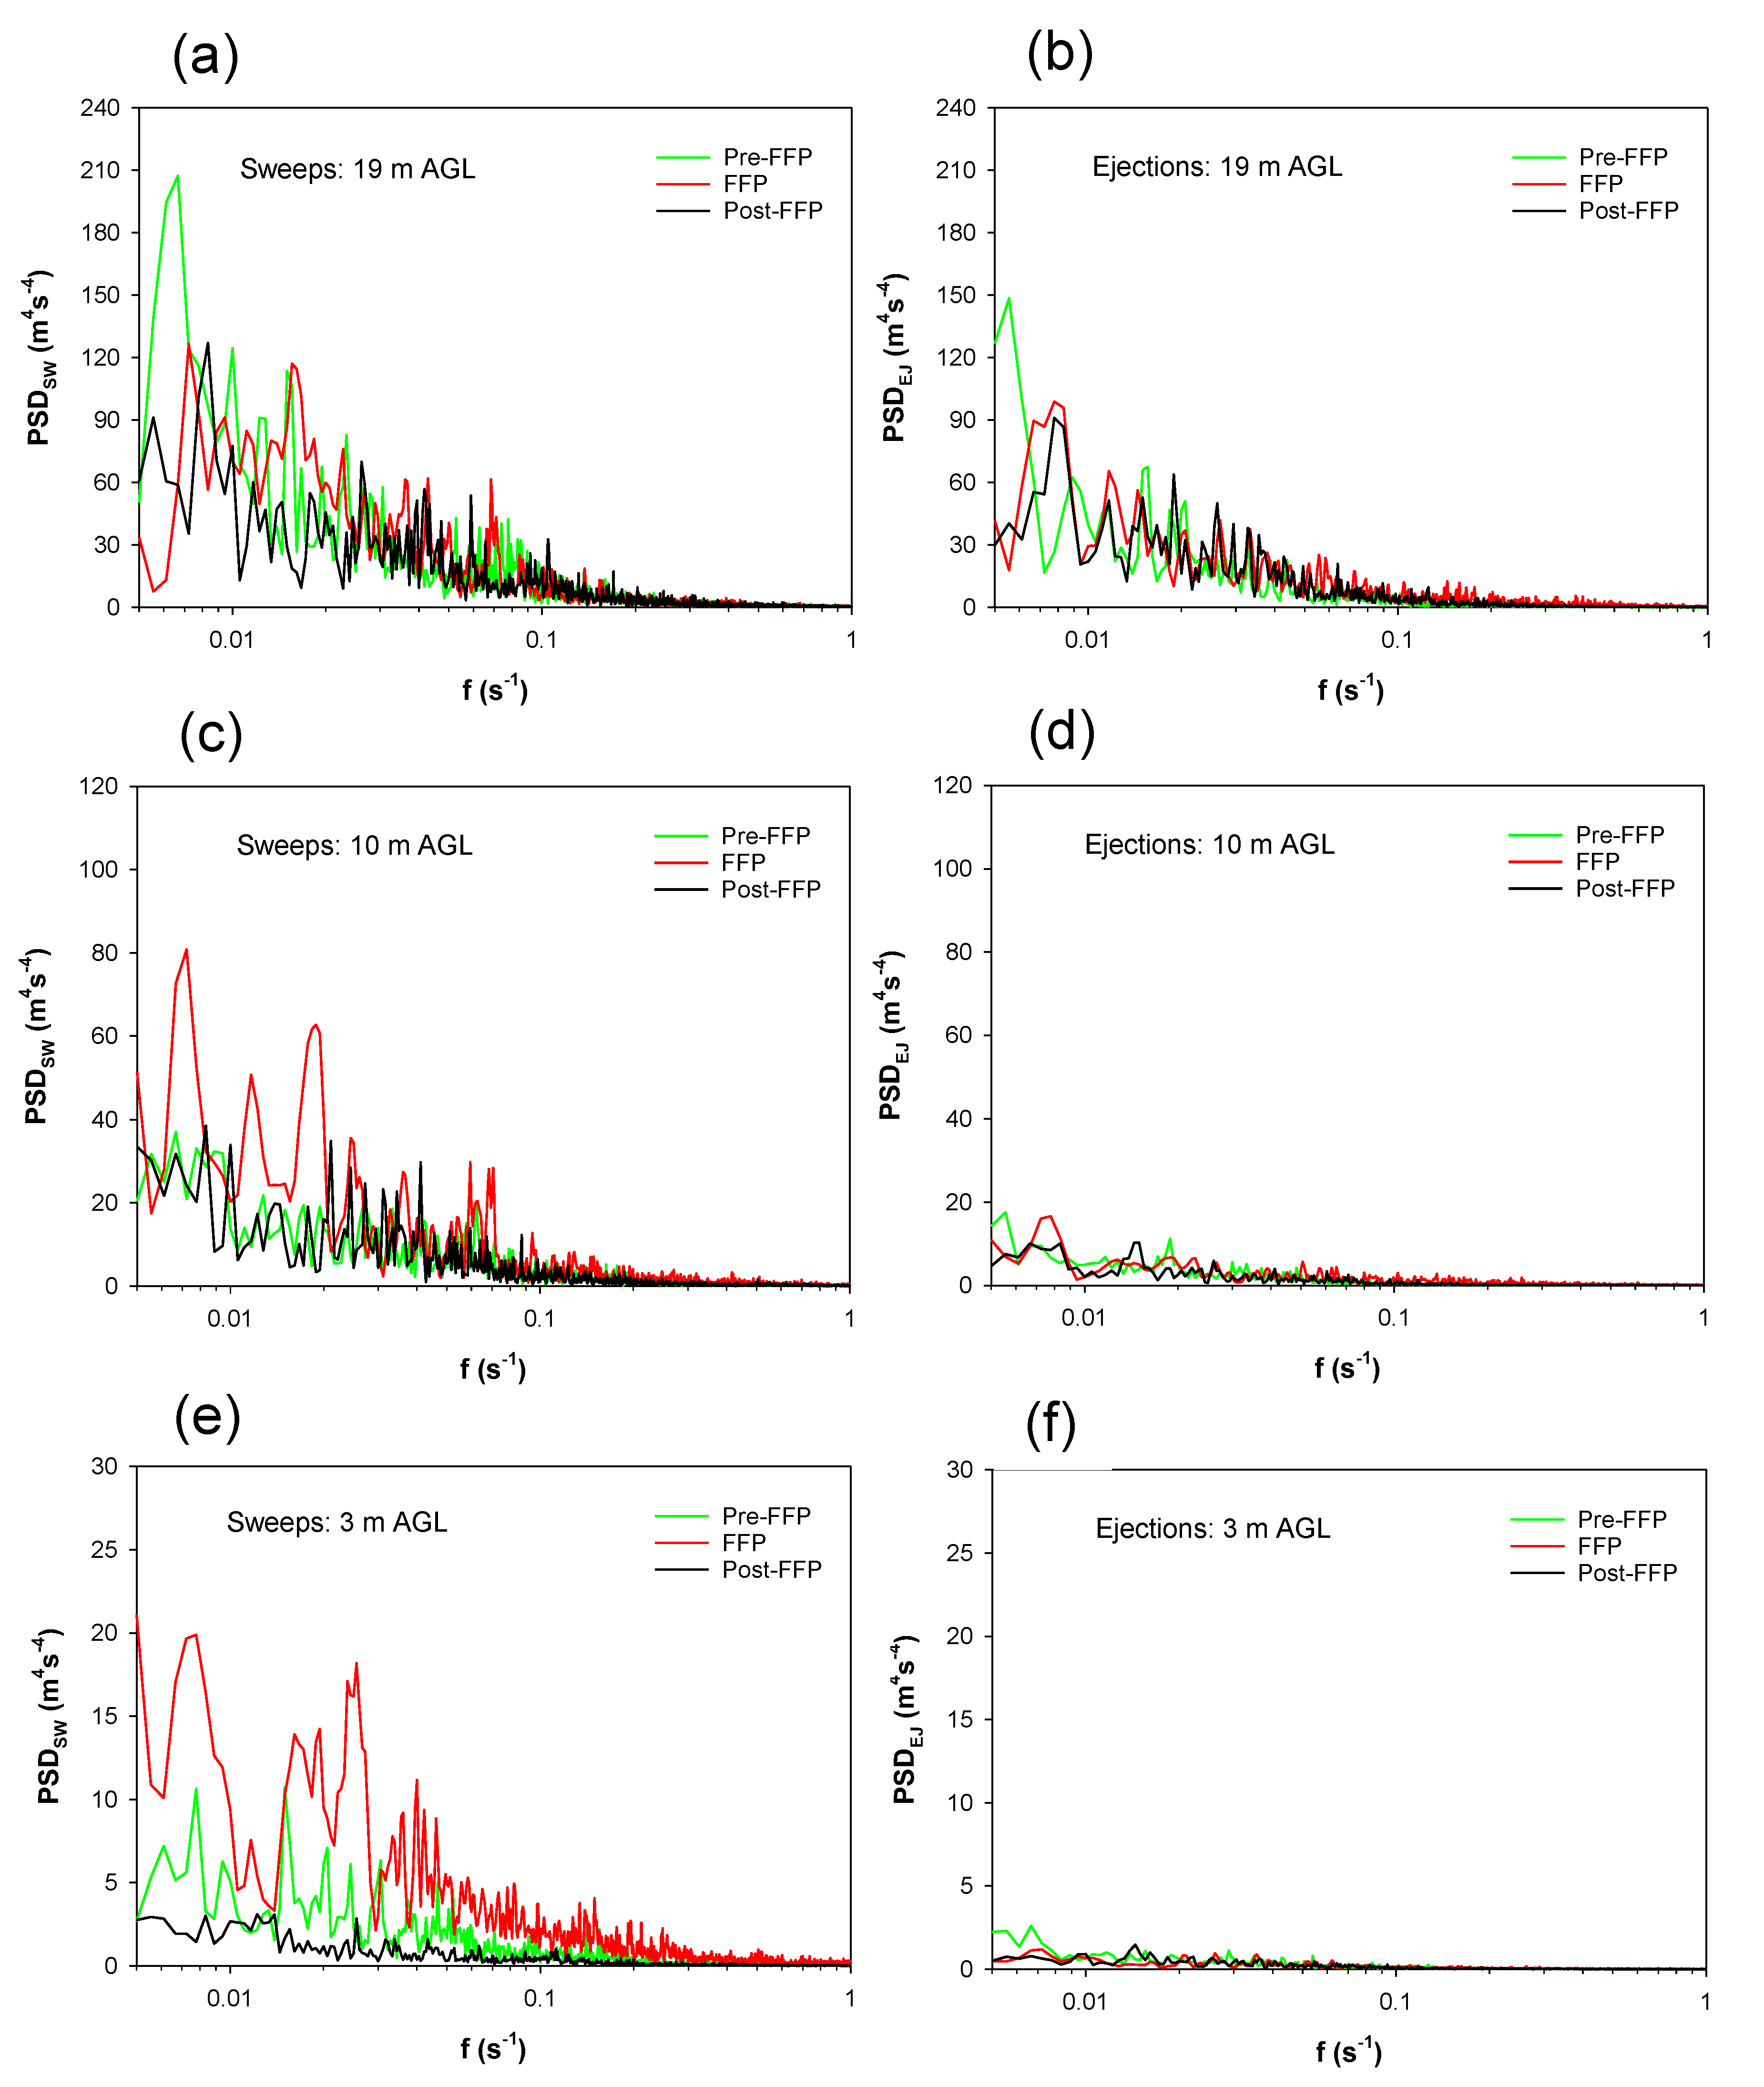
3.3. Periodicity of Momentum-Flux Events

Periodicity patterns were inherent in the recorded occurrences of the four different types of momentum-flux events at each tower location and monitoring height and warranted further investigation. As an example, Figure 9 shows the 10-Hz time series of the vertical turbulent momentum fluxes during the pre-FFP, FFP, and post-FFP periods at the 3-m level on the south tower, separated out by the four different types of events. The plots offer hints of prominent periodicity patterns, especially at lower frequencies (temporal periods greater than 100 s) during the pre-FFP period for the sweep- and outward interaction-type events (Figure 9a,c), and a modification of those prominent periodicity patterns moving into the FFP period. Periodicity patterns at higher frequencies were more difficult to ascertain from the 10-Hz data plots. To assess the periodicity features of the different types of momentum flux events in a more comprehensive fashion, spectral analyses of the 10-Hz sweep, ejection, outward interaction, and inward interaction time series at each monitoring level on all the in situ towers during the pre-FFP, FFP, and post-FFP periods were performed.
Mean power spectral density (PSD) curves for the negative momentum flux contributors, namely sweep (PSDSW) and ejection (PSDEJ) events, are shown in Figure 10. The period-specific mean curves were obtained by averaging the individual momentum-flux spectra associated with sweeps or ejections from all the in situ towers at each monitoring level (3 m, 10 m, 19 m AGL). For the sweep-event contributions, the mean PSDSW curves (Figure 10a,c,e) indicate that the largest relative periodicity variations between the pre-FFP, FFP, and post-FFP periods occurred at the 3-m level and decreased with height. At the 3-m level (Figure 10e), prominent PSDSW peaks occurred in the 0.007–0.008 s−1, 0.016–0.026 s−1, and 0.034–0.046 s−1 frequency ranges during the FFP periods, corresponding to oscillatory periods of ~2.1–2.4 min, 38–63 s, and 22–29 s, respectively. PSDSW values were also consistently higher across the entire frequency spectrum at the 3-m level during the FFP periods compared to the pre-FFP and post-FFP periods, suggesting that spreading line fire through the burn plot was particularly effective in enhancing the periodicity of sweep events over a wide range of temporal scales. It is noteworthy that the strength of the sweep-event periodicity at the 3-m level during the post-FFP periods was noticeably less than the pre-FFP periodicity strength over the lower-frequency portions of the spectrum. At the 10-m level, all the PSDSW curves for the different periods exhibited substantial overlap at higher frequencies (f > 0.02 s−1) (Figure 9c). However, at lower frequencies (f < 0.02 s−1), the FFP PSDSW curve suggests the oscillatory periods greater than 50 s that were prominent at the 3-m level were also prominent at the mid-canopy 10-m level. Near the top of the overstory vegetation, all the PSDSW curves showed considerable overlap (Figure 10a), an indication that spreading line fire did not substantially change the near-canopy-top periodicity patterns of momentum-flux sweep events observed during the pre-FFP periods.
In contrast to the momentum-flux sweep-event periodicity behavior, the ejection-event spectral curves suggest minimal variation in periodicity behavior between the pre-FFP, FFP, and post-FFP periods at all vertical levels (Figure 10b,d,f); overlap of the spectral curves throughout the entire frequency range was substantial. PSDEJ values generally increased with height, as did the PSDSW values, but PSDEJ values were noticeably less than the PSDSW values at the 3-m and 10-m levels. In addition, all PSDEJ curves were relatively flat at the 3-m and 10-m levels, an indication that there were generally no conspicuous oscillatory frequencies governing the ejection-event contributions to momentum fluxes at those heights during the three periods.
The mean PSD curves for the outward interaction (PSDOI) and inward interaction (PSDII) events, the positive momentum flux contributors, are shown in Figure 11. During the FFP periods when outward interaction contributions to vertical turbulent momentum fluxes were most significant (see Figure 7), most of the PSDOI values exceeded pre-FFP and post-FFP PSDOI values across the entire frequency spectrum at all height levels (Figure 11a,c,e). The relative separation of the FFP spectral curve from the pre-FFP and post-FFP curves was at a maximum at the 3-m level (Figure 11e). Prominent peaks in the mean FFP PSDOI spectral curve occurred at frequencies (periods) of 0.007 s−1 (143 s), 0.012–0.025 s−1 (83–40 s), and 0.085 s−1 (12 s) at the 19-m level (Figure 11a); and 0.010 s−1 (100 s), 0.048 s−1 (21 s) and 0.114 s−1 (9 s) at the 10-m level (Figure 11c). At the 3-m level, prominent peaks in mean FFP PSDOI values were prevalent at many frequencies (periods) below (above) 0.052 s−1 (19 s) (Figure 11e). Finally, the strength of the post-FFP outward interaction periodicity was noticeably less than the pre-FFP periodicity strength at the 10- and 19-m levels (Figure 11a,c), particularly at lower frequencies. This is in contrast to the post-FFP periodicity behavior observed for sweep events where separation between the pre-FFP and post-FFP PSD curves was at a maximum at the 3-m level (see Figure 10e).
The inward interaction spectral curves (PSDII) shown in Figure 11b,d,f suggest that the presence of a surface line fire may tend to suppress the occurrence of any strong oscillatory behavior in the downward flux of low horizontal momentum from above, which was a feature of the pre-FFP period when relatively strong oscillations occurred near the canopy top at a frequency (period) of 0.008 s−1 (125 s) (Figure 11b). The FFP and post-FFP PSDII curves were relatively flat throughout the frequency spectrum at all height levels.

4. Discussion

Ambient and fire-induced atmospheric turbulent circulations in the local environment surrounding wildland fires can redistribute heat, moisture, and momentum. This redistribution, in turn, can potentially feed back on the behavior and spread of wildland fires by ingesting warmer or cooler air, drier or more humid air, and higher or lower momentum air into the combustion zone, surrounding fuels, and atmospheric layers above the combustion zone [16,22,38,39,40]. This study specifically focused on the mechanisms by which momentum can be vertically redistributed in the local environment surrounding wildland fires in forested environments through turbulent circulations. It builds upon previous observational studies of atmospheric turbulence regimes in the vicinity of wildland fires [5,6,15,17,22,23] and contributes to a broader U.S. Department of Defense funded study of wildland fire combustion processes in open-canopied forests (https://www.serdp-estcp.org/Program-Areas/Resource-Conservation-and-Resiliency/Air-Quality/Fire-Emissions/RC-2641, accessed on 19 May 2021).
The management-scale prescribed-fire experiment conducted within the Brendan T. Byrne State Forest in New Jersey on 13 March 2019 provided the framework and infrastructure for measuring a variety of atmospheric turbulence related variables in the vicinity of the prescribed burn fire front as it spread through the experimental burn plot. High-frequency (10 Hz) sonic anemometer measurements of horizontal and vertical velocities at three vertical levels on multiple towers during the experiment were used to examine the general turbulence regimes that characterized the pre-FFP, FFP, and post-FFP periods at each tower, and specifically the momentum-flux sweep-ejection dynamics that occurred during these three periods.
Results from the sonic anemometer measurements are consistent with and reinforce many of the findings from previous studies of fire–atmosphere interactions in forested environments. For example, the periods following FFP at each tower location in this study were characterized by temperatures falling below pre-FFP values, with enhanced downdrafts in the post-FFP period compared to the pre-FFP period. These findings are consistent with the results from [1,15,16,22,41]. The energy of turbulent circulations (TKE) during the pre-FFP, FFP, and post-FFP periods varied substantially from period to period, but period-mean TKE always increased with height and resulted in maximum energy values occurring near the top of the overstory vegetation where shear-generation of turbulence is typically of greater significance [42,43]. The distribution of turbulent energy among its horizontal and vertical components (i.e., u 2 , v 2 , w 2 ) indicated substantial anisotropy in the turbulence field during all periods. Most of the turbulent energy was associated with perturbations in the horizontal velocities, even during the FFP periods when buoyancy and vertical velocity perturbations were at a maximum, as also noted in [5,22,23].
The turbulent horizontal and vertical velocity distributions at the in situ tower locations showed substantial skewness, particularly at lower levels within the forest vegetation layer during the pre-FFP period (negatively skewed vertical velocity distributions) and at multiple levels during the FFP period (positively skewed horizontal and vertical velocity distributions). These pre-FFP velocity skewness values are consistent with the well-known skewness observations of [28] in a fire-free environment, and the FFP skewness values reaffirm the conclusions of [23] that fires can induce positively skewed vertical velocity distributions. The skewness findings are further evidence that turbulence regimes in the vicinity of fire fronts in forested environments tend to be non-Gaussian, as previously reported in [23]. The findings also highlight the potential problematic aspect of applying Gaussian dispersion modeling tools for predicting the diffusion of scalars such as heat, moisture, and particulates not only in forested environments [44] but also in forested environments when fires are present [23,45].
Beyond the general turbulence regime characteristics that were identified in this prescribed fire study, the dynamics of the turbulent momentum fluxes that occurred within and near the fire environment were examined. Specifically, the frequencies of occurrence of momentum-flux sweep, ejection, outward interaction, and inward interaction events; the contributions of those events to mean momentum fluxes; and the periodicity of those events were examined for periods before, during, and after fire-front passage. Occurrences of upward fluxes of lower horizontal momentum air from below (ejections) and downward fluxes of higher horizontal momentum air from above (sweeps) were found to be much more frequent than occurrences of upward fluxes of higher momentum air from below (outward interactions) and downward fluxes of lower horizontal momentum air from above (inward interactions) during periods before and after FFP. During FFP periods, however, sweep-event frequency increased at all height levels and outward-interaction-event frequency increased near the surface (3 m AGL); the frequency increases were primarily at the expense of ejection occurrences.
Contributions of the different types of momentum-flux events to the overall mean momentum fluxes were also affected by the presence of a fire front. During the pre-FFP and post-FFP periods when ejection events were the most frequent type of event, sweep events actually made the largest contributions to the overall momentum fluxes. Previous studies of sweep vs. ejection momentum-flux contributions in non-fire forested environments also found this relationship [27,28,29,30]. During the FFP periods, sweep events usually continued to make the largest momentum-flux contributions, although they were mitigated to some extent by outward interaction event contributions, especially near the surface. This result matches the finding of [32] in their sweep-ejection dynamics study of two low-intensity backing fires in New Jersey in 2011 and 2012. The results from these studies suggest that even in the buoyant atmospheric layers above fire fronts within forested areas, regardless of whether the fronts are backing or heading, the downward turbulent flux of higher horizontal momentum air from aloft can still occur throughout the vertical extent of the overstory vegetation and thereby potentially introduce high momentum air (i.e., wind gusts) into combustion zones and affect fire spread. The extent to which this downward turbulent momentum transfer can occur, of course, is partially dependent on the plant-area-density characteristics of the overstory vegetation; denser (sparser) overstory vegetation leads to (1) enhanced (diminished) dissipation of turbulence energy via the breakdown of large turbulent eddies to smaller turbulent eddies by trunks, branches, stems, and leaves [28,46,47,48], and (2) a reduction (increase) in overall momentum transfer by turbulent eddies [47,49].
The momentum-flux sweep, ejection, outward interaction, and inward interaction events that occurred during the pre-FFP, FFP, and post-FFP periods were found to have periodicity patterns that varied from period to period and from the near-surface 3-m level to the 19-m level near the canopy top. Substantial changes in periodicity patterns brought on by the presence of the surface fire front were associated with sweep events at the near-surface 3-m and mid-canopy 10-m levels, and with outward interaction events at all vertical levels. During the FFP periods, sweep-event periodicity strength (compared to the pre-FFP and post-FFP periodicity strength) increased across the entire frequency spectrum at the near-surface 3-m level, while prominent peaks in the PSD curves were observed within three oscillatory periods (2.1–2.4 min, 38–63 s, and 22–29 s). Prominent peaks in the sweep-event PSD curves at oscillatory periods greater than 50 s were also observed at the mid-canopy 10-m level. Outward interaction periodicity strength during FFP periods compared to the pre- and post-FFP periods was also particularly amplified at the near-surface 3-m level and the mid-canopy 10-m level; oscillatory periods of 100 s, 21 s, and 9 s were prominent at the 10-m level, and numerous periods greater than 19 s were prominent at the 3-m level. Finally, the inward interaction periodicity changes brought on by the presence of a fire front, although relatively small, were most pronounced at the mid- and upper-canopy levels. Periodicity strength for inward interactions diminished during the FFP and post-FFP periods compared to the pre-FFP period at those levels.
The periodicity patterns observed in this study suggest that fire fronts in forested environments can introduce cyclic behavior in the turbulent transfer of momentum that differs from the behavior when fires are not present. From a fire-spread standpoint, the prominent changes in the cyclic behavior of sweep and outward interaction events near the surface, which can vertically transfer high momentum air into and away from combustion zones, may be highly relevant. Forthofer and Goodrick [50], in their review of the different types of atmospheric vortices that can develop during wildland fires, highlighted the oscillatory behavior that horizontal roll vortices [51] can exhibit, resulting in potential near-surface wind gusts and fire-front fingering. Note that the turbulent eddies involved in sweep, ejection, outward interaction, and inward interaction events are essentially horizontal roll vortices. In a coupled fire-atmosphere modeling study of the dynamics of grassland fire behavior, [52] identified oscillations in the turbulent horizontal and vertical velocity fields just before the passage of fire fronts, with the periods of oscillation ranging from ~5–20 s, and depending on the ambient wind speed. The oscillations were linked to variations in the convective heating of fuels near the fire fronts, which had a direct impact on subsequent fuel ignition and fire spread. Finally, oscillations (~100 s periods) in fire spread along the flanks of line fires were also observed in smaller-scale (10 m × 10 m burn plots) fire experiments conducted as part of the broader SERDP project under which this current study falls [53]. Although more observational and coupled fire-atmosphere modeling research is needed to firmly establish the process-based connections between oscillatory behavior in the spread of some wildland fires and the periodicity patterns of momentum-flux sweep, ejection, outward interaction, and inward interaction events above fire fronts, the current study offers a plausible hypothesis that atmospheric sweep-ejection dynamics may be a factor in causing some of the observed variability in wildland fire spread.

5. Conclusions

High-frequency (10 Hz) measurements of horizontal and vertical wind velocities during a low-intensity prescribed fire in the New Jersey Pine Barrens were used to examine sweep-ejection dynamics in the vicinity of the fire front. The presence of the fire front led to substantial changes in the sweep-ejection dynamics that typically occur in forested environments when fires are not present. Sweeps (downward flux of high horizontal momentum air from aloft) and ejections (upward flux of low horizontal momentum air from below) were the most frequent types of event before and after the passage of the fire front, whereas sweeps and outward interactions (upward flux of high horizontal momentum air from below) dominated the highly buoyant fire-front-passage periods. The periods before, during, and after fire-front passage were all characterized by negative momentum fluxes that increased in magnitude with height, with sweeps making the largest contributions to the negative fluxes. During fire-front-passage periods, outward interactions mitigated the sweep and ejection negative momentum flux contributions, particularly near the surface just above the fire front. The oscillatory behavior of sweeps and outward interactions differed substantially from the behavior that occurred before and after the fire-front-passage, with their prominent oscillatory frequencies (periods) during fire-front-passage consistent with some of the periodicity patterns that have been observed in past fire-line spread observations and also relevant for some aspects of wildland fire management at the tactical level.
There remains a limited number of datasets from unique fire events in forests with spatially and temporally appropriate data that can be used to assess the vertical and horizontal heterogeneity of turbulence-driven processes important for fire spread and smoke dispersion. Future studies that yield datasets for exploring these phenomena under a broader range of fire intensities and canopy structures and seasonalities (e.g., leaf on vs. leaf off for deciduous or mixed-deciduous forests) will be instrumental in furthering our understanding of the connections between sweep-ejection dynamics and wildland fire behavior. Nevertheless, the results from this study suggest that wildland fires in forested environments can introduce changes to the sweep-ejection dynamics that typically occur under non-fire conditions and potentially alter the turbulent transport of momentum into and out of surface fire fronts.

Author Contributions

Conceptualization, W.E.H., K.L.C., J.J.C., and S.Z.; Methodology, W.E.H., K.L.C., X.B., N.S.S., M.R.G., and M.P.; Formal analysis, W.E.H., K.L.C., and X.B.; Writing—original draft preparation, W.E.H.; Writing—review and editing, W.E.H., K.L.C., J.J.C., S.Z., N.S.S., and M.R.G.; Project administration, N.S.S.; Funding acquisition, W.E.H., K.L.C., J.J.C., N.S.S., and M.R.G. All authors have read and agreed to the published version of the manuscript.

Funding

This research was partially funded by the U.S. Department of Defense—Strategic Environmental Research and Development Program, grant number RC-2641, and the USDA Forest Service—National Fire Plan.

Institutional Review Board Statement

Not applicable.

Informed Consent Statement

Not applicable.

Data Availability Statement

Observational data used for the analyses performed in this study are available upon request from the lead author.

Acknowledgments

We thank the New Jersey Forest Fire Service for managing and conducting the prescribed fire for this study.

Conflicts of Interest

The authors declare no conflict of interest. The funders had no role in the design of the study; in the collection, analyses, or interpretation of data; in the writing of the manuscript, or in the decision to publish the results.

References

  1. Clements, C.B.; Zhong, S.; Goodrick, S.; Li, J.; Potter, B.E.; Bian, X.; Heilman, W.E.; Charney, J.J.; Perna, R.; Jang, M.; et al. Observing the dynamics of wildland grass fires: FireFlux—A field validation experiment. Bull. Am. Meteorol. Soc. 2007, 88, 1369–1382. [Google Scholar] [CrossRef] [Green Version]
  2. Clements, C.B.; Kochanski, A.K.; Seto, D.; Davis, B.; Camacho, C.; Lareau, N.P.; Contezac, J.; Restaino, J.; Heilman, W.E.; Krueger, S.K.; et al. The FireFlux II experiment: A model-guided field experiment to improve understanding of fire–atmosphere interactions and fire spread. Int. J. Wildland Fire 2019, 28, 308–326. [Google Scholar] [CrossRef] [Green Version]
  3. Heilman, W.E.; Zhong, S.; Hom, J.L.; Charney, J.J.; Kiefer, M.T.; Clark, K.L.; Skowronski, N.; Bohrer, G.; Lu, W.; Liu, Y.; et al. Development of modeling tools for predicting smoke dispersion from low-intensity fires. In Final Report, U.S. Joint Fire Science Program, Project 09-1-04-1, U.S. Joint Fire Science Program, Boise, Idaho, USA; 2013. Available online: http://www.firescience.gov/projects/09-1-04-1/project/09-1-04-1_final_report.pdf (accessed on 9 September 2020).
  4. Strand, T.M.; Rorig, M.; Yedinak, K.; Seto, D.; Allwine, E.; Garcia, F.A.; O’Keefe, P.; Checan, V.C.; Mickler, R.; Clements, C.; et al. Sub-canopy transport and dispersion of smoke: A unique observation dataset and model evaluation. In Final Report, U.S. Joint Fire Science Program, Project 09-1-04-2, U.S. Joint Fire Science Program, Boise, Idaho, USA; 2013. Available online: https://www.frames.gov/catalog/14498 (accessed on 9 September 2020).
  5. Seto, D.; Clements, C.B.; Heilman, W.E. Turbulence spectra measured during fire front passage. Agric. For. Meteorol. 2013, 169, 195–210. [Google Scholar] [CrossRef]
  6. Seto, D.; Strand, T.M.; Clements, C.B.; Thistle, H.; Mickler, R. Wind and plume thermodynamic structures during low-intensity subcanopy fires. Agric. For. Meteorol. 2014, 198–199, 53–61. [Google Scholar] [CrossRef]
  7. Houssami, M.; Mueller, E.; Thomas, J.C.; Simeoni, A.; Filkov, A.; Skowronski, N.; Gallagher, M.R.; Kremens, R. Experimental procedures characterising firebrand generation in wildland fires. Fire Technol. 2016, 52, 731–751. [Google Scholar] [CrossRef]
  8. Ottmar, R.D.; Hiers, J.K.; Butler, B.W.; Clements, C.B.; Dickinson, M.B.; Hudak, A.T.; O’Brien, J.J.; Potter, B.E.; Rowell, E.M.; Strand, T.M.; et al. Measurements, datasets and preliminary results from the RxCADRE project—2008, 2011 and 2012. Int. J. Wildland Fire 2016, 25, 1–9. [Google Scholar] [CrossRef]
  9. Clark, K.L.; Heilman, W.E.; Skowronski, N.S.; Gallagher, M.R.; Mueller, E.; Hadden, R.; Simeoni, A. Fire behavior, fuel consumption, and turbulence and energy exchange during prescribed fires in pitch pine forests. Atmosphere 2020, 11, 242. [Google Scholar] [CrossRef] [Green Version]
  10. Orlanski, I. A rational subdivision of scales for atmospheric processes. Bull. Am. Meteorol. Soc. 1975, 56, 527–530. [Google Scholar] [CrossRef]
  11. Stull, R.B. An Introduction to Boundary Layer Meteorology; Kluwer Academic: Dordrecht, The Netherlands, 1988; 666p. [Google Scholar]
  12. Rothermel, R.C. How to Predict the Spread and Intensity of Forest and Range Fires; USDA Forest Service, General Technical Report INT-143, Intermountain Forest and Range Experiment Station: Ogden, UT, USA, 1983; 161p. [Google Scholar]
  13. Simard, A.J. Fire severity, changing scales, and how things hang together. Int. J. Wildland Fire 1991, 1, 23–34. [Google Scholar] [CrossRef]
  14. Falk, D.A.; Miller, C.; McKenzie, D.; Black, A.E. Cross-scale analysis of fire regimes. Ecosystems 2007, 10, 809–823. [Google Scholar] [CrossRef] [Green Version]
  15. Clements, C.B.; Zhong, S.; Bian, X.; Heilman, W.E.; Byun, D.W. First observations of turbulence generated by grass fires. J. Geophys. Res. 2008, 113, D22102. [Google Scholar] [CrossRef] [Green Version]
  16. Sun, R.; Krueger, S.K.; Jenkins, M.A.; Zulauf, M.A.; Charney, J.J. The importance of fire–atmosphere coupling and boundary-layer turbulence to wildfire spread. Int. J. Wildland Fire 2009, 18, 50–60. [Google Scholar] [CrossRef]
  17. Seto, D.; Clements, C.B. Fire whirl evolution observed during a valley wind-sea breeze reversal. J. Combust. 2011, 2011, 569475. [Google Scholar] [CrossRef] [Green Version]
  18. Pimont, F.; Dupuy, J.-L.; Linn, R.R.; Dupont, S. Impacts of tree canopy structure on wind flows and fire propagation simulated with FIRETEC. Ann. For. Sci. 2011, 68, 523–530. [Google Scholar] [CrossRef] [Green Version]
  19. Pimont, F.; Dupuy, J.-L.; Linn, R.R. Coupled slope and wind effects on fire spread with influences of fire size: A numerical study using FIRETEC. Int. J. Wildland Fire 2012, 21, 828–842. [Google Scholar] [CrossRef]
  20. Sharples, J.J.; McRae, R.H.D.; Wilkes, S.R. Wind–terrain effects on the propagation of wildfires in rugged terrain: Fire channelling. Int. J. Wildland Fire 2012, 21, 282–296. [Google Scholar] [CrossRef] [Green Version]
  21. Kiefer, M.T.; Heilman, W.E.; Zhong, S.; Charney, J.J.; Bian, X.; Skowronski, N.S.; Hom, J.L.; Clark, K.L.; Patterson, M.; Gallagher, M.R. Multiscale simulation of a prescribed fire event in the New Jersey Pine Barrens using ARPS-CANOPY. J. Appl. Meteorol. Climatol. 2014, 53, 793–812. [Google Scholar] [CrossRef]
  22. Heilman, W.E.; Clements, C.B.; Seto, D.; Bian, X.; Clark, K.L.; Skowronski, N.S.; Hom, J.L. Observations of fire-induced turbulence regimes during low-intensity wildland fires in forested environments: Implications for smoke dispersion. Atmos. Sci. Lett. 2015, 16, 453–460. [Google Scholar] [CrossRef] [Green Version]
  23. Heilman, W.E.; Bian, X.; Clark, K.L.; Skowronski, N.S.; Hom, J.L.; Gallagher, M.R. Atmospheric turbulence observations in the vicinity of surface fires in forested environments. J. Appl. Meteorol. Climatol. 2017, 56, 3133–3150. [Google Scholar] [CrossRef]
  24. Beer, T. The interaction of wind and fire. Bound.-Layer Meteorol. 1991, 54, 287–308. [Google Scholar] [CrossRef]
  25. Pimont, F.; Dupuy, J.-L.; Linn, R.R.; Dupont, S. Validation of FIRETEC wind-flows over a canopy and a fuel-break. Int. J. Wildland Fire 2009, 18, 775–790. [Google Scholar] [CrossRef] [Green Version]
  26. Katul, G.; Kuhn, G.; Schieldge, J.; Hsieh, C.-I. The ejection-sweep character of scalar fluxes in the unstable surface layer. Bound.-Layer Meteorol. 1997, 83, 1–26. [Google Scholar] [CrossRef]
  27. Shaw, R.H.; Tavangar, J.; Ward, D.P. The structure of the Reynolds stress in a canopy layer. J. Clim. Appl. Meteorol. 1983, 22, 1922–1931. [Google Scholar] [CrossRef] [Green Version]
  28. Baldocchi, D.D.; Meyers, T.P. Turbulence structure in a deciduous forest. Bound.-Layer Meteorol. 1988, 43, 345–364. [Google Scholar] [CrossRef]
  29. Katul, G.; Poggi, D.; Cava, D.; Finnigan, J. The relative importance of ejections and sweeps to momentum transfer in the atmospheric boundary layer. Bound.-Layer Meteorol. 2006, 120, 367–375. [Google Scholar] [CrossRef]
  30. Banerjee, T.; De Roo, F.; Mauder, M. Connecting the failure of K theory inside and above vegetation canopies and ejection–sweep cycles by a large-eddy simulation. J. Appl. Meteorol. Climatol. 2017, 56, 3119–3131. [Google Scholar] [CrossRef]
  31. Poggi, D.; Porporato, A.; Ridolfi, L.; Albertson, J.D.; Katul, G.G. The effect of vegetation density on canopy sub-layer turbulence. Bound.-Layer Meteorol. 2004, 111, 565–587. [Google Scholar] [CrossRef]
  32. Heilman, W.E.; Banerjee, T.; Clements, C.B.; Clark, K.L.; Zhong, S.; Bian, X. Observations of sweep-ejection dynamics for heat and momentum fluxes during wildland fires in forested and grassland environments. J. Appl. Meteorol. Climatol. 2021, 60, 185–199. [Google Scholar] [CrossRef]
  33. Clark, K.L.; Renninger, H.J.; Skowronski, N.; Gallagher, M.; Schäfer, K.V.R. Decadal-scale reduction in forest net ecosystem production following insect defoliation contrasts with short-term impacts of prescribed fires. Forests 2018, 9, 145. [Google Scholar] [CrossRef] [Green Version]
  34. Skowronski, N.S.; Clark, K.L.; Duveneck, M.; Hom, J. Three-dimensional canopy fuel loading predicted using upward and downward sensing LiDAR systems. Remote Sens. Environ. 2011, 115, 703–714. [Google Scholar] [CrossRef]
  35. Wilczak, J.M.; Oncley, S.P.; Stage, S.A. Sonic anemometer tilt correction algorithms. Bound.-Layer Meteorol. 2001, 99, 127–150. [Google Scholar] [CrossRef]
  36. Wallace, J.M. Quadrant analysis in turbulence research: History and evolution. Ann. Rev. Fluid Mech. 2016, 48, 131–158. [Google Scholar] [CrossRef]
  37. Scargle, J.D. Studies in astronomical time series analysis. II—Statistical aspects of spectral analysis of unevenly spaced data. Astrophys. J. 1982, 263, 835–853. [Google Scholar] [CrossRef]
  38. Linn, R.R.; Cunningham, P. Numerical simulations of grass fires using a coupled atmosphere–fire model: Basic fire behavior and dependence on wind speed. J. Geophys. Res. 2005, 110, D13107. [Google Scholar] [CrossRef]
  39. Potter, B.E. Atmospheric interactions with wildland fire behavior—I. Basic surface interactions, vertical profiles and synoptic structures. Int. J. Wildland Fire 2012, 21, 779–801. [Google Scholar] [CrossRef]
  40. Coen, J.L.; Cameron, M.; Michalakes, J.; Patton, E.G.; Riggan, P.J.; Yedinak, K.M. WRF-Fire: Coupled weather–wildland fire modeling with the Weather Research and Forecasting model. J. Appl. Meteorol. Climatol. 2013, 52, 16–38. [Google Scholar] [CrossRef]
  41. Charland, A.M.; Clements, C.B. Kinematic structure of a wildland fire plume observed by Doppler lidar. J. Geophys. Res. Atmos. 2013, 118, 1–13. [Google Scholar] [CrossRef] [Green Version]
  42. Meyers, T.P.; Baldocchi, D.D. The budgets of turbulent kinetic energy and Reynolds stress within and above a deciduous forest. Agric. For. Meteorol. 1991, 53, 207–222. [Google Scholar] [CrossRef]
  43. Dwyer, M.J.; Patton, E.G.; Shaw, R.H. Turbulent kinetic energy budgets from a large-eddy simulation of airflow above and within a forest canopy. Bound.-Layer Meteorol. 1997, 84, 23–43. [Google Scholar] [CrossRef]
  44. Shaw, R.H.; Seginer, I. Calculation of velocity skewness in real and artificial plant canopies. Bound.-Layer Meteorol. 1987, 39, 315–332. [Google Scholar] [CrossRef]
  45. Linn, R.R.; Goodrick, S.L.; Brambilla, S.; Brown, M.J.; Middleton, R.S.; O’Brien, J.J.; Hiers, J.K. QUIC-fire: A fast-running simulation tool for prescribed fire planning. Environ. Model. Softw. 2020, 125, 104616. [Google Scholar] [CrossRef]
  46. Wilson, N.R.; Shaw, R.H. A higher order closure model for canopy flow. J. Appl. Meteorol. Climatol. 1977, 16, 1197–1205. [Google Scholar] [CrossRef] [Green Version]
  47. Amiro, B.D. Comparison of turbulence statistics within three boreal forest canopies. Bound.-Layer Meteorol. 1990, 51, 99–121. [Google Scholar] [CrossRef]
  48. Finnigan, J. Turbulence in plant canopies. Ann. Rev. Fluid Mech. 2000, 32, 519–571. [Google Scholar] [CrossRef]
  49. Yi, C. Momentum transfer within canopies. J. Appl. Meteorol. Climatol. 2008, 47, 262–275. [Google Scholar] [CrossRef] [Green Version]
  50. Forthofer, J.M.; Goodrick, S.L. Review of vortices in wildland fire. J. Combust. 2011, 2011, 984363. [Google Scholar] [CrossRef]
  51. Haines, D.A. Horizontal roll vortices and crown fires. J. Appl. Meteorol. 1982, 21, 751–763. [Google Scholar] [CrossRef] [Green Version]
  52. Cunningham, P.; Linn, R.R. Numerical simulations of grass fires using a coupled atmosphere-fire model: Dynamics of fire spread. J. Geophys. Res. 2007, 112, D05108. [Google Scholar] [CrossRef]
  53. Mueller, E.V.; (University of Edinburgh, Edinburgh, UK). Personal Communication. 2020. [Google Scholar]
Figure 1. The location of the 13 March 2019 SERDP management-scale prescribed fire experiment in the New Jersey Pinelands National Reserve (left panel); and the prescribed fire burn unit along with the meteorological tower and SODAR system locations (right panel).
Atmosphere 12 00956 g001
Figure 2. Average plant-area-density (m2 m−3) profile in the burn unit for the 13 March 2019 SERDP management-scale prescribed fire experiment based on aerial Lidar measurements of the vegetation structure.
Atmosphere 12 00956 g002
Figure 3. Photograph of the surface line fire ignited along the southwest side of burn unit.
Atmosphere 12 00956 g003
Figure 4. Time series of (a) temperature ( T ), (b) tilt-corrected zonal wind velocity ( U ), (c) tilt-corrected meridional wind velocity ( V ), (d) tilt-corrected vertical wind velocity ( W ), and (e) turbulent kinetic energy ( T K E ) at 3 m, 10 m, and 19 m AGL before, during, and after fire-front-passage at the west tower.
Atmosphere 12 00956 g004
Figure 5. Mean (a) temperatures ( T ), (b) tilt-corrected zonal wind velocities ( U ), (c) tilt-corrected meridional wind velocities ( V ), (d) tilt-corrected vertical wind velocities ( W ), and (e) turbulent kinetic energy ( T K E ) at 3 m, 10 m, and 19 m AGL during the pre-FFP, FFP, and post-FFP periods, computed from all five in situ towers. Numbers adjacent to data points indicate standard deviations.
Atmosphere 12 00956 g005
Figure 6. Mean fractional number of sweep, ejection, outward interaction, and inward interaction events during the (a) pre-FFP, (b) FFP, and (c) post-FFP periods at 3 m, 10 m, and 19 m AGL, computed from all five in situ towers. Numbers adjacent to the data points indicate standard deviations.
Atmosphere 12 00956 g006
Figure 7. Mean contributions of sweep, ejection, outward interaction, and inward interaction events to the average vertical turbulent momentum fluxes during the (a) pre-FFP, (b) FFP, and (c) post-FFP periods at 3 m, 10 m, and 19 m AGL, computed from all five in situ towers. Average total vertical turbulent momentum flux values (m2 s−2) at each height level are indicated with labeled (mean ± standard deviation) yellow vertical lines.
Atmosphere 12 00956 g007
Figure 8. Mean (a) sweep (SW)/ejection (EJ) contribution ratios and (b) exuberance ((outward interaction (OI) contribution + inward interaction (II) contribution)/(sweep (SW) contribution + ejection (EJ) contribution)) values during the pre-FFP, FFP, and post-FFP periods at 3 m, 10 m, and 19 m AGL, computed from all five in situ towers. Numbers above or below the bars indicate standard deviations.
Atmosphere 12 00956 g008
Figure 9. Time series (10-Hz) of the vertical turbulent momentum fluxes (s′w′) attributed to (a) sweeps, (b) ejections, (c) outward interactions, and (d) inward interactions during the pre-FFP, FFP, and post-FFP periods at 3 m AGL at the south tower.
Atmosphere 12 00956 g009
Figure 10. Mean power spectral density (PSD: m4 s−4) vs. frequency (f: s−1) curves for the negative vertical momentum flux contributors of (a,c,e) sweeps (PSDSW) and (b,d,f) ejections (PSDEJ) at the 19-m (top row), 10-m (middle row), and 3-m (bottom row) levels for the pre-FFP, FFP, and post-FFP periods, computed from all five in situ towers.
Atmosphere 12 00956 g010
Figure 11. Mean power spectral density (PSD: m4 s−4) vs. frequency (f: s−1) curves for the positive vertical momentum flux contributors of (a,c,e) outward interactions (PSDOI) and (b,d,f) inward interactions (PSDII) at the 19-m (top row), 10-m (middle row), and 3-m (bottom row) levels for the pre-FFP, FFP, and post-FFP periods, computed from all five in situ towers.
Atmosphere 12 00956 g011
Table 1. Time periods (LT) for the delineated pre-FFP, FFP, and post-FFP periods at each tower located in the interior of the prescribed burn plot.
TowerPre-FFPFFPPost-FFP
South1425–14551455–15151515–1545
West1455–15251525–15451545–1615
Flux1455–15251525–15401540–1610
East1508–15381538–15531553–1623
North1543–16131613–16331633–1703
Table 2. Average turbulence statistics at the 3-m, 10-m, and 19-m levels within the pre-FFP, FFP, and post-FFP periods. Brackets indicate an average across all the in situ towers. Overbars indicate temporal means within each period. Units for the tower-averaged temporal mean T K E components ( u 2 ¯ , v 2 ¯ , w 2 ¯ ), kinematic momentum fluxes ( u v ¯ , u w ¯ , v w ¯ ), and kinematic heat fluxes ( u t ¯ , v t ¯ , w t ¯ ) are m2 s−2, m2 s−2, and m s−1 °C, respectively. Anisotropy values ( w 2 ( 2 T K E ) 1 ¯ ) and skewness values for the horizontal and vertical velocity distributions ( S k u , S k v , S k w ) are unitless.
VariablePre-FFPFFPPost-FFP
3 m10 m19 m3 m10 m19 m3 m10 m19 m
[ u 2 ¯ ]0.530.902.120.801.142.630.440.811.67
[ v 2 ¯ ]0.591.091.691.361.822.200.420.661.94
[ w 2 ¯ ]0.110.290.560.310.660.910.090.230.47
[ w 2 ( 2 T K E ) 1 ¯ ]0.140.180.190.160.230.210.150.190.17
[ u v ¯ ]−0.05−0.01−0.10−0.13−0.23−0.58−0.09−0.12−0.40
[ u w ¯ ]−0.07−0.14−0.30−0.03−0.18−0.29−0.03−0.07−0.15
[ v w ¯ ]−0.01−0.09−0.06−0.01−0.040.010.00−0.10−0.17
[ u t ¯ ]−0.02−0.02−0.141.150.12−0.560.010.05−0.02
[ v t ¯ ]0.070.170.112.400.94−0.23−0.13−0.24−0.31
[ w t ¯ ]0.120.260.431.852.932.750.090.080.16
[ S k u ]0.100.180.230.720.550.02−0.030.09−0.09
[ S k v ]0.320.420.290.900.680.190.090.390.49
[ S k w ]−0.46−0.160.080.310.740.86−0.40−0.72−0.21
Publisher’s Note: MDPI stays neutral with regard to jurisdictional claims in published maps and institutional affiliations.

