
30 Years of Air Quality Trends in Japan


Abstract
:1. Introduction
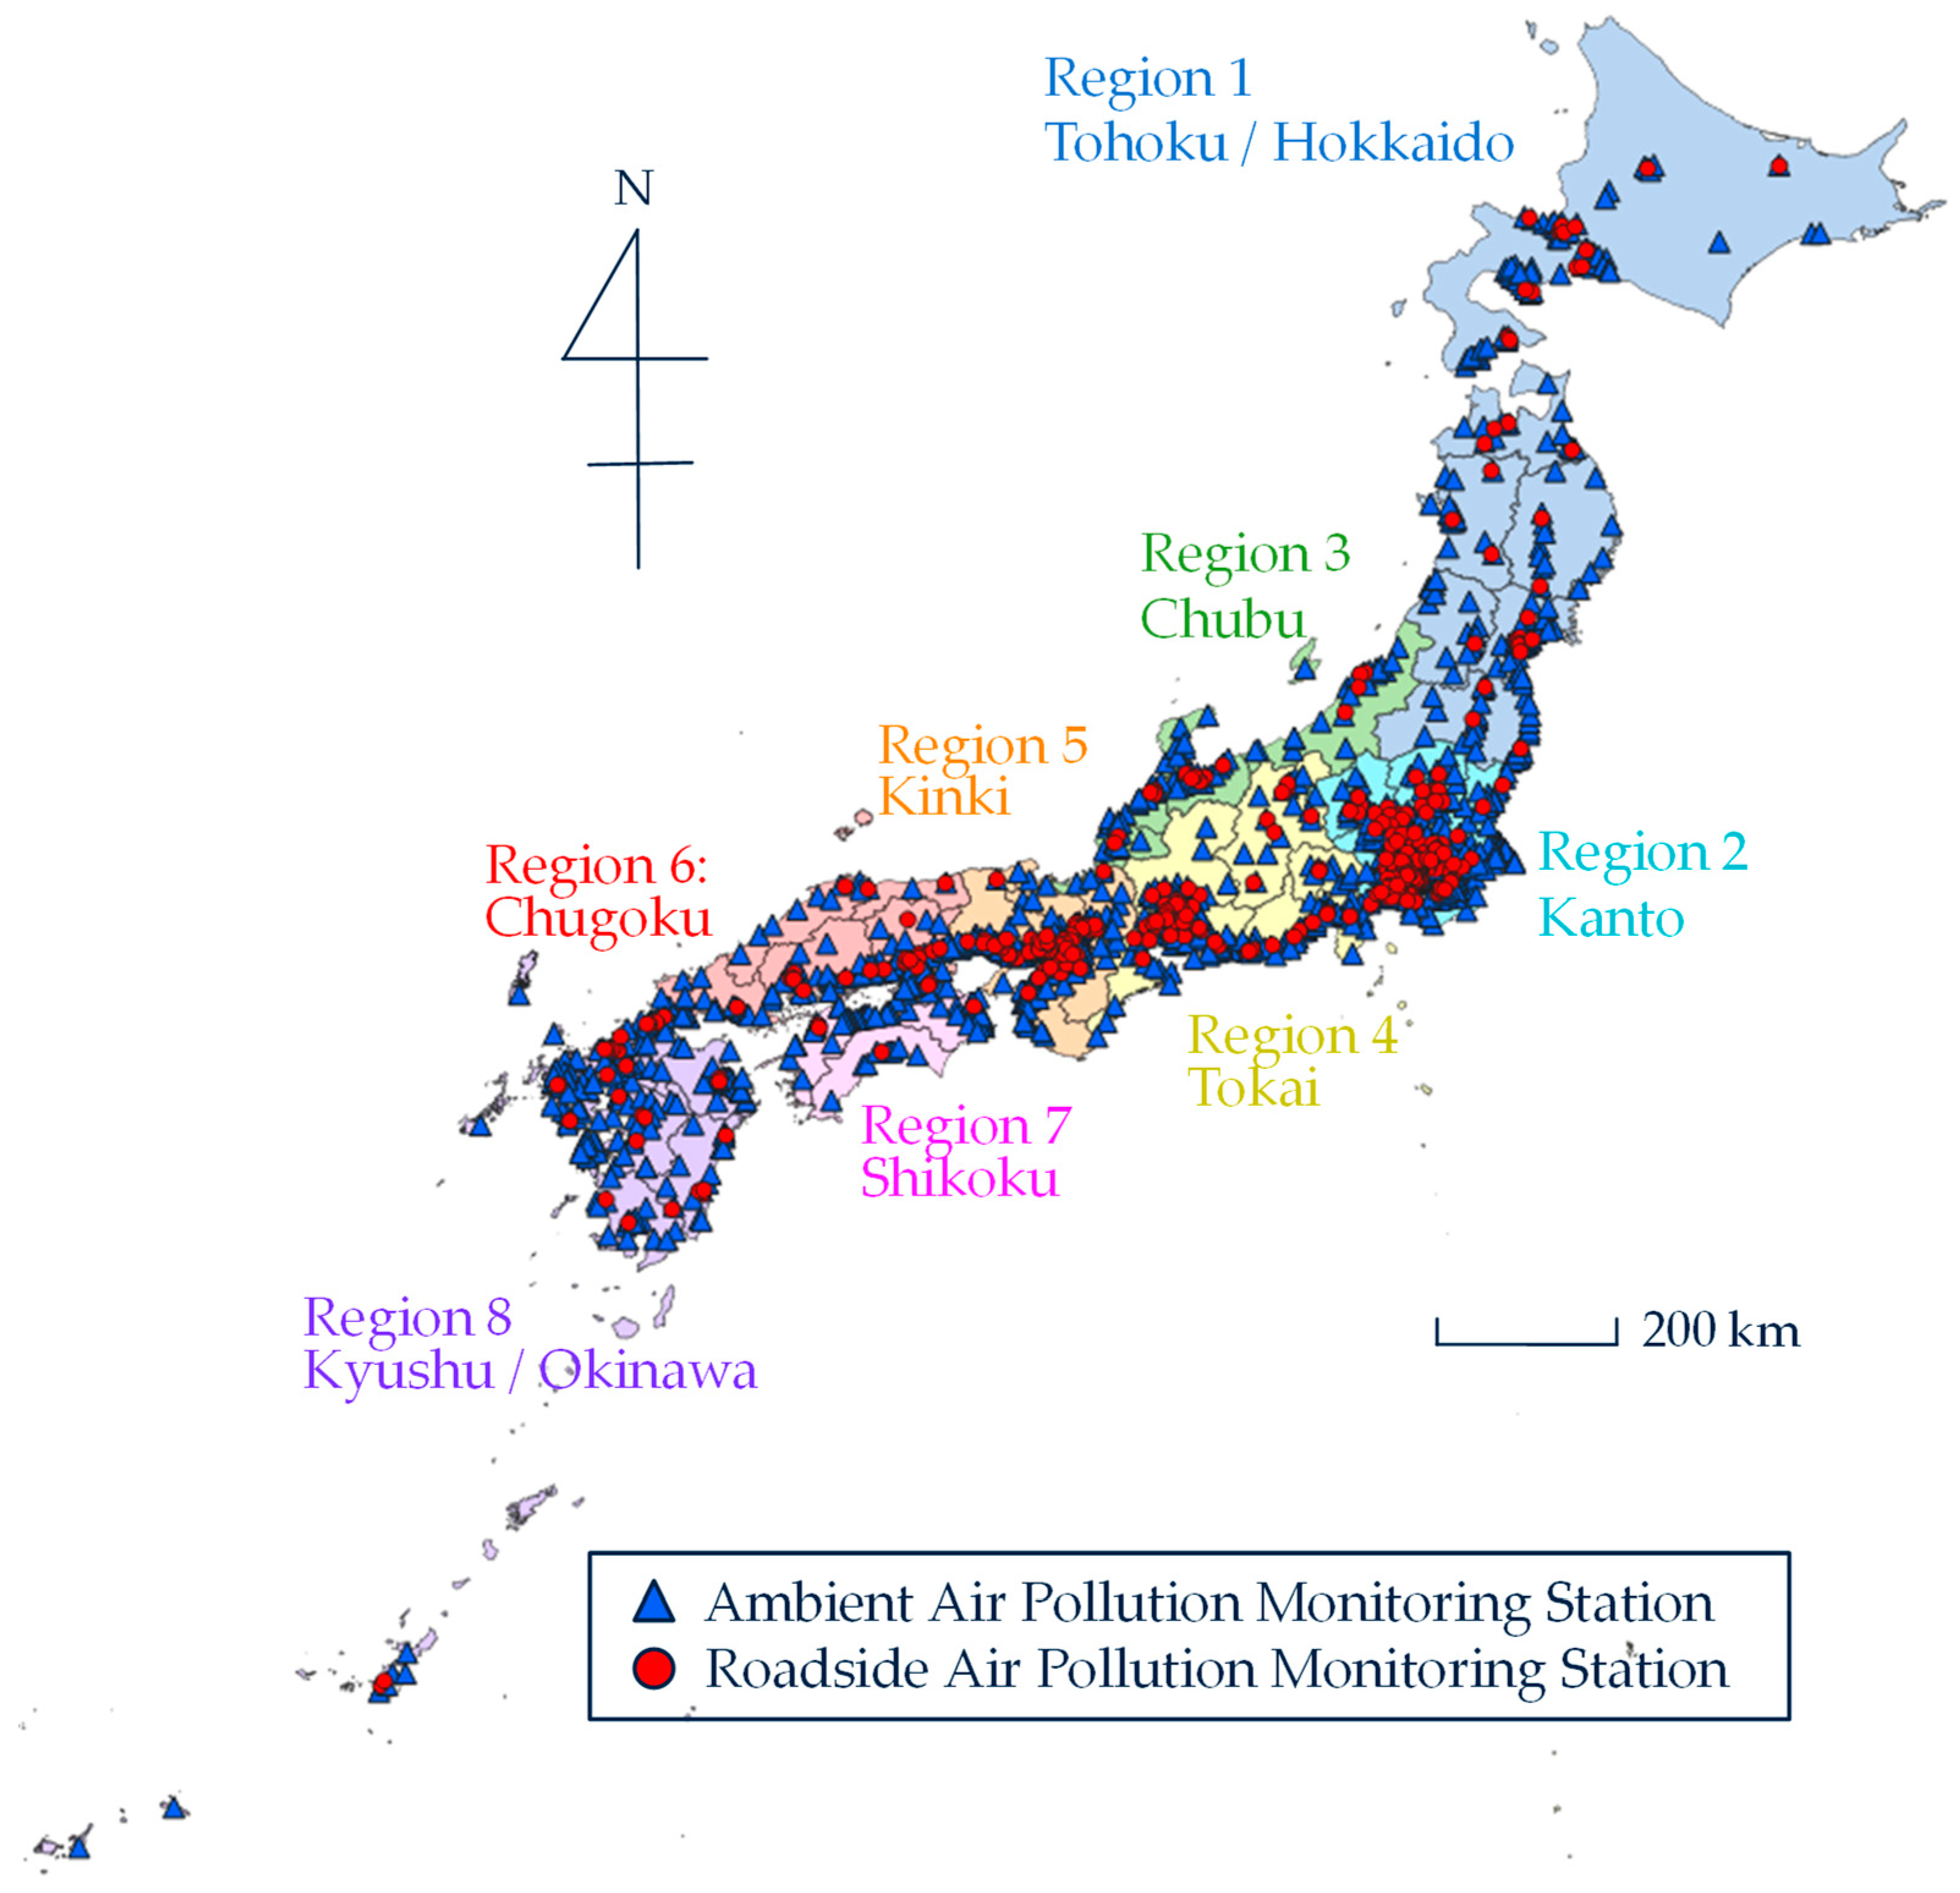
2. Materials and Methods
3. Results and Discussion
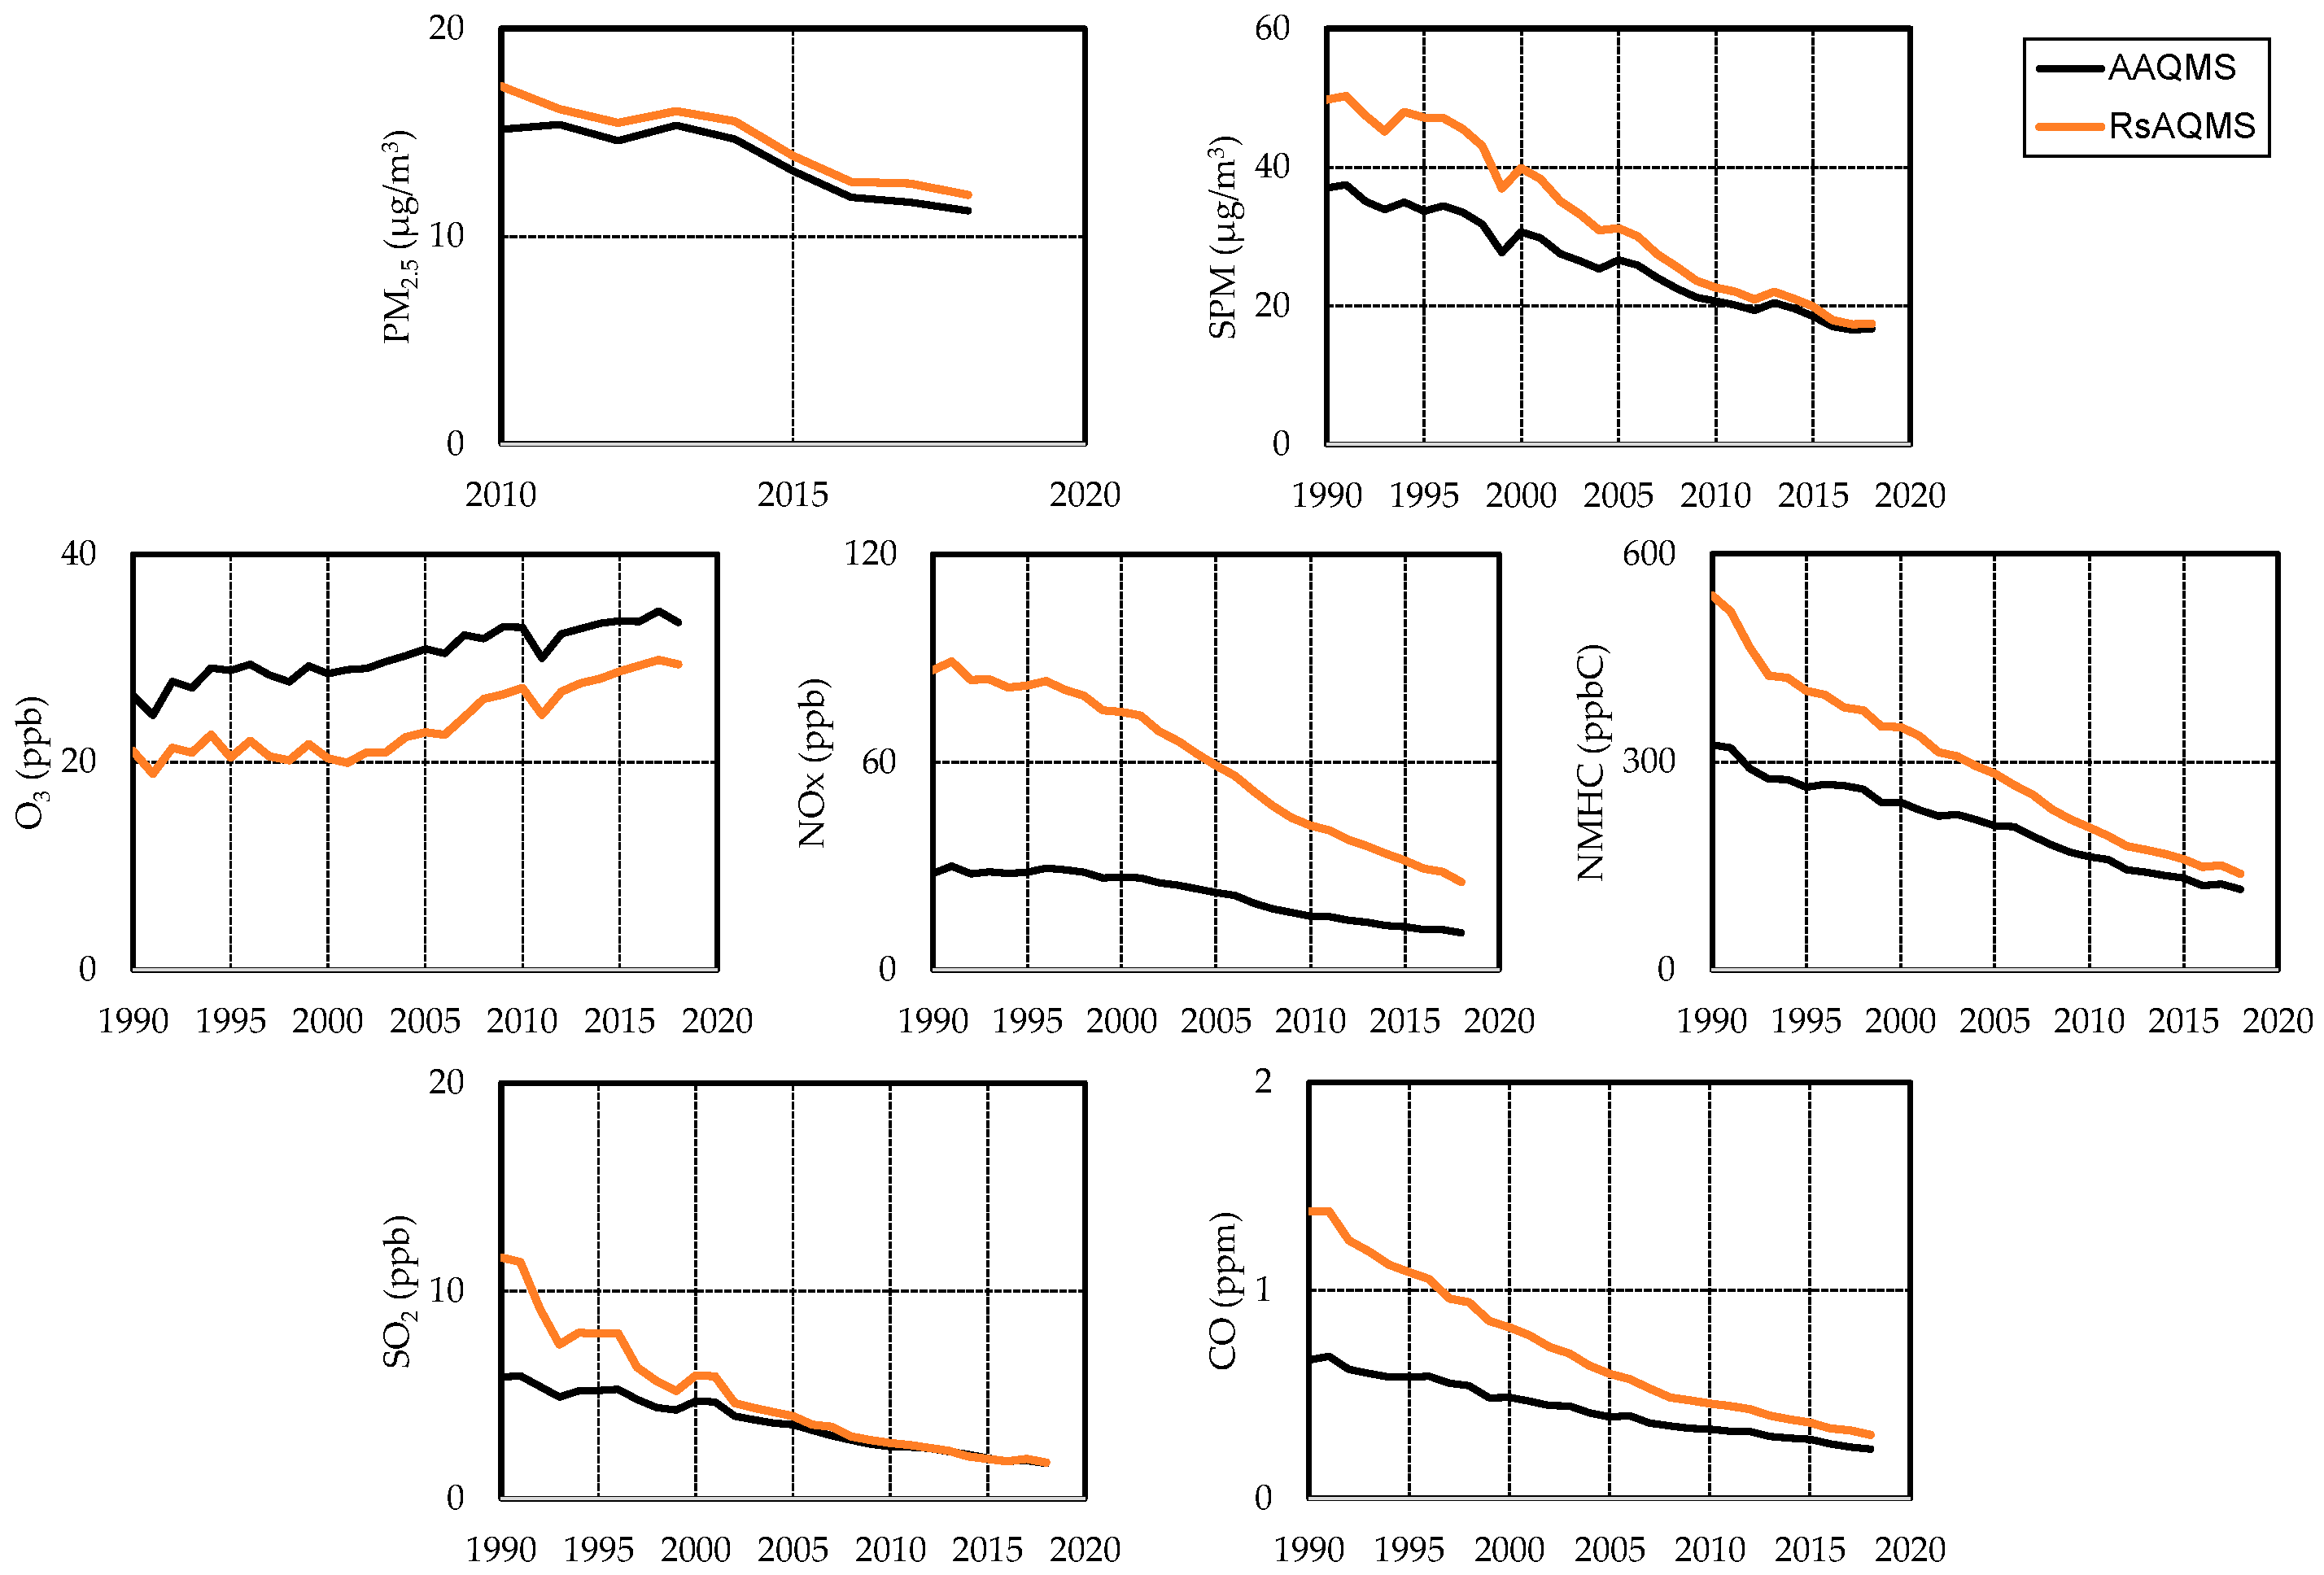
3.1. General Characteristics of Air Quality in Japan
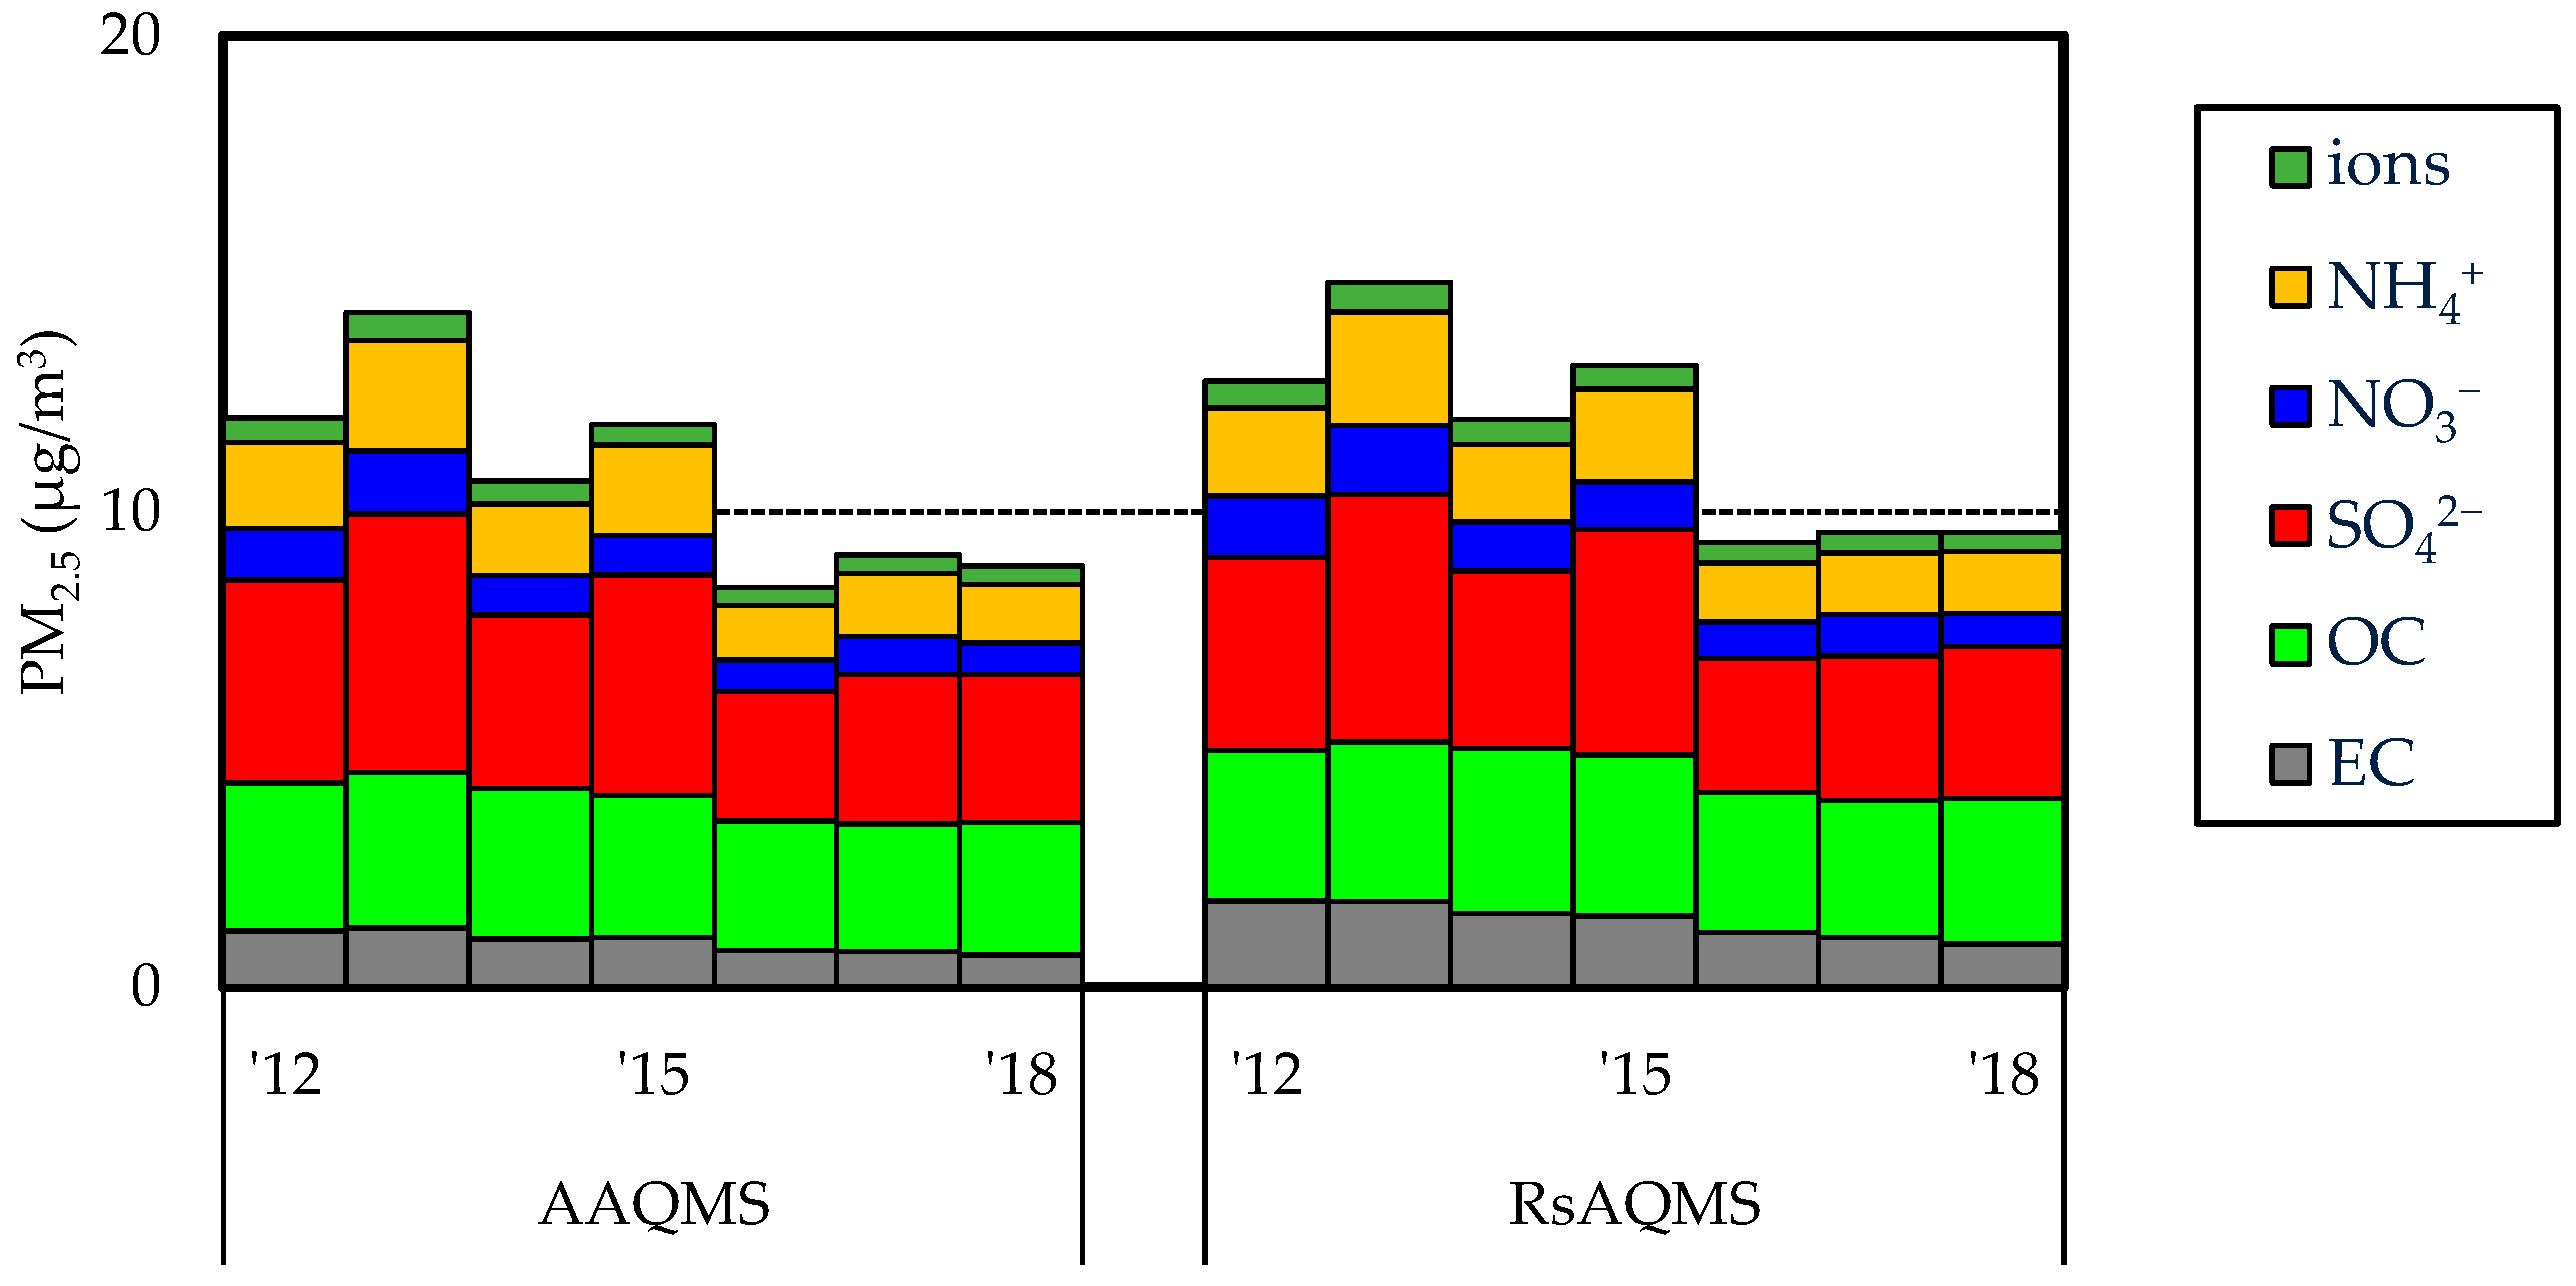
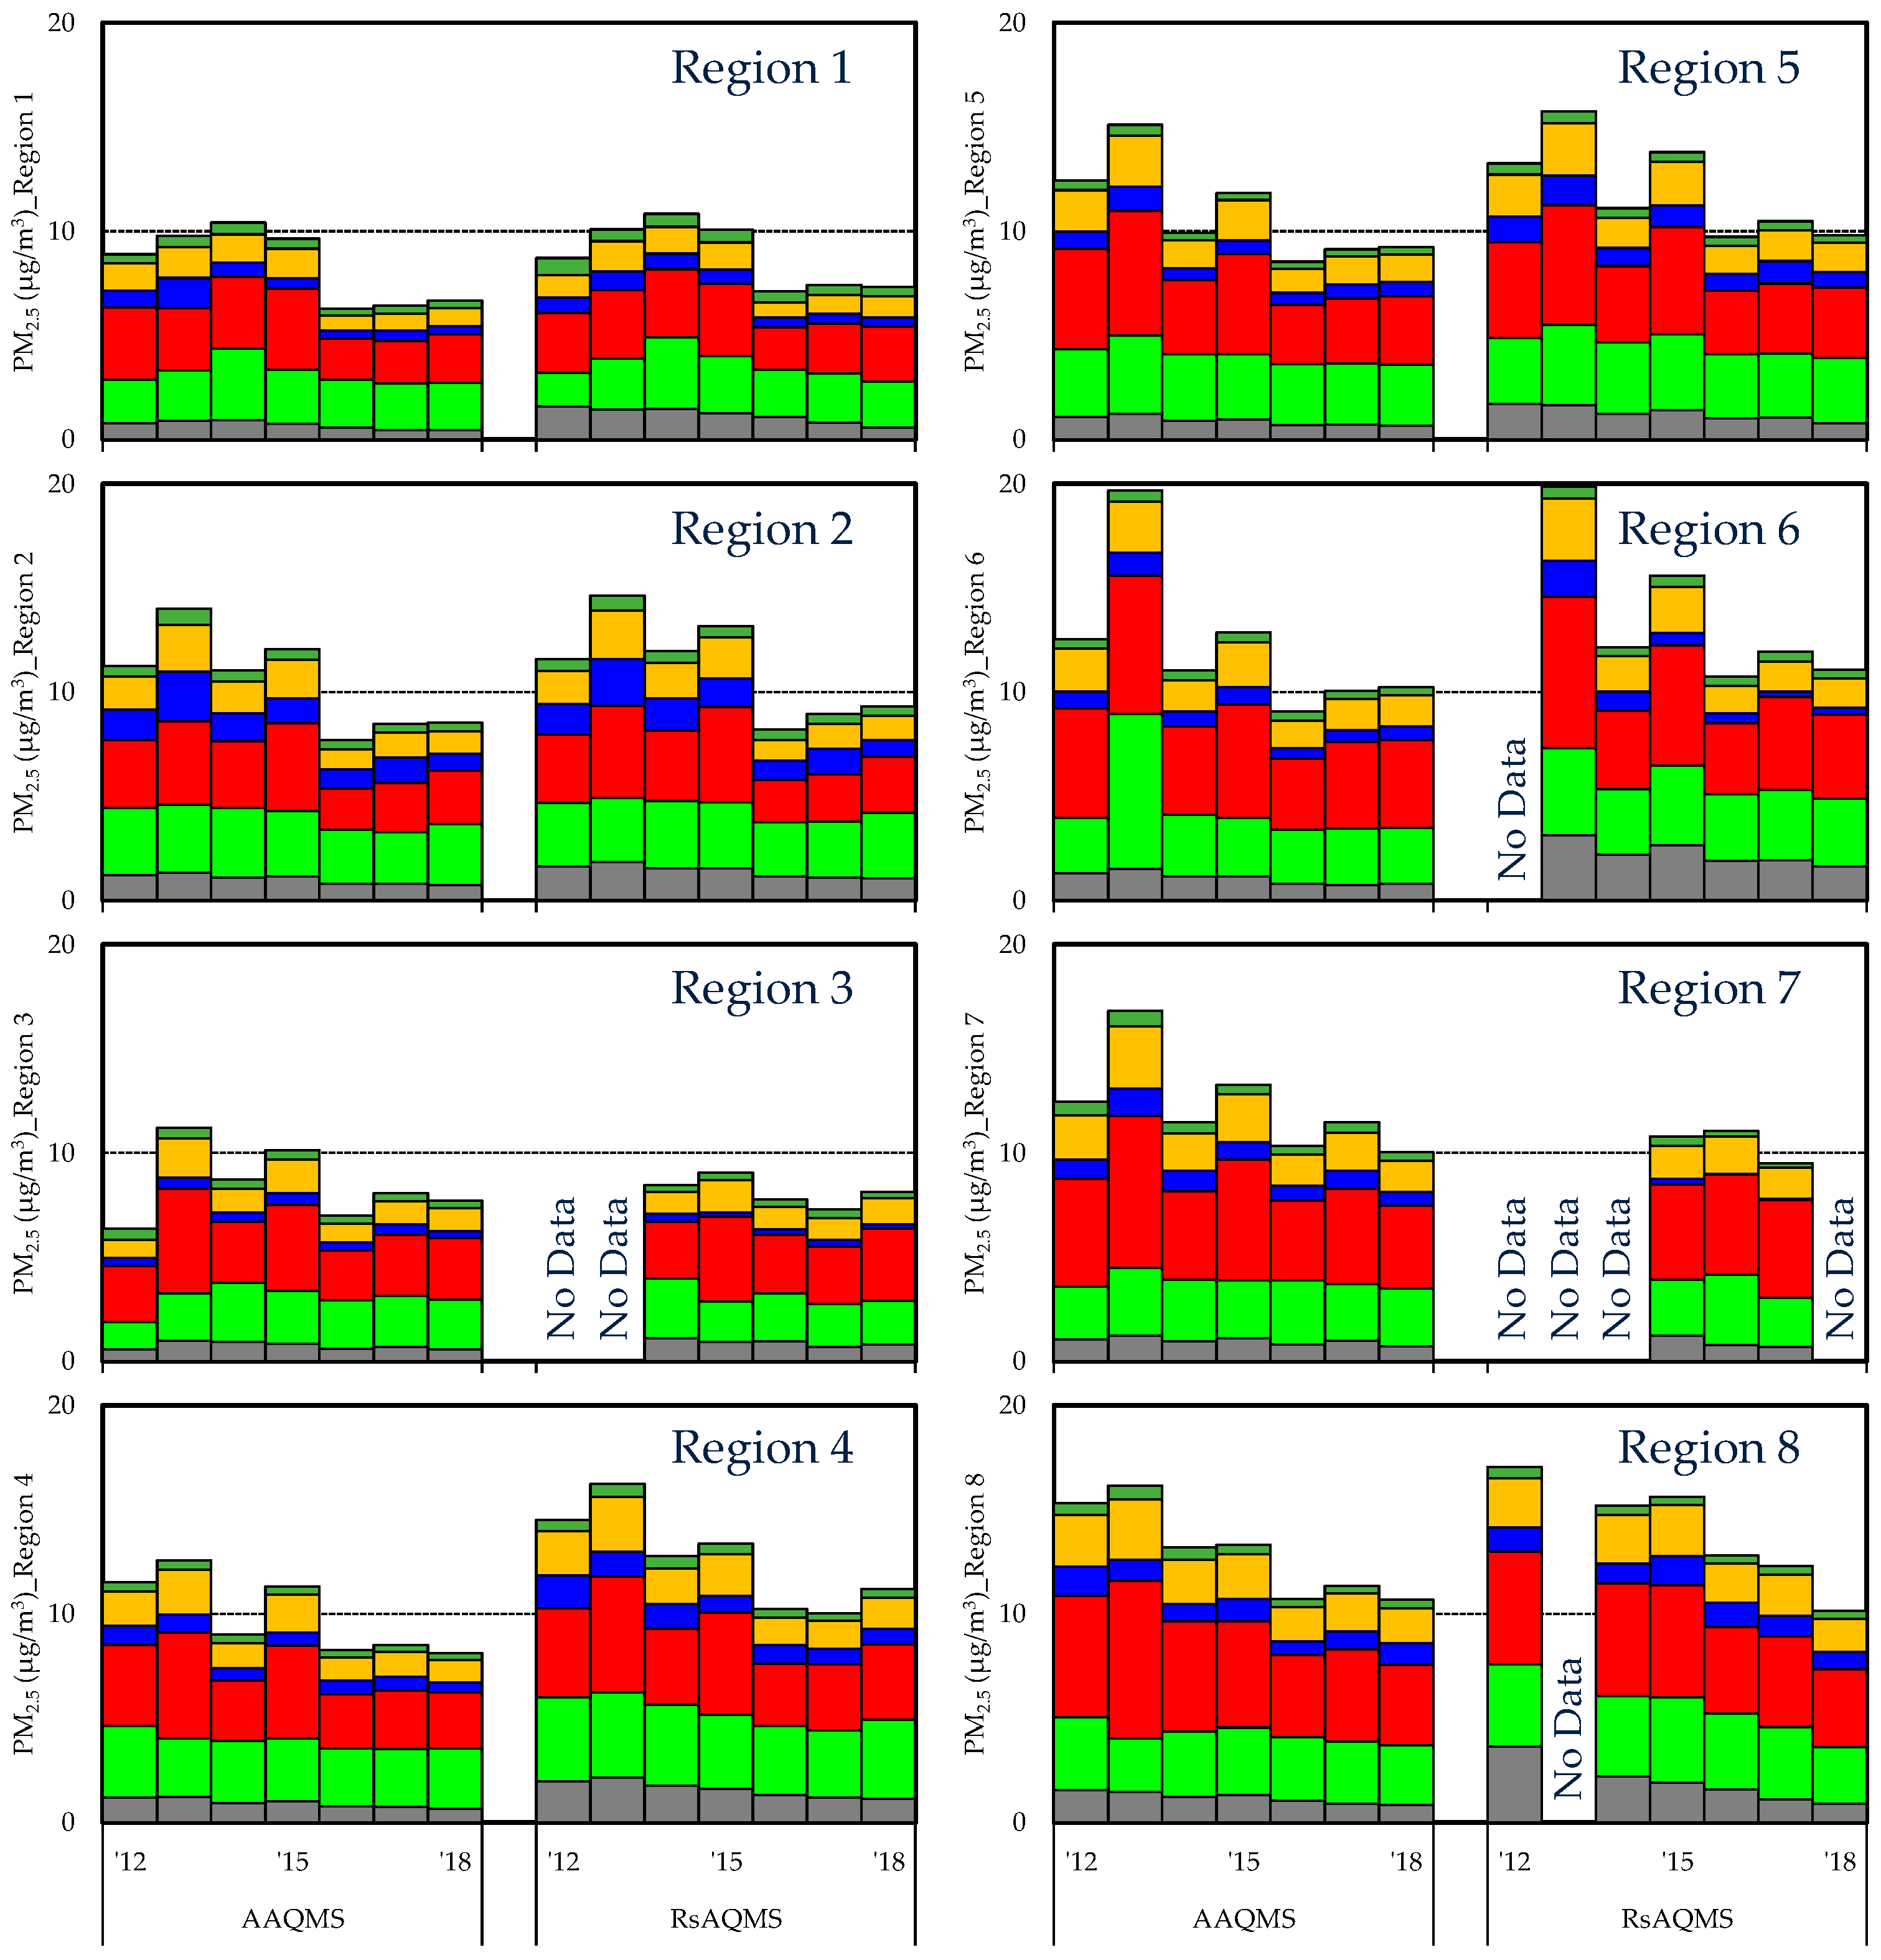
3.1.1. Particulate Matter (PM2.5, Suspended Particulate Matter (SPM))
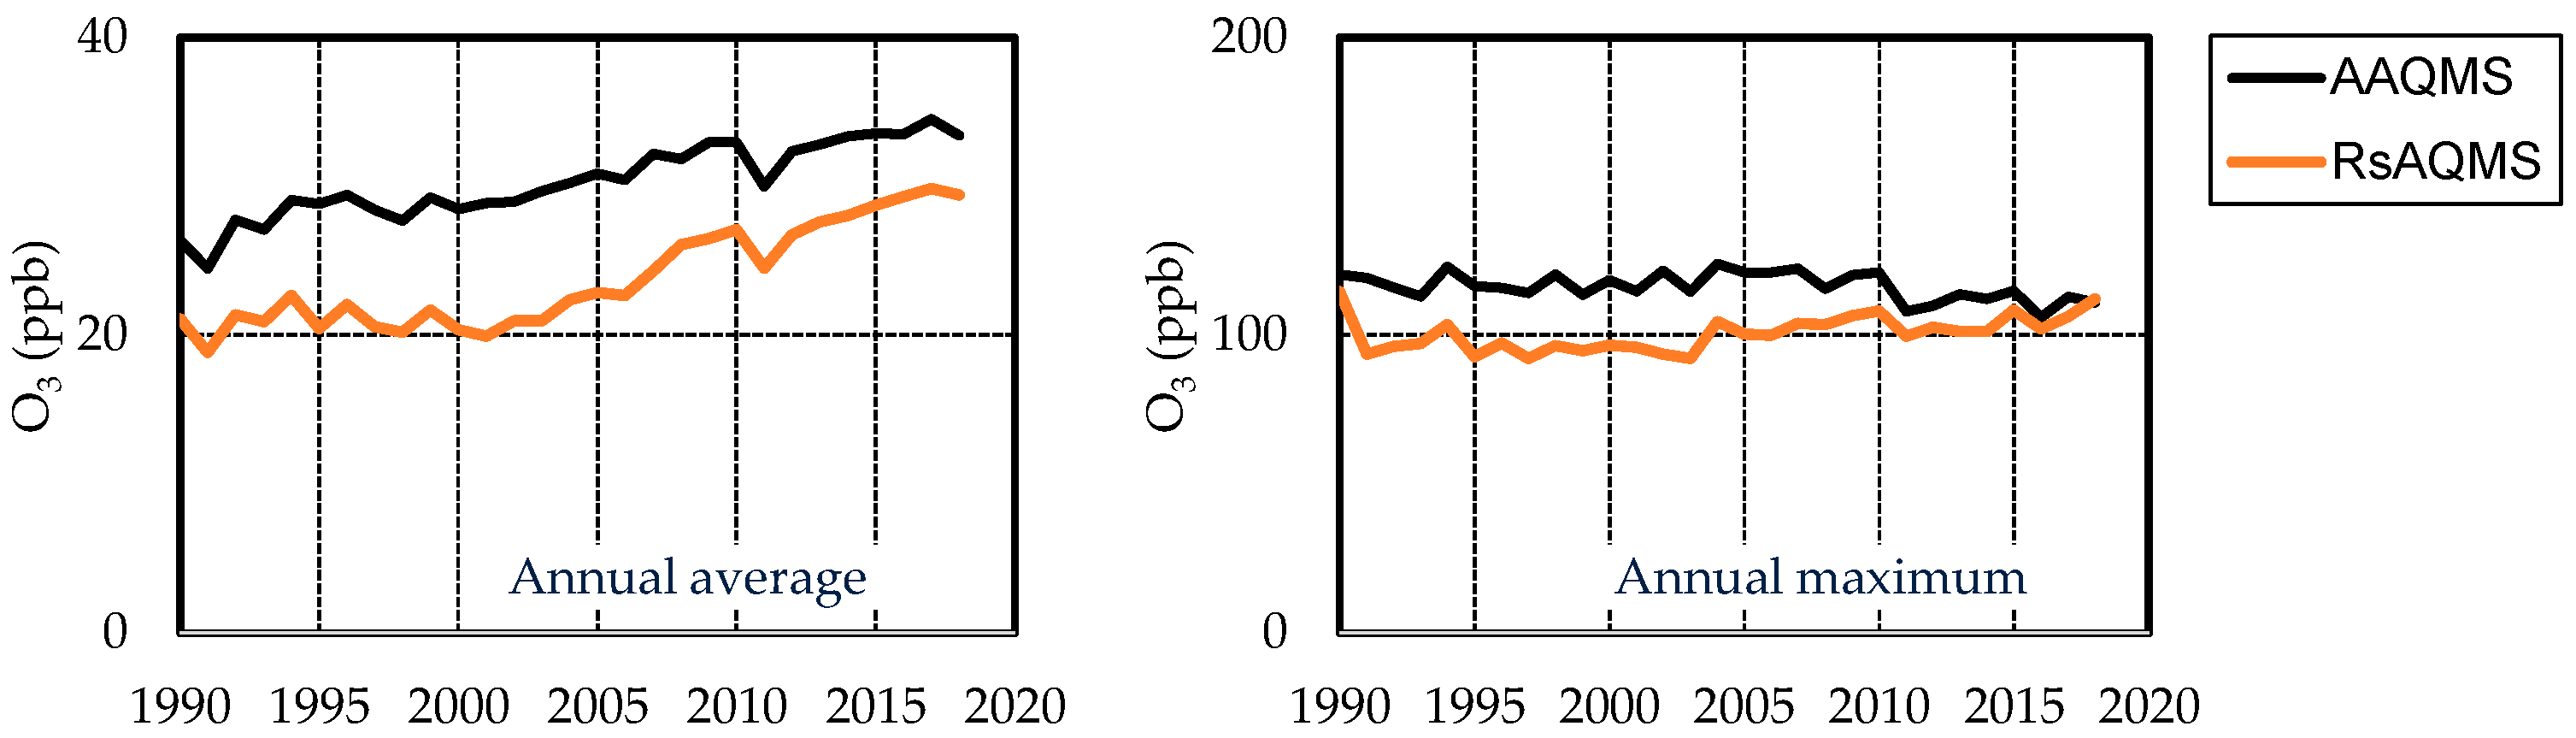
3.1.2. Ozone and Related Substances (Nitrogen Oxides, Non-Methane Hydrocarbons)
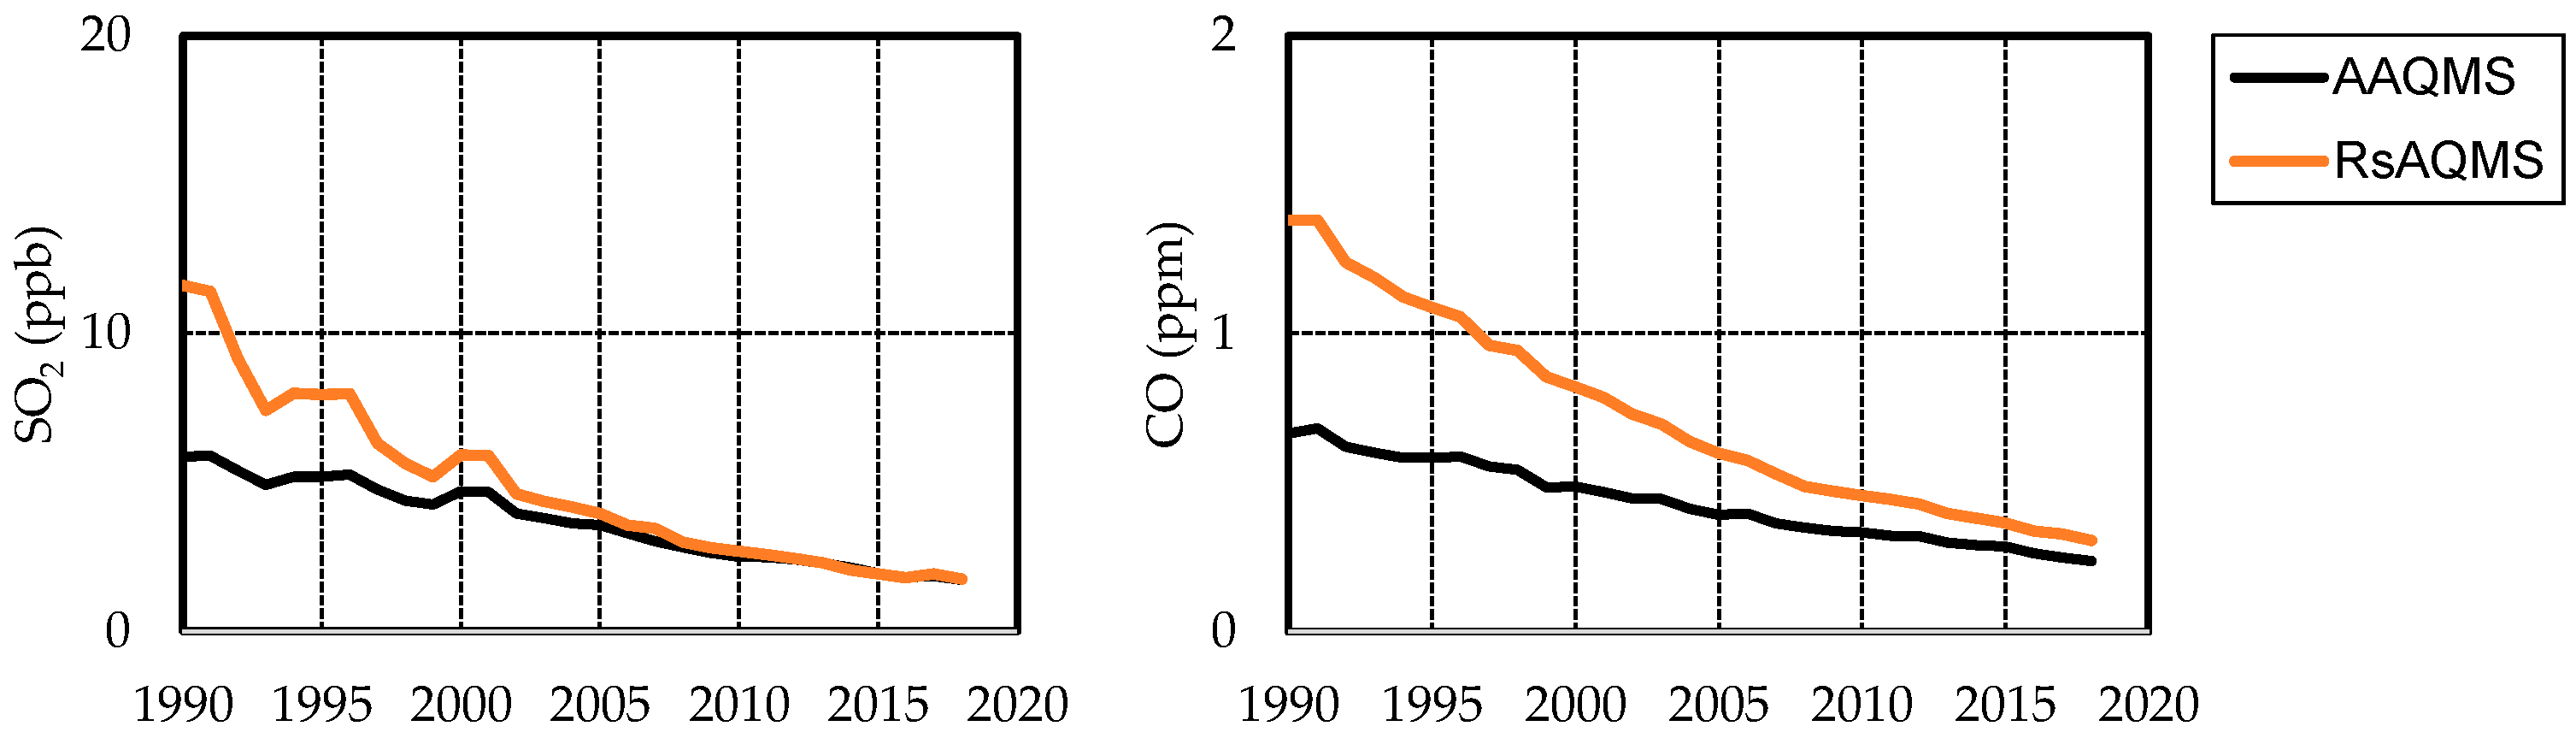
3.1.3. Other Pollutants (SO2, CO)
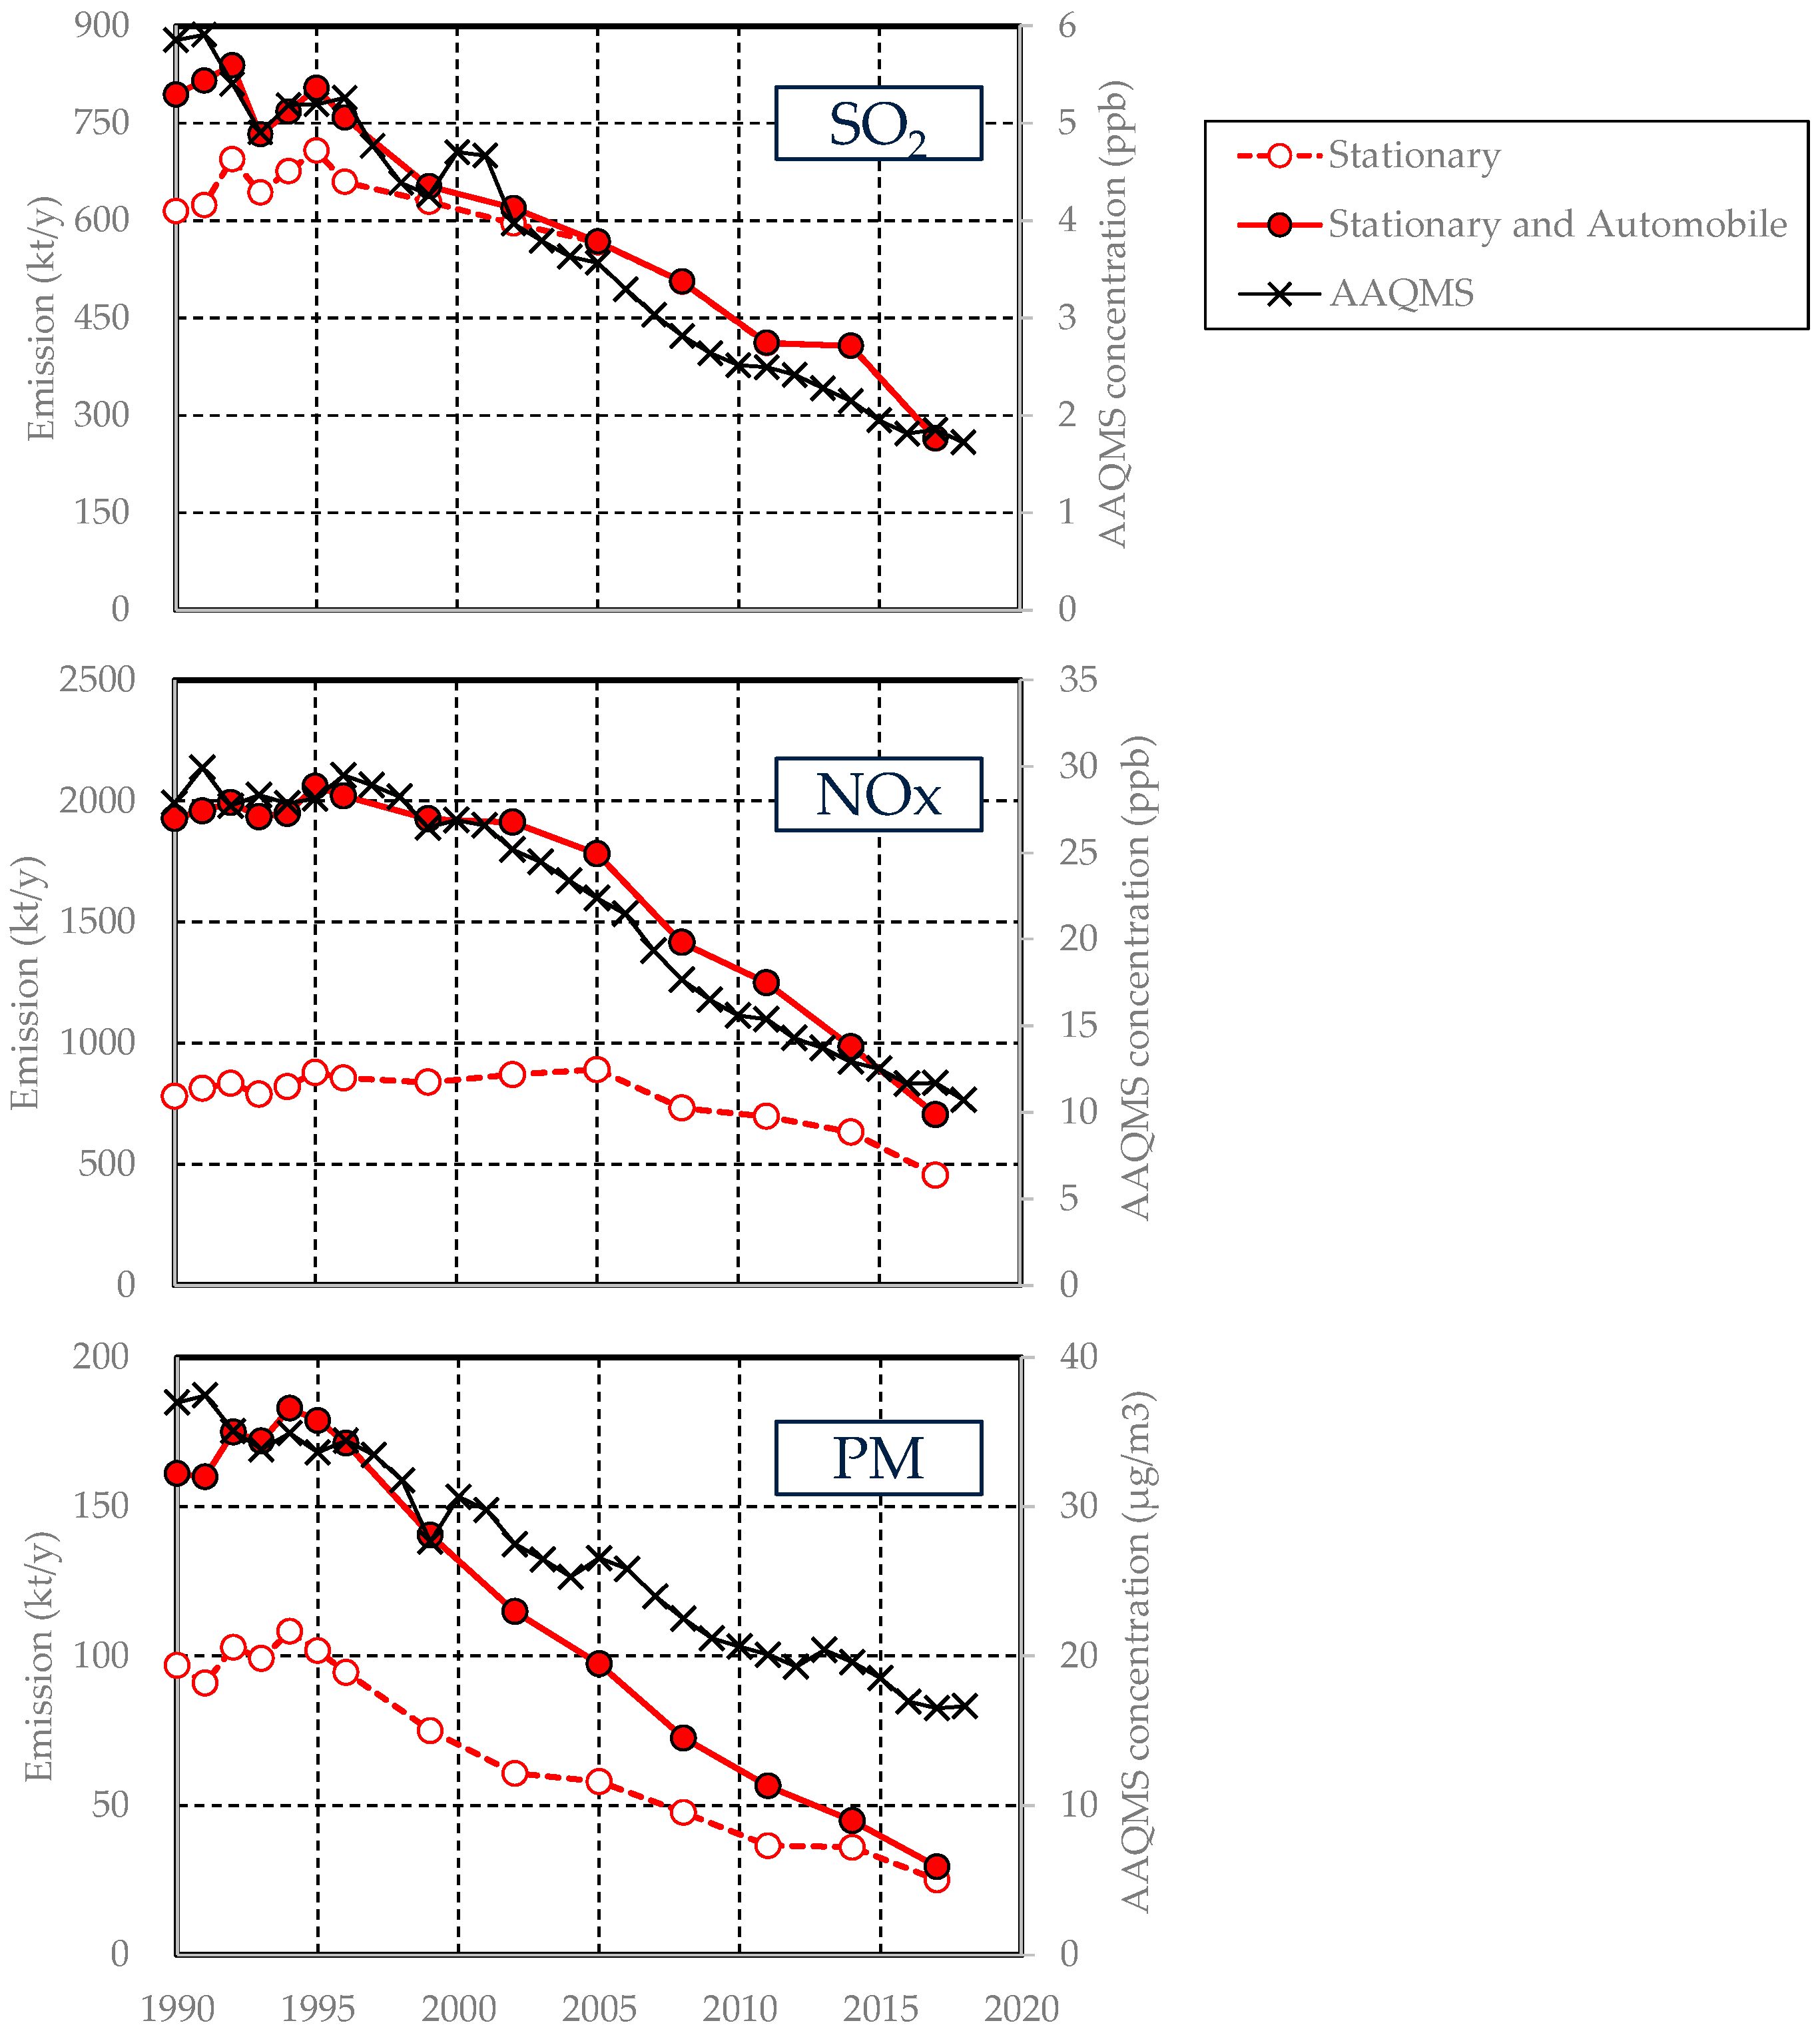
3.2. Intercomparison of Anthropogenic Emission Data and Air Quality
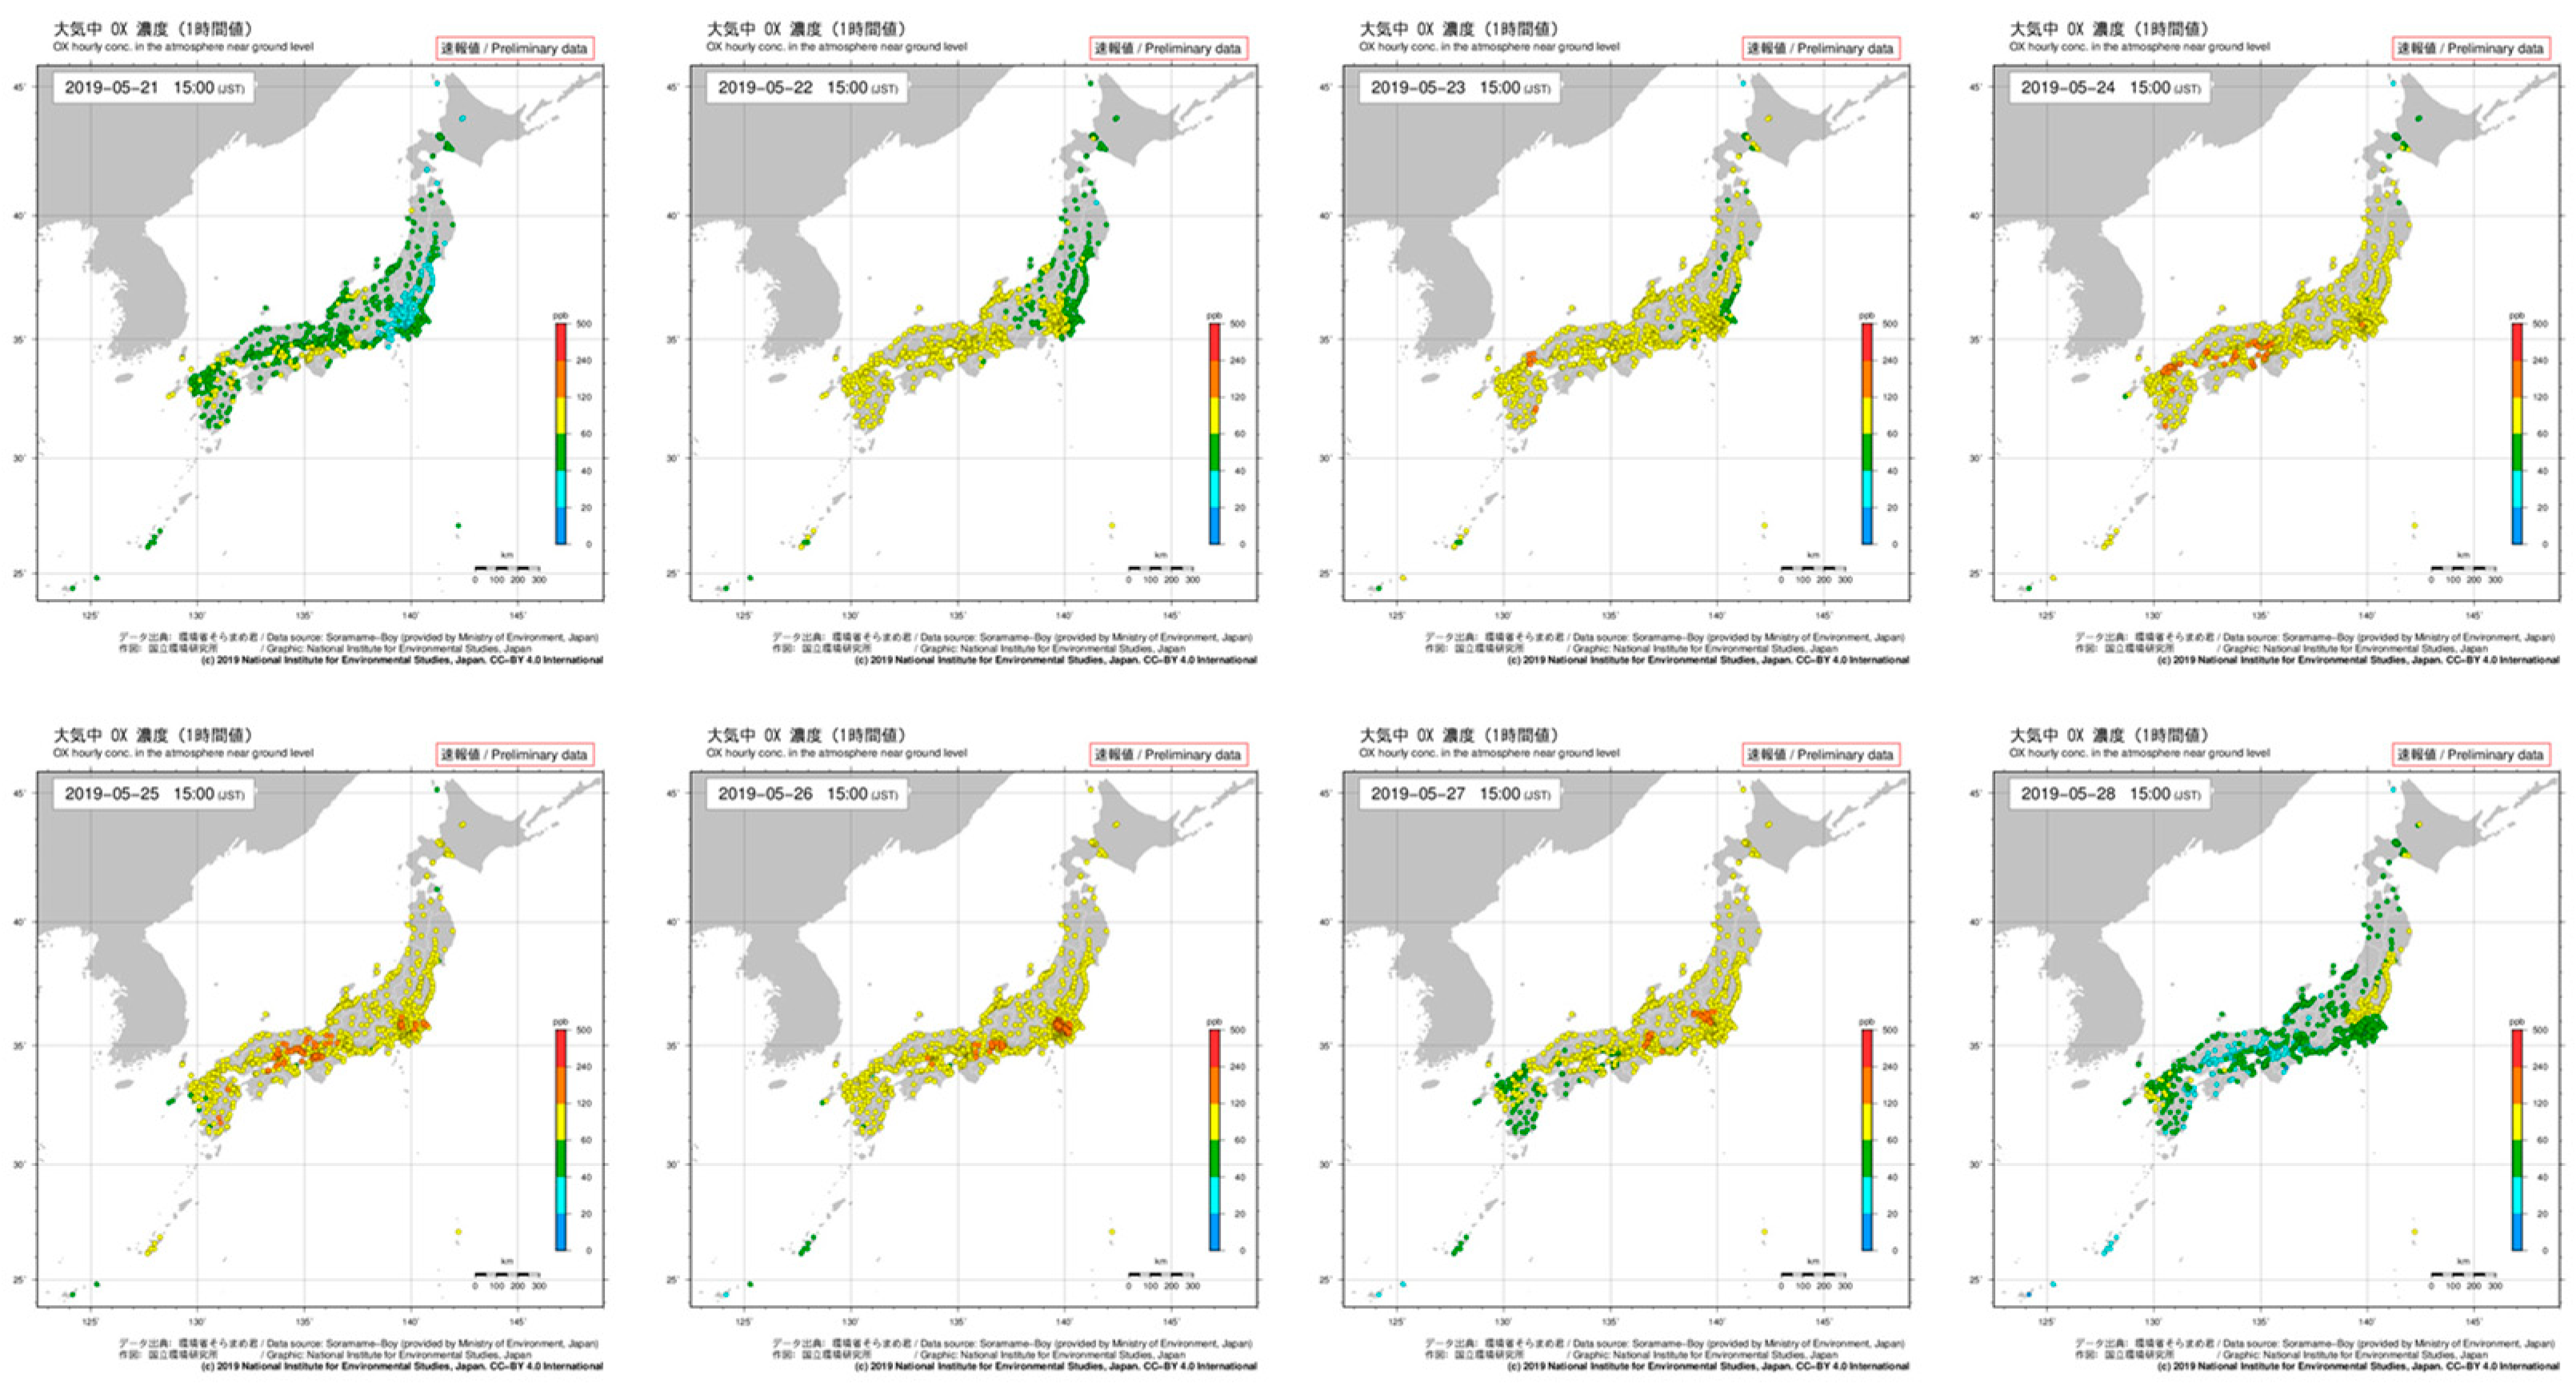
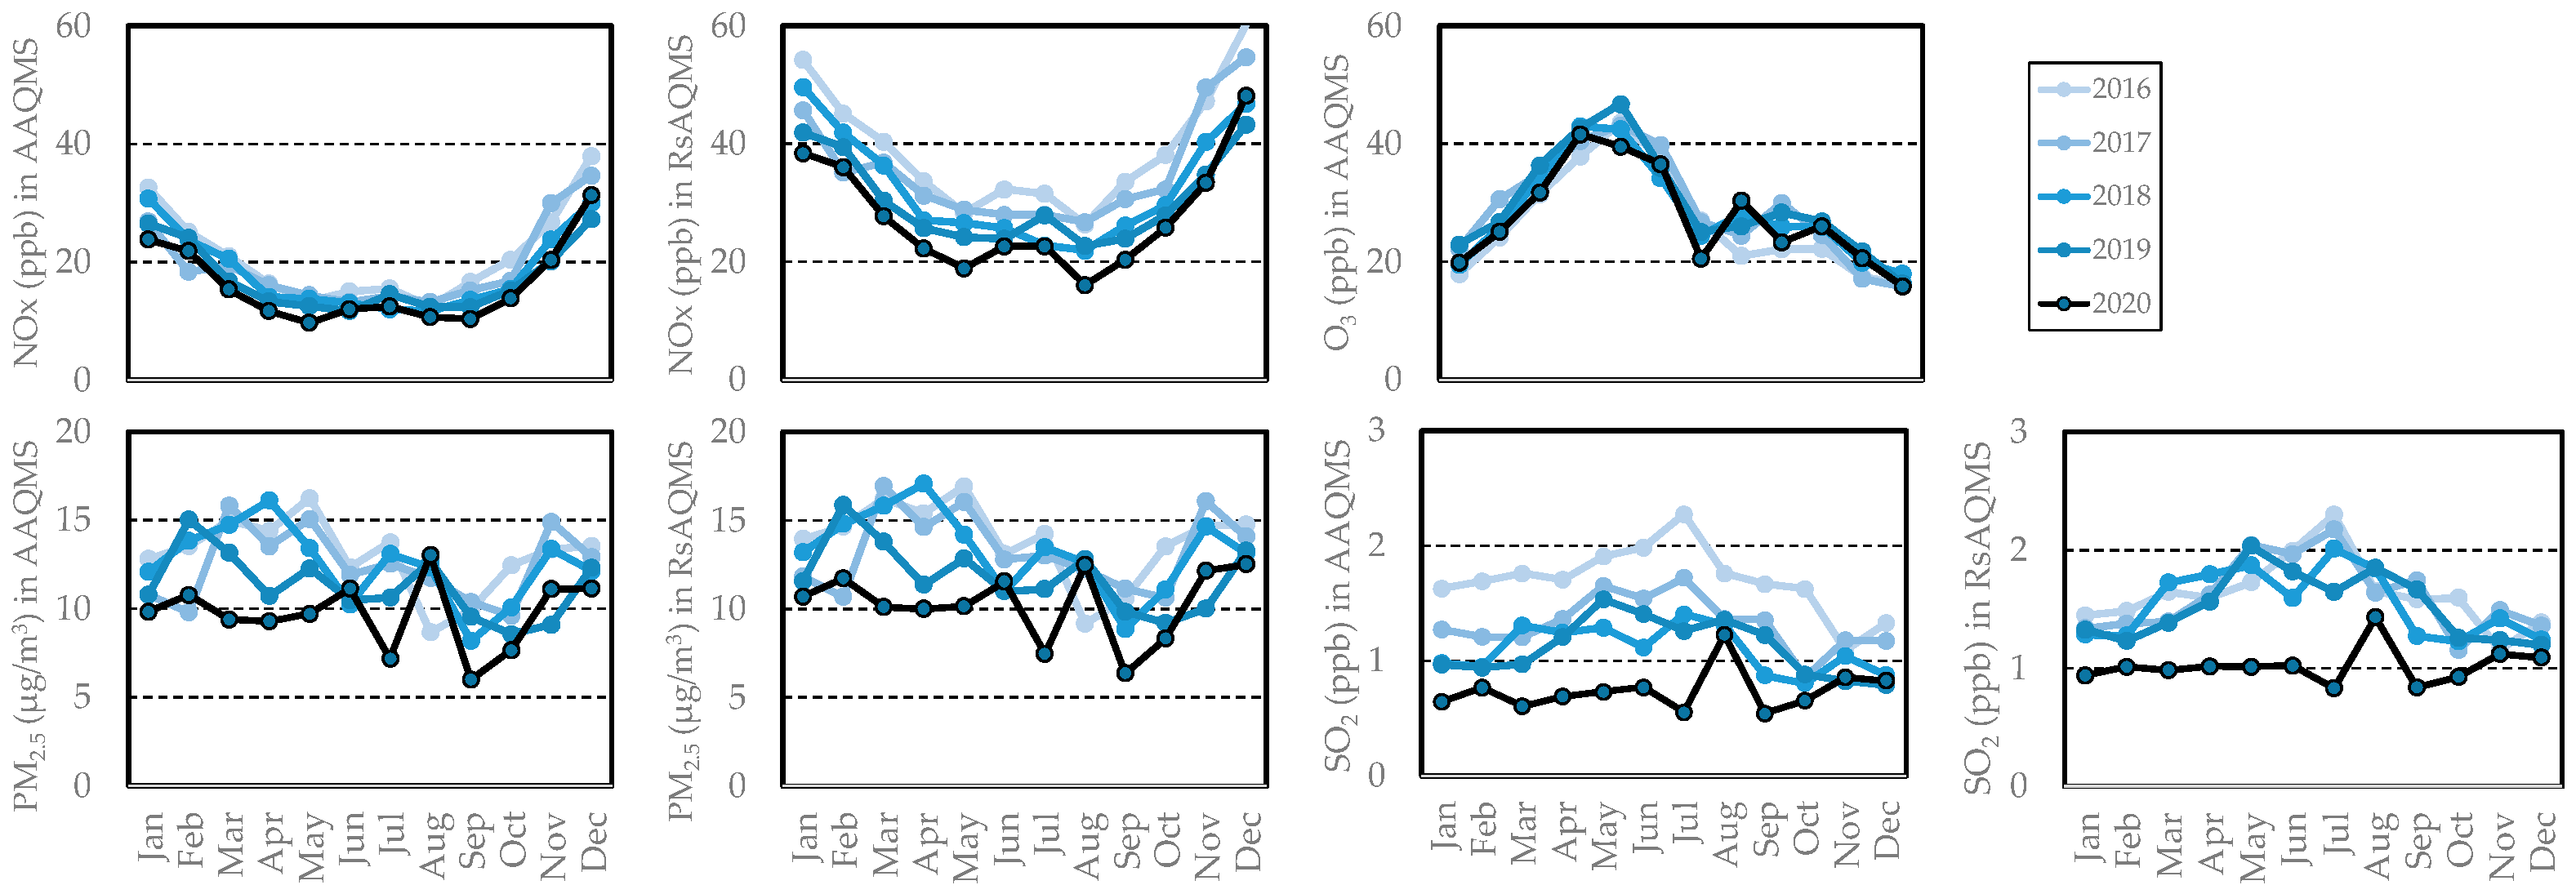
3.3. Air Quality Issues in Japan after 2019
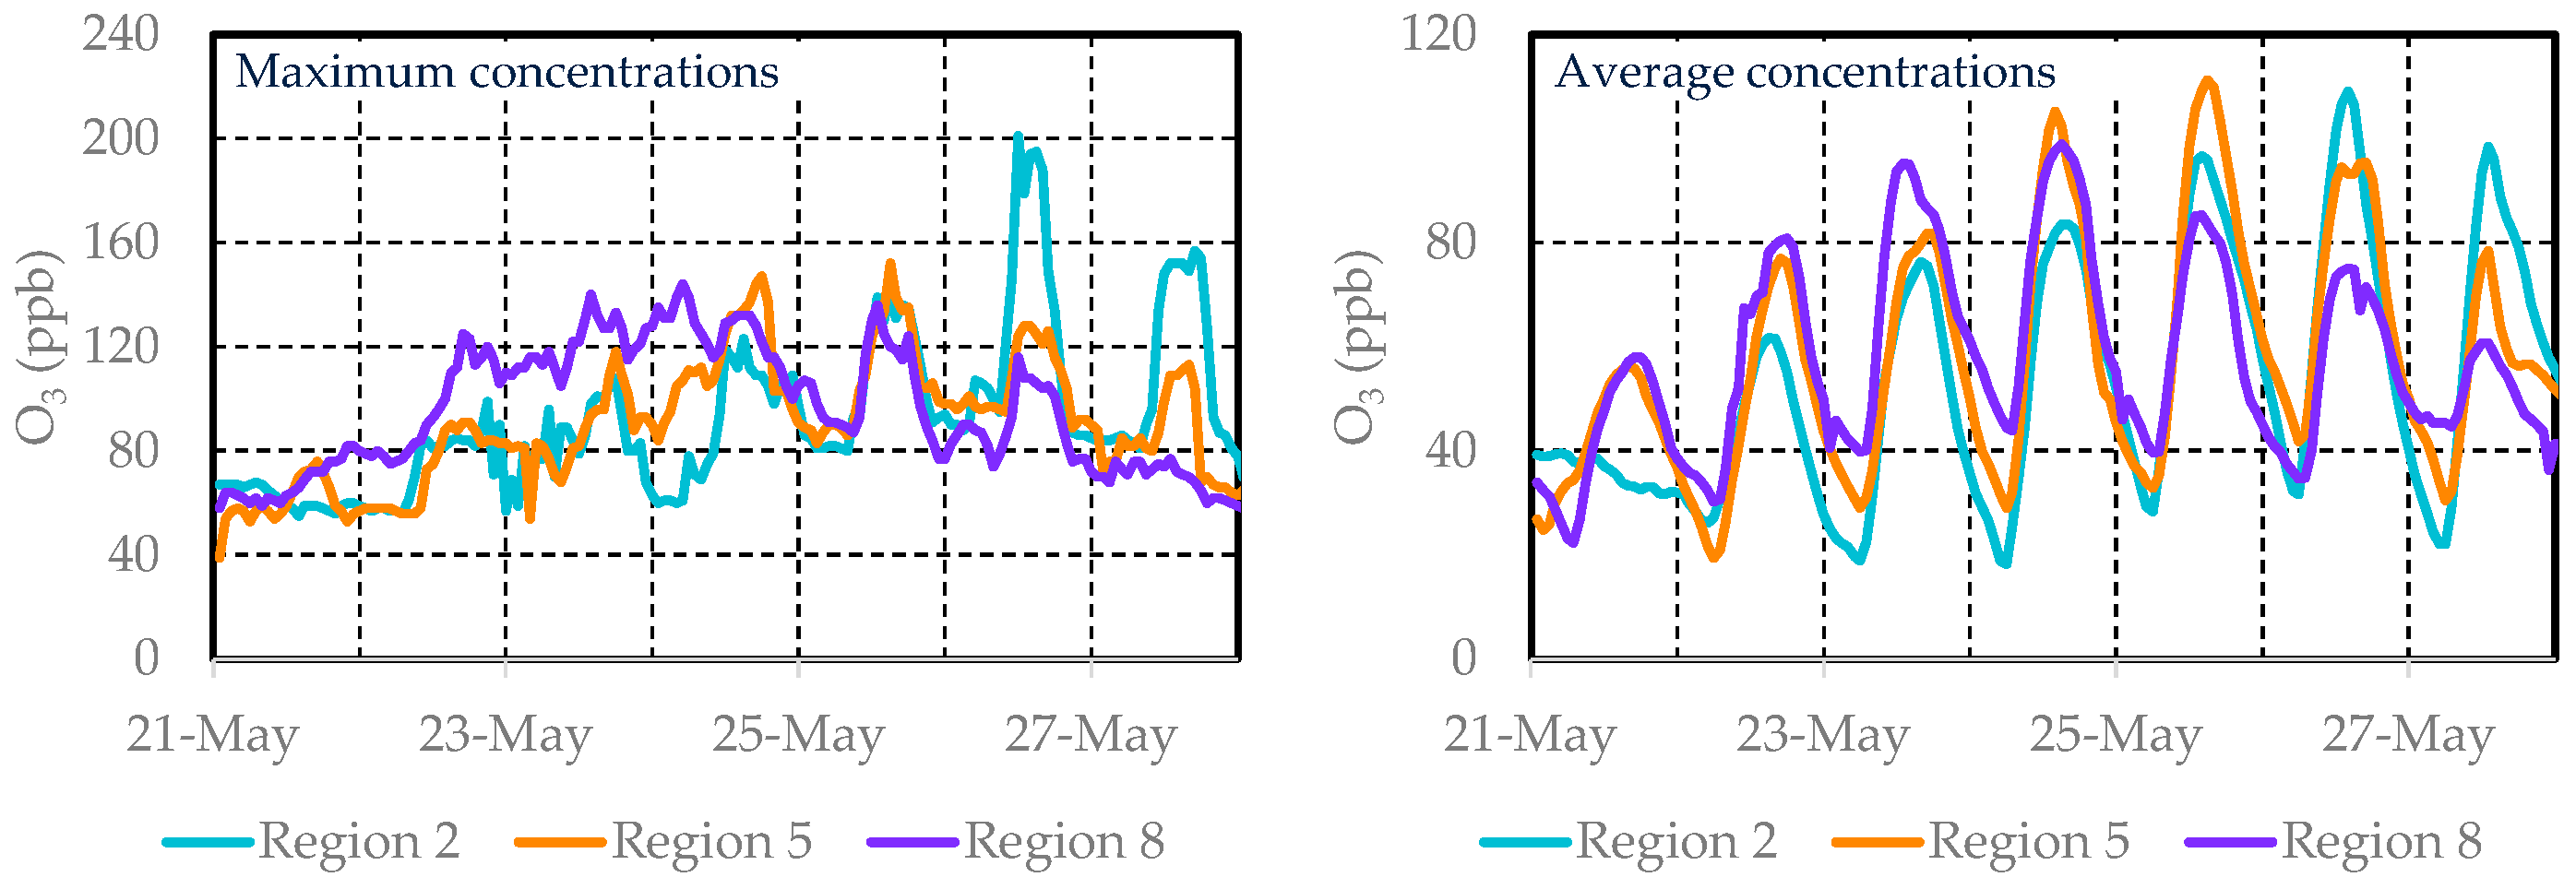
3.3.1. Widespread High Concentrations of Ozone (May 2019)
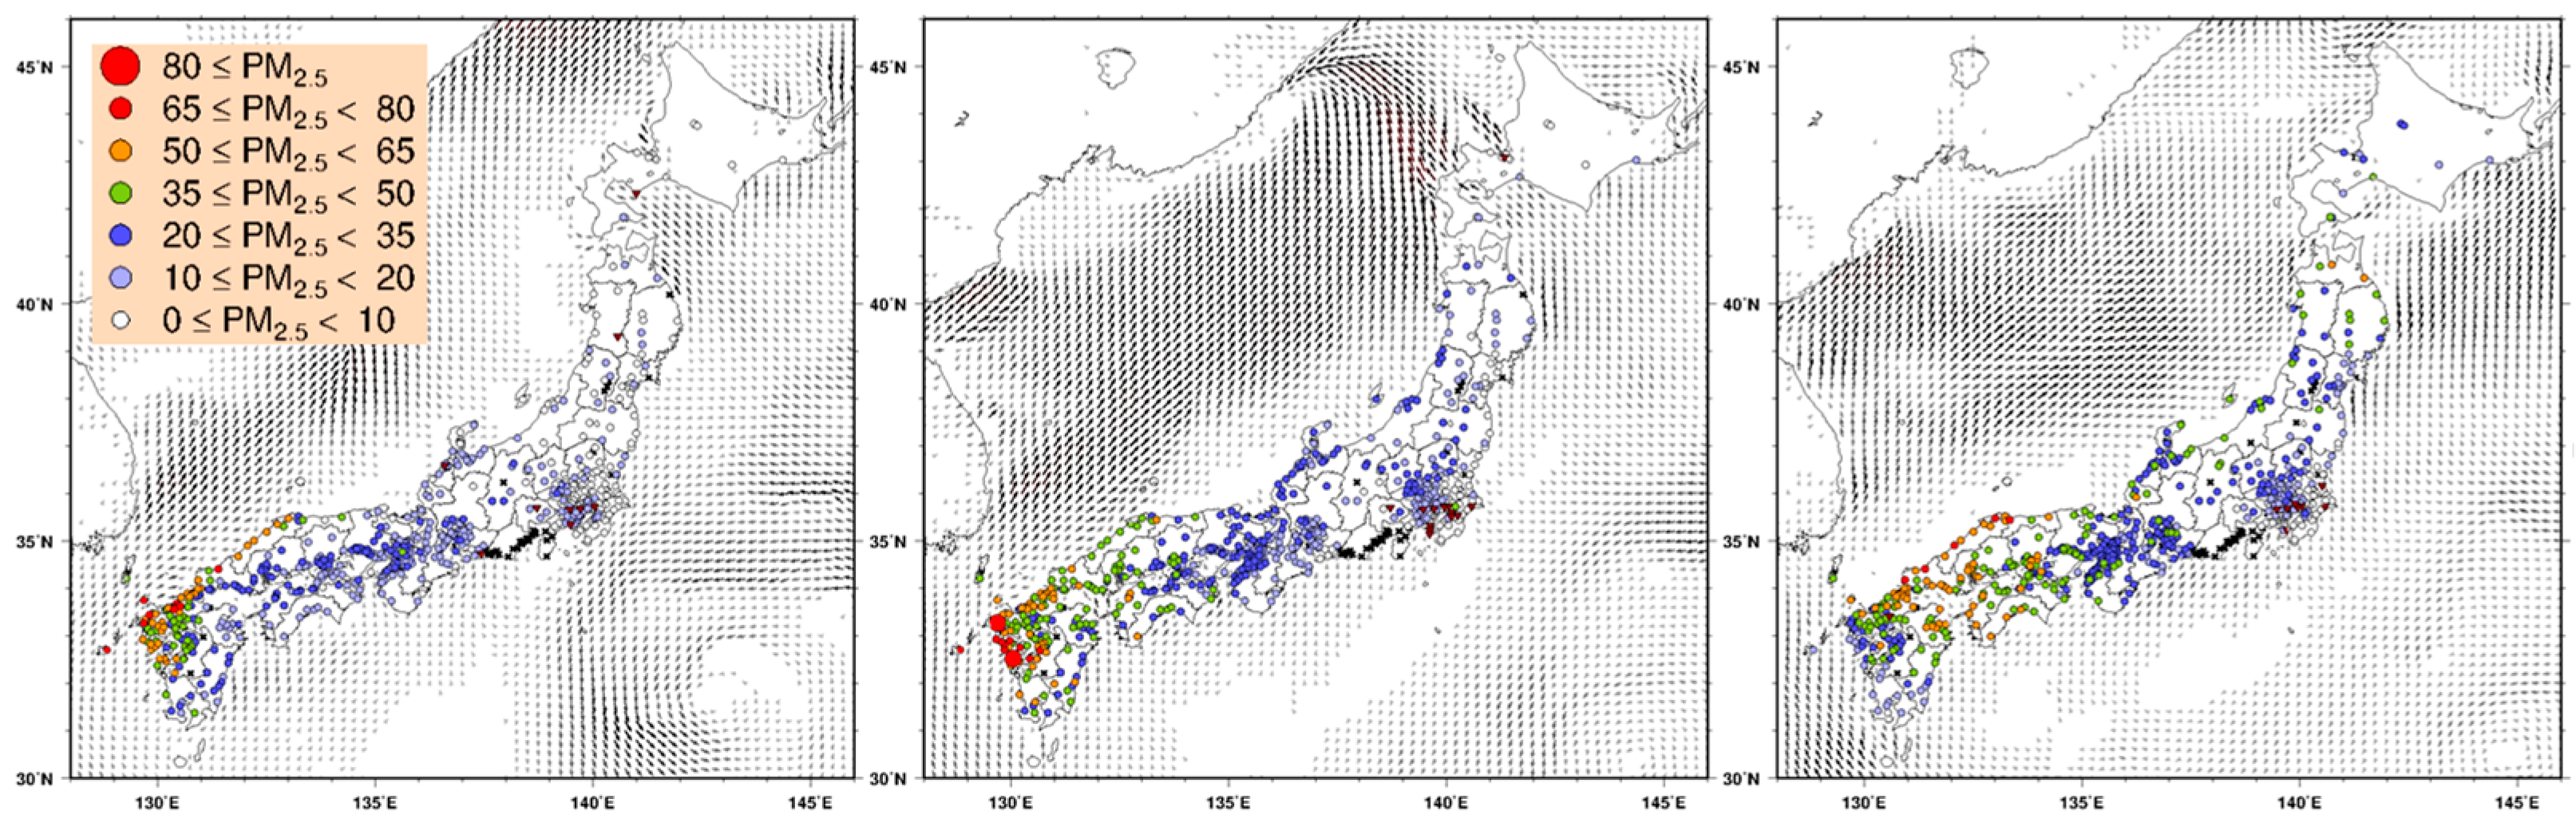
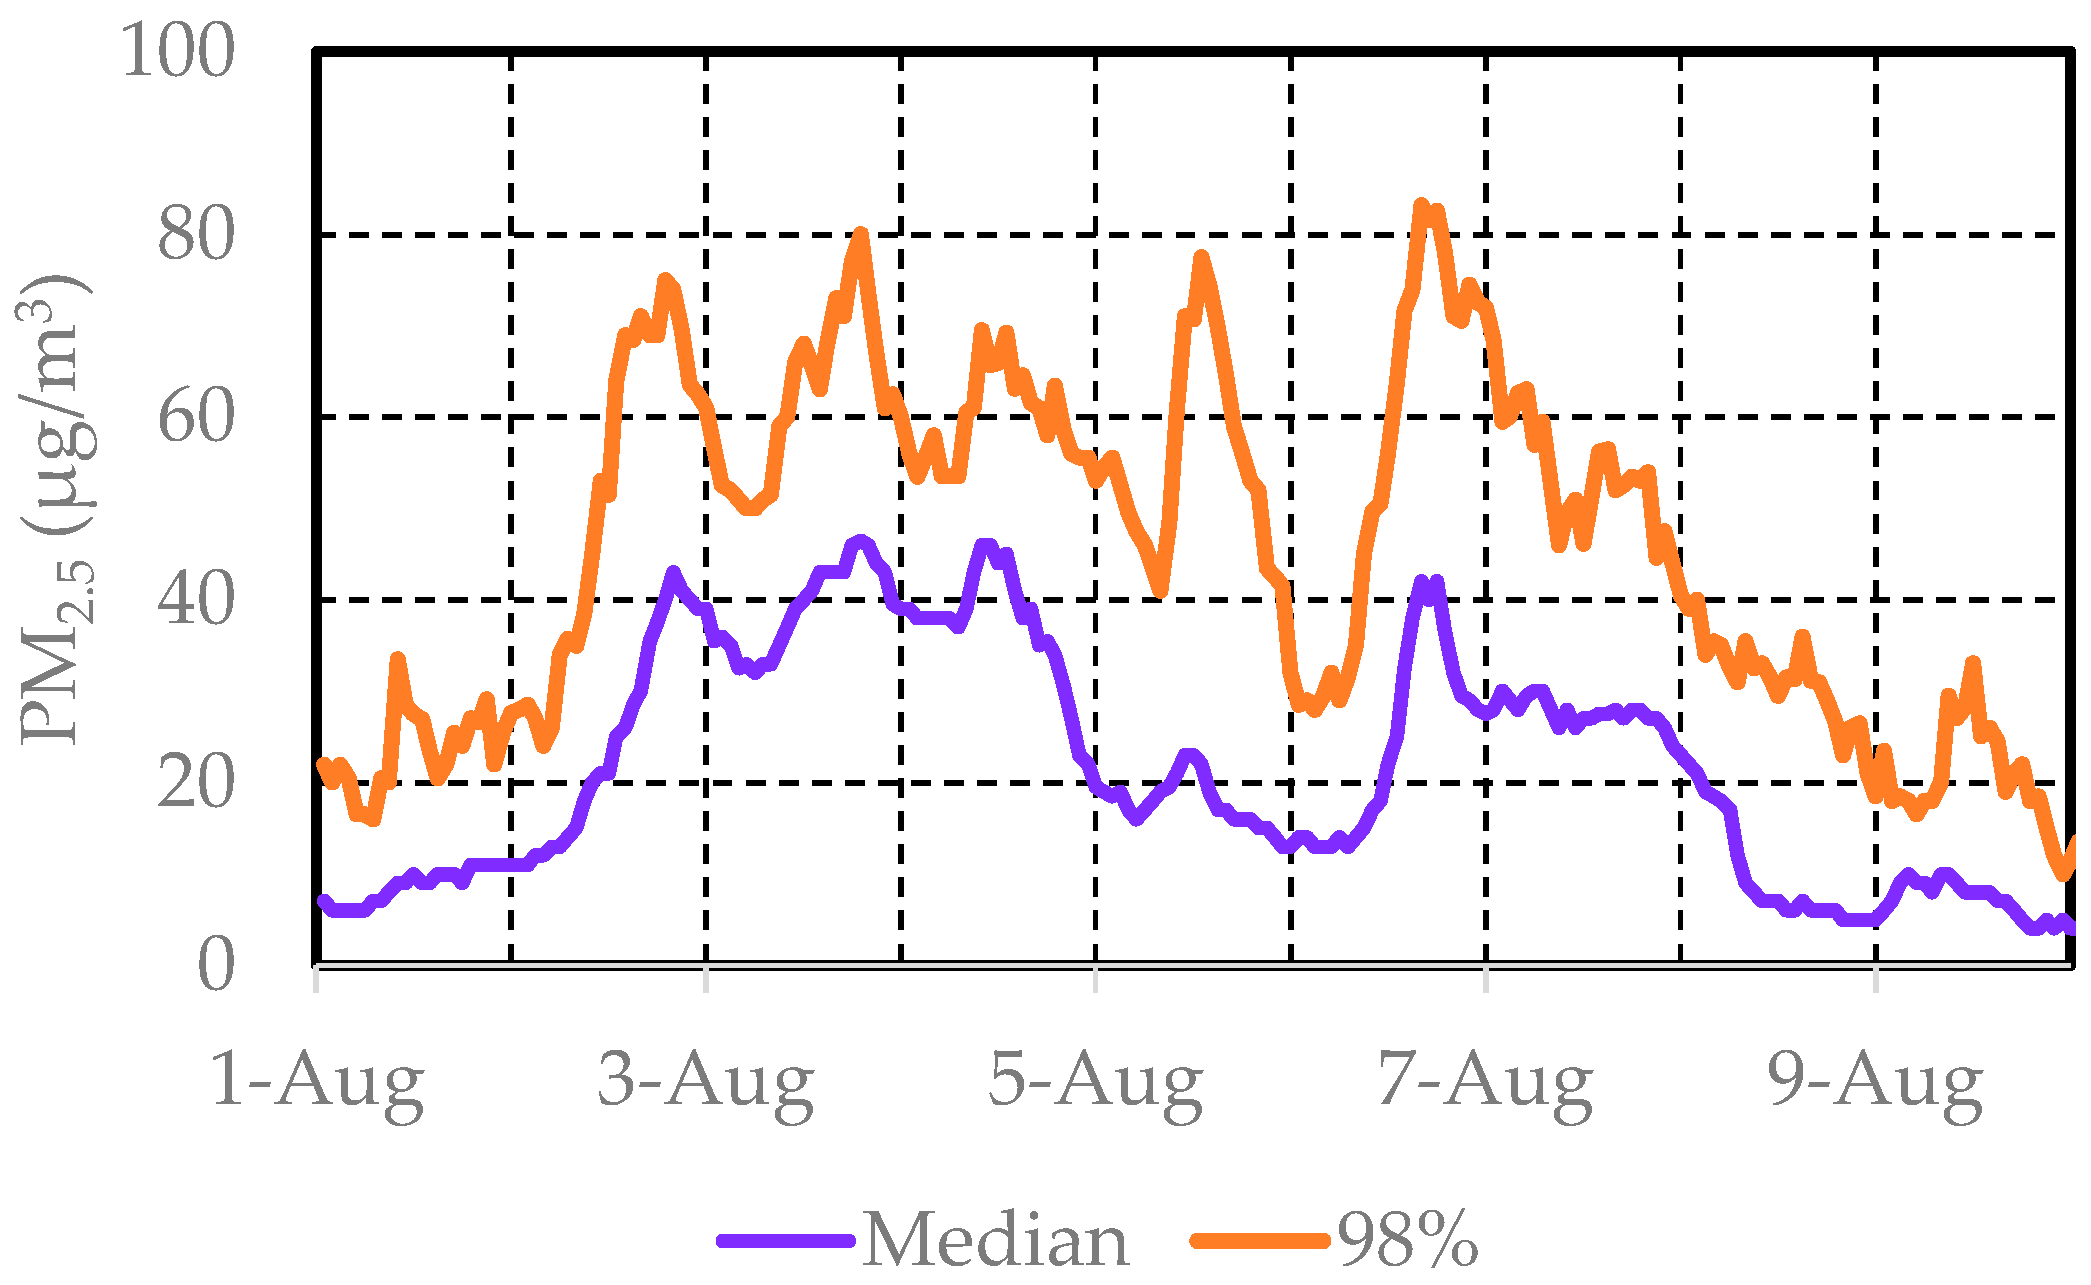
3.3.2. Transport of Sulfuric Acid Particles Due to a Volcanic Eruption (August 2020)
3.3.3. Air Impact of Measures to Prevent the Spread of COVID19 (March 2020)
4. Conclusions
Supplementary Materials
Author Contributions
Funding
Institutional Review Board Statement
Informed Consent Statement
Data Availability Statement
Conflicts of Interest
References
- World Health Organization. World Health Statistics 2020: Monitoring Health for the SDGs, Sustainable Development Goals. Available online: https://apps.who.int/iris/handle/10665/332070 (accessed on 10 June 2021).
- IPCC. Climate Change 2014: Synthesis Report. Contribution of Working Groups I, II and III to the Fifth Assessment Report of the Intergovernmental Panel on Climate Change; Pachauri, R.K., Meyer, L.A., Eds.; IPCC: Geneva, Switzerland, 2014; 151p. [Google Scholar]
- Feng, Z.; Kobayashi, K.; Li, P.; Xu, Y.; Tang, H.; Guo, A.; Paoletti, E.; Calatayud, V. Impacts of current ozone pollution on wheat yield in China as estimated with observed ozone, meteorology and day of flowering. Atmos. Environ. 2019, 217, 116945. [Google Scholar] [CrossRef]
- Wakamatsu, S.; Morikawa, T.; Ito, A. Air Pollution Trends in Japan between 1970 and 2012 and Impact of Urban Air Pollution Countermeasures. Asian J. Atmos. Environ. 2013, 7, 177–190. [Google Scholar] [CrossRef] [Green Version]
- Dockery, D.W.; Pope, C.A., 3rd; Xu, X.; Spengler, J.D.; Ware, J.H.; Fay, M.E.; Ferris, B.G., Jr.; Speizer, F.E. An association between air pollution and mortality in six U.S. cities. N. Engl. J. Med. 1993, 329, 1753–1759. [Google Scholar] [CrossRef] [PubMed] [Green Version]
- Kannari, A.; Kokuryo, K. Thirty-year histories of atmospheric emissions from road vehicles in Japan. J. Jpn. Soc. Atmos. Environ. 2013, 48, 20–34. (In Japanese) [Google Scholar]
- CFR 40 Part 50, Appendix J, Reference Method for the Determination of Particulate Matter as PM10 in the Atmosphere, Office of the Federal Register, July 2012. Available online: https://www.law.cornell.edu/cfr/text/40/appendix-J_to_part_50 (accessed on 22 July 2021).
- Environmental Quality Standards in Japan—Air Quality (Ministry of the Environment). Available online: https://www.env.go.jp/en/air/aq/aq.html (accessed on 22 July 2021).
- Manual for Continuous Environmental Air Quality Monitoring, 6th Edition (Ministry of the Environment). Available online: http://www.env.go.jp/air/osen/manual_6th/index.html (accessed on 22 July 2021).
- Environmental Numerical Database (National Institute for Environmental Studies). Available online: https://www.nies.go.jp/igreen/ (accessed on 1 March 2021).
- Mass Concentrations and Component Measurement (Manual Analysis) Results of PM2.5 (Ministry of the Environment). Available online: https://www.env.go.jp/air/osen/pm/monitoring.html (accessed on 1 March 2021).
- Chatani, S.; Itahashi, S.; Yamaji, K. Advantages of Continuous Monitoring of Hourly PM2.5 Component Concentrations in Japan for Model Validation and Source Sensitivity Analyses. Asian J. Atmos. Environ. 2021, 15, 1–29. [Google Scholar] [CrossRef]
- Atmospheric Environmental Regional Observation System: AEROS (Ministry of the Environment). Available online: https://soramame.env.go.jp/ (accessed on 10 June 2021).
- Uno, I.; Wang, Z.; Itahashi, S.; Yumimoto, K.; Yamamura, Y.; Yoshino, A.; Takami, A.; Hayasaki, M.; Kim, B.G. Paradigm shift in aerosol chemical composition over regions downwind of China. Sci. Rep. 2020, 10, 6450. [Google Scholar] [CrossRef] [PubMed] [Green Version]
- Yamagami, M.; Ikemori, F.; Nakashima, H.; Hisatsune, K.; Ueda, K.; Wakamatsu, S.; Osada, K. Trends in PM2.5 Concentration in Nagoya, Japan, from 2003 to 2018 and Impacts of PM2.5 Countermeasures. Atmosphere 2021, 12, 590. [Google Scholar] [CrossRef]
- Air Quality Expert Group. Non-Exhaust Emissions from Road Traffic. 2019. Available online: https://uk-air.defra.gov.uk/library/reports?report_id=992 (accessed on 10 June 2021).
- Koutrakis, P.; Greenbaum, D. Enhancing near-road exposure assessment. J. Air Waste Manag. Assoc. 2021, 71, 115–117. [Google Scholar] [CrossRef] [PubMed]
- Kreider, M.L.; Panko, J.M.; McAtee, B.L.; Sweet, L.I.; Finley, B.L. Physical and chemical characterization of tire-related particles: Comparison of particles generated using different methodologies. Sci. Total Environ. 2010, 408, 652–659. [Google Scholar] [CrossRef] [PubMed]
- Fukunaga, A.; Sato, T.; Fujita, K.; Yamada, D.; Ishida, S.; Wakamatsu, S. Relationship between Changes over Time in Factors, Including the Impact of Meteorology on Photochemical Oxidant Concentration and Causative Atmospheric Pollutants in Kawasaki. Atmosphere 2021, 12, 446. [Google Scholar] [CrossRef]
- Sora Mame Kun Gallery (National Institute for Environmental Studies). Available online: https://tenbou.nies.go.jp/gis/realtime/soramame.html (accessed on 10 June 2021).
- Kubo, T.; Iino, H.; Yamamoto, K.; Nakatsubo, R.; Takimoto, M.; Takaishi, Y. Analysis of severe ozone pollution during 24–26 May 2019 over Hyogo Prefecture. Bull. Hyogo Prefect. Inst. Environ. Sci. 2019. Available online: http://www.eco-hyogo.jp/files/9015/8496/1726/041218.pdf (accessed on 10 June 2021). (In Japanese).
- Nakayama, T. High Concentration of PM2.5 Derived from Volcanic Activity Observed in Nagasaki and Okinawa. Available online: https://www.nagasaki-u.ac.jp/ja/science/science209.html (accessed on 10 June 2021). (In Japanese).
- Center for Research on Energy and Clean Air (CREA). BRIEFING: China’s Air Pollution Overshoots Pre-Crisis Levels for the First Time. Available online: https://energyandcleanair.org/china-air-pollution-rebound-briefing/ (accessed on 10 June 2021).


| Species | Abbreviation | Start Year | No. of Monitoring Stations (1) | Remarks | ||
|---|---|---|---|---|---|---|
| AAQMS | RsAQMS | |||||
| PM2.5 | PM2.5 | 2010 | 1088 | 849 | 239 | |
| Suspended Particulate Matter | SPM | 1970 | 1703 | 1314 | 389 | (2) |
| Ozone | O3 | 1970 | 1193 | 1165 | 28 | |
| Nitrogen Oxides, Nitrogen Dioxide | NOx, NO2 | 1970 | 1658 | 1260 | 398 | |
| Non-Methane HydroCarbon | NMHC | 1970 | 482 | 333 | 149 | |
| Sulfur Dioxide | SO2 | 1970 | 1010 | 960 | 50 | |
| Carbon Monoxide | CO | 1970 | 293 | 60 | 233 | |
| PM2.5 | Concentration (μg/m3) | C2018/C2010 | ||
|---|---|---|---|---|
| 2010 | 2018 | |||
| Whole Japan | AAQMS | 15.1 | 11.2 | 0.74 |
| RsAQMS | 17.2 | 12.0 | 0.70 | |
| Region 1 | AAQMS | 13.1 | 8.9 | 0.68 |
| RsAQMS | n. d. | 9.3 | n. d. | |
| Region 2 | AAQMS | 14.6 | 11.2 | 0.77 |
| RsAQMS | 18.1 | 12.5 | 0.69 | |
| Region 3 | AAQMS | 13.2 | 9.5 | 0.72 |
| RsAQMS | 13.8 | 10.9 | 0.79 | |
| Region 4 | AAQMS | 12.8 | 10.4 | 0.81 |
| RsAQMS | 17.7 | 10.7 | 0.61 | |
| Region 5 | AAQMS | 16.6 | 11.5 | 0.69 |
| RsAQMS | 17.2 | 12.2 | 0.71 | |
| Region 6 | AAQMS | 19.8 | 12.2 | 0.62 |
| RsAQMS | n. d. | 13.5 | n. d. | |
| Region 7 | AAQMS | 16.3 | 12.0 | 0.74 |
| RsAQMS | n. d. | 13.6 | n. d. | |
| Region 8 | AAQMS | 17.9 | 12.9 | 0.72 |
| RsAQMS | 16.7 | 13.8 | 0.83 | |
| PM2.5 Species | Concentration (µg/m3) | C2018/C2012 | |||
|---|---|---|---|---|---|
| 2012 | 2015 | 2018 | |||
| PM2.5 | AAQMS | 12.0 | 11.8 | 8.8 | 0.74 |
| main component | RsAQMS | 12.7 | 13.1 | 9.6 | 0.75 |
| EC | AAQMS | 1.18 | 1.04 | 0.68 | 0.57 |
| RsAQMS | 1.81 | 1.50 | 0.91 | 0.50 | |
| OC | AAQMS | 3.11 | 2.98 | 2.78 | 0.89 |
| RsAQMS | 3.17 | 3.38 | 3.06 | 0.97 | |
| SO42− | AAQMS | 4.27 | 4.64 | 3.12 | 0.73 |
| RsAQMS | 4.06 | 4.75 | 3.19 | 0.78 | |
| NO3− | AAQMS | 1.07 | 0.84 | 0.66 | 0.61 |
| RsAQMS | 1.29 | 1.00 | 0.70 | 0.54 | |
| NH4+ | AAQMS | 1.83 | 1.89 | 1.24 | 0.68 |
| RsAQMS | 1.85 | 1.96 | 1.30 | 0.70 | |
| ions * | AAQMS | 0.50 | 0.44 | 0.38 | 0.75 |
| RsAQMS | 0.57 | 0.50 | 0.41 | 0.72 | |
| SPM | Concentration (µg/m3) | C2018/C1990 | ||||
|---|---|---|---|---|---|---|
| 1990 | 2000 | 2010 | 2018 | |||
| Whole Japan | AAQMS | 37 | 31 | 21 | 17 | 0.45 |
| RsAQMS | 50 | 40 | 23 | 17 | 0.35 | |
| Region 1 | AAQMS | 24 | 20 | 16 | 13 | 0.55 |
| RsAQMS | 34 | 24 | 17 | 13 | 0.40 | |
| Region 2 | AAQMS | 45 | 36 | 22 | 17 | 0.38 |
| RsAQMS | 60 | 46 | 24 | 18 | 0.30 | |
| Region 3 | AAQMS | 30 | 26 | 18 | 14 | 0.46 |
| RsAQMS | 33 | 29 | 21 | 15 | 0.45 | |
| Region 4 | AAQMS | 39 | 35 | 21 | 16 | 0.42 |
| RsAQMS | 47 | 39 | 21 | 17 | 0.36 | |
| Region 5 | AAQMS | 38 | 31 | 21 | 17 | 0.45 |
| RsAQMS | 52 | 40 | 23 | 17 | 0.34 | |
| Region 6 | AAQMS | 37 | 32 | 22 | 18 | 0.48 |
| RsAQMS | 40 | 38 | 24 | 18 | 0.46 | |
| Region 7 | AAQMS | 38 | 32 | 23 | 19 | 0.49 |
| RsAQMS | 44 | 35 | 21 | 19 | 0.44 | |
| Region 8 | AAQMS | 32 | 28 | 22 | 19 | 0.60 |
| RsAQMS | 39 | 37 | 26 | 20 | 0.52 | |
Publisher’s Note: MDPI stays neutral with regard to jurisdictional claims in published maps and institutional affiliations. |
© 2021 by the authors. Licensee MDPI, Basel, Switzerland. This article is an open access article distributed under the terms and conditions of the Creative Commons Attribution (CC BY) license (https://creativecommons.org/licenses/by/4.0/).
Share and Cite
Ito, A.; Wakamatsu, S.; Morikawa, T.; Kobayashi, S. 30 Years of Air Quality Trends in Japan. Atmosphere 2021, 12, 1072. https://doi.org/10.3390/atmos12081072
Ito A, Wakamatsu S, Morikawa T, Kobayashi S. 30 Years of Air Quality Trends in Japan. Atmosphere. 2021; 12(8):1072. https://doi.org/10.3390/atmos12081072
Chicago/Turabian StyleIto, Akiyoshi, Shinji Wakamatsu, Tazuko Morikawa, and Shinji Kobayashi. 2021. "30 Years of Air Quality Trends in Japan" Atmosphere 12, no. 8: 1072. https://doi.org/10.3390/atmos12081072
APA StyleIto, A., Wakamatsu, S., Morikawa, T., & Kobayashi, S. (2021). 30 Years of Air Quality Trends in Japan. Atmosphere, 12(8), 1072. https://doi.org/10.3390/atmos12081072