Abstract
In the framework of a collaboration between INAIL and University of Salento, an indoor radon survey in 54 buildings belonging to the UniSalento University (Southeast Italy) was carried out. The monitored buildings differ by type, construction period, materials, etc., and are located in an area with a morphology characterized mainly by marls, calcareous marls, and calcarenites (karst area). The sample of the survey includes 963 rooms at different floors: it consists in rooms mainly located at ground floor (67%), first floor (12%), and below ground (12%). SSNTD passive dosimeters measured the average radon activity concentration for two consecutive semesters (spring/summer and autumn/winter) from which annual radon averages were estimated for each room. The spatial variability within buildings was investigated in terms of variation between floors and among rooms at the same floor. Data analysis provides evidence that the distributions (in terms of arithmetic mean, standard deviation, median, and geometric mean) of indoor radon annual averages at ground floor and at first floor within building are very similar. This highlights that the karstic characteristics of soil and building materials affect radon levels not only below ground and at ground floor, but also at first floor. Moreover, to evaluate the spatial variability of radon among buildings or floors, the analysis of the distribution of coefficient of variation (CV) was carried out: the results show a low spatial variability with median and average values of CVs ≤ 30% both for the whole building and at different floor levels.
1. Introduction
The presence of radon affects the indoor air quality, and the radon is considered the second cause of lung cancer after smoking [1]. Therefore, protection from exposure to indoor radon is a public health topic, and systematic surveys help to better understand the indoor radon temporal and spatial behavior and to plan proper remedial or prevention actions in both workplaces and dwellings. The main radon sources are bedrocks and soils, well water, and building materials [2]. In particular, bedrocks with geologic formations of granite, gneiss, and sediments have high levels of uranium-238 (238U) from which radium-226 (226Ra) and, in turn, radon-222 (222Rn) descend by alpha decay. Sedimentary rocks or soils such as carbonate rocks with a high permeability or fractures in the rocks also facilitate the transport of radon to the Earth’s surface [3]. Moreover, building construction materials containing radium, the porosity of constructions materials, the presence of cracks in walls or flooring, especially in older buildings, and the connection type with the soil in foundations (e.g., connection by the underground/ground floor or a crawl space) highly influence the indoor radon levels. Therefore, the morphology of a target area and the building characteristics affect the indoor radon concentrations [4].
The protection from exposure to radon in workplaces located in radon priority areas is a task of 2013/59/Euratom Directive [5,6] and most legislations demand radon measurements in all occupied rooms located only at ground floor and basement. In Italy, the legislation transposing the 2013/59/Euratom Directive (legislative decree 101/2020) [7] foresees that the protection of workers from radon exposure is considered in case of
- underground working activities,
- workplaces at ground floor and basement if located in radon priority areas,
- specific types of workplaces identified by the National Radon Action Plan, and
- spa facilities.
It is well known that the soil and bedrock are the main source of radon and, as a consequence, radon levels are higher at ground or below ground floors (rooms closer to the soil) than at first floor or above [8,9,10]. Moreover, it has been observed that the contact with soil affects radon spatial variability among rooms at the same floor, which is higher at ground and underground floors than at upper floors [11]. Therefore, the floor level significantly affects both radon averages and its spatial variability within a building [10,12,13].
Some exceptions to this general trend could be found, as will be shown in this paper for the Salento area located in southeast Italy. A previous indoor radon survey performed both in dwelling and workplaces in the Apulia region [14] showed quite high radon activity concentration values. Moreover, a radon campaign carried out in 500 schools in Salento highlighted the presence of high indoor radon activity concentrations in areas characterized by the presence of a complex karst substrate associated with a rather irregular alternation of both calcareous and calcarenitic lithotypes and clayey deposits [15,16]. The radon remediation actions adopted in several schools allowed to observe how, in the case of buildings located in karst area, typical radon reduction interventions may sometimes be less effective [17]. Recently, in the same region, a new radon survey has been carried out in the buildings of UniSalento University in order to evaluate the variations of indoor radon concentrations in a high number of buildings placed in a restricted area and different by year of construction, materials used, type of fixtures, type of heating system, and building size. In this paper, the averages annual radon concentrations are analyzed in order to evaluate radon distribution pattern in buildings placed in an Italian karst area. Moreover, to investigate the spatial variability of radon concentration between or within buildings and among floors or rooms the coefficient of variation in radon concentration distributions has been used.
2. Materials and Methods
2.1. The Sample
A survey was carried out in 54 buildings of the University of Salento (UniSalento in the following) in the southeast Italy. They are located in a restricted area with a radius of about 12 km near the city of Lecce, with the exception of 4 buildings located in more distant municipalities. In particular, 3 buildings are at the so-called “Cittadella della Ricerca” placed at about 50 km from Lecce city and 1 building, Museum of Marine Biology, 30 km far from Lecce city (Figure 1). The analyzed territory is a sedimentary area characterized by the presence of limestone, dolomite, or gypsum and by the presence of sinkholes, caves, and underground drainages (karsic area). In particular, the mid-southern part of the Salento peninsula is marked by a wide endorheic area composed principally of marls, calcareous marls, and calcarenites belonging to several Pleistocene sedimentary cycles [15].
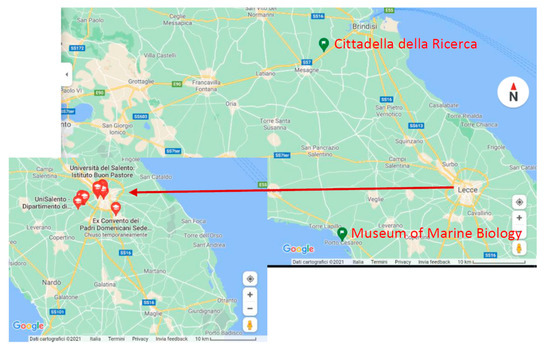
Figure 1.
Distribution of the buildings monitored in the survey (Map data ©2021 Google).
The buildings differ in year of construction, materials, and type of constructions and number of stories. The building construction materials are of mixed typology mostly and tuff blocks. The survey sample includes historic buildings, which were built in 1170, 1500, 1600, 1800 and recent buildings, which were built in 1980/1990 and 2000 up to present day. The different construction period affects the construction type, highlighting differences, for example, in the type of ground connection: crawl space, technical void, a direct attack on the ground, and other typology. No building has already received interventions for energy efficiency except for the presence of airtight windows in two cases. The sample design of buildings includes a total of 966 rooms monitored at different floors (from below ground to fourth floor) but the measurement of only 963 rooms is available because the dosimeters of three rooms are missing (see Table 1). The sample measured comprehends all rooms located below ground floor and at ground floor; moreover, it includes a representative sample of rooms located at upper floors (typically first floor). In the present analysis, the below ground floor includes underground floor and basement; the ground floor includes a mezzanine as well. In Table 1, a description of the sample distribution between room location is reported.

Table 1.
Description of measured rooms and buildings per floor level (top) and of measured buildings per story level (bottom).
2.2. Measure of Indoor Radon Average Activity Concentration
The average concentration of indoor radon (in the text when we speak about radon we always refer to 222Rn) activity (Rn in the following) was estimated by using SSNTD passive dosimeters type NRPB/SSI with nuclear trace detectors CR-39 (Intercast, Europe) for two consecutive semesters (spring/summer from March to October 2018 and autumn/winter from October 2018 to April 2019). The analytical procedure was described in [18] and references within: in particular, the plastic detectors were pre-etched before use and developed with an aqueous solution of KOH 6.0 N, 75 °C for 270 min, and then the detectors were subjected to reading by means of an automated Politrack system (Mi.am, Italy). Moreover, according to INAIL (National Institute for Insurance Against Accidents at work) Laboratory’s procedures [19], the correct functioning of the reading system was checked by reading “reference detectors” (i.e., detectors exposed to certified radon atmospheres) before starting a new reading cycle. Furthermore, each new batch of plastic detectors was subjected to calibration to assess their response to certified radon atmosphere: in this case, the calibration was carried out at the Radioprotection Laboratory of the Energy Department of the Politecnico of Milan.
2.3. Statistical Data Analysis
For each room, the annual average radon value was estimated as mean weighted on exposure time of each semester (this average room level will be named ARn in the following). In case of large rooms, multiple dosimeters were positioned, and the average of all radon measurements was computed as radon level representative for that room. Consequently, a value of ARn was achieved for each room at all floors of each building included in the survey; however, the total number of monitored rooms was reduced from 966 to 963 as rooms with missing data for both semesters were not included in the dataset. In case of a radon datum missing for one of the two measurement period, the value of ARn was estimated starting from the available one corrected by the seasonal factor according to the procedure described in [16].
In order to analyze the room-to-room variability within the same floor and the floor-to-floor variability, for each floor of every building, the arithmetic mean (AM) of all ARn values at that floor was computed.
To compare the building radon levels, for each building, the annual average radon value was estimated in two ways: computing the average of radon levels relevant to the floors (average value called F_AM in the following) and computing the average of radon levels in all rooms without considering the story level (average value called R_AM in the following). In this way, it is possible to evaluate the spatial variability between buildings according to two different aspects: floor-to-floor variability and room-to-room variability, respectively.
Descriptive statistics (i.e., AM, median, standard deviation with the formula of the corrected sample (SD), geometric mean (GM), geometric standard deviation (GSD), first quartile, third quartile) was applied to the whole set of ARn values and to the set with one AM per building (set of F_AM values or R_AM values) or with one AM per given floor level in each building.
In order to analyze the spatial variations of Rn, the ratio between the SD and the AM in terms of coefficient of variation (CV) was used: the CV, indeed, quantifies the relative spatial variation in radon activity concentration. The spatial variability was evaluated between or within buildings and between floors.
Kolmogorov–Smirnov test was applied to evaluate the normality of distribution in the analyzed datasets. A parametric test—the Student’s T-test (T-test)—or a nonparametric test—the Wilcoxon test (W-test)—was used in order to statistically compare two paired data distributions, which resulted normal or no normal, respectively, according to the normality test of Kolmogorov–Smirnov. The statistical significance level was p-value ≤ 0.05 (two tailed) for all statistical tests.
3. Results and Discussion
3.1. Distribution of Annual Radon Activity Concentration in Rooms and Buildings
Table 2 summarizes main results of the radon survey carried out in 963 rooms belonging to 54 buildings of UniSalento.

Table 2.
Descriptive statistics 1 of annual radon activity concentrations (top) and number of exceedances 2 for fixed levels of annual radon activity concentrations (bottom) estimated in 963 rooms belonging to 54 buildings.
The distribution of ARn in all rooms ranges from 38 to 1849 Bq/m3 with median of 101 Bq/m3, AM of 161 Bq/m3, and GM of 120 Bq/m3. The interquartile range is 65 Bq/m3 and the SD is 189 Bq/m3. The frequency distribution of rooms ARn is shown in Figure 2a: 89% of rooms has Rn <300 Bq/m3 and 11% of rooms has Rn >300 Bq/m3. This last group represents the rooms that need radon remediation according to the new European Union reference level of 300 Bq/m3 [5,6]. The distribution of radon levels is approximately log-normal according to the quantile–quantile plot shown in Figure 3. The best-fit of plotted natural log-transformed data, indeed, is a linear relation which approximates the bisecting line of first and third quadrant according to the R2 value of about 0.86. However, note that the Kolmogorv–Smirnov test failed to assess the normality of natural log-transformed Rn (p < 0.001). Deviations from the log-normal trend in distributions of indoor radon levels at ground floor were discussed in [20], highlighting, then, the presence of competitive radon sources in addition to the soil. This issue could also affect the UniSalento distribution of ARn and will be investigate in a subsequent study.
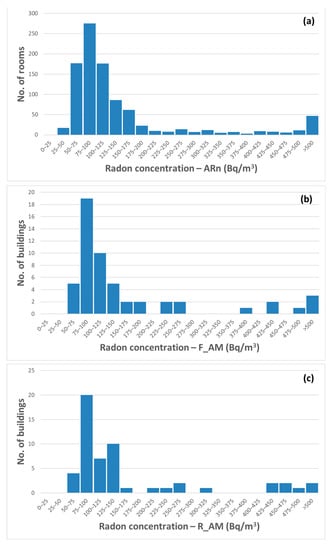
Figure 2.
Frequency distribution of (a) ARn values in all 963 rooms, (b) F_AM values in all 54 buildings (concentration calculated as average of floor means), and (c) R_AM values in all 54 buildings (concentration calculated as average of all room concentration values).
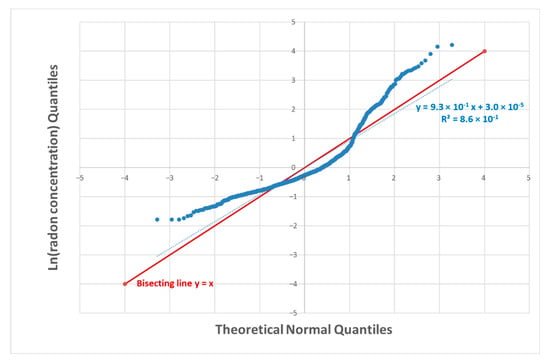
Figure 3.
Q-norm plot of natural log-transformed annual radon activity concentration values of 963 rooms (dot plot) and the corresponding linear fitting (dotted line). The equation with R2 value of the linear fitting and the bisecting line (continuous line) are also shown.
The distribution of radon levels for buildings was analyzed by using two different datasets (F_AM values and R_AM values) in order to evaluate radon spatial variability among floors and among rooms, respectively, within a building. The two datasets have frequency distributions ranging in similar value intervals (about from 60 to 1000 Bq/m3) and the AM for both of them is equal to 174 Bq/m3. The median values are slightly different with a value of 104 Bq/m3 for F_AM and 108 Bq/m3 for R_AM (see Table 2 and Figure 2b,c) but the two datasets are not statistically different. Therefore, the spatial variability between floors and between rooms could show similar properties. However, a greater dispersion of values is observed in the F_AM dataset with an interquartile range of 73 Bq/m3 and a SD of 173 Bq/m3 if it is compared to the R_AM dataset with an interquartile range of 58 Bq/m3 and a SD of 159 Bq/m3.
3.2. Annual Radon Activity Concentrations as Function of Floor Level
ARn values were evaluated as function of floor level (starting from below ground to up). Buildings differ in number of stories (see Table 1) and, consequently, for each floor level the number of buildings differs too. To evaluate the distribution pattern of Rn per floor level, the ARn dataset was split into four subsets, indicated as below ground floor (BGF), ground floor (GF), first floor (FF), and second and upper floors (SUF), which is the lesser populated class. Each value in a given subset represents the average of ARns of all rooms at that given floor in a building. In this way, each distribution of values related to a floor allows to compare both the same floor and different floors between buildings.
In Table 3 (top), the descriptive statistics of annual radon levels per floor is reported and in Figure 4 box plots of radon distributions per floor are compared. The median values for BGF, GF, and FF (110 Bq/m3, 108 Bq/m3, and 102/m3, respectively) are very similar but the differences between GF and FF distributions are statistically different (W-test p = 0.043). The value of AM decreases increasing the floor level although GF and FF have quite the same value; note that these two distributions refer to different populations due to the different number of buildings in each subset.

Table 3.
Descriptive statistics 1 of annual radon activity concentrations per floor for all buildings (top), for 20 buildings which have both below ground floor and ground floor (central), for 34 buildings which have both ground floor and first floor (bottom). Floors share the same uppercase letter in apex if the corresponding distributions of annual radon activity concentration value have statistically significant differences (p ≤ 0.05).
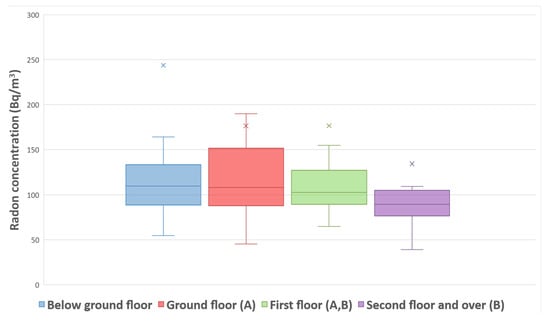
Figure 4.
Box plot of annual radon activity concentrations per floor level without outliers for a better visual. The x symbol represents the AM. Floors share the same uppercase letter in brackets if the corresponding distributions of annual radon activity concentration value have statistically significant differences (p ≤ 0.05): (A) W-test p = 0.043; (B) W-test p = 0.046.
An analysis considered a subset of 34 buildings having both GF and FF, with the aim to compare the distribution of radon levels between floors in a sample that is homogenous in terms of buildings: the results are shown in the bottom part of Table 3 and in Figure 5a. Median and AM at GF are higher than respective median and AM at FF, and the two distributions are statistically different (W-test p = 0.043). Looking at Figure 5b, where FF values versus GF values are plotted, it can be seen that in 74% of these buildings, the couples of values are spread in a restricted area below 200 Bq/m3. This result means that the most of buildings has a homogeneous trend of radon diffusion at GF and FF. This result confirms also by the interquartile range of 89 Bq/m3 for GF and of 38 Bq/m3 for FF, as achievable looking at Q1–Q3 data in Table 3.
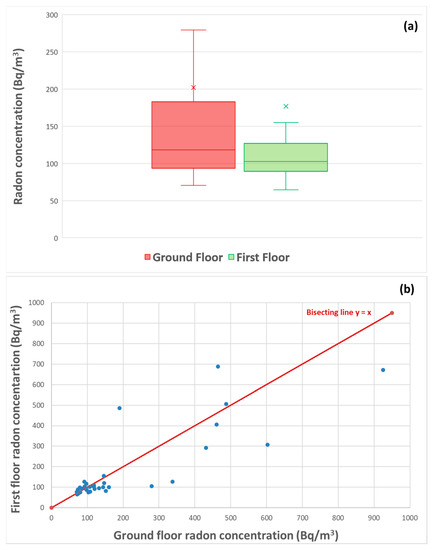
Figure 5.
Box plot of annual radon activity concentrations for ground floor and first floor (belonging to the same building) without outliers for a better visual (the x symbol represents the AM) (a). The differences between the two distributions of values are statistically significant (W-test p = 0.043). First floor radon activity concentration versus ground floor radon activity concentration (b); the continuous line is the bisecting line.
Moreover, as also highlighted by a visual check of Figure 5b, 32% of buildings show radon levels at FF higher than ones at GF. This behavior is anomalous respect to the general trend of lowering radon levels with the increasing of floor level rises, that is, with the increasing of the distance from the soil as found by [10,11,16,21]. In particular, the survey of [16] also was conducted in Salento area but the AM of 176 Bq/m3 at GF is much greater than the AM of 125 Bq/m3 at FF, with a ratio GF AM over FF AM of 1.4. In the present study, the same ratio is 1.0 for the whole dataset of 53 GF and 34 FF or 1.1 for the subset of 34 GF and FF. In [21], the study area is the university campus of Brisbane (Australia) and the subsoil has meta-sedimentary and metamorphic formation which could have similar properties to a karst area; moreover, in this area, radon levels are significantly much higher at GF or basement than upper floors unlike UniSalento, but the interquartile range is wider at ground floor and basement than upper floors as in the present study.
A further analysis has been also carried out on a subset of 20 buildings in order to compare radon averages at GF and BGF related the same group of buildings: results are reported in Table 3 (central rows). Median and AM of BGF are greater than median and AM, respectively, of GF although the differences between the two distributions of values are not statistically significant. The 80% of cases has radon levels at both BGF and GF less than 200 Bq/m3 but 40% of cases have radon levels at GF greater than the ones at BGF, even in case of buildings built after 2000.
Therefore, looking at the overall sample of buildings radon averages seem to decrease with the increasing of floor level. However, a restricted analysis on a subgroup of buildings having both GF and FF highlights that in the most of cases radon averages at GF and FF are very similar and a certain percentage (~30%) of buildings has radon averages at FF significantly higher than the ones at GF. This last evidence poses a question about the need to extend radon measurements also at floors above ground in specific type of buildings (radon prone buildings) or in buildings located in areas with peculiar geological characteristics. In this area, for example, the karstic nature of local building materials could be responsible for high radon values at FF due to the radon carried through the walls. Further details can be found in the next subsection.
3.3. Distribution of CVs Per Building and Floor Level
The relative spatial variation in Rn is quantified by the CV and gives information about the variability of radon levels between buildings or within buildings and between floors by choosing properly the dataset to be analyzed.
Looking at the last column of Table 2, the CVs of the distribution of annual radon levels for all 963 rooms (ARn values), for all 54 buildings by using floors average (F_AM values) and for ones with rooms average (R_AM values) are 117%, 100%, and 92%, respectively. The CV of F_AM subset is greater than CV of R_AM subset but the differences between the two distributions are not statistically different.
If CVs of the annual radon levels per floor are compared (see the last column in Table 3), a clear trend is not identifiable, expect for very close values of CV at GF and FF, whose differences are statistically significant (W-test p = 0.043).
In order to better investigate the radon spatial variation within buildings and within floors, the distributions of CVs for each building and floor have been analyzed. In Table 4, the descriptive statistics of six CV distributions is shown; the six datasets considered are as follows:

Table 4.
Descriptive statistics 1 of CVs per buildings and floor. Data sets share the same uppercase letter in apex if the corresponding distributions of CVs value have statistically significant differences (p ≤ 0.05).
- 1st dataset (F_AM): for each building, the CV value is calculated as the ratio between SD and AM computed from radon averages of each floor of the building.
- 2nd dataset (R_AM): for each building, the CV value is calculated by AM and SD computed from all rooms ARns of the building.
- 3rd dataset (BGF): for each building, the value of CV refers to all rooms ARn values at BGF.
The remaining three datasets have been settled and named similarly to BGF one (GF, FF, and SUF). Each dataset has a different population because the buildings differ in number of story and in some cases, only a room per floor was monitored.
Figure 6a,b shows the distribution of CVs versus the distribution of annual Rn for 1st and 2nd dataset, respectively (see Table 2 and Table 4 for descriptive statistics of radon levels and CVs, respectively).
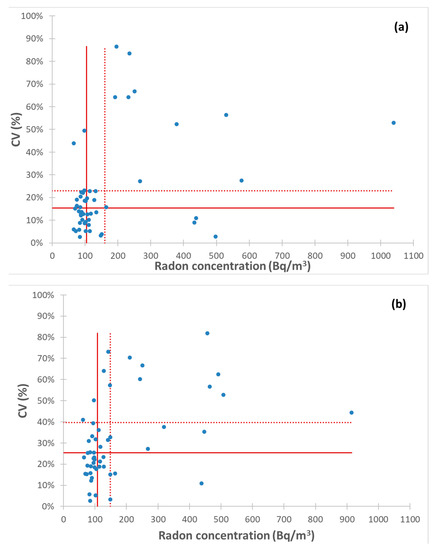
Figure 6.
Coefficient of variation (CV) versus annual radon activity concentration (Rn) for each of 52 buildings with concentration value calculated as F_AM (average of floor means) (a), with concentration value calculated as R_AM (average of all concentration values) (b). Horizontal continuous and dotted lines intersect axis of ordinates in median and first quartile of CVs distribution (described in Table 4), respectively. Vertical continuous and dotted lines intersect axis of abscissa in median and first quartile of Rn distribution (described in Table 2), respectively. The differences between the CVs distribution of (a,b) are statistically significant (W-test p < 0.001).
Looking at Figure 6, (Rn, CV) data appear as a group of homogenous values within the third quartile of (161 Bq/m3, 23%) for the 1st dataset and (149 Bq/m3, 40%) for the 2nd dataset, and with an interquartile range of (73 Bq/m3, 14%) and (58 Bq/m3, 21%), respectively. Within buildings, the radon spatial variability, in terms of CV, is greater between all rooms than between the floors and the differences between CV distributions are statistically significant (W-test p < 0.001). Furthermore, the trend of CV does not seem correlated with Rn values.
These results, in terms of AM and median of CV, show a similar behavior compared with results achieved in other surveys as in [10,12]. However, in [12] a similar data analysis, carried out on a sample of 29 buildings located in a restricted area (a research institute placed in Rome, Italy), showed higher values of AM and median, equal to 42% and 35%, respectively, in case of CVs calculated from radon averages of each floor of the building. Moreover, higher values of AM and median of CVs were found when CVs were calculated starting from data of all rooms (57% and 51%, respectively). The spatial variability in radon activity concentration within buildings is a parameter to be considered when radon measurements are performed. Indeed, buildings with medium-high spatial variability need measurements in several rooms on each floor level, as already suggested in [10,12].
Figure 7a,b shows the distribution of CVs versus the distribution of annual Rn for 4th and 5th dataset, respectively (see Table 3 and Table 4 for descriptive statistics of radon levels and CVs, respectively). BGF (3rd dataset) and SUF (6th dataset) are not shown being outnumbered.
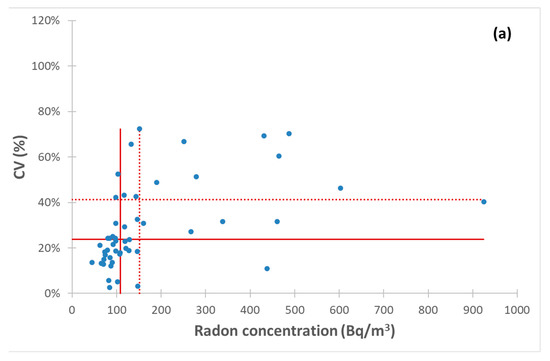
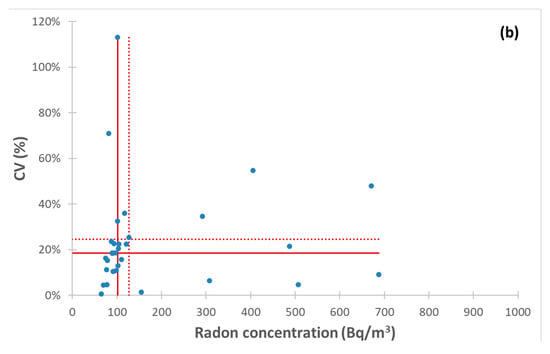
Figure 7.
Coefficient of variation (CV) versus annual radon activity concentration (Rn) for each of 51 building ground floors (a) and for each of 31 building first floors (b). Horizontal continuous and dotted lines intersect axis of ordinates in median and first quartile of CVs distribution (described in Table 4), respectively. Vertical continuous and dotted lines intersect axis of abscissa in median and first quartile of Rn distribution (described Table 3), respectively. The differences between the CVs distribution of panels (a,b) are statistically significant (W-test p = 0.001).
As already observed for Figure 6, in Figure 7 GF and FF (Rn, CV) data are grouped within the third quartile of (152 Bq/m3, 41%) and (127 Bq/m3, 24%) with interquartile range of (64 Bq/m3, 24%) and (38 Bq/m3, 14%), respectively, with statistical significance (W-test p = 0.001). The spatial variability is greater at GF than at FF, as already observed in [12] for a group of buildings belonging to a research institute placed in Rome (Italy) and in [10] for schools placed in Porto (Portugal). Therefore, the importance of measuring a large number of rooms especially at ground or below ground floor [11] is confirmed. Note that, also in this comparison, AM and median of CV values related to present study are lower than those found in [12].
Finally, in Figure 7 a group of homogenous values is observed in both floors and particularly at FF. This evidence could support the hypothesis of a contribution from a radon source different from the soil, as also could be highlighted by the analysis on annual radon levels in the previous subsection. At GF, a double radon source, that is, the contact or the proximity to the soil and construction type of walls, could cause more dispersion in radon levels than at FF where one source, i.e., the walls act as a single source of radon transport. The karstic nature of soil and local building materials could be responsible for a constant contribution that uniforms indoor radon levels. Further analyses will be carried out in order to evaluate how different factors (i.e., age of construction, geographic location, type of foundation, heating system, building materials, etc.) influence radon levels per floor and building of UniSalento.
4. Conclusions
In this paper, the preliminary results of a radon survey conducted in 54 buildings of UniSalento are presented and discussed. An initial analysis of data showed that the sampling strategy adopted, in collaboration with the university staff, provided excellent results, in terms of coverage of the sample (87% of the total that means 963 rooms). The percentage of premises that exceed the reference level of 300 Bq/m3 is 11%. Overall, the measured buildings show average annual radon activity concentrations distributed over a wide range of values, 38–1849 Bq/m3 in terms of ARn; the AM of all measured rooms is 161 Bq/m3 with an associated SD of 189 Bq/m3. The values discussed for rooms and buildings of UniSalento are lower than the values measured in a survey in schools in province of Lecce reported in [16]. This is likely because the schools’ survey was performed in 122 municipalities in the whole area of the province of Lecce, that is, a larger area than the university area located mainly in city of Lecce and analyzed in this paper. Both surveys show values of annual Rn much higher than the value of 52 Bq/m3 (AM) estimated for Puglia region in [22]. The karstic nature of the province of Lecce could be responsible for higher Rn values due to the high permeability of the soil and the high number of faults and cavities that facilitate the radon transport [4,17,23].
The variability in radon levels between floors and rooms within a building show similar properties because the F_AM and the R_AM dataset are not statistically different. However, a greater dispersion of values is observed in the F_AM dataset with an interquartile range of 73 Bq/m3 and a SD of 173 Bq/m3 if it is compared to the R_AM dataset with an interquartile range of 58 Bq/m3 and a SD of 159 Bq/m3. Moreover, analyzing the distributions of CV for F_AM and R_AM, with statistical significance, we can observe that spatial variations are greater between rooms than floors.
The analysis of the radon level distributions in function of the building floor highlights the presence of values comparable with those of the GF for the upper floors. The median values for BGF, GF, and FF (110 Bq/m3, 108 Bq/m3, 102/m3, respectively) are very similar with differences that are statistically significant only between GF and FF.
Looking at AM values, generally a decrease is observed with the increasing of the floor level although GF and FF have quite the same value. This is a non-typical behavior respect to the general trend of lowering radon levels if floor level rises, that is the distance from the soil increases.
These results are anomalous if compared to survey in similar geological areas [16,21]. Probably, other factors as building construction materials and typologies or usage of rooms could cause this specific radon behavior in UniSalento, and this will be a target topic in forthcoming investigation on indoor radon data of UniSalento.
With statistical significance, the analysis of the radon spatial variability in terms of CV shows greater variations at GF than upper floors. This was already observed in [10,12] but the data of the present analysis have a greater homogeneity of variations between floors, in particular at FF. Indeed, the distribution of CV has AM of 29% and SD of 19% at GF and AM and SD of 23% at FF. This evidence could be due to the construction materials of the buildings’ walls, which, in some cases, could facilitate the radon transport to the upper floors and have constant leaks of radon gas. Further analysis will be carried out in order to study the most influential factors of the indoor radon levels and spatial variations in this geographic area.
Author Contributions
Conceptualization, F.L., A.P.C., S.S. and R.T; data curation, F.L., A.P.C., T.B., M.V. and R.T.; formal analysis, F.L., T.B., G.B., A.P.C. and R.T.; investigation, F.L., A.P.C., A.C., C.P., S.S., S.T., M.V. and R.T.; methodology, F.L., A.P.C., S.S. and R.T.; writing—original draft, F.L., T.B., A.P.C. and R.T.; writing—review & editing, F.L., T.B., R.T. All authors have read and agreed to the published version of the manuscript.
Funding
This research received no external funding.
Conflicts of Interest
The authors declare no conflict of interest.
References
- Zeeb, H.; Shannoun, F.; WHO. WHO Handbook on Indoor Radon: A Public Health Perspective; World Health Organization: Geneva, Switzerland, 2009. [Google Scholar]
- UNSCEAR Sources and Effects of Ionizing Radiation. Report to the General Assembly, with Scientific Annexes; UNSCEAR: Vienna, Austria, 2000. [Google Scholar]
- Nazaroff, W.W. Radon transport from soil to air. Rev. Geophys. 1992, 30, 137–160. [Google Scholar] [CrossRef]
- Dai, D.; Neal, F.B.; Diem, J.; Deocampo, D.M.; Stauber, C.; Dignam, T. Confluent impact of housing and geology on indoor radon concentrations in Atlanta, Georgia, United States. Sci. Total Environ. 2019, 668, 500–511. [Google Scholar] [CrossRef] [PubMed]
- European Commission Council Directive 2013/59/Euratom of 5 December 2013. Off. J. Eur. Union 2014, L13-1, 1–73.
- Online resources: European Commission Radiation Protection 193 Radon in workplaces. In Implementing the Requirements in Council Directive 2013/59/Euratom; 2020; Available online: https://op.europa.eu/s/pDS7 (accessed on 11 November 2019).
- Online Resources: Decreto Legislativo 31 Luglio 2020, n. 101. 2020. Available online: https://www.gazzettaufficiale.it/eli/id/2020/08/12/20G00121/sg (accessed on 12 August 2020).
- Borgoni, R.; De Francesco, D.; De Bartolo, D.; Tzavidis, N. Hierarchical modeling of indoor radon concentration: How much do geology and building factors matter? J. Environ. Radioact. 2014, 138, 227–237. [Google Scholar] [CrossRef] [PubMed]
- Atik, S.; Yetis, H.; Denizli, H.; Evrendilek, F. How Do Different Locations, Floors and Aspects Influence Indoor Radon Concentrations? An Empirical Study Using Neural Networks for a University Campus in Northwestern Turkey. Indoor Built Environ. 2013, 22, 650–658. [Google Scholar] [CrossRef]
- Madureira, J.; Paciência, I.; Rufo, J.; Moreira, A.; de Oliveira Fernandes, E.; Pereira, A. Radon in indoor air of primary schools: Determinant factors, their variability and effective dose. Environ. Geochem. Health 2016, 38, 523–533. [Google Scholar] [CrossRef] [PubMed]
- Curguz, Z.; Venoso, G.; Zunic, Z.S.; Mirjanic, D.; Ampollini, M.; Carpentieri, C.; Di Carlo, C.; Caprio, M.; Alavantic, D.; Kolarz, P.; et al. Spatial Variability of Indoor Radon Concentration in Schools: Implications on Radon Measurement Protocols. Radiat. Prot. Dosimetry 2020, 191, 133–137. [Google Scholar] [CrossRef] [PubMed]
- Antignani, S.; Bochicchio, F.; Ampollini, M.; Venoso, G.; Bruni, B.; Innamorati, S.; Malaguti, L.; Stefano, A. Radon concentration variations between and within buildings of a research institute. Radiat. Meas. 2009, 44, 1040–1044. [Google Scholar] [CrossRef]
- Bochicchio, F.; Žunić, Z.S.; Carpentieri, C.; Antignani, S.; Venoso, G.; Carelli, V.; Cordedda, C.; Veselinović, N.; Tollefsen, T.; Bossew, P. Radon in indoor air of primary schools: A systematic survey to evaluate factors affecting radon concentration levels and their variability. Indoor Air 2014, 24, 315–326. [Google Scholar] [CrossRef] [PubMed]
- Ferri, G.M.; Intranuovo, G.; Cavone, D.; Corrado, V.; Birtolo, F.; Tricase, P.; Fuso, R.; Vilardi, V.; Sumerano, M.; L’Abbate, N.; et al. Estimates of the lung cancer cases attributable to radon in municipalities of two Apulia provinces (Italy) and assessment of main exposure determinants. Int. J. Environ. Res. Public Health 2018, 15, 1294. [Google Scholar] [CrossRef] [PubMed] [Green Version]
- Trevisi, R.; Caricato, A.; D’Alessandro, M.; Fernández, M.; Leonardi, F.; Luches, A.; Tonnarini, S.; Veschetti, M. A pilot study on natural radioactivity in schools of south-east Italy. Environ. Int. 2010, 36, 276–280. [Google Scholar] [CrossRef] [PubMed]
- Trevisi, R.; Leonardi, F.; Simeoni, C.; Tonnarini, S.; Veschetti, M. Indoor radon levels in schools of South-East Italy. J. Environ. Radioact. 2012, 112, 160–164. [Google Scholar] [CrossRef] [PubMed]
- Tunno, T.; Caricato, A.P.; Fernandez, M.; Leonardi, F.; Tonnarini, S.; Veschetti, M.; Zannoni, G.; Trevisi, R. Critical aspects of radon remediation in karst limestone areas: Some experiences in schools of South Italy. J. Radiol. Prot. 2017, 37, 160–175. [Google Scholar] [CrossRef] [PubMed]
- Leonardi, F.; Veschetti, M.; Tonnarini, S.; Cardellini, F.; Trevisi, R. A step towards accreditation: A robustness test of etching process. Appl. Radiat. Isot. 2015, 102, 93–97. [Google Scholar] [CrossRef] [PubMed]
- D’Alessandro, M.; Leonardi, F.; Tonnarini, S.; Trevisi, R.; Veschetti, M. Development of a framework of quality assurance practices for a radon passive dosemeter service. J. Radiol. Prot. 2010, 30, 149. [Google Scholar] [CrossRef] [PubMed]
- Cinelli, G.; Tondeur, F. Log-normality of indoor radon data in the Walloon region of Belgium. J. Environ. Radioact. 2015, 143, 100–109. [Google Scholar] [CrossRef] [PubMed]
- Alharbi, S.H.; Akber, R.A. Radon and thoron concentrations in public workplaces in Brisbane, Australia. J. Environ. Radioact. 2015, 144, 69–76. [Google Scholar] [CrossRef] [PubMed]
- Bochicchio, F.; Campos-Venuti, G.; Piermattei, S.; Nuccetelli, C.; Risica, S.; Tommasino, L.; Torri, G.; Magnoni, M.; Agnesod, G.; Sgorbati, G.; et al. Annual average and seasonal variations of residential radon concentration for all the Italian Regions. Radiat. Meas. 2005, 40, 686–694. [Google Scholar] [CrossRef]
- Charlet, J.M.; Zhu, H.C.; Poffijn, A. The radon anomaly of Porcheresse (Ardennes, Belgium). A case study. Nuovo Cim. C 1999, 22, 491–496. [Google Scholar]
Publisher’s Note: MDPI stays neutral with regard to jurisdictional claims in published maps and institutional affiliations. |
© 2021 by the authors. Licensee MDPI, Basel, Switzerland. This article is an open access article distributed under the terms and conditions of the Creative Commons Attribution (CC BY) license (https://creativecommons.org/licenses/by/4.0/).