Abstract
The Unmanned Systems Research Laboratory (USRL) of the Cyprus Institute is a new mobile exploratory platform of the EU Research Infrastructure Aerosol, Clouds and Trace Gases Research InfraStructure (ACTRIS). USRL offers exclusive Unmanned Aerial Vehicle (UAV)-sensor solutions that can be deployed anywhere in Europe and beyond, e.g., during intensive field campaigns through a transnational access scheme in compliance with the drone regulation set by the European Union Aviation Safety Agency (EASA) for the research, innovation, and training. UAV sensor systems play a growing role in the portfolio of Earth observation systems. They can provide cost-effective, spatial in-situ atmospheric observations which are complementary to stationary observation networks. They also have strong potential for calibrating and validating remote-sensing sensors and retrieval algorithms, mapping close-to-the-ground emission point sources and dispersion plumes, and evaluating the performance of atmospheric models. They can provide unique information relevant to the short- and long-range transport of gas and aerosol pollutants, radiative forcing, cloud properties, emission factors and a variety of atmospheric parameters. Since its establishment in 2015, USRL is participating in major international research projects dedicated to (1) the better understanding of aerosol-cloud interactions, (2) the profiling of aerosol optical properties in different atmospheric environments, (3) the vertical distribution of air pollutants in and above the planetary boundary layer, (4) the validation of Aeolus satellite dust products by utilizing novel UAV-balloon-sensor systems, and (5) the chemical characterization of ship and stack emissions. A comprehensive overview of the new UAV-sensor systems developed by USRL and their field deployments is presented here. This paper aims to illustrate the strong scientific potential of UAV-borne measurements in the atmospheric sciences and the need for their integration in Earth observation networks.
1. Introduction
In-situ measurements can provide a great deal of information about the atmospheric environment that impacts almost all aspects of human life. Such measurements provide essential input for evaluating satellite retrievals [1,2], establishing long-term datasets for monitoring atmospheric aerosol and gas levels, and assessing atmospheric models by giving insight into the localized air quality [3], long-range transport of pollutants, radiative forcing, cloud formation, etc. [4]. Ground-based in-situ observations performed regularly worldwide are extensively used in various studies focusing on air pollution and climate [5]. Although a number of routine balloon-borne measurements (e.g., based on radiosondes and ozonesondes) already take place, most airborne measurements are sporadic and campaign-based, and do not meet the needs of long-term monitoring of the upper levels of the atmosphere. Recent developments, mostly in aerosol technology, allowed for in-situ airborne atmospheric observations conducted with sensors on-board Unmanned Aerial Vehicles (UAVs) [6,7,8,9,10,11,12], as described in Table 1.

Table 1.
UAV-sensor scientific campaigns from literature. The location of measurements, date/period, maximum flight height, platform used, and scientific interest are stated.
Unmanned Aircraft Systems (UAS) comprise of an unmanned aircraft platform, its payload, control station, Ground Control Station (GCS), and the aircraft launch and recovery sub-systems [6]. UAS operation has become more frequent over the past decade, enabling low-cost routine observations targeting the investigation of gases and aerosols properties and their evolution within the Earth’s atmosphere. One of the benefits of the UAVs is their ability to fly over regions where no manned aircraft is allowed to fly, for example, close to a fire, a volcanic eruption, or a nuclear accident. Another advantage is that one can easily and safely recover the UAV-payload after the flight; something that is not always easy with balloons. UAS have the great potential to complement relatively low-cost ground-based measurements with an airborne in-situ component and contribute to various diverse atmospheric applications, especially over regions where surface measurements are impossible or hard to perform on a regular basis, for example over oceans. Some of them deal with (1) the calibration/validation of lidar and satellite aerosol products, e.g., of the Aerosol, Clouds and Trace Gases Research Infrastructure (ACTRIS, http:/actris.net/, accessed on 5 May 2021), (2) in-situ cloud sensing [12], (3) the representation of ground-based observations (e.g., of new particle formation [13]), (4) the mapping of ground-based emissions for Integrated Carbon Observation System (ICOS), and (5) the detection and mapping of air pollution episodes. UAS can also be valuable tools for hyperspectral or multispectral monitoring of ecosystems and hence contribute to the understanding of land-atmosphere interactions [14]. Such observations are described, for instance, in Rohi et al. [15] reporting autonomous monitoring, analysis, and air pollution measurements conducted using environmental UAVs up to 100 m altitude. Similarly, Ruiz-Jimenez et al. [11] used a miniaturised air sampling system on-board UAVs to collect Volatile Organic Compounds (VOCs) up to an altitude of 50 m. Illingworth et al. [7] presented measurements of in-situ ozone concentrations using Electrochemical Concentration Cell (ECC) ozonesonde (by Science Pump, Camden, NJ, USA) and thermodynamic measurements on-board a small-size “Skywalker” UAV. These UAV profiles were performed up to an altitude of 120 m, which is the permitted altitude for flying UAVs over the EU. Vertical profiling to investigate the development of the Planetary Boundary Layer (PBL) and to observe the vertical distribution of aerosols using a range of particle counters (MetOne OPC, Met One Instruments Inc., Washington, USA, and two TSI CPCs, TSI Inc., St Paul, USA) on-board UAVs were described in Altstädter et al. [16]. UAV integrated with mobile monitoring pollutant sensors was used for collecting Particulate Matter (PM1, PM2.5 and PM10) data within 500 m Above Ground Level (AGL) [8].
Additionally, measurements of total particle concentration, particle size distributions, aerosol absorption and black carbon concentrations along with the trade wind thermodynamic structure over the Indian Ocean from the surface up to 3000 m above sea level (asl) have been carried out [17]. Singh et al. [18] provides an overview on studies done on UAV-based air quality monitoring systems. Madokoro et al. [19] developed a drone-mounted low-cost sensor for in-situ observations of PM2.5. Malaver et al. [20] integrated a small solar-powered aircraft equipped with a gas sensing system and networked with solar-powered ground nodes to monitor pollutant gas distribution in three dimensions. Chang et al. [21] deployed a multi-rotor platform to study atmospheric mixing in the near-surface atmosphere by examining the composition of VOCs, CO, CH4, and CO2 (up to 300 m height). Berman et al. [22] describe a compact and lightweight atmospheric gas analyzer deployed on-board the NASA Sensor Integrated Environmental Remote Research Aircraft (SIERRA) UAV for sampling CO2 and CH4 at a constant altitude of 10 m over Svalbard, Norway. Shah et al. [23] implemented non-dispersive infrared CH4 measurements onboard a small and lightweight UAV to estimate emissions from industrial sites. UAV-based environmental observations can also be part of the International Society for Atmospheric Research using remotely piloted aircraft (ISARRA; https://isarra.org, accessed on 14 April 2021). ISARRA is a worldwide society for researchers that utilizes unmanned aircrafts to perform atmospheric measurements. However, there are difficulties in connecting it with international Earth observation networks.
While the great potential for UAV-based atmospheric research has been established, several challenges still need to be addressed. These include the need for longer mission duration, improved resilience to weather conditions and reduced noise impact produced by UAVs [24,25,26]. In addition, providing safe and efficient airspace access for both manned and unmanned aircraft poses significant challenges arising from the civil aviation regulations [6].
In this paper we provide a comprehensive description of the Unmanned Systems Research Laboratory (USRL, https://usrl.cyi.ac.cy/ (accessed on 1 June 2021)), which is a new mobile exploratory platform for the EU Research Infrastructure ACTRIS (Aerosol, Clouds and Trace Gases Research InfraStructure). This overview describes first the overall physical infrastructure of the facility in terms of workshops, runway (and private overhead airspace) as well as GCS characteristics. It also describes the wide range of fixed-wing and rotary-wing UAVs fully developed or partially customized by USRL, highlighting the main features that make them ideal platforms for atmospheric observations. An updated list of miniaturized atmospheric sensors flying on-board USRL UAVs is also presented here together with their main technical specifications such as their dimension, weight, detection range, sensitivity (detection limit), and time resolution. Last but not least, the scientific potential of selected recently developed UAS is illustrated with a focus on the vertical profiles of aerosol properties (size-resolved number distribution), close-to-the-ground mapping of CO2 concentrations, ozone in and above the PBL, and measurements in various atmospheric environments (e.g., arctic, marine, urban). Future perspectives and recommendations are provided at the end, with the objective of wider use of UAS in atmospheric sciences and better integration within Earth observation networks.
2. Description of the Unmanned Systems Research Laboratory (USRL)
A detailed overview of the USRL infrastructure along with its UAV fleet and atmospheric sensors is provided in the following section.
2.1. Description of the USRL Infrastructure
Airfield and airspace: The USRL private airfield (35.09505 N, 33.08172 E) is located on a plateau elevated at 327 m asl with a clear view of the northwestern side of the island (19 km distance from the sea). This rural background site is ca. 1.5 km southwest of the village of Orounda (650 inhabitants) and at a distance of 40 km west from the capital city of Nicosia. The USRL airfield is strategically located close (6.5 km distance) to the Cyprus Atmospheric Observatory (CAO, https://cao.cyi.ac.cy/ (accessed on 3 June 2021)). CAO is the largest atmospheric monitoring facility in Cyprus, providing long-term observations (>20 years) of air pollutants representative of the Eastern Mediterranean and Middle East (EMME) region (see for instance Kleanthous et al. [27]; Pikridas et al. [10]). It is the reference (rural) background station of the national air quality network and an active component of the European networks ACTRIS and EMEP (European Monitoring and Evaluation Programme). Therefore, any UAV-based atmospheric observations performed at the USRL airfield can be directly comparable with quality-checked reference atmospheric measurements performed at ground level at the CAO. Measurements consequently extend these ground observations to the first few kilometers of the atmosphere. In addition, the semi-arid hot weather conditions of Cyprus (which receives sunshine for more than 300 days per year; https://weather-and-climate.com/average-monthly-hours-Sunshine,Nicosia,Cyprus (accessed on 12 April 2021)), and the permanent (year-round) access to the private airspace above the USRL airfield offer flexible conditions to perform a large number of UAV flights for intensive field campaigns and long-term monitoring. The remoteness of the area along with the 360° clear view around the airfield offers additional optimal conditions for safe UAV operations (take-off, landing).
The USRL airfield consists of two interconnected paved runways, a hangar, and reserved overhead airspace (Figure 1). The main runway (300° orientation) is 200 m long and 12 m wide, whereas the secondary runway (0° orientation) is 90 m long and 6 m wide. The USRL exclusive overhead airspace, granted by the Department of Civil Aviation (DCA) of Cyprus under a permanently renewable NOTAM (NOTice for AirMen) status, has a diameter of 1 km and a ceiling up to 3.5 km AGL. Special permission is required for flights above 3.5 km AGL. Adjacent to the USRL permanent airspace, an extended 16 km2 airspace up to 2.5 km altitude is available upon request to the Cyprus DCA and can be used to perform specific UAV flight plans with straight-line course at different altitudes.

Figure 1.
The USRL UAS runway and the hangar at Orounda, Nicosia, as well as the mobile GCS of USRL.
Ground Control Station: Unmanned flights are remotely controlled and operated by a GCS: A stationary GCS is located in the Hangar of the airfield, whereas a portable one is configured for fast and light deployment in the field, and a mobile one is integrated into a transport vehicle (Figure 1). The mobile GCS is equipped with technology to establish a reliable communication link with UAVs for long-range missions and reliable data streaming. In addition, it serves as a mobile laboratory for the field work as well as transportation mean for the UAS.
The GCS employs a computer which connects to the UAVs using a two-way Radio Frequency (RF) communication based on a pair of modems, and specialised software. It also includes an additional RF link used by the remote pilot to manually control the UAVs and select the different flying modes. Last but not least, the GCS includes a First Person View (FPV) system, which is used to transmit real-time video feed from the UAVs to the ground. The same system also transmits real-time flying parameters retrieved from the UAV Flight Controller (FC) overlaid on the real-time video feed, which can be utilized by the Remote Pilot to navigate the UAV (i.e., Instrument Flight Rules (IFR) combined with camera vision through the real-time video feed. The GCS software and firmware used by USRL are developed with specific features that are not commercially available and optimize the unmanned atmospheric measurements. For example, the airspeed and vertical rate of descent of the UAV are automatically managed in a way to easily achieve and maintain stable air sampling flowrate of various sensors without limiting the flight performance of the UAV. In addition, the Battery Management System (BMS) along with a ‘Throttle-Kill’ feature allows the UAV to use its energy with maximum efficiency, probing the atmosphere at the highest possible altitude (e.g., 3.5–4 km AGL) without compromising the safety of the flight.
Workshops: USRL is composed of a team of ca. 10 experts with a wide range of complementary skills (electrical/electronic/mechanical engineering, software development, science, composites material fabrication and piloting). This diversity allows the facility to perform well in the design and development of the UAS, the integration of a variety of instruments as well as testing, operation, data acquisition and analysis. The USRL workshop (Figure 2) is located at the Cyprus Institute (CyI) premises (Athalassa campus, Nicosia, Cyprus). It comprises (1) an advanced electromechanical laboratory where the design and development of UAS components and integration of sensors takes place, and (2) a separated composite materials laboratory dedicated to the in-house construction of fixed-wing and multi-rotor UAVs as well as the construction of lightweight and robust mounts for optimal integration of the scientific instruments.
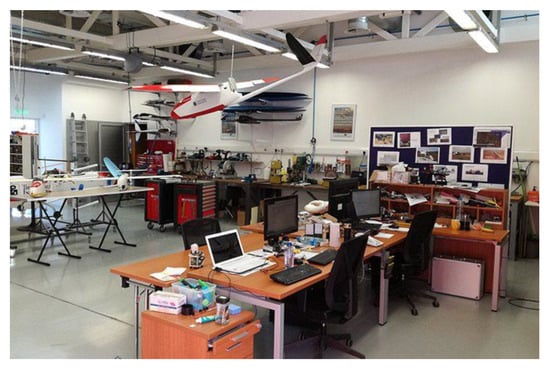
Figure 2.
The USRL laboratory at the CyI premises, Nicosia.
Complementary research infrastructure: Two additional laboratories, namely the Environmental Chemistry Laboratory (ECL) and The Instrumentation for Nanoparticle Synthesis and Characterisation Laboratory (INL), complement the activities of the USRL. The ECL of the CyI provides quality-controlled aerosol chemical analyses as part of regular laboratory intercomparison studies in the framework of international networks. Namely, (i) EMEP for ions, (ii) ACTRIS for carbonaceous aerosols, (iii) the International Atomic Energy Agency (IAEA) for trace metals, and (iv) the Quality Assurance/Science Activity Centre (QASAC) of the World Meteorological Organization (WMO) for ions. Leveraging these accreditations, off-line atmospheric (aerosol) samples obtained by means of UAS can be timely analyzed to obtain a quality-checked chemical composition that can be directly compared with reference ground-based observations.
The INL of the CyI is dedicated to the development and qualification of low-cost atmospheric sensors. Before integrating the instruments on-board the UAS, each atmospheric sensor is being tested in an environmental chamber of INL [28] where temperature and pressure can vary between −10 and +23 °C, and from 0.7 to 1.0 atm, respectively, which correspond to the atmospheric conditions over Cyprus, typically up to ca. 3 km altitude. All these tests are performed against reference instruments and are critical to ensure the best on-flight reliability of the sensors.
Compliance with the European Union Aviation Safety Agency (EASA): Since 1 January 2021, USRL has adapted to the new EASA regulations for UAS (Regulations (EU) 2019/947, 2019/945). This includes the licensing of all the pilots and crew for the EASA open and specific categories, as well as the inclusion of the technology developed by the USRL in EASA approved Operational Manuals. This compliance allows USRL to deploy easily its UAS easily within the 31 EASA member states.
2.2. Description of the UAV Fleet
The USRL fleet of unmanned aircraft that are used for the atmospheric observations of aerosols and gases vary in type, size, and weight, depending on the payload and specific application. Table 2 shows the available fleet’s specifications, performance, measurement type, and material. They are divided into small-size (<25 kg) fixed-wing and multirotors, as well as medium-size (25–150 kg) fixed-wing platforms. The small- and medium-size fixed-wing UAVs are primarily used for vertical profiling of atmospheric aerosols and gases and plume mapping, as they can cover long horizontal/vertical distances in a short timeframe. The small-size multirotor UAVs are mainly used for stack emissions, plume mapping, and vertical profiles close to urban regions up to 1.5 km altitudes AGL, due to their stability and hover ability. The Maximum-Take-Off-Weight (MTOW) to payload ratio for the small-size UAVs varies between 2:1 and 3.25:1, whereas for the medium-size UAVs is 3.75:1 and 6.25:1.

Table 2.
The UAS fleet of the USRL in terms of their specifications, performance and measurement type. This includes the wingspan for UAVs and diameter for the multi-rotors, the Maximum Take-Off Weight (MTOW) to payload ratio, the ceiling AGL that they can fly up to and their endurance and the type of energy propulsion. The measurement type characterizes the different categories of observations that each UAV is capable of performing.
Multirotors: A series of Multirotor UAS are used by USRL, namely, the “Stack Emissions Quad-Rotor”, the “Tarot 650 Quad-Rotor” and the “MK8-3500 Octo-Rotor”. These airframes are developed to easily interchange scientific payload to perform plume mapping of greenhouse gases and air pollutants and vertical profiling of the atmosphere for air-quality measurements close to urban environments where landing space is limited.
All the multirotors can be powered by LiPo batteries, whereas the Tarot 650 can also be powered by Li-Ion battery. All the multirotors are controlled through the novel USRL firmware and software, fully developed by the USRL team.
Small-size fixed-wing UAVs: All the small-size fixed-wing UAVs have a motorized electric propulsion system fed by commercially available Lithium Polymer Batteries or customized Lithium-Ion batteries built in the optimal shape and weight to achieve the best energy to weight ratio. These UAVs are hand-launched and land on the belly on any flat surface, thus minimizing the requirements for a specialized aerodrome.
The “Cobi” UAV has an airframe that has been designed and developed by USRL using lightweight robust composites material to improve the performance for atmospheric measurements in urban and remote environments. The “Skywalker 2015” airframe, which is made by Expanded PolyOlefin (EPO) foam, serves as a low-cost solution ideal for high-risk applications (i.e., in harsh environments or mobile shipborne operations, where there is a risk to lose or damage the UAV). Similarly, with the “Skywalker 2015”, the main material of the “Skywalker X8” and “I-soar” airframes is EPO foam, but the particular airframes are designed to carry larger and heavier instrumentation without increasing the cost significantly.
The MK8-3500 UAS is controlled through the Mikrokopter firmware and software, whereas the rest of the multirotors are controlled through the novel USRL firmware and software, fully developed by the USRL team. All the small-size fixed-wing UAVs are powered by Li-Ion or LiPo batteries.
Medium-size fixed-wing UAV: The “Cruiser” has a payload capacity of up to 12 kg, which also includes the weight of the fuel to power the engine and the battery used for the instrumentation. The Cruiser’s payload bay, available inside the UAS, measures 1.3 m × 0.23 m × 0.34 m (L × W × H). The UAS features a wingspan of 3.8 m. It has been configured with an internal combustion two-stroke engine placed in a push configuration enabling an altitude ceiling of 4 km. Depending on payload and environmental conditions the Cruiser can reach a flying endurance of up to 8 h. During the flight, atmospheric sampling occurs at a velocity of 28 ± 5 m/s. Due to the Cruiser’s size, a flat (ideally paved) runway is required for takeoff and landing. The Cruiser is controlled through the Micropilot Autopilot and Horizon Software. The Cruiser’s engine uses gasoline as a fuel.
Auto-Pilot (A/P) systems: The experience gained from commercially available and open-source A/P systems used for the different UAS led USRL to start developing an improved A/P system (software, firmware, and hardware). Software and hardware of the commercial and open-source A/P systems are frequently incompatible with new atmospheric instruments and sensors. This has often led to the integration of intermediate systems and quick (but not optimal) software fixes. Additionally, maintaining a fleet of UAS with different types of A/P systems and avionics can be time-consuming and dangerous, leading pilots/engineers/programmers to deal at the same time with multiple complex systems.
The purpose-built development of the novel USRL A/P system allows for easy adaptation of the scientific instruments on-board all types of UAS (fixed-wing and multirotor) owned and operated by the USRL. The direct communication of the scientific instruments without using any intermediate systems optimizes the overall weight; hence it improves the performance of the UAS, enabling a longer operation of the scientific instruments at greater distances and altitudes. The coupling of the sensors with the avionics allows enhanced data-logging and remote-control through the UAS. This is mainly achieved due to the hard-wired communication of the A/P with the sensor controllers or dataloggers which allows the direct combination of scientific data with selected flight parameters in a way that the scientific instruments do not affect the A/P operation. As a result, the remote control of the sensors along with the real-time monitoring and visualization of the atmospheric data at the GCS is accomplished without compromising the flight safety or introducing unnecessary weighty components. The resulting homogeneity between the different unmanned platforms simplifies their operation.
Flight automation: All the USRL UAVs can fly autonomously based on pre-programmed flight paths or by using more complex dynamic automation routines handled by a FC. The flights can be controlled and monitored in real-time by both commercial and in-house custom-made mobile GCS, which are capable for all the different types of UAS. Two-way communication between the UAS and ground is achieved through the GCS, which is equipped with dedicated telecommunication (Frequency-Hopping encrypted Radio Frequency (RF) modems) and visualization systems for real-time monitoring of the unmanned aircraft while flying.
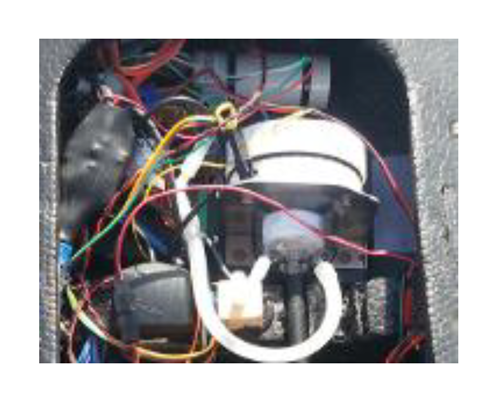
A variety of data acquisition (DAQ) systems based on small micro-controllers and single-board miniaturized computers have been designed and developed to communicate with several scientific instruments (e.g., MetOne 212 OPC, Personal Ozone Monitor (POM), Filter sampling, MicroAeth AE51, Multi-sample PEAC, etc.). In addition, custom-made GCS [29] that can remotely control and monitor the on-board DAQ system visualizing in real-time all the scientific instruments on-board the UAV has been lately re-designed around a standalone miniaturized microcontroller based on an ARM processor. The novel DAQ system (Figure 3), which is significantly improved in terms of volume with (7 cm × 3.6 cm × 2.6 cm), weight (34 g), cost and power consumption can work in a standalone mode as it includes its own micro-GPS sensor and power supply. It can also be easily interfaced with the A/P system as described above.
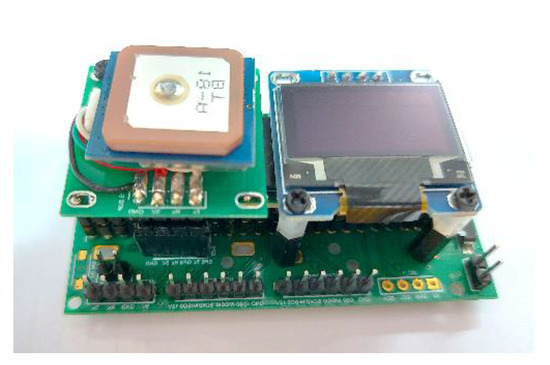
Figure 3.
The novel DAQ system of USRL; with dimensions 7 cm × 3.6 cm × 2.6 cm and a weight of 34 g.
Data acquisition: All the UAS provided in Table 2 have the capability to simultaneously control multiple instruments, as well as to acquire and transmit all the scientific parameters to the GCS. The scientific data are transmitted to the ground in real-time via an additional long-range wireless broadband communication link. The UAS can also acquire the scientific data on micro-controller based miniaturized DAQ systems with the exception that selected data and control signals are incorporated in the serial-based wireless communication link through the UAS FC. A selection of the scientific data is visualized in real-time on the customized Graphical User Interface (GUI) located at the GCS. This in-house feature is a major advancement in the operation of UAS and critical for the achievement of successful flights. It allows the operator to (1) check at any time if the instruments are working properly during the entire flight and abort the flight mission in case of failure, (2) control from the ground off-line air sampling (ON/OFF) as given time/altitude/location, (3) identify regions of interest (e.g., close-to-the-ground plumes, elevated atmospheric/dust layers) and modify interactively the flight plan to increase the sampling rate in these regions.
2.3. Description of the UAS-Balloon Systems
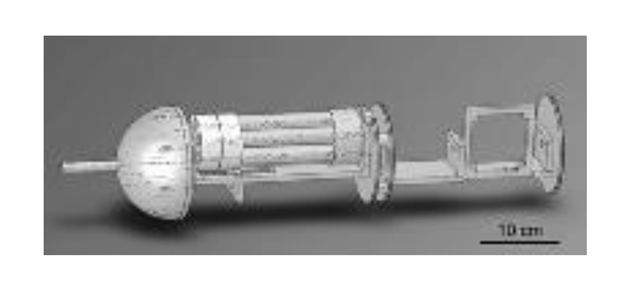
High-altitude atmospheric measurements in the upper troposphere and lower stratosphere (up to 15 km) above the Eastern Mediterranean is of particular interest since African dust layers up to 8 km altitude can be observed over Cyprus [30]. The updraft of air pollution from Asia during the monsoon period, the long-range transport of this pollution and its subsidence over the Eastern Mediterranean [31] is another motivation to profile the atmospheric column above Cyprus at higher altitudes. The current fleet (see Table 2) has a maximum altitude of 4 km. For the characterization of higher atmospheric layers such as the upper troposphere or lower stratosphere (up to 15 km altitude), large-size manned or unmanned aircraft are being used. However, such research aircrafts are costly and often not feasible for routine observations. Meteorological balloons carrying sensors can offer an interesting alternative with, nevertheless, some limitations when it comes to recovering the sensors. To account for these limitations, a UAS-balloon system is currently being developed at USRL (Figure 4), which is a fixed-wing UAS that can be launched up to the lower stratosphere with the aid of a meteorological balloon. UAS-balloon systems have been reported by Kräuchi and Philipona [32] for radiation profiles but, to the best of our knowledge, no studies reported so far have used UAS-balloon systems for gas/aerosol measurements.
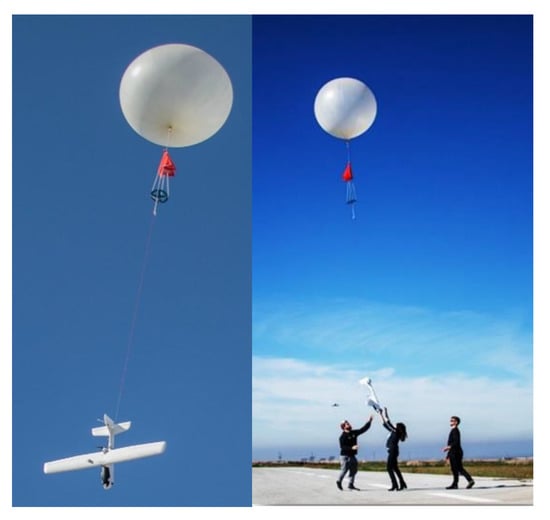
Figure 4.
The maiden launch of the UAV-balloon system, February 2020, Orounda, Cyprus.
Here, the meteorological balloon is selected and filled with a certain amount of Helium gas depending on the payload (i.e., the UAS), the required ascent rate and the bursting altitude. Upon reaching the desired altitude, the UAS is automatically released from the balloon and glides back to the launch pad or to an alternative landing location for recovering the sensors and data. This configuration offers the great advantage of higher payload capacity for scientific instrumentation due to the very low energy requirement for the UAV (i.e., smaller/lighter batteries). The ascent profiles of the atmospheric sensors are also comparable to balloon-borne ones (fully Lagrangian transport pattern). As a result, it is envisioned that the UAS-balloon system will offer the atmospheric community an easy-to-use and cost-effective solution to perform routine flights within new atmospheric environments (Open Ocean/Upper Troposphere) and with the capability of providing dense vertical profiles of key climate indicators in the troposphere.
2.4. Atmospheric Instrumentation Deployed On-Board the UAVs
A range of commercially available and in-house custom-made atmospheric sensors have been tested and integrated on-board the UAVs of USRL for scientific purposes. Table 3 provides an overview of the different atmospheric instruments that have been deployed. These instruments consist of meteorological sensors, Optical Particle Counters (OPCs), particle samplers, and atmospheric gas sensors. These are presented separately below.

Table 3.
The atmospheric instruments for aerosol and gas observations integrated on-board the UAS.
2.4.1. Meteorological Sensors
Relative Humidity (RH) and Air Temperature (T) data recorded during UAV flights are critical parameters to interpret vertical profiles performed with atmospheric sensors, providing information on the Planetary Boundary Layer Height (inversion layer), the altitude of specific atmospheric (dust) layers and clouds in the free troposphere, as well as the influence of water absorption onto ambient aerosols (RH). These measurements are obtained with the HC2-ROPCB sensor (from the Rotronic Company [33]) mounted below the aircraft’s wing. A customized 3-D printed probe is housing the sensor to protect it from possible shocks and direct solar irradiance while ensuring proper air flow during flight.
The altitude of the UAV is retrieved from the on-board barometer and GPS sensor. Using these two values, an altitude position estimator based on Kalman Filtering minimizes the error and improves the altitude positioning. The apparent wind speed is retrieved from an air-speed sensor, which is in direct communication with the FC. Ground speed is accurately calculated by the GPS sensor. A true wind speed sensor is not available, however, the true wind velocity and direction are estimated by the FC using the airspeed and navigation data.
2.4.2. Aerosol Sensors
OPC-N2: The OPC manufactured commercially by Alphasense (http://www.alphasense.com (accessed on 14 May 2021)), is a lightweight (~100 g) Optical Particle Counter (OPC) that is suitable for aerosol counting in the size range from 0.38 up to 17.00 μm in diameter, across 16 bins [34]. Crilley et al. [35] showed that the OPC-N2 can accurately measure the mass concentration of ambient airborne particles provided that the sensors are calibrated and corrected for RH. Agreement in the particle number concentrations measured by the OPC-N2 and reference instruments (GRIMM OPC) were found to be within 40%, under different temperature and pressure conditions, for particle sizes >1 mm [28]. To quantify the OPC-N2 sensor for inline measurements on-board a UAV (or even for ground observations), its sample flow system has to be modified for maintaining a sufficient flow rate [28]. The modified version of OPC-N2 deployed on-board our UAV flights integrates a pump (model: NMP830KNDC) and a critical orifice, to keep the flowrate constant at 1.2 L/min. Additionally, a home-made lightweight silica gel dryer is deployed upstream of the OPC-N2 for humid environments (RH > 50%) for minimizing the influence of aerosol water absorption. Its dimensions are 24 cm × 4 cm. The dryer is made of carbon fiber and its total weight (including the silica gel) is 204 g. The volume and the internal surface of the silica gel is optimized in accordance with the drying requirements of the OPC and the flight duration.
The miniaturized, lightweight DAQ system of the OPC-N2, based on an ARM-processor, includes a GPS receiver to synchronize the OPC measurements with the flight coordinates. The datalogging frequency is set to 1 Hz and the data (OPC measurements (16 bin counts), desired parameters of the NMEA GNSS sentences/or GNSS information, temperature and relative humidity from a lightweight Rotronic sensor) are logged on a micro SD-card.
UCASS: The Universal Cloud and Aerosol Sounding System (UCASS) is a lightweight (~230 g) OPC that was designed for use as a balloon-borne instrument, as a dropsonde, or on-board UAVs [36,37]. The UCASS operates a 658-nm laser diode. Depending on the configuration mode and the laboratory calibration, UCASS can measure either aerosols in the diameter (optical) range between 0.4 and 17.0 μm or cloud droplets in the detection range from 1.0 to 40.0 μm. UCASS airborne particle size distributions and number concentrations were found to be in close resemblance with other reference OPCs on-board the DLR Falcon manned research aircraft [30]. The UCASS DAQ system is the same as the one of OPC-N2 described above.
POPS: The Printed Optical Particle Spectrometer (POPS; later renamed as Portable Optical Particle Spectrometer) is a lightweight OPC designed for use on UAVs or as part of a balloon-borne sounding system [38]. POPS uses a 405-nm diode laser and measures aerosol number concentration in the diameter range from 0.14 to 3.0 μm. A dryer is attached at the inlet of the instrument when the UAV-POPS system flies inside humid environments (with RH > 50%). Ground-based and UAV observations of POPS compared with reference instruments have shown that POPS can provide data of scientific quality and reliable vertical profiles of particle size distribution [39].
MetOne 212-2: The MetOne 212-2 OPC has been designed for the detection of aerosols in the diameter range from 0.5 to 10.0 μm. This OPC has been deployed on-board the Cruiser UAV of USRL during several field campaigns in Cyprus in the framework of the EU project Biogenic versus Anthropogenic emissions on Clouds and Climate: towards a Holistic UnderStanding (BACCHUS) in order to perform vertical profiles of aerosol mass concentrations and compare them with remote sensing observations [9]. The MetOne 212-2 measurements performed during BACCHUS were further exploited to retrieve Ice Nuclei Particles (INP) concentrations from lidar observations [40,41].
COBALD: The Compact Optical Backscatter Aerosol Detector (COBALD) is a lightweight sonde that detects the backscatter light from air molecules, aerosol, or cloud droplets. It uses two high-power light-emitting diodes (LEDs) operating at 455 nm (blue) and 940 nm (infrared) with a silicon detector averaging the light scattered back from molecules or aerosols at angles centered near 173° for typically 1 s time steps [42,43,44]. Its weight was reduced from 500 g to 310 g (without battery), including the data logging system. COBALD measurements are only carried out at local nighttime as daylight saturates the sensitive detector. Two COBALDs are deployed on-board the Skywalker UAV, one pointing upwards and one horizontally, with a 90° angular distance to examine the potential orientation of dust particles.
PEAC: The single/multi-sample Programmable Electrostatic Aerosol Collector (PEAC) is a custom-built electrostatic precipitator designed for the collection and off-line analysis of INP, up to 7 samples for the multi-sample PEAC. This device was successfully deployed during the BACCHUS field campaigns in Cyprus at an altitude up to 2500 m asl [45] and showed INP airborne observations in-line with the developed INP parameterisation method applied on space-borne lidar observations [40].
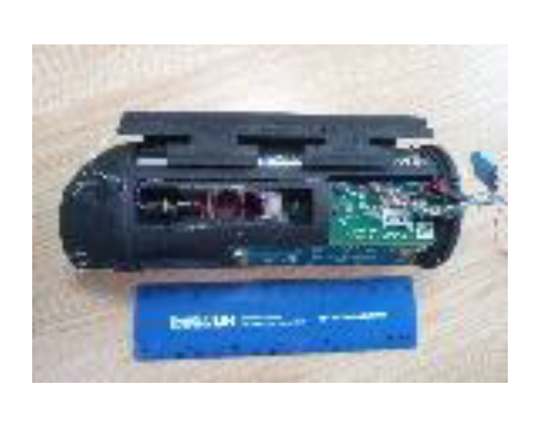
GPAC: A miniaturized and 3D-printed version of the Giant Particle Collector (GPaC; [46]), a body impactor, has been designed for UAV applications. The modified GPaC collects particles sizing up to several hundreds of micrometers with a lowest cut-off between 1 and 5 μm, depending on the flight conditions. An adhesive substrate is affixed to a 1.1 cm diameter impactor head, which is inserted into and collected from the GPaC unit before and after each flight. Samples are usually subject to off-line scanning electron microscope analysis, yielding information on the morphology and composition of the particles as well as on the microphysical properties. There are two GPaC samplers on-board the UAV, one on each wing. The autopilot is set to protrude a GPaC sampler after stabilizing at a set altitude for a set amount of time. This allows sampling on a first substrate. The sampling holder then retracts back into its cover. The same procedure is followed for the second substrate.
Filter sampler: The filter sampler is located in the nose of the UAV so as to have both inlets extruding at the forefront and avoid any airflow turbulence. The opening of the valves and powering of the pump can be triggered automatically by the FC or manually through the Remote Control of the UAV, and in parallel with GPaC. The sampling flow rate is set to 5 L/min, and a TSI mass flow meter (model: 4143; https://tsi.com/products/flow-meters,-flow-sensors,-and-flow-analyzers/4000-series-analog-and-digital-flow-meters/mass-flow-meter-4143/ (accessed on 12 April 2021)) is placed behind the pump to record the flow. The pump model used is NMP 850 KPDC-B HP. Commonly, track-etched polycarbonate membrane filters (e.g., marketed as Nuclepore by Whatman) are used as a suitable substrate for off-line scanning electron microscopy. Alternatively, material for bulk-chemical analyses (e.g., PM, ions, elemental/organic carbon, trace metals, trace organics, etc.) can be collected on any suitable 47-mm substrate. However, due to the low sampling volume inherent to the UAVs operating conditions, these techniques are best used under heavy polluted conditions (e.g., close-to-stack emissions).
MicroAeth AE51: The microAeth AE51 (AethLabs, San Francisco, CA, USA) is a portable, lightweight, compact, inexpensive, easily operated, and battery-powered light absorption photometer using a light source with a wavelength of 880 nm [47,48,49]. All these characteristics have promoted its use onboard UAVs for the vertical profiling of Black Carbon (see, for instance, [50,51]). On the other hand, due to a relatively low air sampling flow rate (0.1–0.2 L/min), it may lack sensitivity for low concentrations of absorbing aerosols, which can be an issue when investigating the low amounts of aerosols usually met in remote regions and/or the free troposphere. The microAeth AE51 was successfully deployed with USRL UAVs in the framework of field campaigns in Greece (Athens) and Cyprus [10].
DWP: The dual-wavelength absorption photometer (DWP) is a prototype light absorption photometer constructed as a modification of the AE51, by placing an additional light source emitting at 370 nm allowing for the source apportionment of black carbon between fossil fuel and biomass burning [52]. Additionally, the sensitivity of the absorption measurements has been increased by almost a factor of 10, using a flowrate of up to 2 L/min, by replacing the original AE51 pump with an external pump whose flow rate is controlled by a critical orifice [10].
STAP: The Single-channel Tricolor Absorption Photometer (STAP), formerly named ABS (see [53]) has been manufactured following the design of the Particle Soot Absorption Photometer (PSAP; [54]). Absorption measurements are performed at 445, 515, and 633 nm at the highest measurement rate of 1 Hz. A laminar flow element is used to measure the sample volumetric flow rate in real-time, and an onboard software automatically controls the small integrated vacuum pump to maintain a constant sample volume flow independent of the UAV altitude. The sample flow is dried to eliminate artifacts due to water uptake by the filters. The STAP was successfully deployed with USRL UAV and intercompared with AE51 and DWP during UAV flight conditions [10].
2.4.3. Atmospheric Gas Sensors
ECC ozonesonde: The atmospheric ozone concentrations are obtained with the ECC ozonesonde (EN-SCI, Westminster, CO, US) mounted in the upper section of the UAV’s nose (forward to the wings). EEC ozonesonde working principle is described in Deshler et al. [55]. To reduce the size and weight of the οzonesonde, the system was disassembled and the aluminum casing of the sonde replaced by a single sheet, half the dimensions of the original footprint. A vibration dampening system was added between the ozonesonde and the part attaching to the UAV board. This is necessary as the sonde’s pump creates intense vibration, which could be problematic to the UAV’s electronics. Ozonesonde’s weight was reduced from 260 g to 215 g, including full cells and a data logging system.
SenseAir HPP CO2: Atmospheric CO2 observations are performed with a High-Performance Platform (HPP) non-dispersive infrared CO2 sensor from Senseair AB (Delsbo, Sweden) [56,57]. The CO2 sensor is integrated on-board the UAS of USRL for CO2 measurements of ambient air throughout the atmospheric column and for capturing the spatial variability of CO2 concentration. More information on the integration, qualification, and exploitation of SenseAir HPP CO2 mapping can be found in Liu et al. (in preparation).
3. Results
The participation of USRL UAS in atmospheric research programs over the past 5 years is reported in Table 4 along with other relevant information (time, location, UAV type, atmospheric sensor type, and references). A brief overview of the main scientific findings for each of these research programs is provided below.

Table 4.
Research experiments, time periods, locations, details on the UAVs and on the instruments on-board along with the obtained data type.
3.1. Profiling of INP over Cyprus
In the framework of the EU-funded BACCHUS project, Schrod et al. [46] reported the first ever UAV-based INP measurements (up to 2.5 km altitude) from 42 individual UAV flights performed within a month. This study highlighted that mineral dust (or a constituent related to dust) was a major contributor to the ice-nucleating properties of the observed aerosol load. The INP concentration in elevated plumes was on average a factor of 10 higher than at ground level leading to the conclusion that INP measurements at ground level may be of limited significance to assess cloud formation processes, hence highlighting the major contribution of UAV-based INP monitoring in the cloud region. These UAS profiles were further used to test the ability of lidar measurements for retrieving INP concentration profiles [40] with direct application on Cloud-Aerosol Lidar and Infrared Pathfinder Satellite Observations (CALIPSO) space-borne lidar observations; used for the production of global 3-D products of cloud-relevant particle number concentrations. During this 1-month campaign, Mamali et al. [9] compared, for the first time, vertical profiles of the aerosol mass concentration derived from light detection and ranging (lidar) observations and in situ UAV-based OPC measurements (Figure S1) during moderate and weak Saharan dust episodes. Agreement between the two measurement methods showed that both techniques can be used interchangeably for determining the vertical profiles of aerosol concentrations, bringing them a step closer towards their systematic exploitation in climate models.
3.2. Profiling of Aerosol Light Absorption over Athens (Greece)
In the framework of the EU funded ACTRIS2 project, Pikridas et al. [10] tested for the first time the in-flight performance of three miniaturized aerosol absorption sensors integrated on board small-sized UAS (Figure S2). The overall potential use of miniature aerosol absorption sensors on-board small UAS was illustrated in this study with the dense monitoring of the vertical distribution of equivalent Black Carbon up to 1 km asl (exceeding the top of the PBL), highlighting a heterogeneous boundary layer concentration of absorbing aerosol in the early morning hours due to the concurrent peak traffic emissions at ground-level and the fast development of the boundary layer. Further exploitation of these UAV-based aerosol light absorption profiles was performed by Tsekeri et al. [58] with the comparison of profile products from the novel Generalized Aerosol Retrieval from Radiometer and Lidar Combined data algorithm (GARRLiC).
3.3. Profiling of Aerosol-Cloud Interaction Observations over Northern Finland
In-situ observations of aerosol and cloud interaction are essential for improving our fundamental understanding of their role in the climate system [59]. Properties of aerosol-cloud interactions in the climate change Arctic hotspot are an important input to climate models, while the impact of clouds remains one of the largest uncertainties [60,61]. The 7th Pallas Cloud Experiment (PaCE) in Finland was organized in September 2017 and focused on cloud-aerosol interactions through in-situ and remote sensing methods. The UAS of USRL were deployed during this campaign (Figure S3) and provided in-situ data of aerosol optical and microphysical properties inside/outside (below/above) clouds. These data were used in conjunction with ground-based remote sensing and in-situ observations performed at the Pallas-Sodankyla GAW station in order to enhance the understanding of aerosol activation and cloud processes. The UAS was equipped with meteorological sensors (RH, T), a video camera pointing forward to capture cloud scenes and a modified Alphasense OPC-N2 with an integrated dryer at the inlet (see description above). Overall, nine successful flights were performed during the PaCE field campaign.
Results from the aerosol profiling carried out with the modified Alphasense OPC-N2 on-board a UAV profiling on 24 September 2017 are presented here. Figure 5 shows ascent profiles of total particle number concentration in the diameter range from 0.38 to 17.5 μm, as measured by the Alphasense OPC and the corresponding meteorological profiles of air temperature and relative humidity. The total number concentration varies between 1 and 10 cm−3 from the surface up to 1300 m altitude, whereas at the uppermost layer (1500–1600 m altitude), the number concentration gradually increases up to 18 cm−3. RH reaches a value of 100% between 200 and 600 m AGL, indicating low-level clouds as confirmed by the video recording. This 400 m height cloud layer is also characterized by a gradual decline of temperature from +7 °C at the cloud base to about +5 °C at 500 m altitude, where a temperature inversion has occurred. The right panel of Figure 6 shows a picture taken by the camera on-board the UAV when the UAV was flying inside the cloud, whereas the left panel shows a picture taken when the UAV exited the cloud base. Figure 7 shows the averaged particle number size distributions of aerosols inside the cloud (between 200 and 600 m AGL) and above the cloud layer. Differences observed in the aerosol size distribution inside/above the cloud clearly indicate the capacity of the UAV to collect and measure cloud droplets, detected here above 2–3 µm diameter. Interestingly, submicron (cloud droplet interstitial) aerosols can also be detected within the cloud.
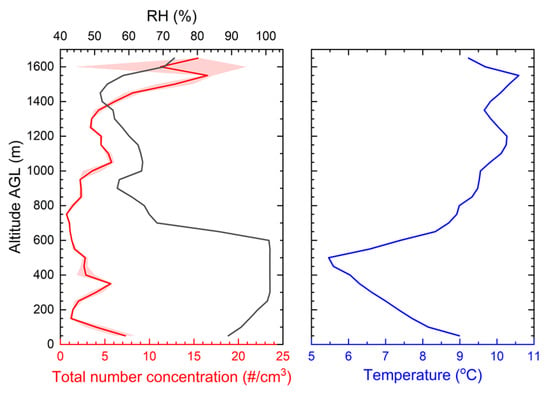
Figure 5.
Ascent profiles of total particle number concentration obtained by the Alphasense OPC-N2 on-board the UAV on 24 September 2017 during PaCE field experiment in Finland. Red shaded area refers to the standard deviation of the measurements (per 20 m).

Figure 6.
Pictures obtained from video recording on-board the UAV on 24 September 2017 during PaCE field experiment in Finland. Left panel shows a picture right before the UAV entered the cloud at 300 m AGL altitude, while right panel shows a picture when the UAV was flying inside the cloud.
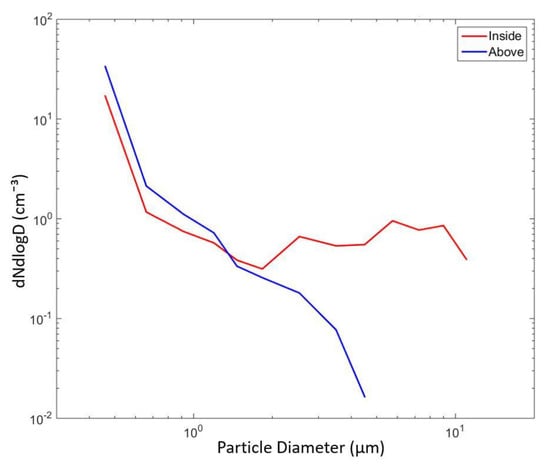
Figure 7.
Number particle size distributions inside and outside the cloud obtained by the Alphasense OPC on-board the UAV on 24 Scheme 2017. during PaCE field experiment in Finland.
3.4. Intensive Profiling of PM2.5 over Nicosia
Air quality models can be used to predict (and adapt to) major pollution events due to local, regional or long-range transported sources such as desert dust. They can also serve the design of efficient local action plans by testing, for instance, the benefits of different emission scenarios and/or abatement measures. The validity and accuracy of these Air Quality models critically depend on the availability of atmospheric observations not only at ground level but also in the atmospheric column to account for the vertical dispersion of air pollution. If ground-based atmospheric observations are quite straightforward to obtain, vertical information is much more difficult to get and remote sensing technologies can only partially fill the current gap in vertical observations of air pollutants.
In the framework of the AQ-SERVE (Air Quality Services for a Cleaner Air in Cyprus) project, USRL developed a novel UAS based on an automated lightweight (Tarot 650) quadcopter and optimized it for the acquisition of dense (every 30 min) vertical profiles over continuous monitoring periods of several hours measuring particle size distributions and mass concentrations (PM) up to 1.5 km AGL. Airborne PM measurements were obtained by an OPC-N2, which was attached with a dryer. The objective of this campaign was to demonstrate the capacity of UAS to perform a continuous dense scanning of PM in the first hundred meters of the atmosphere where ground-based remote sensing techniques (e.g., lidar, ceilometer) often fail to perform accurate measurements. The date and time of the campaign were chosen so as to (i) enable crossing the PBL (typical low during winter) and reach free tropospheric conditions, (ii) capture the traffic-induced morning PM pollution peak and (iii) investigate the vertical dispersion of ground-based emissions along with the diurnal development of the PBL. To the best of our knowledge, this is the first time that such dense (20-min time resolution) in-situ vertical profiling of PM is performed using UAS. The small size and weight of the quadcopter (Figure S4), along with its large take-off weight-to-payload ratio (which is 3:1, without the power source), makes it an easy, cost-effective, and low-risk system to operate for narrow air-spaces within urban environments. The performance of this UAS was successfully tested during winter 2019–2020 over Nicosia with intensive (up to 15) vertical profiles of PM2.5 up to an altitude of 1500 m AGL to characterize particulate pollution within and above the PBL. The intensive profiling was conducted on a small launching pad (15 m × 15 m) next to the CyI premises, a residential (urban background) area of Nicosia. Measurements started at 0300 UTC (0500 local time, LT) and lasted 8 h with clear-sky (cloud-free) conditions. The duration of each flight was typically 15–25 min (up and down) with a ceiling set at 800 m AGL in the first hours and up to 1500 m AGL at the end of the profiling survey in order to reach the PBL and free tropospheric PM measurements. About 10 min were needed between each flight to (1) download the OPC data, (2) condition the silica gel dryer upstream the OPC in order to maintain its drying efficiency, and (3) change the battery of the UAV. Aerosol number concentration of the OPC size bins below 2.5 µm diameter were aggregated and converted into mass concentration.
Figure 8 shows the vertical distribution of fine particulate pollution for each of the 15 individual flights. The PBL height (derived from the temperature inversion measured by the UAV T/RH sensor) is reported in black dashed line and shows a stable altitude, around 500 m AGL, from 0500 LT until 1030 LT, and steeply increase until the end of the UAV profiling (1230 LT). The sunrise in Nicosia on that day was at 0618 LT. In the first hours (before the morning traffic peak), the typical PM2.5 profile shows a gradual decrease from ca. 15 μg/m3 close to the surface to values close to 5 μg/m3 at 500 m AGL when crossing the PBL. PM concentrations were remaining stable and below 5 μg/m3 above the PBL. The morning traffic-peak is evidenced from PM at 0830 LT with high PM integrated concentrations observed until 0930–1000. PM distribution during the morning traffic rush hours is in the range 15–25 µg/m3 and homogeneously distributed in the first 500 m (i.e., no clear gradual decrease in this altitude range) with again a sharp decrease below 5 μg/m3 when crossing the PBL at 500 m AGL. Interestingly, the development of PBL (from 1030 LT) does not seem to affect the PM vertical distribution, which seems to dilute homogeneously within the boundary layer. These preliminary results differ from those we obtained from equivalent black carbon concentration over Athens and Milano [10,62], which have reported a much less homogenous vertical dispersion of traffic emissions, and therefore highlighting the need for further and more systematic UAV-based aerosol profiling over urban areas.
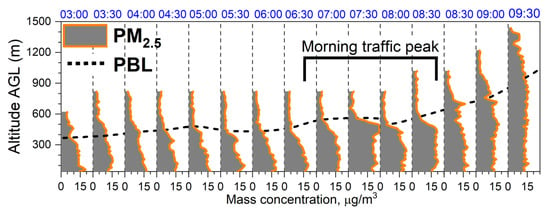
Figure 8.
PM2.5 UAV-OPC profile of mass concentration over Nicosia, Cyprus. Measurements taken on 28 February 2020 between 0300 and 1000 UTC.
3.5. Profiling of Aerosol Properties in Various Marine Regions
The AQABA (Air Quality and climate in the Arabian Basin; Table 4) field campaign took place in summer 2017, covering a ship track from Toulon (France) to Kuwait City (Kuwait) through the Mediterranean, around the Arabian Peninsula and back. The objective of this campaign was to enhance atmospheric observations in a region (Eastern Mediterranean and Middle East) which is expected to be significantly impacted by climate change [63]. A large suite of instruments was operated during this campaign [63,64,65,66,67,68,69,70], crossing regions that were influenced by anthropogenic emissions from megacities, petrochemical and shipping activity, and desert dust emissions.
In the framework of AQABA, the USRL, in collaboration with the Ecole Nationale de l’Aviation Civile (ENAC, Toulouse, France), developed a cost-effective small-size fixed-wing UAV-sensor system based on the paparazzi autopilot system [69], with the capability of providing autonomous aerosol measurements (OPC-N2) in the atmospheric column up to an altitude of 2500 m asl. Hand-launch was used for taking off the UAV, while manual landing was performed on a net installed on the ship stern while sailing (Figure S5). Pre-programmed UAV flights were performed in a spiral pattern (ascent and descent), whereas the spiral center was automatically and continuously shifted relatively to the ship’s movement, allowing direct comparison with shipborne ceilometer measurements (Figure 9b). The challenging manual landing on deck has been addressed with a 12 m × 6 m dismountable net for safe recovery of UAVs. A total of 19 successful UAV flights provided vertical observations of size-resolved aerosol number measurements. These measurements pointed out the highly complex atmospheric structures in the different marine regions crossed by the ship [70]. One of these UAV profiles is presented here, while a more systematic comparison between UAV and remote sensing (ceilometer) observations can be found in Unga et al. (in preparation).
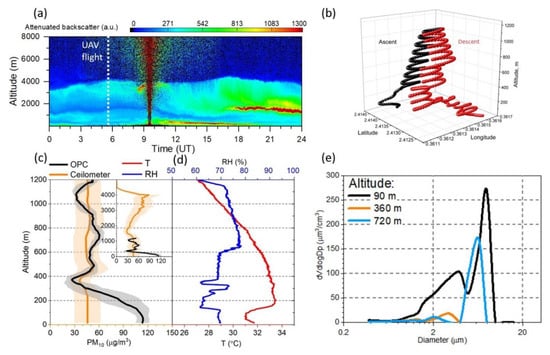
Figure 9.
(a) Attenuated backscatter at 1064 nm as measured by the CHM15k ceilometer on 9 July 2017 transect during the AQABA campaign; the dotted white line marks the time of the UAV flight, (b) ascending and descending UAV flights tracks, (c) PM10 concentration profiles as measured by the OPC-N2 during the UAV ascending flight (black) and derived from ceilometer measurements (orange); the shaded areas denote the corresponding uncertainties and the insert figure represents the complete PM10 profile as derived from ceilometer measurements, (d) temperature, T (red) and relative humidity, RH (blue) profiles as measured by the sensors mounted on the UAV and (e) volume size distributions at 90 m, 360 m and 720 m altitude as measured by the OPC-N2 during the UAV ascending flight.
Measurements with the modified Alphasense OPC-N2 on-board the UAV were performed in the Red Sea, close to the port of Djeddah (Saudi Arabia), on 9 July 2017 are presented in Figure 9. The inlet of the OPC-N2 was attached with a dryer (see description above). The attenuated backscatter signal at 1064 nm measured by the vessel-based Lufft CHM15k ceilometer shows multiple layers of atmospheric aerosols, primarily desert dust, up to 4500 m altitude (Figure 9a). During the night-time and morning (0000–0700 UTC), the Marine Boundary Layer (MBL) was below 250 m altitude, and well separated both from the nocturnal residual layer (250–1600 m) and the transported desert dust layer in the free troposphere (1700–4100 m). The UAV ascending and descending flight was performed around 0600 UTC (dotted white line in Figure 9a in a spiral shape shown in Figure 9b). The UAV reached an altitude of 1200 m in 8 min and descended in 10 min. The mean vertical resolution of the OPC-N2 Alphasense measurements was therefore estimated to be 3.2 m. The PM10 mass concentration profile from the ceilometer measurements was derived using a Mass Extinction Efficiency (MEE) approach [71,72] implemented in the BASIC inversion algorithm [73,74]. The PM10 was calculated using a particle density of 2.6 gcm−3, a value representative for Saharan dust, for both OPC-N2 number size distribution measurements and ceilometer MEE approach constrained by Aerosol Optical Depth (AOD) measurements. The spectral AOD was measured by an automatic CIMEL CE318-T sun/sky/lunar photometer embarked on the research vessel [75,76,77]. Figure 9c shows the PM10 profile for both ceilometer and UAV observations up to 1200 m asl, and only for ceilometer up to an altitude of 4000 m in the inserted graph of this figure. Note that PM10 data derived from the ceilometer below 300 m are extrapolated (and assumed to be constant) due to the limitation of this instrument to retrieve signals below this altitude. As shown in Figure 9d, the MBL height (ca. 100–200 m asl) is well delimited in the T and RH profiles, showing an increase of T (+2 °C) and decrease in RH (from 70% to 60%). Overall, a good agreement between the two derived PM10 concentration profiles was found above 300 m altitude, within the OPC standard deviation and ceilometer uncertainties. The uncertainty on the PM10 ceilometer profile is estimated from the uncertainties on the retrieval of extinction coefficient (15%) and the assumptions made on the aerosol model (the particle size distribution, the complex refractive index and particle density) to derive the mass concentration profiles; resulting in total uncertainty of 40% on the PM10 profiles [73,74].
The retrieval of PM10 from OPC-N2 seems more accurate, showing micro-structures not detected by the ceilometer. The strong discrepancy observed below 300 m reflects the inability of the ceilometer to properly retrieve PM10 concentrations and therefore highlights the added-value of in-situ UAV profiles in the first hundred meters above the sea. Figure 9e shows three aerosol volume size distributions derived from OPC-N2 measurements at the altitudes of 90, 360, and 720 m asl, respectively. Higher volume concentrations of coarse particles are found in the MBL, possibly due to sea salt, while the aerosol volume size distribution for higher altitudes shows different features pointing out contrasted (poorly mixed) atmospheric layers. Once again, these in-situ results highlight the potential of UAV measurements for the validation of inversion-derived remote sensing products such as ceilometers.
3.6. Profiling of Aerosol Properties during Dust Events over Cyprus
The strategic location of Cyprus, at the crossroads of three continents, provides the unique opportunity to monitor dust transport events from the two largest deserts worldwide (Sahara and Arabian Peninsula; e.g., [78]) as well as Asian Monsoon stratospheric transport [31] and long-range transport of pollution from Europe and Middle East. Lidar-based studies conducted recently over Cyprus have highlighted the complex atmospheric structure in the region with episodically high levels of pollution and dust layers originating from both Africa and the Middle East [79,80,81]. As part of a long-term UAV-based aerosol profiling survey performed in Cyprus (USRL runway at Orounda), we illustrate here the complexity of the atmospheric layers during dust episodes.
Middle East dust episode: Figure 10 shows the vertically-resolved ascent profiles of PM2.5 obtained over 2 days (11 and 12 November 2019) covering a moderate dust even from the Middle East as illustrated from back-trajectory analysis (Figure 11a,b). These profiles were obtained from the integration of the 16 aerosol size bins of the POPS (Table 3) installed on-board the small-size fixed-wing I-Soar UAV (Table 2). Figure 12 shows the POPS installed on-board the UAV.
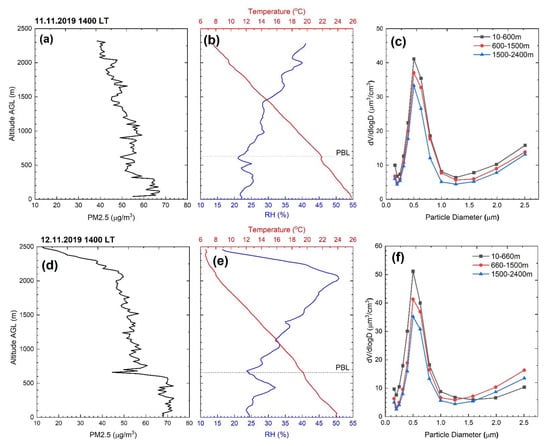
Figure 10.
UAV measurements obtained by POPS OPC during a moderate dust event over Orounda on 11 (a–c) and 12 (d–f) November 2019, including height profiles of PM2.5 concentrations, RH and temperature, and volume–size distributions averaged over three selected height levels.
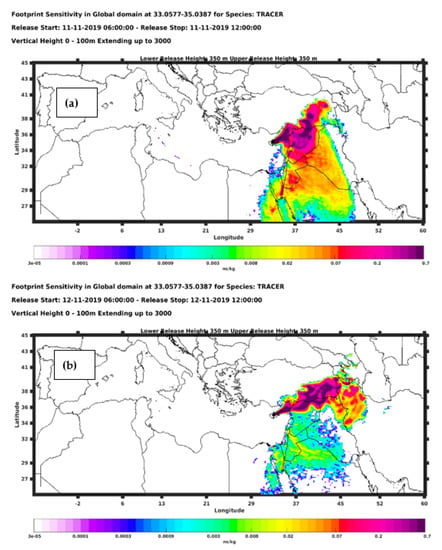
Figure 11.
The 120-h Flexpart backward trajectories starting over Nicosia between 0600 and 1200 UTC on 11 (a) and 12 (b) November 2019. Colour coding refers to the potential emission sensitivity (ns/kg) of the air masses.
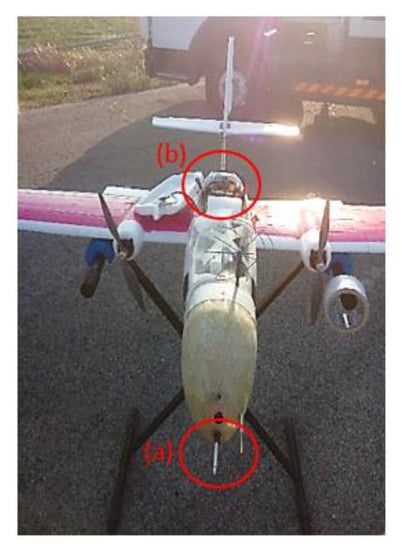
Figure 12.
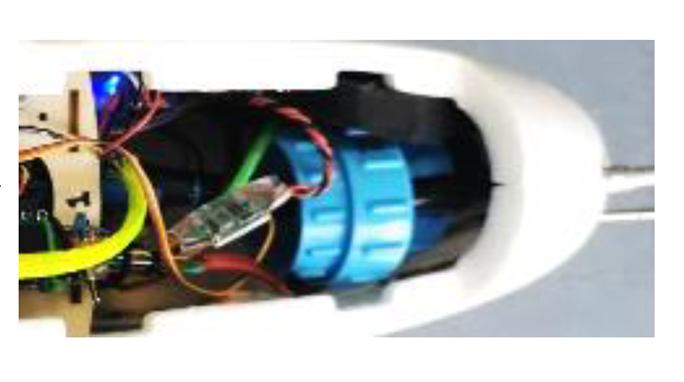
The integration of POPS OPC in the I-SOAR fixed-wing UAV. Circle (a) shows the inlet placed at the front of the UAV, and circle (b) shows the instrument installed inside the UAV.
PM2.5 concentrations are found to be higher close to the surface (up to 70 μg/m3), and gradually decreased in the uppermost layers for both cases. The temperature was 25 °C (at ground-level) and gradually decreased to 6 °C at 2500 m AGL, whereas RH was found between 20% and 50% for both cases, as shown in Figure 10b,e. A closer look at the POPS measurements regarding the volume–size distributions averaged over three height layers is provided in Figure 10c,f. Figure 10c shows that the altitude range between 10 and 600 m is dominated by particles with a mode diameter of 0.5 µm with the mean volume concentration reaching up to 40 μm3/cm3. Similar results were found during the second day of the dust event, as show in Figure 10d–f, but with the mean volume concentration reaching up to 50 μm3/cm3 at the height layer between 10 and 660 m AGL.
Saharan dust episode: UCASS OPC (described in Table 3) profiles were conducted over Nicosia during a moderate dust event from the Saharan desert on 10 March 2020 as illustrated from back-trajectory analysis (Figure 13). Two UCASS units were attached below the two wings (one at the left and one at the right-wing) of the Skywalker fixed-wing UAV, as shown in Figure 14. The UAV observations were performed in climbing mode following horizontal legs of 1–2 km length. Figure 15 shows the meteorological profiles of RH and temperature as obtained during the three UCASS flights in the morning of 10 March 2020 (flight 1: 0840 UTC, flight 1: 0945 UTC, flight 3: 1200 UTC) over Orounda. The UAV-UCASS system flew up to 1900 m height AGL, and the average duration of the ascent flights was 25 min. Humid layers (RH up to 95%) were observed between 800 and 1400 m altitude AGL.
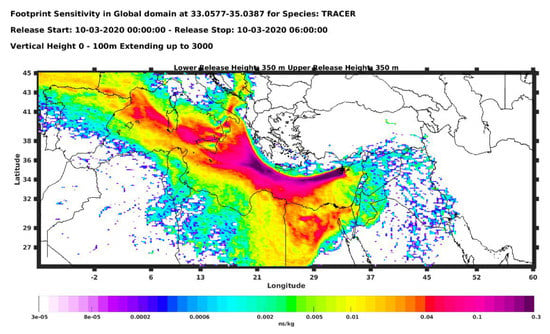
Figure 13.
The 120-h Flexpart backward trajectories starting over Nicosia between 0600 and 1200 UTC on 10 March 2020. Colour coding refers to the potential emission sensitivity (ns/kg) of the air masses.
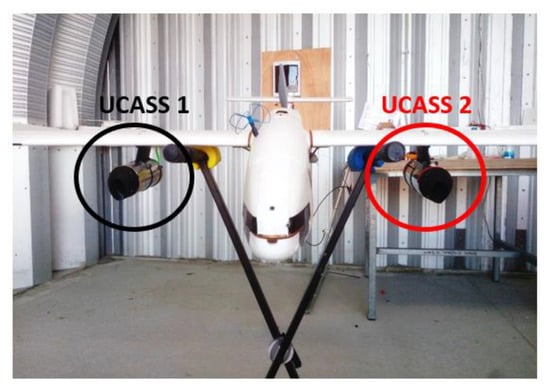
Figure 14.
The two UCASS OPCs as integrated below the wings of the fixed-wing Skywalker UAV.
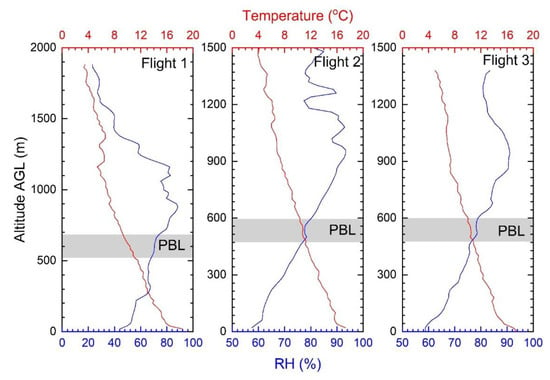
Figure 15.
Meteorological profiles obtained during the three UCASS flights (flight 1: 0840 UTC, flight 2: 0945 UTC, flight 3: 1200 UTC) over Orounda on 10 March 2020. The bottom axis shows the RH levels, whereas the top axis shows the temperature measurements. Grey shaded areas show an indication of the PBL height.
Figure 16 shows height-resolved observations of particle concentration obtained by UCASS during three flights. Particularly, it shows the number concentration of particles within the size range from 0.4 to 18 μm, allowing for the retrieval of both fine- and coarse-mode particles. Due to the open-path geometry of the instrument, the concentration is derived from the UAV airspeed, which was obtained from a pitot tube on-board the UAV. The airspeed of the UAV was kept between 13 and 15 m/s within the required airflow levels of the UCASS (please see section above). From the surface up to 800 m height, the UCASS number concentration was below 60 cm−3 for the three flights. Layers of increased particle concentration are found above 800 m altitude during flights one and two. These flights involved the presence of patchy cumulus clouds, resulting in concentration spikes. Figure 17 shows the column-averaged particle volume concentration, measured by two UCASS units during the three flights. Both UCASS units show higher volume concentrations during flights one and two, compared to flight three. This can be justified by the localised cumulus clouds above Orounda as shown in Figure 18.
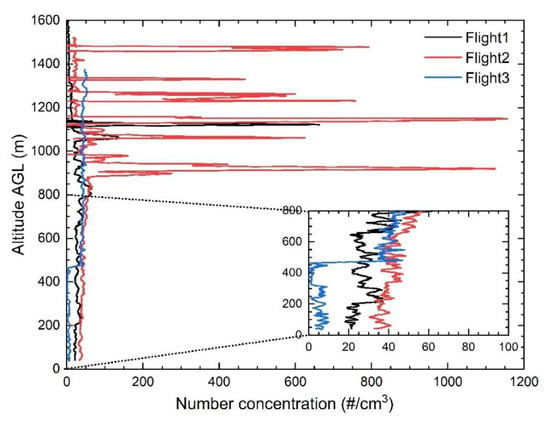
Figure 16.
UAV measurements of height-resolved particle number concentrations as measured by the UCASS from three independent flights during a moderate dust event and the presence of localized cumulus cloud over Orounda on 10 March 2020. Shaded area refers to the standard deviation of the measurements.
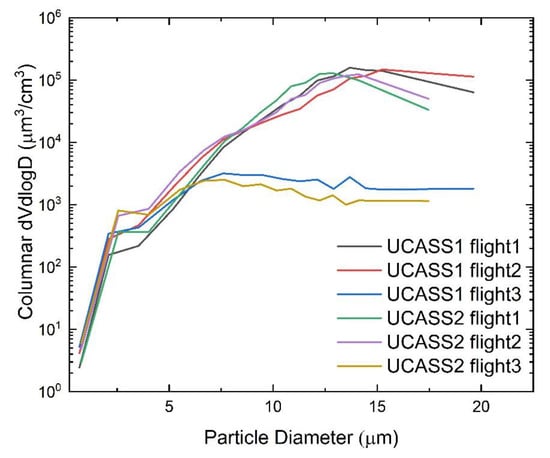
Figure 17.
UAV measurements of columnar integrated aerosol volume size distributions as measured by the two UCASS units from three independent flights during a moderate dust event and the presence of localized cumulus cloud over Orounda on 10 March 2020.
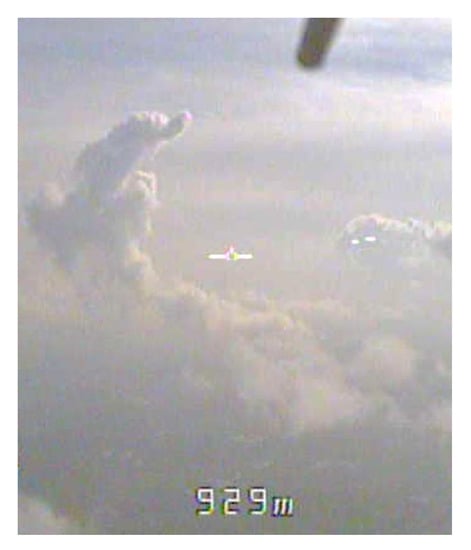
Figure 18.
Picture taken on-board the UAV while flying into humid environment at 929 m AGL over Orounda on 10 March 2020 (flight 1).
3.7. Ozone Profiling over Cyprus
Ozone (O3) is one of the most important chemical species involved in atmospheric chemistry, and has an impact on the environment through chemical oxidation capacity, health, greenhouse effect, and vegetation. Height-resolved ozone measurements are critical to better understand the role of gases in oxidation capacity of the atmosphere and radiative forcing [19,81]. As such, ozone soundings play a major role in the validation and evaluation of satellite measurements, particularly for their long-term stability. A widely used method to measure in-situ ozone profiles is through the use of compact balloon-borne sondes (e.g., SPARC-IOC-GAW, 1998). Up to an altitude of about 20 km, ozonesondes constitute the most important data source with long-term coverage for the derivation of ozone trends. UAV-borne ozone observations have been reported in the literature for close-to-the-ground (boundary layer) deployment using Electrochemical Concentration Cell (ECC) ozonesondes (by Illingworth et al. [7]; Chouza et al. [82]). Gronoff et al. [83] reported UAV-ozone measurements from ship plume emissions using an octocopter with a 2B-Technologies POM ozone sensor, which calculates ozone concentration from optical absorption of UV light generated from a low-pressure mercury lamp. However, to the best of our knowledge, there are no studies reported so far in the literature to investigate the potential use of UAVs for ozone sounding.
With the objective to perform dense profiling of ozone below/above the PBL and better characterize its contribution to the oxidizing capacity of the boundary layer, USRL recently modified a commercially available ECC Ozonesonde (EN-SCI, Westminster, CO, US; see above and Table 3) to enable its operation on-board UAVs. This development offers the great advantage of a robust, low-cost, lightweight ozone measurement solution with proven accuracy in the first kilometers of the atmosphere.
The ECC ozonesonde relies on ambient air flowing through a RedOx reaction cell containing a buffer solution of potassium iodine. The reaction between ozone and iodine draws electrons and creates a current across the two reaction cells. Prior to each flight, and every seven days regardless of flight activity, the solutions in the cells are replaced and conditioned to keep the system active. The conditioning process involves flowing concentrated ozone through the cells to get the current and ion-bridge active, and flowing ozone-free air to determine the background current. An equation, involving temperature, pressure, cell current and background cell current, is provided by the manufacturer in order to convert in-flight measured current to ozone concentration during data post-processing.
The first deployment of this UAV-ECC Ozonesonde setup took place in spring 2020, during a flight performed on 26 May 2020 at the USRL runway (Orounda, Cyprus). The ECC ozonesonde was integrated in the fixed-wing Skywalker UAV which was climbing following horizontal legs of 1–2 km length as set by the A/P. The flight was performed early in the morning (0500 UTC) and the duration of the ascent profile shown in Figure 19 was 27 min. The ozone concentrations show a sharp increase (+5 ppb) in the first 100–200 m together with RH and possibly linked to a micro-layer close to the ground. Over the boundary layer the O3 concentrations remain stable (55–57 ppb). Above the PBL, ozone concentrations show a steep increase (up to 65 ppb) within a 500-m depth atmospheric layer lying between 1300 and 1800 m AGL. Interestingly, this layer is characterized by a low RH (50–55%) compared to the 65% observed below and above. This thin layer potentially points to the intrusion of a stratospheric dry/ozone-rich air mass, which Stratosphere-to-Troposphere Transport (STT) pattern can act as a natural source of ozone in the free troposphere.
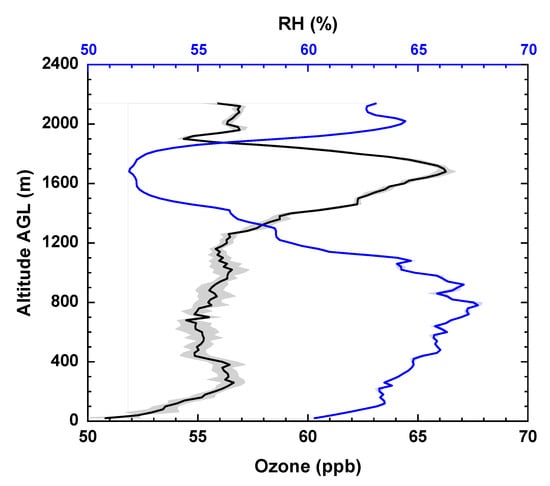
Figure 19.
UAV measurements of ozone concentration, RH, and temperature during ascent profile over Orounda on 26 May 2020. The gray and blue shaded area refers to the standard deviation of the measurements (per 20 m).
3.8. Mapping Close-to-the-Ground CO2 Concentrations
A UAV-CO2 (HPP SenseAir) sensor system was developed and validated at USRL for mapping specific source emissions close to the ground (see description in Section 2.4.3 and Liu et al. in preparation). The air sample flows into a dryer filled with magnesium perchlorate (Mg(ClO4)2) to remove water vapor, and passes through a 0.5 µm diameter Teflon membrane filter to remove particles. The Rotronic HC2-ROPCB OEM module temperature and humidity sensor is integrated upwards of the CO2 sensor (HPP 3.2, SenseAir AB).
Before its integration in the UAV, the CO2 sensor accuracy and linearity tests were performed at the Integrated Carbon Observation System (ICOS) Atmospheric Thematic Center facility following standard metrology performances defined by Yver-Kwok et al. [84]. It was shown that the sensor’s precision lies within ± 1ppm (1 δ) at 1 Hz. Corrections due to temperature and pressure changes were performed using specific multiple linear regressions obtained from chamber experiments adapted from Arzoumanian et al. [58]. Field (manned aircraft) tests were performed in plateaus up to 2000 m altitude, where the pressure and temperature correction equations were evaluated for two CO2 sensor units, which were compared against an airborne reference instrument (Picarro G2401-m) calibrated against standard gases traceable to WMO [85]. Following the above laboratory and airborne setup and tests, the HPP CO2 sensor was further integrated into a quad-copter that allows for vertical take-off and landing (VTOL) in urban environments.
The first field deployment was performed on 14 May 2021 above the Athalassa forest park, in the south-eastern edge of the Nicosia agglomeration. The intensive (multi-flight) UAV campaign started from early morning at 0300 UTC (0600 LT) and finished at 1500 UTC (1800 LT) in order to capture both the temporal variability of dynamic (e.g., development of the PBL) and city (e.g., traffic) emissions. Each UAV flight was performed horizontally (at 100 m AGL), at a ground speed of ca. 18 km/h, for a typical flight duration of 15 min. The mapping and obtained time series of one flight is shown in Figure 20, which displays (i) the combined flight path and CO2 mapping (left panel), and (ii) the same CO2 concentrations as a function of time and wind direction (right panel). The developed UAV-CO2 sensor system shows here the capacity to detect fast concentration changes during the flight (i.e., with no memory effect), highlighting high concentrations (+15 ppm) from local traffic emission (main road located on the south-west of the forest park). These preliminary results highlight the potential of our UAV-CO2 sensor system to provide useful insight into high CO2 point emissions close to the ground and to map accurately their dispersion plumes.

Figure 20.
The UAV-CO2 sensor system flight on 14 May 2021. The left panel (a) shows the combined flight path and CO2 mapping and the right panel (b) shows the same CO2 concentrations plotted as a function of time (UTC) and wind direction obtained by the nearby (less than 1 km horizontal distance from the UAV take-off point) meteorological station of the Cyprus Institute. The arrow shows the wind direction and the length shows the wind speed.
4. Conclusions
Here, we presented a comprehensive overview of the Unmanned System Research Laboratory (USRL) research infrastructure, encompassing:
- (i)
- private airfield and permanent airspace located at a rural background site of Cyprus, enabling direct comparison of UAV atmospheric measurements with nearby ground-based high-quality observations part of large (inter)national atmospheric networks;
- (ii)
- state-of-the-art workshops for the construction of specific UAV components and customized integration of atmospheric sensors;
- (iii)
- in-house fixed and mobile Ground Control Station (software) to remotely pilot and operate UAVs from various locations;
- (iv)
- in-house Auto-Pilots and Data Acquisition systems allowing for pre-programmed complex flight paths as well as control of a large variety of scientific instruments with real-time data visualization features;
- (v)
- complementary facilities allowing for simulating the on-flight performance of atmospheric sensors (at different pressure and air temperature) and performing quality-checked chemical analyses of off-line air samples collected on-board UAVs.
The versatile fleet of nine commercial and prototype UAVs (multirotors, small-size and medium-size fixed-wings) operated by USRL under the EASA regulation currently offers the ability of complex flights from close-to-the-ground (for plume mapping), up to an altitude of 4 km AGL (for vertical profiling), in contrasted atmospheric environments (marine, urban, arctic, remote, etc.) in Europe and beyond. The 15 atmospheric sensors currently integrated in USRL UAVs allows for accurately describing the critical physical, chemical, and optical properties of aerosols and other climate-relevant air pollutants and greenhouse gases (O3, CO2). More sensors are considered for ongoing and future integration of the fleet.
Findings from several field experiments conducted with a range of atmospheric sensors on-board UAVs over Cyprus, Greece, Finland, and the Arabian basin have been presented here, highlighting the potential of UAV-sensor systems to:
- (i)
- document in a more realistic way (compared to in-situ ground-based observations) INP concentrations and aerosol/droplet properties in cloud regions;
- (ii)
- test and validate remote sensing (lidar, ceilometer) retrievals of aerosol properties (mass concentrations) and INP;
- (iii)
- characterize the vertical dispersion of ground-based (e.g., city traffic) emissions and atmospheric oxidants (e.g., O3) within a fast-changing PBL;
- (iv)
- bridge the scaling gap between in-situ and remote-sensing observations in the first hundred meters of the atmosphere;
- (v)
- depict with a high vertical resolution superimposed thin atmospheric dust layers below/above the PBL;
- (vi)
- map with high-time response highly localized close-to-the-ground pollution and greenhouse gases hotspots.
Through these projects, the USRL team has gained valuable experience in actual UAV operations along with system development, integration, and payload data handling, completing more than 41,000 h of scientific flights since its establishment. This expertise is currently leveraged for (i) the calibration and validation of atmospheric products of recently launched satellite of the European Space Agency, (ii) the monitoring of sulfur-containing stack emissions from shipping, and (iii) the detection of close-to-the-ground natural gas (CH4) emissions.
5. Perspectives
UAV-sensor systems have great potential, currently underexploited, to characterize the concentration and properties of a wide range of atmospheric constituents, providing cost-effective and easy-to-use capacities for sampling in atmospheric environments that are dangerous for human life (e.g., industrial hazards, volcanic eruptions, fires), or difficult to access (e.g., stack emission plumes). They can provide unique information on the properties of air pollutants below and above the planetary boundary layer, therefore enhancing the vertical coverage of ground-based in-situ data. Their capacity to fly at very low speed compared to manned research aircraft offers new perspectives for in-situ characterization of large aerosols (e.g., dust, pollen, volcanic ash) and cloud droplets at a high spatial (3D) resolution, with better sampling efficiency and minimal disturbance of the atmospheric environments. The recent and promising coupling of UAV-balloon is expected to further enhance the use of UAVs for probing the upper troposphere and lower stratosphere at minimal cost and higher frequency. UAV-sensor systems have demonstrated their great added value in bridging ground-based in-situ and remote sensing techniques during time limited intensive field campaigns. Rapid technological developments in flight automation (take-off, landing), UAV performance (payloads, endurance), and sensor specifications (weight, sensitivity) are expected to enhance in the very near future the utilization of these UAV-sensor systems for routine atmospheric observations, allowing them to become a strategic component of long-term atmospheric monitoring networks, paving the way towards their exploitation in many earth observation systems.
Supplementary Materials
The following are available online at https://www.mdpi.com/article/10.3390/atmos12081042/s1, Figure S1: CoBi UAS flight during BACCHUS research campaign over Orounda, Nicosia on April 2016. Figure S2: Profiling Black Carbon with three miniaturized aerosol absorption sensors integrated on board small-sized UAS during Athens campaign in January 2016 (in the framework of H2020 ACTRIS2). Figure S3: Skywalker flight during PALLAS research campaign in Finland on September 2017. Figure S4: The tarot 650 quadcopter performing PM vertical profiles during an intensive campaign at CyI’s premises in Nicosia on 28 February 2020. Figure S5: USRL team in action during AQABA ship-borne research campaign in summer 2017.
Author Contributions
Conceptualization, M.K., C.K. and J.S.; methodology, P.A. and A.L.; software, C.C. and M.B.; validation, M.K., C.K., J.S. and J.L.; formal analysis, M.K., M.D., F.U., Y.L. and J.G.; investigation, M.K., C.K. and J.S.; resources, C.K., P.A., M.B., C.C., R.-S.G., J.G., J.H., K.K., A.L., G.M., R.S.-E. and C.S.; data curation, M.K., M.P., K.N., F.U. and Y.L.; writing—original draft preparation, M.K.; writing—review and editing, M.K., M.V., J.S., F.M., N.M., K.K., G.M., M.D., R.-S.G., J.-D.P., J.L., P.A. and G.B.; visualization, M.K., M.D., F.U., K.N. and J.G.; supervision, J.S.; project administration, J.S., M.V. and N.M.; funding acquisition, M.V., J.S., J.L., M.P., K.K. and G.M. All authors have read and agreed to the published version of the manuscript.
Funding
The EMME-CARE project has received funding from the European Union’s Horizon 2020 research and innovation programme under grant agreement No. 856612 and the Cyprus Government. The AQ-SERVE Project INTEGRATED/0916/0016 (AQ-SERVE) is co-financed by the European Regional Development Fund and the Republic of Cyprus through the Research and Innovation Foundation. The CURE-3AB (2019–2021) is funded by the Research Promotion Foundation under the RESTART 2016–2020 programme International Collaborations—Dual Targeting and by the H2020 WIDESPREAD 2018–2020 program EMME-CARE. The ACTRIS2 research has received funding from the European Union’s Horizon 2020 research and innovation programme under grant agreement No 654109. The BACCHUS research has received funding from the European Union’s Horizon 2020 project BACCHUS, European Commission FP7-603445. K. Kandler was funded by the Deutsche Forschungsgemeinschaft (DFG, German Research Foundation)—264912134, 378741973, 416816480. G. Močnik was funded by the Slovenian Research Agency programme “Remote sensing of atmospheric properties” (P1-0385).
Institutional Review Board Statement
Not applicable.
Informed Consent Statement
Not applicable.
Data Availability Statement
The data presented in this study are available on request from the corresponding author.
Acknowledgments
The authors gratefully acknowledge the USRL team of the Cyprus Institute: Neoclis Hadjigeorgiou, Fotis Manellides, Evagoras Nearchou, Charalambos Neocleous, Constantinos Photiades, Constantinos Savvides, Michalis Strouthos, and Panos Vouterakos. We would also like to thank all the people who were involved in the preparation and the conduct of the scientific campaigns mentioned in this paper.
Conflicts of Interest
The authors declare no conflict of interest.
References
- Schepanski, K.; Tegen, I.; Laurent, B.; Heinold, B.; Macke, A. A new Saharan dust source activation frequency map derived from MSG-SEVIRI IR-channels. Geophys. Res. Lett. 2007, 34. [Google Scholar] [CrossRef] [Green Version]
- Banks, J.R.; Hünerbein, A.; Heinold, B.; Brindley, H.E.; Deneke, H.; Schepanski, K. The sensitivity of the colour of dust in MSG-SEVIRI Desert Dust infrared composite imagery to surface and atmospheric conditions. Atmos. Chem. Phys. 2019, 19, 6893–6911. [Google Scholar] [CrossRef] [Green Version]
- Mortier, A.; Gliß, J.; Schulz, M.; Aas, W.; Andrews, E.; Bian, H.; Chin, M.; Ginoux, P.; Hand, J.; Holben, B.; et al. Evaluation of climate model aerosol trends with ground-based observations over the last 2 decades—An AeroCom and CMIP6 analysis. Atmos. Chem. Phys. 2020, 20, 13355–13378. [Google Scholar] [CrossRef]
- Boucher, O.; Randall, D.; Artaxo, P.; Bretherton, C.; Feingold, G.; Forster, P.; Kerminen, V.-M.; Kondo, Y.; Liao, H.; Lohmann, P.; et al. Clouds and Aerosols, Rem. Sens. In Climate Change 2013 the Physical Science Basis: Working Group I Contribution to the Fifth Assessment Report of the Intergovernmental Panel on Climate Change; Cambridge University Press: Cambridge, UK, 2013; pp. 571–658. ISBN 9781107415324. [Google Scholar] [CrossRef]
- Reddy, B.S.K.; Kumar, K.R.; Balakrishnaiah, G.; Gopal, K.R.; Reddy, R.R.; Sivakumar, V.; Arafath, S.M.; Lingaswawy, A.P.; Pavankumari, S.; Umadevi, S.; et al. Ground-based in situ measurements of near-surface aerosol mass concentration over Anantapur: Heterogeneity in source impacts. Adv. Atmos. Sci. 2013, 30, 235–246. [Google Scholar] [CrossRef]
- Austin, R. Unmanned Aircraft Systems. Hum. Factors Aviat. 2010, 54, 505–531. [Google Scholar] [CrossRef]
- Illingworth, S.; Allen, G.; Percival, C.; Hollingsworth, P.; Gallagher, M.; Ricketts, H.; Hayes, H.; Ładosz, P.; Crawley, D.; Roberts, G. Measurement of boundary layer ozone concentrations on-board a Skywalker unmanned aerial vehicle. Atmos. Sci. Lett. 2014, 15, 252–258. [Google Scholar] [CrossRef] [Green Version]
- Babaan, J.B.; Ballori, J.P.; Tamondong, A.M.; Ramos, R.V.; Ostrea, P.M. Estimation of PM 2.5 vertical distribution using customized UAV and mobile sensors in Brgy. Int. Arch. Photogramm. Remote Sens. Spat. Inf. Sci. 2018, 42, 89–103. [Google Scholar] [CrossRef] [Green Version]
- Mamali, D.; Marinou, E.; Sciare, J.; Pikridas, M.; Kokkalis, P.; Kottas, M.; Binietoglou, I.; Tsekeri, A.; Keleshis, C.; Engelmann, R.; et al. Vertical profiles of aerosol mass concentration derived by unmanned airborne in situ and remote sensing instruments during dust events. Atmos. Meas. Tech. 2018, 11, 2897–2910. [Google Scholar] [CrossRef] [Green Version]
- Pikridas, M.; Bezantakos, S.; Močnik, G.; Keleshis, C.; Brechtel, F.; Stavroulas, I.; Demetriades, G.; Antoniou, P.; Vouterakos, P.; Argyrides, M.; et al. On-flight intercomparison of three miniature aerosol absorption sensors using unmanned aerial systems (UASs). Atmos. Meas. Tech. 2019, 12, 6425–6447. [Google Scholar] [CrossRef] [Green Version]
- Jimenez, J.R.; Zanca, N.; Lan, H.; Jussila, M.; Hartonen, K.; Riekkola, M.-L. Aerial drone as a carrier for miniaturized air sampling systems. J. Chromatogr. A 2019, 1597, 202–208. [Google Scholar] [CrossRef]
- Aboutalebi, M.; Torres-Rua, A.F.; McKee, M.; Kustas, W.P.; Nieto, H.; Alsina, M.M.; White, A.; Prueger, J.H.; McKee, L.; Alfieri, J.; et al. Incorporation of Unmanned Aerial Vehicle (UAV) point cloud products into remote sensing evapotranspiration models. Remote Sens. 2020, 12, 50. [Google Scholar] [CrossRef] [Green Version]
- Wimmer, D.; Mazon, S.B.; Manninen, H.E.; Kangasluoma, J.; Franchin, A.; Nieminen, T.; Backman, J.; Wang, J.; Kuang, C.; Krejci, R.; et al. Ground-based observation of clusters and nucleation-mode particles in the Amazon. Atmos. Chem. Phys. 2018, 18, 13245–13264. [Google Scholar] [CrossRef] [Green Version]
- Díaz-Delgado, R.; Ónodi, G.; Kröel-Dulay, G.; Kertész, M. Enhancement of Ecological Field Experimental Research by Means of UAV Multispectral Sensing. Drones 2019, 3, 7. [Google Scholar] [CrossRef] [Green Version]
- Rohi, G.; Ejofodomi, O.; Ofualagba, G. Autonomous monitoring, analysis, and countering of air pollution using environmental drones. Heliyon 2020, 6, e03252. [Google Scholar] [CrossRef] [Green Version]
- Altstädter, B.; Platis, A.; Wehner, B.; Scholtz, A.; Wildmann, N.; Hermann, M.; Käthner, R.; Baars, H.; Bange, J.; Lampert, A. ALADINA—An unmanned research aircraft for observing vertical and horizontal distributions of ultrafine particles within the atmospheric boundary layer. Atmos. Meas. Tech. 2015, 8, 1627–1639. [Google Scholar] [CrossRef] [Green Version]
- Corrigan, C.E.; Roberts, G.C.; Ramana, M.V.; Kim, D.; Ramanathan, V. Capturing vertical profiles of aerosols and black carbon over the Indian Ocean using autonomous unmanned aerial vehicles. Atmos. Chem. Phys. 2008, 8, 734–747. [Google Scholar] [CrossRef] [Green Version]
- Madokoro, H.; Kiguchi, O.; Nagayoshi, T.; Chiba, T.; Inoue, M.; Chiyonobu, S.; Nix, S.; Woo, H.; Sato, K. Development of Drone-Mounted Multiple Sensing System with Advanced Mobility for In Situ Atmospheric Measurement: A Case Study Focusing on PM2.5 Local Distribution. Sensors 2021, 21, 4881. [Google Scholar] [CrossRef] [PubMed]
- Singh, D.; Dahiya, M.; Kumar, R.; Nanda, C. Sensors and systems for air quality assessment monitoring and management: A review. J. Environ. Manag. 2021, 289, 112510. [Google Scholar] [CrossRef] [PubMed]
- Malaver, A.; Motta, N.; Corke, P.; Gonzalez, F. Development and integration of a solar powered unmanned aerial vehicle and a wireless sensor network to monitor greenhouse gases. Sensors 2015, 15, 4072–4096. [Google Scholar] [CrossRef] [PubMed]
- Chang, C.-C.; Wang, J.-L.; Lin, M.-R.; Ou-Yang, C.-F.; Pan, H.-H.; Chen, Y.-C. A study of atmospheric mixing of trace gases by aerial sampling with a multi-rotor drone. Atmos. Environ. 2018, 184, 254–261. [Google Scholar] [CrossRef]
- Berman, E.S.; Fladeland, M.; Liem, J.; Kolyer, R.; Gupta, M. Greenhouse gas analyzer for measurements of carbon dioxide, methane, and water vapor aboard an unmanned aerial vehicle. Sens. Actuator Chem. 2012, 169, 128–135. [Google Scholar] [CrossRef]
- Shah, A.; Pitt, J.; Kabbabe, K.; Allen, G. Suitability of a Non-Dispersive Infrared Methane Sensor Package for Flux Quantification Using an Unmanned Aerial Vehicle. Sensors 2019, 19, 4705. [Google Scholar] [CrossRef] [PubMed] [Green Version]
- Dalamagidis, K.; Valavanis, K.; Piegl, L.A. On Integrating Unmanned Aircraft Systems into the National Airspace; Springer Science & Business Media: New York, NY, USA, 2009. [Google Scholar]
- Limnaios, G. Current Usage of Unmanned Aircraft Systems (UAS) and Future Challenges: A Mission Oriented Simulator for UAS as a Tool for Design and Performance Evaluation. J. Comp. Model 2014, 4, 167–188. [Google Scholar]
- Villa, T.F.; Gonzalez, F.; Miljievic, B.; Ristovski, Z.D.; Morawska, L. An Overview of Small Unmanned Aerial Vehicles for Air Quality Measurements: Present Applications and Future Prospectives. Sensors 2016, 16, 1072. [Google Scholar] [CrossRef] [PubMed] [Green Version]
- Kleanthous, S.; Vrekoussis, M.; Mihalopoulos, N.; Kalabokas, P.; Lelieveld, J. On the temporal and spatial variation of ozone in Cyprus. Sci. Total Environ. 2014, 476, 677–687. [Google Scholar] [CrossRef]
- Bezantakos, S.; Schmidt-Ott, F.; Biskos, G. Performance evaluation of the cost-effective and lightweight Alphasense optical particle counter for use onboard unmanned aerial vehicles. Aerosol Sci. Technol. 2018, 52, 385–392. [Google Scholar] [CrossRef] [Green Version]
- Keleshis, C.; Ioannou, S.; Vrekoussis, M.; Levin, Z.; Lange, M.A. Data Acquisition (DAQ) System dedicated for Remote Sensing applications on Unmanned Aerial Vehicles (UAV). Sec. Intern. Conf. Rem. Sens. Geoinf. Environ. 2014, 9229, 92290H. [Google Scholar]
- Kezoudi, M.; Tesche, M.; Smith, H.; Tsekeri, A.; Baars, H.; Dollner, M.; Estellés, V.; Bühl, J.; Weinzierl, B.; Ulanowski, Z.; et al. Measurement report: Balloon-borne in-situ profiling of Saharan dust over Cyprus with the UCASS optical particle counter. Atmos. Chem. Phys. 2021, 21, 6781–6797. [Google Scholar] [CrossRef]
- Tomsche, L.; Pozzer, A.; Ojha, N.; Parchatka, U.; Lelieveld, J.; Fischer, H. Upper tropospheric CH4 and CO affected by the South Asian summer monsoon during the Oxidation Mechanism Observations mission. Atmos. Chem. Phys. 2019, 19, 1915–1939. [Google Scholar] [CrossRef] [Green Version]
- Kräuchi, A.; Philipona, R. Return glider radiosonde for in situ upper-air research measurements. Atmos. Meas. Tech. 2016, 9, 2535–2544. [Google Scholar] [CrossRef] [Green Version]
- Liu, H.; Wang, Q.; Sheng, W.; Wang, X.; Zhang, K.; Du, L.; Zhou, J. Humidity Sensors with Shielding Electrode Under Interdigitated Electrode. Sensors 2019, 19, 659. [Google Scholar] [CrossRef] [Green Version]
- Sousan, S.; Koehler, K.; Hallett, L.; Peters, T.M. Evaluation of the Alphasense optical particle counter (OPC-N2) and the Grimm portable aerosol spectrometer (PAS-1.108). Aerosol Sci. Technol. 2016, 50, 1352–1365. [Google Scholar] [CrossRef] [PubMed]
- Crilley, L.R.; Shaw, M.; Pound, R.; Kramer, L.J.; Price, R.; Young, S.; Lewis, A.C.; Pope, F.D. Evaluation of a low-cost optical particle counter (Alphasense OPC-N2) for ambient air monitoring. Atmos. Meas. Tech. 2018, 11, 709–720. [Google Scholar] [CrossRef] [Green Version]
- Smith, H.; Ulanowski, Z.; Kaye, P.H.; Hirst, E.; Stanley, W.; Kaye, R.; Wieser, A.; Stopford, C.; Kezoudi, M.; Girdwood, J.; et al. The Universal Cloud and Aerosol Sounding System (UCASS): A low-cost miniature optical particle counter for use in dropsonde or balloon-borne sounding systems. Atmos. Meas. Tech. 2019, 12, 6579–6599. [Google Scholar] [CrossRef] [Green Version]
- Girdwood, J.; Smith, H.; Stanley, W.; Ulanowski, Z.; Stopford, C.; Chemel, C.; Doulgeris, K.-M.; Brus, D.; Campbell, D.; Mackenzie, R. Design and Field Campaign Validation of a Multirotor UAV and Optical Particle Counter. Atmos. Meas. Tech. 2020. [Google Scholar] [CrossRef]
- Gao, R.S.; Telg, H.; McLaughlin, R.J.; Ciciora, S.J.; Watts, L.A.; Richardson, M.S.; Schwarz, J.P.; Perring, A.E.; Thornberry, T.D.; Rollins, A.W.; et al. A light-weight, high-sensitivity particle spectrometer for PM2.5 aerosol measurements. Aerosol Sci. Technol. 2016, 50, 88–99. [Google Scholar] [CrossRef]
- Mei, F.; McMeeking, G.; Pekour, M.; Gao, R.-S.; Kulkarni, G.; China, S.; Telg, H.; Dexheimer, D.; Tomlinson, J.; Schmid, B. Performance Assessment of Portable Optical Particle Spectrometer (POPS). Sensors 2020, 20, 6294. [Google Scholar] [CrossRef]
- Marinou, E.; Tesche, M.; Nenes, A.; Ansmann, A.; Schrod, J.; Mamali, D.; Tsekeri, A.; Pikridas, M.; Baars, H.; Engelmann, R.; et al. Retrieval of ice-nucleating particle concentrations from lidar observations and comparison with UAV in situ measurements. Atmos. Chem. Phys. 2019, 19, 11315–11342. [Google Scholar] [CrossRef] [Green Version]
- Ansmann, A.; Mamouri, R.-E.; Bühl, J.; Seifert, P.; Engelmann, R.; Hofer, J.; Nisantzi, A.; Atkinson, J.D.; Kanji, Z.A.; Sierau, B.; et al. Ice-nucleating particle versus ice crystal number concentration in altocumulus and cirrus layers embedded in Saharan dust:a closure study. Atmos. Chem. Phys. 2019, 19, 15087–15115. [Google Scholar] [CrossRef] [Green Version]
- Rosen, J.M.; Kjome, N.T. Backscattersonde: A new instrument for atmospheric aerosol research. Appl. Opt. 1991, 30, 1552–1561. [Google Scholar] [CrossRef]
- Brabec, M.; Wienhold, F.G.; Luo, B.P.; Vömel, H.; Immler, F.; Steiner, P.; Hausammann, E.; Weers, U.; Peter, T. Particle backscatter and relative humidity measured across cirrus clouds and comparison with microphysical cirrus modelling. Atmos. Chem. Phys. 2012, 12, 9135–9148. [Google Scholar] [CrossRef] [Green Version]
- Cirisan, A.; Luo, B.P.; Engel, I.; Wienhold, F.G.; Sprenger, M.; Krieger, U.K.; Weers, U.; Romanens, G.; Levrat, G.; Jeannet, P.; et al. Balloon-borne match measurements of midlatitude cirrus clouds. Atmos. Chem. Phys. 2014, 14, 7341–7365. [Google Scholar] [CrossRef] [Green Version]
- Schrod, J.; Weber, D.; Drücke, J.; Keleshis, C.; Pikridas, M.; Ebert, M.; Cvetković, B.; Nickovic, S.; Marinou, E.; Baars, H.; et al. Ice nucleating particles over the Eastern Mediterranean measured by unmanned aircraft systems. Atmos. Chem. Phys. 2017, 17, 4817–4835. [Google Scholar] [CrossRef] [Green Version]
- Lieke, K.; Kandler, K.; Scheuvens, D.; Emmel, C.; Von Glahn, C.; Petzold, A.; Weinzierl, B.; Veira, A.; Ebert, M.; Weinbruch, S.; et al. Particle chemical properties in the vertical column based on aircraft observations in the vicinity of Cape Verde Islands. Tellus B Chem. Phys. Meteorol. 2011, 63, 497–511. [Google Scholar] [CrossRef] [Green Version]
- Cheng, Y.-H.; Lin, M.-H. Real-Time Performance of the microAeth® AE51 and the Effects of Aerosol Loading on Its Measurement Results at a Traffic Site. Aerosol Air Qual. Res. 2013, 13, 1853–1863. [Google Scholar] [CrossRef] [Green Version]
- Cai, J.; Yan, B.; Ross, J.; Zhang, D.; Kinney, P.L.; Perzanowski, M.S.; Jung, K.; Miller, R.; Chillrud, S.N. Validation of MicroAeth® as a Black Carbon Monitor for Fixed-Site Measurement and Optimization for Personal Exposure Characterization. Aerosol Air Qual. Res. 2014, 14, 1–9. [Google Scholar] [CrossRef] [Green Version]
- Lee, J. Performance Test of MicroAeth® AE51 at Concentrations Lower than 2 μg/m3 in Indoor Laboratory. Appl. Sci. 2019, 9, 2766. [Google Scholar] [CrossRef] [Green Version]
- Cao, R.; Li, B.; Wang, H.-W.; Tao, S.; Peng, Z.-R.; He, H.-D. Vertical and Horizontal Profiles of Particulate Matter and Black Carbon Near Elevated Highways Based on Unmanned Aerial Vehicle Monitoring. Sustainability 2020, 12, 1204. [Google Scholar] [CrossRef] [Green Version]
- Liu, B.; Wu, C.; Ma, N.; Chen, Q.; Li, Y.; Ye, J.; Martin, S.T.; Li, Y. Vertical profiling of fine particulate matter and black carbon by using unmanned aerial vehicle in Macau, China. Sci. Total Environ. 2020, 709, 136109. [Google Scholar] [CrossRef]
- Sandradewi, J.; Prévôt, A.S.H.; Szidat, S.; Perron, N.; Alfarra, M.R.; Lanz, V.A.; Weingartner, E.; Baltensperger, U. Using Aerosol Light Absorption Measurements for the Quantitative Determination of Wood Burning and Traffic Emission Contributions to Particulate Matter. Environ. Sci. Technol. 2008, 42, 3316–3323. [Google Scholar] [CrossRef]
- Bates, T.S.; Quinn, P.; Johnson, J.E.; Corless, A.; Brechtel, F.J.; Stalin, S.E.; Meinig, C.; Burkhart, J. Measurements of atmospheric aerosol vertical distributions above Svalbard, Norway, using unmanned aerial systems (UAS). Atmos. Meas. Tech. 2013, 6, 2115–2120. [Google Scholar] [CrossRef] [Green Version]
- Bond, T.; Anderson, T.L.; Campbell, D. Calibration and intercomparison of filter-based measurements of visible light absorption by aerosols. Aerosol Sci. Technol. 1999, 30, 582–600. [Google Scholar] [CrossRef]
- Deshler, T.; Stübi, R.; Schmidlin, F.J.; Mercer, J.L.; Smit, H.G.J.; Johnson, B.J.; Kivi, R.; Nardi, B. Methods to homogenize electrochemical concentration cell (ECC) ozonesonde measurements across changes in sensing solution concentration or ozonesonde manufacturer. Atmos. Meas. Tech. 2017, 10, 2021–2043. [Google Scholar] [CrossRef] [Green Version]
- Kunz, M.; Lavric, J.V.; Gerbig, C.; Tans, P.; Neff, D.; Hummelgård, C.; Martin, H.; Rödjegård, H.; Wrenger, B.; Heimann, M. COCAP: A carbon dioxide analyser for small unmanned aircraft systems. Atmos. Meas. Tech. 2018, 11, 1833–1849. [Google Scholar] [CrossRef] [Green Version]
- Arzoumanian, E.; Vogel, F.R.; Bastos, A.; Gaynullin, B.; Laurent, O.; Ramonet, M.; Ciais, P. Characterization of a commercial lower-cost medium-precision non-dispersive infrared sensor for atmospheric CO2 monitoring in urban areas. Atmos. Meas. Tech. 2019, 12, 2665–2677. [Google Scholar] [CrossRef] [Green Version]
- Tsekeri, A.; Lopatin, A.; Amiridis, V.; Marinou, E.; Igloffstein, J.; Siomos, N.; Solomos, S.; Kokkalis, P.; Engelmann, R.; Baars, H.; et al. GARRLiC and LIRIC: Strengths and limitations for the characterization of dust and marine particles along with their mixtures. Atmos. Meas. Tech. 2017, 10, 4995–5016. [Google Scholar] [CrossRef] [Green Version]
- Seinfeld, J.H.; Bretherton, C.; Carslaw, K.; Coe, H.; DeMott, P.; Dunlea, E.J.; Feingold, G.; Ghan, S.; Guenther, A.B.; Kahn, R.; et al. Improving our fundamental understanding of the role of aerosol−cloud interactions in the climate system. Proc. Natl. Acad. Sci. USA 2016, 113, 5781–5790. [Google Scholar] [CrossRef] [PubMed] [Green Version]
- Reymann, C.; RenzAGLia, A.; Lamraoui, F.; Bronz, M.; Lacroix, S. Adaptive sampling of cumulus clouds with UAVs. Auton. Robot. 2018, 42, 491–512. [Google Scholar] [CrossRef] [Green Version]
- Li, J.; Kahn, R.A.; Wei, J.; Carlson, B.E.; Lacis, A.A.; Li, Z.; Li, X.; Dubovik, O.; Nakajima, T. Synergy of satellite- and ground-based aerosol optical depth measurements using an ensemble Kalman filter approach. J. Geophys. Res. Atmos. 2020, 125. [Google Scholar] [CrossRef]
- Ferrero, L.; Mocnik, G.; Ferrini, B.; Perrone, M.; Sangiorgi, G.; Bolzacchini, E. Vertical profiles of aerosol absorption coefficient from micro-Aethalometer data and Mie calculation over Milan. Sci. Total Environ. 2011, 409, 2824–2837. [Google Scholar] [CrossRef]
- Lelieveld, J.; Hadjinicolaou, P.; Kostopoulou, E.; Giannakopoulos, C.; Pozzer, A.; Tanarhte, M.; Tyrlis, E. Model projected heat extremes and air pollution in the eastern Mediterranean and Middle East in the twenty-first century. Reg. Environ. Chang. 2013, 14, 1937–1949. [Google Scholar] [CrossRef] [Green Version]
- Pfannerstill, E.Y.; Wang, N.; Edtbauer, A.; Bourtsoukidis, E.; Crowley, J.N.; Dienhart, D.; Eger, P.G.; Ernle, L.; Fischer, H.; Hottmann, B.; et al. Shipborne measurements of total OH reactivity around the Arabian Peninsula and its role in ozone chemistry. Atmos. Chem. Phys. 2019, 19, 11501–11523. [Google Scholar] [CrossRef] [Green Version]
- Eger, P.G.; Friedrich, N.; Schuladen, J.; Shenolikar, J.; Fischer, H.; Tadic, I.; Harder, H.; Martinez, M.; Rohloff, R.; Tauer, S.; et al. Shipborne measurements of ClNO2 in the Mediterranean Sea and around the Arabian Peninsula during summer. Atmos. Chem. Phys. 2019, 19, 12121–12140. [Google Scholar] [CrossRef] [Green Version]
- Celik, S.; Drewnick, F.; Fachinger, F.; Brooks, J.; Darbyshire, E.; Coe, H.; Paris, J.-D.; Eger, P.G.; Schuladen, J.; Tadic, I.; et al. Influence of vessel characteristics and atmospheric processes on the gas and particle phase of ship emission plumes: In situ measurements in the Mediterranean Sea and around the Arabian Peninsula. Atmos. Chem. Phys. 2020, 20, 4713–4734. [Google Scholar] [CrossRef] [Green Version]
- Tadic, I.; Crowley, J.N.; Dienhart, D.; Eger, P.; Harder, H.; Hottmann, B.; Martinez, M.; Parchatka, U.; Paris, J.-D.; Pozzer, A.; et al. Net ozone production and its relationship to nitrogen oxides and volatile organic compounds in the marine boundary layer around the Arabian Peninsula. Atmos. Chem. Phys. 2020, 20, 6769–6787. [Google Scholar] [CrossRef]
- Bourtsoukidis, E.; Pozzer, A.; Sattler, T.; Matthaios, V.N.; Ernle, L.; Edtbauer, A.; Fischer, H.; Könemann, T.; Osipov, S.; Paris, J.-D.; et al. The Red Sea Deep Water is a potent source of atmospheric ethane and propane. Nat. Commun. 2020, 11, 447. [Google Scholar] [CrossRef]
- Hattenberger, G.; Bronz, M.; Gorraz, M. Using the Paparazzi UAV System for Scientific Research. In Proceedings of the 2014 International Micro Air Vehicle Conference and Competition, Delft, The Netherlands, 12–15 August 2014. [Google Scholar]
- Paris, J.-D.; Riandet, A.; Bourtsoukidis, E.; Delmotte, M.; Berchet, A.; Williams, J.; Ernle, L.; Tadic, I.; Harder, H.; Lelieveld, J. Shipborne measurements of methane and carbon dioxide in the Middle East and Mediterranean areas and contribution from oil and gas emissions. Atmos. Chem. Phys. Discuss. 2021. in review. [Google Scholar] [CrossRef]
- Lagrosas, N.; Kuze, H.; Takeuchi, N.; Fukagawa, S.; Bagtasa, G.; Yoshii, Y.; Naito, S.; Yabuki, M. Correlation study between suspended particulate matter and portable automated lidar data. J. Aerosol Sci. 2005, 36, 439–454. [Google Scholar] [CrossRef]
- Lewandowski, P.A.; Eichinger, W.E.; Holder, H.; Prueger, J.; Wang, J.; Kleinman, L.I. Vertical distribution of aerosols in the vicinity of Mexico City during MILAGRO-2006 Campaign. Atmos. Chem. Phys. 2010, 10, 1017–1030. [Google Scholar] [CrossRef] [Green Version]
- Popovici, I.E.; Goloub, P.; Podvin, T.; Blarel, L.; Loisil, R.; Unga, F.; Mortier, A.; DeRoo, C.; Victori, S.; Ducos, F.; et al. Description and applications of a mobile system performing on-road aerosol remote sensing and in situ measurements. Atmos. Meas. Tech. 2018, 11, 4671–4691. [Google Scholar] [CrossRef] [Green Version]
- Mortier, A. Tendances et Variabilites de L’aerosol Atmospherique a L’aide du Couplage Lidar/Photometre sur les Sites de Lille et Dakar. PhD Thesis, Université de Lille, Lille, France, 2013. [Google Scholar]
- Holben, B.; Eck, T.; Slutsker, I.; Tanré, D.; Buis, J.; Setzer, A.; Vermote, E.; Reagan, J.; Kaufman, Y.; Nakajima, T.; et al. AERONET—A federated instrument network and data archive for aerosol characterization. Remote Sens. Environ. 1998, 66, 1–16. [Google Scholar] [CrossRef]
- Holben, B.N.; Kim, J.; Sano, I.; Mukai, S.; Eck, T.F.; Giles, D.; Schafer, J.S.; Sinyuk, A.; Slutsker, I.; Smirnov, A.; et al. An overview of mesoscale aerosol processes, comparisons, and validation studies from DRAGON networks. Atmos. Chem. Phys. 2018, 18, 655–671. [Google Scholar] [CrossRef] [Green Version]
- Yin, Z.; Ansmann, A.; Baars, H.; Seifert, P.; Engelmann, R.; Radenz, M.; Jimenez, C.; Herzog, A.; Ohneiser, K.; Hanbuch, K.; et al. Aerosol measurements with shipborne sun-sky-lunar photometer and collocated multiwavelength Raman polarization lidar over the Atlantic Ocean. Atmos. Meas. Tech. 2019, 12, 5685–5698. [Google Scholar] [CrossRef] [Green Version]
- Achilleos, S.; Evans, J.S.; Yiallouros, P.K.; Kleanthous, S.; Schwartz, J.; Koutrakis, P. PM10 concentration levels at an urban and background site in Cyprus: The impact of urban sources and dust storms. J. Air Waste Manag. Assoc. 2014, 64, 1352–1360. [Google Scholar] [CrossRef] [Green Version]
- Mamouri, R.E.; Ansmann, A.; Nisantzi, A.; Kokkalis, P.; Schwarz, A.; Hadjimitsis, D. Low Arabian dust extinction-to-backscatter ratio. Geophys. Res. Lett. 2013, 40, 4762–4766. [Google Scholar] [CrossRef]
- Mamouri, R.-E.; Ansmann, A. Potential of polarization lidar to provide profiles of CCN- and INP-relevant aerosol parameters. Atmos. Chem. Phys. 2016, 16, 5905–5931. [Google Scholar] [CrossRef] [Green Version]
- Nisantzi, A.; Mamouri, R.E.; Ansmann, A.; Schuster, G.; Hadjimitsis, D. Middle East versus Saharan dust extinction-to-backscatter ratios. Atmos. Chem. Phys. 2015, 15, 7071–7084. [Google Scholar] [CrossRef] [Green Version]
- Chouza, F.; Leblanc, T.; Brewer, M.; Wang, P.; Piazzolla, S.; Pfister, G.; Kumar, R.; Drews, C.; Tilmes, S.; Emmons, L.; et al. The impact of Los Angeles Basin pollution and stratospheric intrusions on the surrounding San Gabriel Mountains as seen by surface measurements, lidar, and numerical models. Atmos. Chem. Phys. 2021, 21, 6129–6153. [Google Scholar] [CrossRef]
- Gronoff, G.; Robinson, J.; Berkoff, T.; Swap, R.; Farris, B.; Schroeder, J.; Halliday, H.S.; Knepp, T.; Spinei, E.; Carrion, W.; et al. A Method for Quantifying Near Range Point Source Induced O3 Titration Events using Co-located Lidar and Pandora Measurements. Atmos. Environ. 2019, 204, 43–52. [Google Scholar] [CrossRef]
- Kwok, C.Y.; Laurent, O.; Guemri, A.; Philippon, C.; Wastine, B.; Rella, C.W.; Vuillemin, C.; Truong, F.; Delmotte, M.; Kazan, V.; et al. Comprehensive laboratory and field testing of cavity ring-down spectroscopy analyzers measuring H2O, CO2, CH4 and CO. Atmos. Meas. Tech. 2015, 8, 3867–3892. [Google Scholar] [CrossRef] [Green Version]
- Hazan, L.; Tarniewicz, J.; Ramonet, M.; Laurent, O.; Abbaris, A. Automatic processing of atmospheric CO2 and CH4 mole fractions at the ICOS Atmosphere Thematic Centre. Atmos. Meas. Tech. 2016, 9, 4719–4736. [Google Scholar] [CrossRef] [Green Version]
Publisher’s Note: MDPI stays neutral with regard to jurisdictional claims in published maps and institutional affiliations. |
© 2021 by the authors. Licensee MDPI, Basel, Switzerland. This article is an open access article distributed under the terms and conditions of the Creative Commons Attribution (CC BY) license (https://creativecommons.org/licenses/by/4.0/).


