Article

Observed and Future Precipitation and Evapotranspiration in Water Management Zones of Uganda: CMIP6 Projections

1
Department of Civil and Environmental Engineering, Kyambogo University, P.O. Box 1, Kyambogo, Kampala, Uganda
2
Collaborative Innovation Center of Atmospheric Environment and Equipment Technology, Jiangsu Key Laboratory of Atmospheric Environment Monitoring and Pollution Control, School of Environmental Science and Engineering, Nanjing University of Information Science and Technology, Nanjing 210044, China
3
Organization of African Academic Doctors (OAAD), Off Kamiti Road, P.O. Box 25305-00100, Nairobi, Kenya
4
Key Laboratory of Meteorological Disaster, Ministry of Education (KLME), Joint International Research Laboratory of Climate and Environment Change (ILCEC), Collaborative Innovation Center on Forecast and Evaluation of Meteorological Disasters (CIC-FEMD), Nanjing University of Information Science and Technology, Nanjing 210044, China
5
International Water Research Institute, Mohammed VI Polytechnic University, Lot 660, Hay Moulay Rachid, Marrakech, Ben Guerir 43150, Morocco
6
Department of Civil Engineering, KU Leuven, Kasteelpark Arenberg 40, B-3001 Leuven, Belgium
*
Authors to whom correspondence should be addressed.
Atmosphere 2021, 12(7), 887; https://doi.org/10.3390/atmos12070887
Submission received: 26 May 2021 / Revised: 27 June 2021 / Accepted: 5 July 2021 / Published: 8 July 2021
(This article belongs to the Section Climatology)

Abstract

:
We used CMIP6 GCMs to quantify climate change impacts on precipitation and potential evapotranspiration (PET) across water management zones (WMZs) in Uganda. Future changes are assessed based on four Shared Socioeconomic Pathways (SSP) scenarios including SSP1-2.6, SSP2-4.5, SSP3-7.0, and SSP5-8.5 over the periods 2021–2040, 2041–2060, 2061–2080, and 2081–2100. Both precipitation and PET are generally projected to increase across all the WMZs. Annual PET in the 2030s, 2050s, 2070s, 2090s will increase in the ranges 1.1–4.0%, 4.8–7.9%, 5.1–11.8%, and 5.3–17.1%, respectively. For the respective periods, annual precipitation will increase in the ranges 4.0–7.8%, 7.8–12.5%, 7.9–19.9%, and 6.9–26.3%. The lower and upper limits of these change ranges for both precipitation and PET are, respectively, derived under SSP1-2.6 and SSP5-8.5 scenarios. Climate change will impact on PET or precipitation disproportionately across the WMZs. While the eastern WMZ (Kyoga) will experience the largest projected precipitation increase especially towards the end of the century, the southern WMZ (Victoria) exhibited the largest PET increase. Our findings are relevant for understanding hydrological impacts of climate change across Uganda, in the background of global warming. Thus, the water sector should devise and implement adaptation measures to impede future socioeconomic and environmental crises in the country.

Graphical Abstract

1. Introduction

The increasing emission of greenhouse gases (GHGs) that causes climate change exerts pressure on water resources [1]. By 2025, the United Nations approximates that about 1800 million people will be living in countries or regions with absolute water scarcity, while two-thirds of the world population could be under water stress conditions [2]. Climate change and socioeconomic developments can exacerbate the situation especially for developing countries. This is particularly the case for the countries within the tropical zone which will experience the largest impacts [3,4,5], despite them having made the smallest contribution to climate change [6,7].
Climate change will induce hydrological changes by affecting rainfall–runoff generation processes. Precipitation and evapotranspiration are the key factors in the assessment of the influence of the climate system on hydrology [8]. The difference between evapotranspiration (water demand) and precipitation (water supply) has been frequently employed in climate change studies for quantification of water availability (e.g., [9,10,11,12] and aridity conditions (e.g., [13,14,15]).
For Uganda, several climate change studies (e.g., [16,17,18]) projected precipitation increase. However, the investigation of the concomitant future changes in both precipitation and evapotranspiration across Uganda is limited. In addition, the collective changes in both annual means and seasonal variations of these variables have been rarely quantified, yet such an information can enlighten socio-environmental vulnerability to potential future water availability [11]. In an investigation of historical precipitation and evapotranspiration changes over the Mpologoma catchment in Uganda, Mubialiwo et al. [19] found an increasing trend in seasonal evapotranspiration while rainfall variability exhibited an oscillatory pattern in subtrends over multidecadal time scales. Over the period 1948–2008, the southern and northern parts of Uganda exhibited positive and negative precipitation trends, respectively [20]. From 1948 to 2016, northeastern Uganda (or the Karamoja region) was characterized by decreasing precipitation and increasing PET trends [21]. PET in the Eastern Lake Kyoga basin exhibited an increase over the period 1961–2008 [22]. However, long and short rains from 1961 to 2015 were characterized by decreasing and increasing trends, respectively, in most parts of the Lake Kyoga basin [22]. In a recent study [23], significant (p < 0.05) increasing trends in series derived by subtracting potential evapotranspiration (PET) from precipitation were found across the various WMZs except around the Mount Elgon area. These findings highlight the necessity of investigating future climate change impacts on precipitation and evapotranspiration. This is highly important since temperature, as a key determinant of potential evapotranspiration (PET) rate, is expected to sharply increase as a result of intensified global warming in the future [24]. In a study in Ruhezamyenda catchment in Uganda, Mehdi et al. [25] quantified future water availability by projecting surface runoff derived from the COSERO hydrological model forced with CMIP5 simulations. The study projected an increase in actual runoff by about 8 mm/month towards the end of the century under RCP8.5.
Previous climate change studies in Uganda were either limited to a catchment scale or did not consider differences in the hydro-climates of the various sub-regions [16,17,18,26,27,28]. This shows that there is limited information for adaptive planning of water resources management across the various WMZs in Uganda. This is despite the fact that the planning requires frequent updates on climate change projections of precipitation and PET across the entire country under Uganda’s Vision 2040. This thirty-year development master plan conceptualized around strengthening the fundamentals of the economy to harness the abundant within-country opportunities, two of which are water resources and agriculture [29]. In this regard, water resources management in Uganda was decentralized in 2011 to maximize economic and social benefits for Ugandans from water/related resources management and development. Accordingly, to implement catchment-based water resources management framework, four regional units known as water management zones (WMZs) were created in 2011. Catchment management plans were required to be developed for the various catchments within each WMZ following the guidelines provided by the Ministry of Water and Environment [30]. These catchment management plans are meant to ensure that water resources are effectively planned for and sustainably developed and managed to support the achievement of the country’s vision 2040 [30]. However, these plans did not incorporate climate change impacts on precipitation or PET based on the latest generation general circulation models (GCMs) from Phase 6 of the Coupled Model Inter-comparison Project (CMIP6). As climate change is expected to affect most of Uganda’s key economic sectors, action on climate change is crucial if the country is to meet its goal to become a competitive, upper-middle-income country by 2040 in line with the Vision 2040 of the Government of Uganda [31].
Therefore, this study aimed at conducting a comprehensive investigation of climate change impacts on precipitation and PET across different WMZs in Uganda. This was done while considering the use of the latest generation GCMs (CMIP6). We focused on quantifying climate change impacts on precipitation and PET while taking into account the difference in seasons across the WMZs in line with planning adaptation to the impacts of climate change on sub-regional hydro-climate. The rest of the paper is organized as follows: Section 2 presents materials and techniques employed while Section 3 highlights results. Lastly, discussion, conclusions and recommendations of the study are captured in Section 4.

2. Materials and Methods
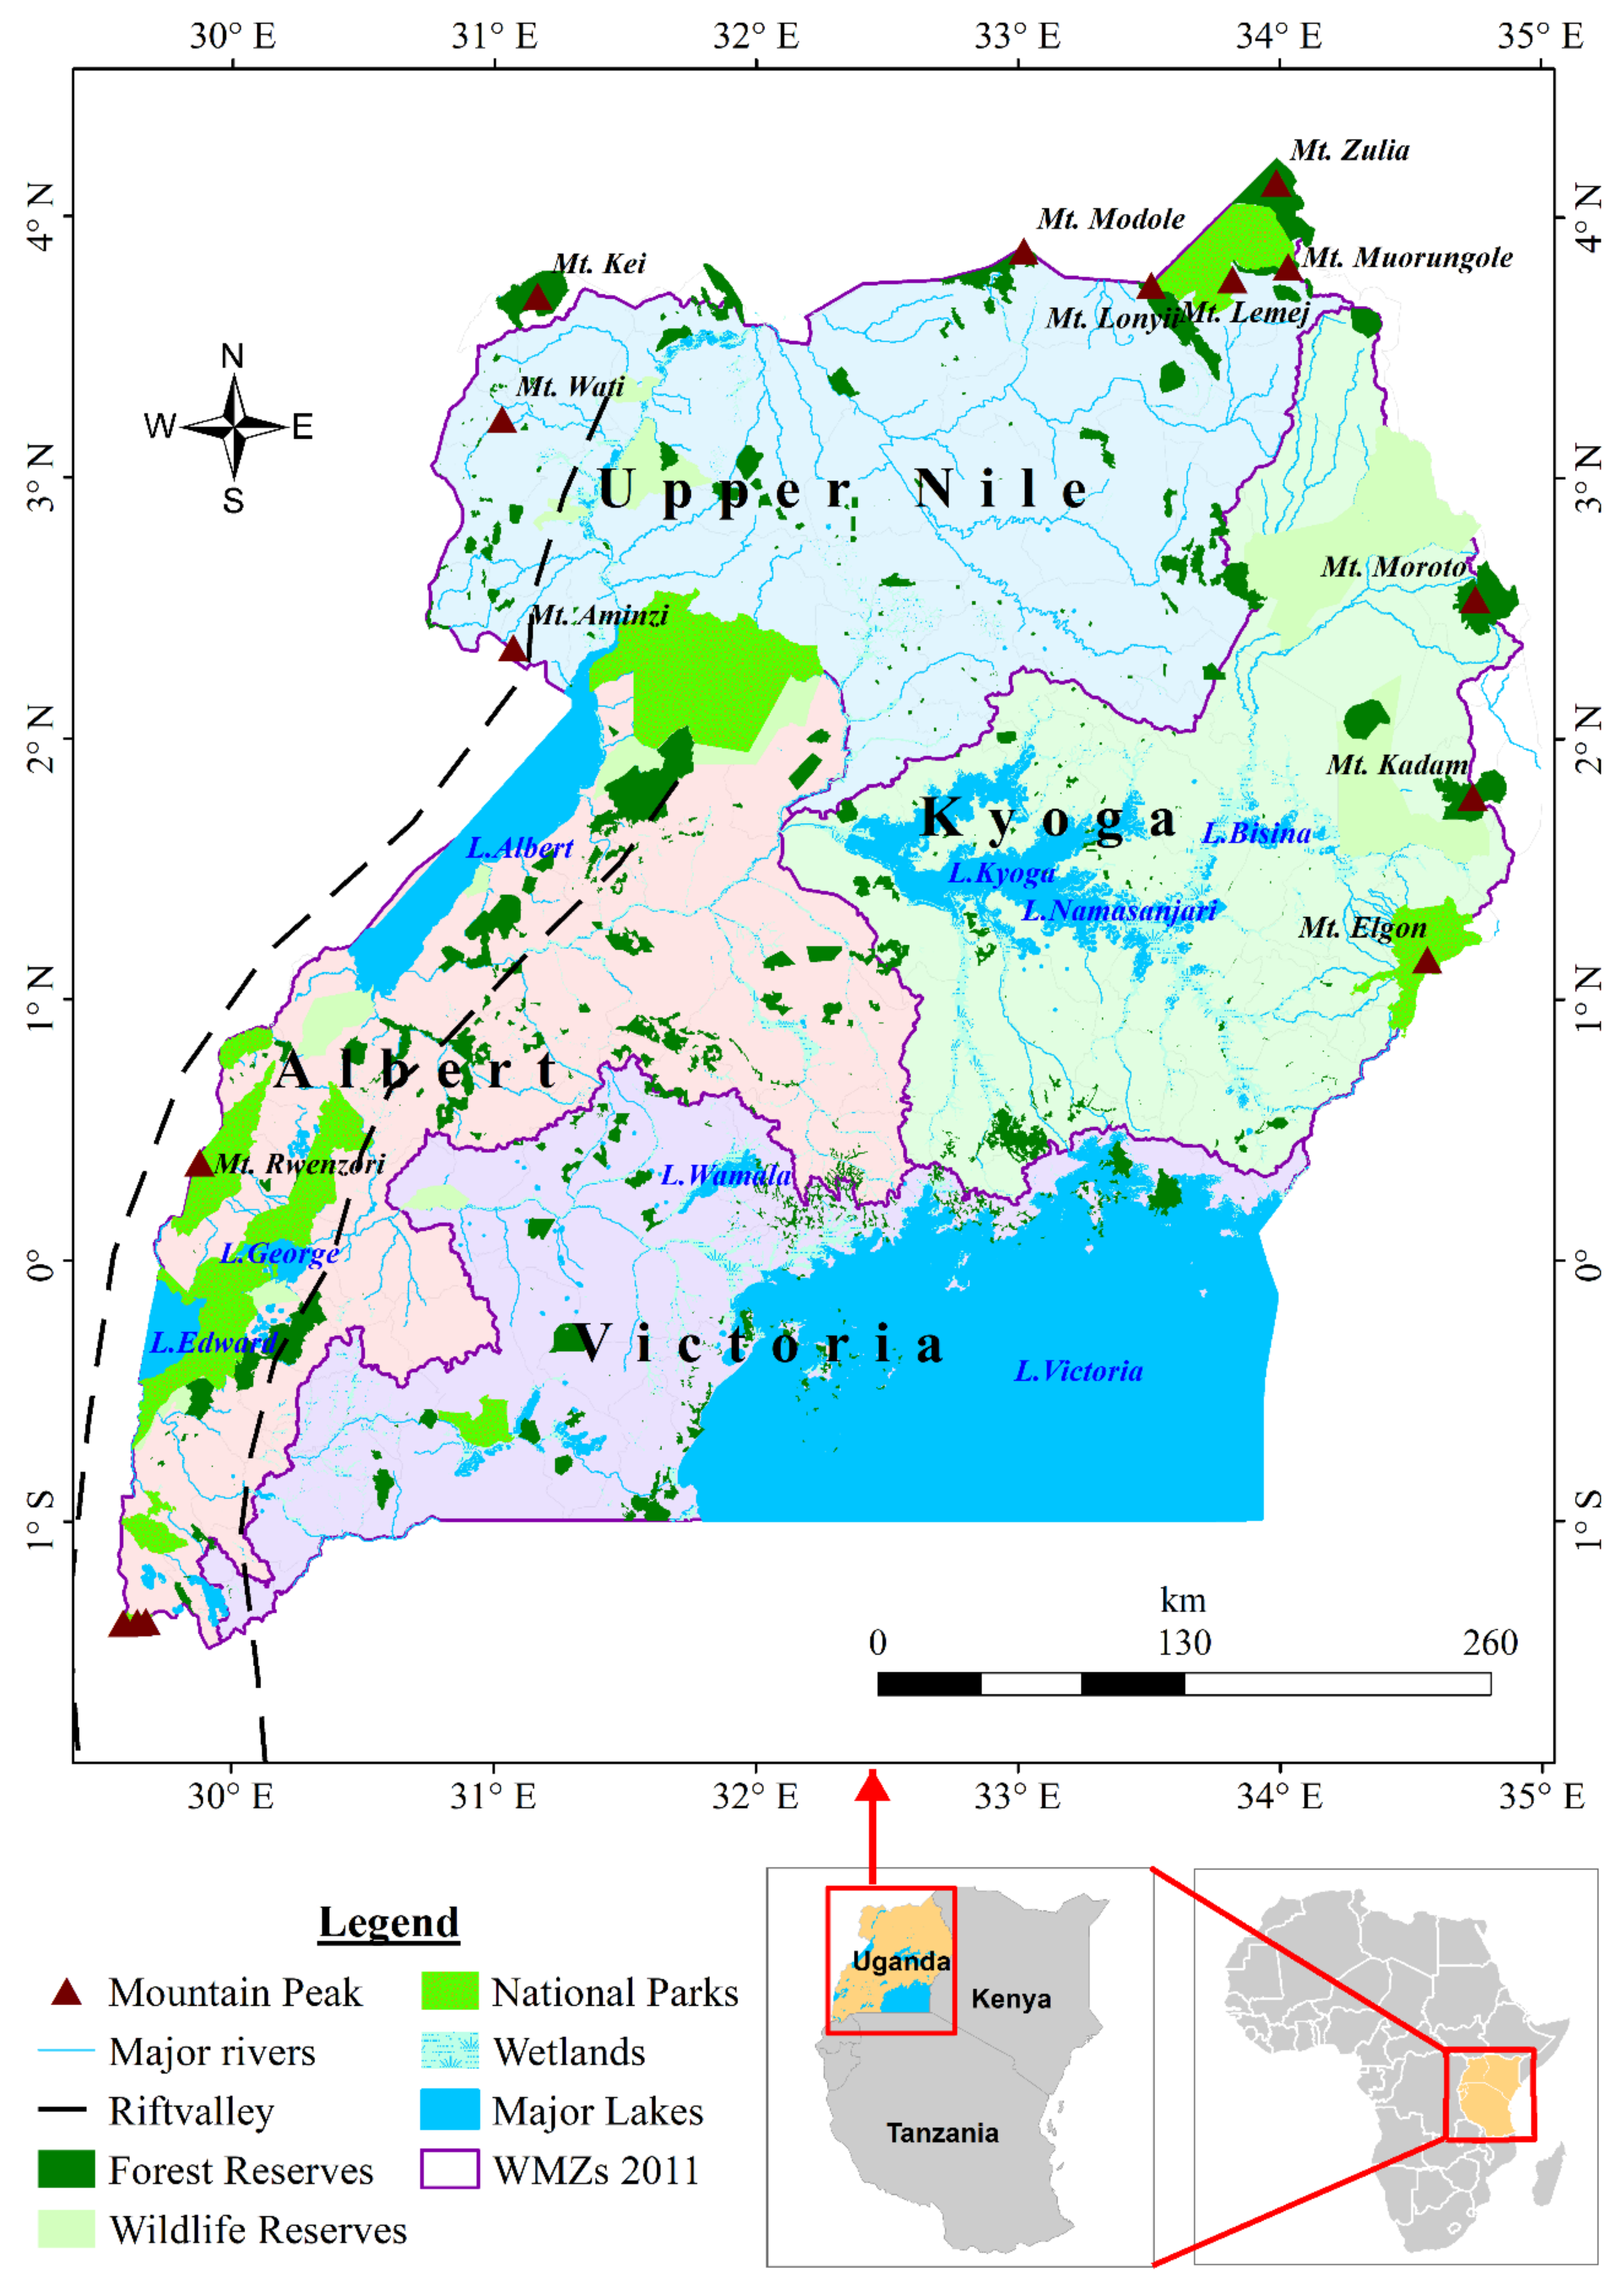
2.1. Study Area

Uganda is a landlocked country with a total surface area of about 241,000 km2 in the eastern part of Africa. The water resources in Uganda cover an area of nearly 44,000 km2 of which 36,000 km2 and 5100 km2 comprise open water and swamps, respectively [32]. The country has a tropical climate and is semi-arid in the northeast. The southern part of the country includes a substantial portion of Lake Victoria, which it shares with Kenya and Tanzania. Other major lakes within Uganda include Lake Kyoga, Lake Albert, Lake George, Lake Kwania, and Lake Bisina. There are eight major rivers in Uganda: the Victoria Nile in central Uganda, River Achwa, Okok, and Pager in the north, the Albert Nile in the northwest; and River Kafu, Katonga, and Mpanga in western Uganda.
The climate of Uganda is generally of a warm tropical type. Temperature on average ranges between 20 and 30 °C. The hottest months are December, January and February. Long rains occur from March to May. Long dry season is from June to August. On average, the amount of annual rainfall in Uganda ranges between 900 mm and 1600 mm. In the southern part along the Equator, the rainfall pattern is of a bimodal type. However, the rainfall pattern becomes somewhat of a unimodal type in the extreme northern part of the country. Nevertheless, largely bimodal precipitation annual cycle is found over much of the East African region (where Uganda or the study area is located) characterized by winter dry season (January–February [JF]); the long rains season (MAM), the summer dry season (June–September [JJAS]) and the short rains season (OND) [33].
Uganda has elevations varying from 620 m (Albert Nile) to 5110 m (Mt. Rwenzori) averaging to about 1100 m above sea level. The plateau generally slopes northwards from the south explaining the northerly tendency of most river flows in the country. Uganda has four WMZs including Albert, Kyoga, Upper Nile and Victoria (Figure 1). The areal coverage of each WMZs obtained by delineation of 30 m × 30 m digital elevation model (DEM), from the United States Geological Survey [34], was different from that provided by the Uganda Catchment Management Planning Guidelines [30]. The differences (Table 1) could be due to the dissimilarity of the spatial resolutions of DEMs used in delineation by Ministry of Water and Environment [30] and this study.

2.2. Data

2.2.1. Historical Data

Historical data including monthly precipitation, solar radiation, as well as maximum (Tmax,°C) and minimum (Tmin,°C) temperatures for a 5-min spatial resolution were obtained from WorldClim version 2.1 climate data (WC2.1) spanning from 1970 to 2000 [35]. The WC2.1 dataset was downloaded via https://www.worldclim.org/data/worldclim21.html (accessed on 10 January 2020).

2.2.2. GCMs’ Output

The CMIP6 model outputs can be accessed from Earth Systems Grid Federation (ESGF; https://esgf-node.llnl.gov/search/cmip6/, accessed on 18 May 2021) data replication centers [36]. However, the spatial resolution of these GCMs is coarse, hindering regional climate change impact studies for scales finer than those of the GCMs. For our regional water availability study, we made use of CMIP6 downscaled simulations for monthly precipitation, solar radiation, Tmax, and Tmin, obtained from https://www.worldclim.org/ (accessed on 10 January 2020).

2.3. Statistical Analyses

2.3.1. Computation of PET

PET was computed using the method of Hargreaves and Samni [37,38] as shown in Equation (1):
PET = 0.0023 × R a × T max T min × T mean 17.8
where Tmean, Tmax, and Tmin refer to the mean, maximum and minimum air temperature (°C), respectively, and Ra denotes the extra-terrestrial solar radiation (W/m2).

2.3.2. Characterization of Mean Climatology

PET and precipitation were converted from daily to annual and seasonal series. To do so, daily PET rates for all the days in each year (or a particular season) were summed to obtain an annual (or a seasonal) value. This was separately repeated for each of the data years. The seasons considered were JF, MAM, JJAS, and OND. The same procedure of summing values in each season or year was applied to precipitation data. Results of spatial distribution of precipitation or PET were used to show areas which are characterized by high or low precipitation or PET totals across each WMZ. Long-term means of precipitation or PET averaged over each WMZ were also used for further comparison.

2.3.3. Statistical Downscaling

Future projections of GCMs are generally inappropriate for direct use in regional climate change impact investigation and this is because of the large bias in the GCMs [8]. Thus, downscaling and/or bias correction is required prior to climate change impact analysis. Downscaling can be performed both dynamically and statistically. Dynamical downscaling is time consuming and computationally arduous. Eventually, statistical methods such as change factor (delta) and quantile-perturbation-based approaches tend to be often used [8,39]. For data used in this study, projected change in weather was computed as the absolute or relative difference between the GCM’s output for the 1970–2000 baseline and future period. Under the assumption that climate is characterized by a high spatial autocorrelation (or relatively stable over space), the computed changes were interpolated to grids of high resolution. The next step was calibration which involved application of the computed changes to the high resolution interpolated WC2.1 or climate data over the 1970–2000 baseline. The idea behind calibration was to minimize mismatch between the simulated and observed (1970–2000) baseline climatic data. Further details can be found via https://www.worldclim.org/data/downscaling.html (accessed on 25 May 2020). The downscaled future climate data were processed for eight GCMs (Table 2) considering four shared socio-economic pathways (SSPs; SSP1-2.6, SSP2-4.5, SSP3-7.0, and SSP5-8.5).
In phase 5 of the CMIP (CMIP5), there were four representative concentration pathways (RCPs) including RCP2.6, RCP4.5, RCP6.0, and RCP8.5 which characterized a broad range of forcing (2.6, 4.5, 6.0, and 8.5 watts per m2) by 2100. The narratives of the RCPs did not purposefully consider the SSPs. In CMIP6, SSPs [40] were considered to characterize the ways in which socioeconomic factors (such as population, urbanization, economic growth, and education) might change the world in the absence of climate policy; furthermore, the SSPs also consider how the mitigation targets of RCPs when combined with the SSPs could influence the levels of climate change mitigation.
The 8 GCMs (Table 2) used in this study were the only ones for which downscaled and bias-corrected data were available on the website of the WorldClim by the time of conducting this research. The list of the GCMs and their institutions as well as spatial resolution can be seen in Table 2. All the GCMs in Table 2 had the same spatial (5-min) resolution before being adopted for this study. Each of the monthly scenarios, SSP1-2.6, SSP2-4.5, SSP3-7.0, and SSP5-8.5, was obtained for the periods 2021–2040, 2041–2060, 2061–2080, and 2081–2100.

2.3.4. Quantifying Future Changes in Precipitation and PET

As for the historical data, GCMs outputs including precipitation, solar radiation, Tmax, and Tmin were used to compute PET scenarios based on Equation (1). It is worth noting that solar radiation for the future simulations was lacking. Thus, computations of PET scenarios were based on an assumption of a constant solar radiation (or similar to that of the 1970–2000 climate baseline). Precipitation and PET scenarios were converted from monthly to seasonal totals. Precipitation or PET over the periods 2021–2040, 2041–2060, 2061–2080, and 2081–2100 were computed for each season.
For calculation of future changes in precipitation and PET, let fhis (ffut) be the observed (scenario) annual precipitation or PET (mm), and fhis,z (ffut,z) the observed (future) precipitation or PET for season z. Changes in annual precipitation or PET were calculated as the difference (ffutfhis) over fhis expressed in percentage. Similarly, the ratio of the difference (ffut,zfhis,z) to fhis,z was used to quantify the changes in precipitation or PET for season z.

3. Results and Discussion

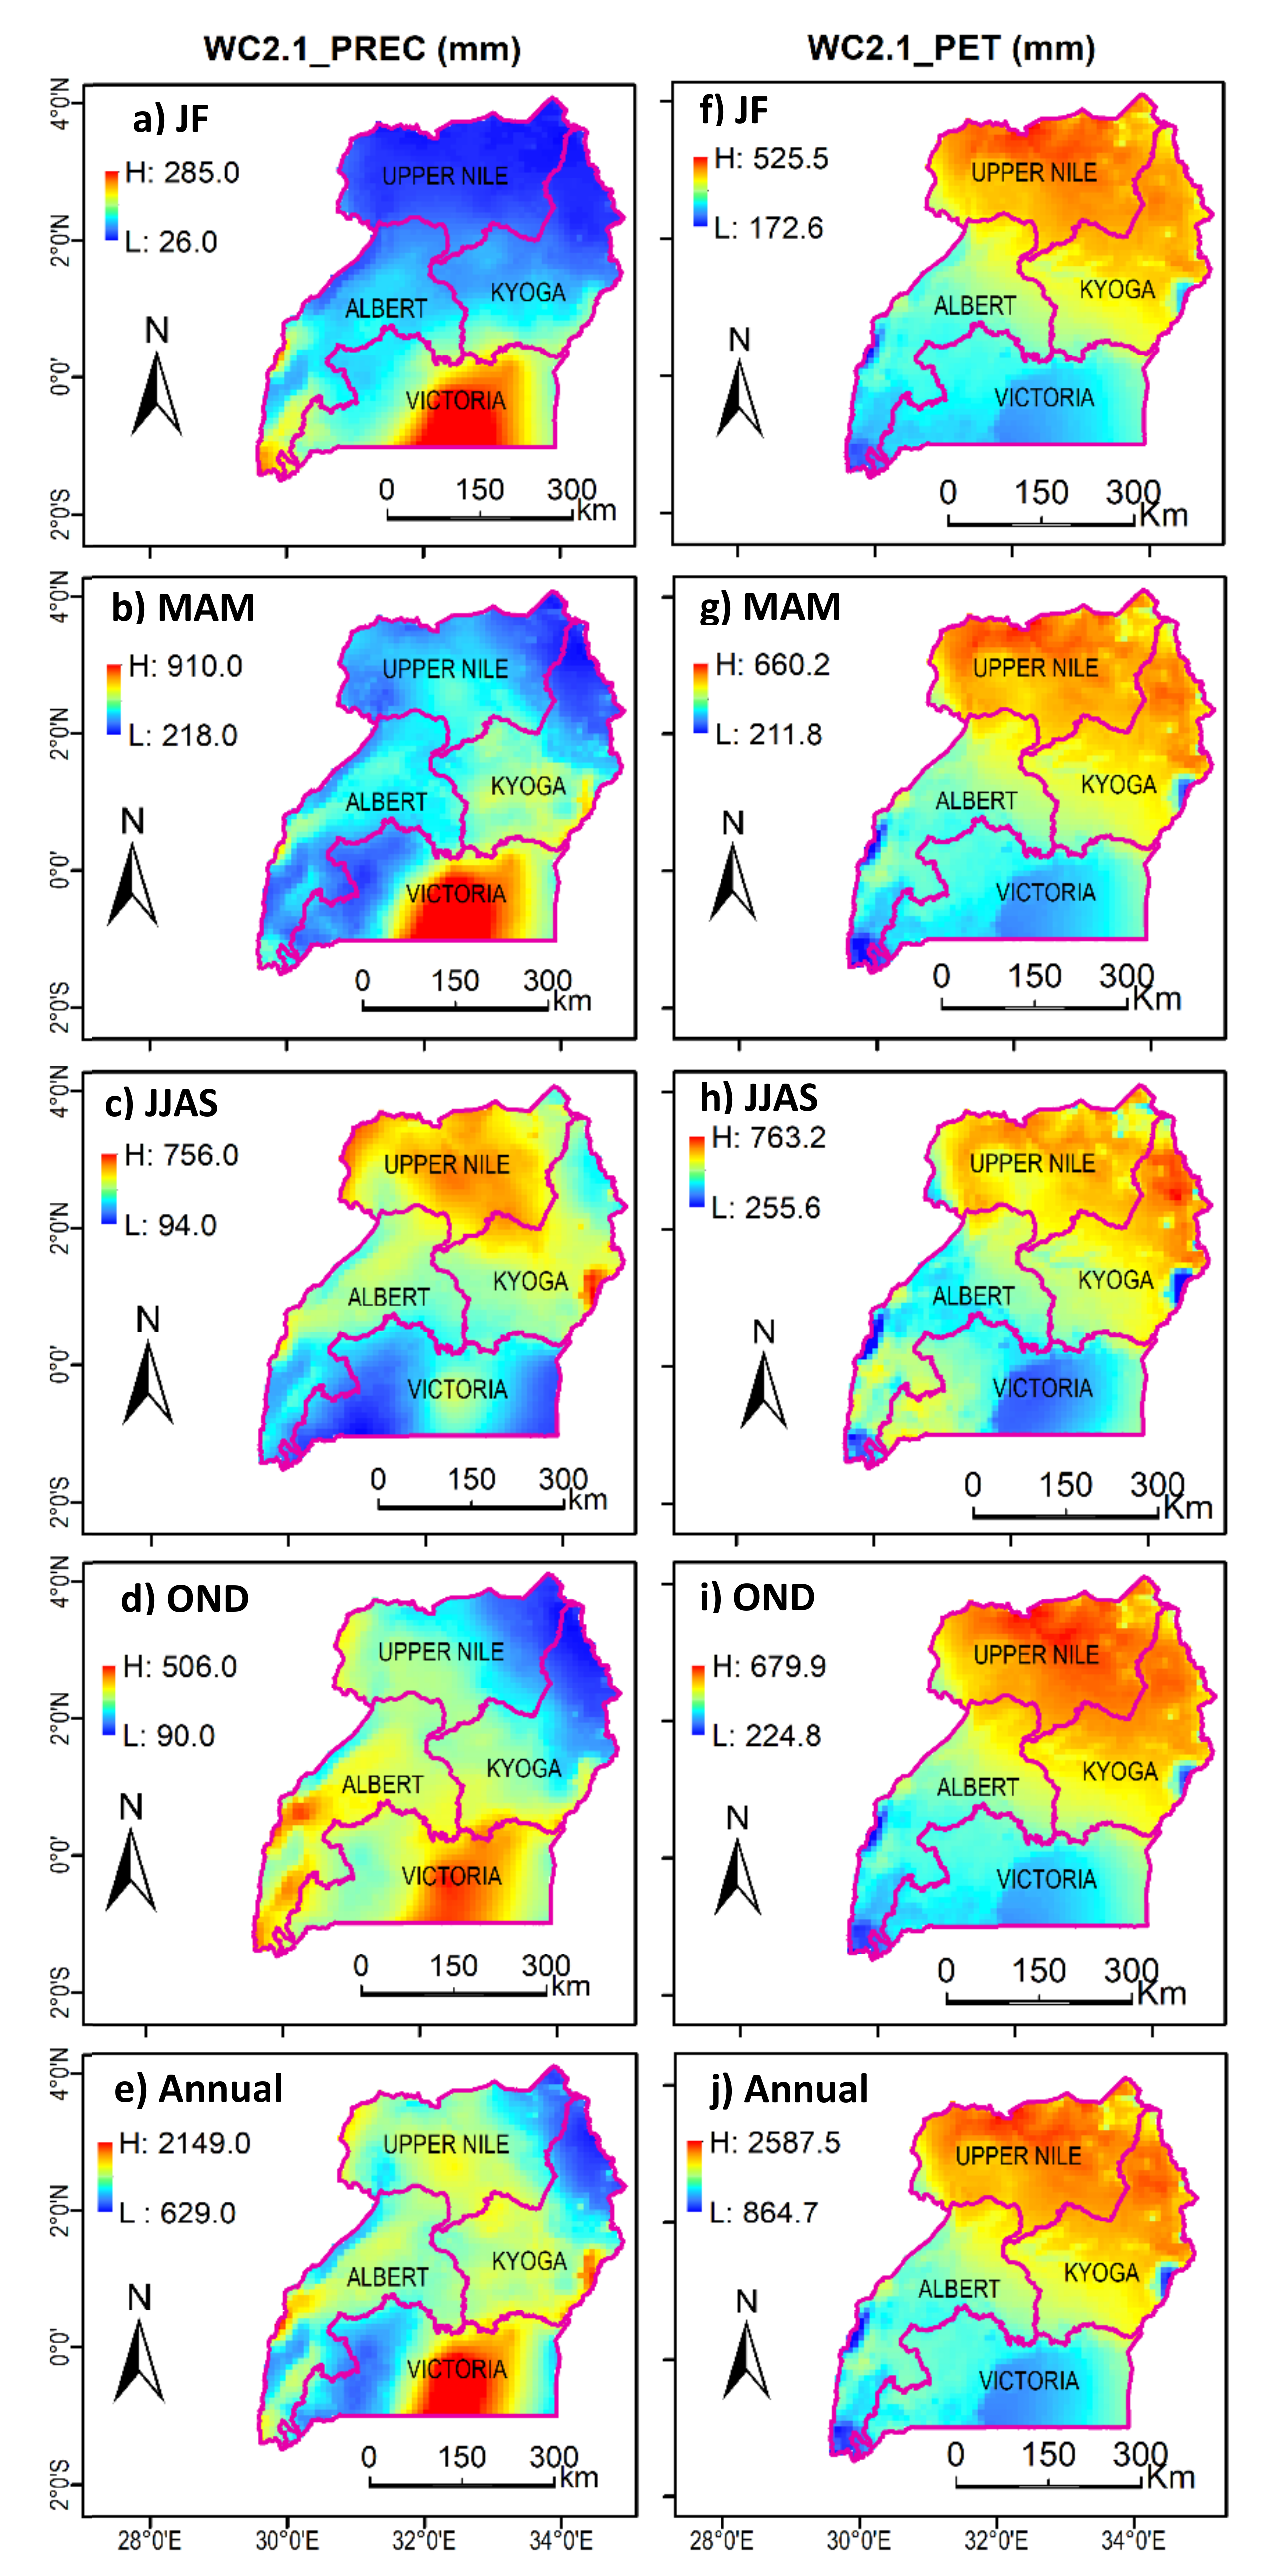
3.1. Historical Precipitation and PET

The spatial variation in the long-term precipitation and PET totals across the four WMZs in Uganda is shown in Figure 2. Results of the precipitation and PET totals averaged over each WMZ are presented in Table 3. Generally, the western part of the Victoria WMZ (where Lake Victoria is located) is characterized by larger precipitation and lower PET totals than those over land (Figure 2a–f). The Upper Nile, northern Kyoga, and northern Albert are characterized by high PET but low precipitation (Figure 2a–f). This indicates the susceptibility of the Upper Nile to water scarcity over both seasonal and annual scales [23]. Low OND and annual precipitation totals are generally confined to the northeastern (or Karamoja) region (Figure 2d–e). The JJAS precipitation is low over Victoria and southern Albert (Figure 2c). The precipitation pattern is unimodal in the southern and bimodal in the northern part of the country following the latitudinal migration of the tropical rain belt.

3.2. Future Precipitation and PET

The projected changes in precipitation in the 2030s (period 2021–2040) can be seen in Figure 3. The results show that seasonal precipitation over this period will generally increase across the country by up to 10% (Figure 3a–d,f–i,k–n,p–s). Considering all the SSPs, each of the WMZs will record an increase in OND precipitation (Figure 3d,i,n,s). However, certain areas will be characterized by a decrease in precipitation of some seasons. For instance, SSP3-7.0 showed that almost the entire country will experience a decrease in JF precipitation by up to 10% (Figure 3k). Over Lake Victoria, JJAS precipitation will remain almost unchanged (a decrease of ≃1%) (Figure 3c,h,r). Similarly, considering SSP1-2.6, SSP2-2.4, and SSP5-8.5, JF precipitation will remain approximately unchanged though with a slight increase of <1% especially in the northern half of the country (Figure 3a,f,p). Overall, the various SSPs revealed that annual precipitation is expected to increase across all the WMZs with the percentage changes ranging from 2.8 to 9.5% (Figure 3e,j,o,t). Changes in precipitation for the 2050s, 2070s, and 2090s considering the various scenarios can be found in Appendix A Figure A1, Figure A2 and Figure A3. The results (considering all the scenarios SSP1-2.6, SSP2-4.5, SSP3-7.0, and SSP5-8.5) show that generally the largest increases in annual precipitation during the 2050s, 2070s, and 2090s will be in the ranges 7.8–12.5%, 7.9–19.9%, and 6.9–26.3%, respectively. The upper and lower limits of these ranges were all obtained under SSP5-8.5 and SSP1-2.6, respectively.
Results from this study indicated that both seasonal and annual precipitation across Uganda will generally increase over the period 2021–2100. However, these increases especially in the annual precipitation from the various scenarios will be limited to less than 30%. There are a few studies [16,17] that also found that precipitation will increase over Uganda. Sridharan et al. [18] showed that even the expected driest climate in the future will have an average annual precipitation of approximately 1000 mm. Nevertheless, our study showed that the Upper Nile as well as the northern parts of Kyoga and Albert will meteorologically be drier than Victoria, southern Albert.
Averaged climate change projections for precipitation over each WMZ can be seen in Figure 4. A substantial change in precipitation will occur towards the end of the 21st century; 2090s, under SSP3-7.0 and SSP5-8.5 relative to the baseline period (Figure 4d). The period 2030s and 2050s show that the region will experience <10% increase in precipitation in most WMZs, while a pronounced increase is noted during the 2070s until the end of the century. Whereas JF season is considered as a dry anomaly in present climate and MAM is regarded as a long rainy season (Table 3), the future change presents an opposite pattern with noteworthy deviations in the climatology. In fact, JF is projected to increase while minimal changes in MAM are projected to continue across various time slices and scenarios (Figure 4a–d). For instance, during the 2070s and 2090s under SSP5-8.5, the JF season is projected to experience an increase by >25 and 37% in Victoria and Kyoga compared to MAM with 3 and 5%, respectively (Figure 4c,d). On the other hand, OND exhibits a positive anomaly with projected changes expected under SSPs 2-4.5, 3-7.0, and 5-8.5 scenarios in all WMZs during the 2070s and 2090s. Overall, remarkable changes are projected to occur across the various WMZs in Uganda during the late century from the 2070s and 2090s compared to the 2030s and 2050s under averaged no policy and worst-case no policy scenarios. MAM and JJAS are projected to receive an insubstantial amount of precipitation, while JF and OND precipitation will increase in most WMZs in Uganda. The findings agree with existing studies based on previous versions of GCMs, or RCMs conducted across the entire Uganda or broader East Africa region [16,17]. Enhanced precipitation changes during OND and JF could be attributed to the increased moisture convergence that enhances the local monsoon during boreal autumn local over East Africa [41]. More intense Walker and Hadley circulations resulting from Indian Ocean Dipole mode also had a significant impact on the seasonal precipitation changes [42]. Conversely, fewer changes during MAM under all scenarios over the WMZ of Uganda could be linked to the persistent warming of the sea surface temperature along the Western Indian Ocean during the twentieth and twenty-first centuries [43,44,45].
Figure 5 shows the impacts of climate change on PET. It is noticeable that JF PET total of the 2030s is expected to be generally greater than that of the historical condition by about 2.5% on average (Figure 5a,f,k,p). Almost no change of JF PET (a slight decrease of ≃1% on average) is expected to occur around Lake Albert. The MAM PET is projected to increase over all the WMZs to varying extents up to 4.8%. Generally, PET increase over Victoria and southern Albert is expected to be larger in magnitude than those in the Upper Nile as well as the northern parts of Albert and Kyoga (Figure 5b–e,g–j,l–o,q–t). Changes in PET for the 2050s, 2070s, and 2090s for different future scenarios can be found in Appendix B Figure A4, Figure A5 and Figure A6. Results (considering all the scenarios SSP1-2.6, SSP2-4.5, SSP3-7.0, and SSP5-8.5) show that the largest increases in annual PET during the 2050s, 2070s, and 2090s will be in the ranges 4.8–7.9%, 5.1–11.8%, and 5.3–17.1, respectively. Like precipitation, the lower and upper limits of these ranges in all cases were related to the SSP1-2.6 SSP5-8.5 scenarios, respectively.
Similar to precipitation, both seasonal and annual PET of the future climatic conditions will be larger than those over the historical period. This increase in PET will occur almost across the country. It is notable that there will be a generally positive trend in PET throughout the projection period. This is due to the projected increase in temperature (as the major determinant of PET) under global warming [24]. An increase in temperature across East Africa or the African tropics has also been found in a number of studies (e.g., [17,46,47]). As temperature increases, PET is also expected to increase. This is because high temperature induces an increased amount of energy required to convert liquid water to water vapor [48]. Theoretically, the expected increase in evaporative demand per degree warming is at a globally varying rate of 1.5–4% according to the Clausius–Clapeyron relationship [49]. Nevertheless, our results show that the amount by which annual PET under different future scenarios over the period 2021–2100 will increase is expected to remain below 20% on average. The increases in PET will generally be larger over the Upper Nile, Kyoga, and northern Albert than in the Victoria and the southern Albert. It is worth noting that the water required to meet the evaporation and transpiration demands is supplied by precipitation [48]). Hence, as precipitation increases, PET is also expected to increase. This theorized expectation is not always met and precipitation and PET changes highly vary in space due to their spatially varying dynamic and thermodynamic drivers [50]. The crucial aspect to consider for water resources planning is whether the PET is greater than precipitation. When precipitation is less than PET at a location, we talk about water availability or surplus and hence the need to plan for disasters such as floods. On the other hand, water scarcity at a location results from the condition characterized by PET being greater than precipitation. Here, there is a need to plan for livelihood under prolonged dry conditions or droughts.
Climate change projections for PET averaged over each WMZ are shown in Figure 6. The 2030s will experience smaller changes across all seasons and annual cycles under all scenarios examined (Figure 6a). The PET changes over Albert, Kyoga, and Victoria are projected to intensity during the 2070s and 2090s, while Upper Nile shows smaller changes, and in some cases negative anomalies during JJAS under the SSP3-7.0 scenario (Figure 6c). Nevertheless, relative increment in PET is projected to increase with lead time, i.e., 2030s, 2050s, 2070s, and 2090s. A positive change of >14% is noted over Victoria and Albert under the worst-case scenario policy during MAM and JJAS (Figure 6d). On the other hand, PET changes will be minimal under the SSP1-2.6 and SSP2-4.5 scenarios, reflecting the effectiveness of nations in implementing mitigation measures spelled out under the Paris Accord. Generally, the temporal patterns of PET changes over WMZs in Uganda will follow precipitation changes during the study period. The noticeable shift under SSP3-7.0 and SSP5-8.5 for PET resembles the patterns of projected changes in precipitation. The implication of PET increase/decrease relative to precipitation change will result in either drought/floods over the region.

4. Discussion and Conclusions

This study aimed at analyzing observed and future precipitation and PET of the four water catchment zones in Uganda. The study used the latest GCMs of CMIP6 to quantify the climate change impacts on precipitation and PET while taking into account the difference in seasons across various WMZs. Historical and projections (bias-corrected) datasets obtained from World Clim (WC2.1) for precipitation, Tmin, Tmax, and solar radiation were employed for the period 1970–2000 and 2021–2100. Solar radiation as well as Tmin and Tmax were used to compute PET. Future changes were assessed based on four SSPs scenarios including SSP1-2.6, SSP2-4.5, SSP3-7.0, and SSP5-8.5, for four future horizons of 2021–2040, 2041–2060, 2061–2080, and 2081–2100. The specific findings are detailed as follows:
i.
Observed precipitation and PET over WMZs in Uganda are characterized by distinct variations from one region to another. While the western part of the Victoria WMZ (where Lake Victoria is located) was generally characterized by higher precipitation and lower PET totals than those over land. Moreover, Upper Nile, northern Kyoga, and northern Albert were characterized by high PET but low precipitation totals.
ii.
The lowest seasonal precipitation and highest seasonal PET totals exhibited patterns characterized by a north–south gradient for OND and annual scales mostly occurring over the northeastern region while JJAS dominates in the Victoria and southern Albert.
iii.
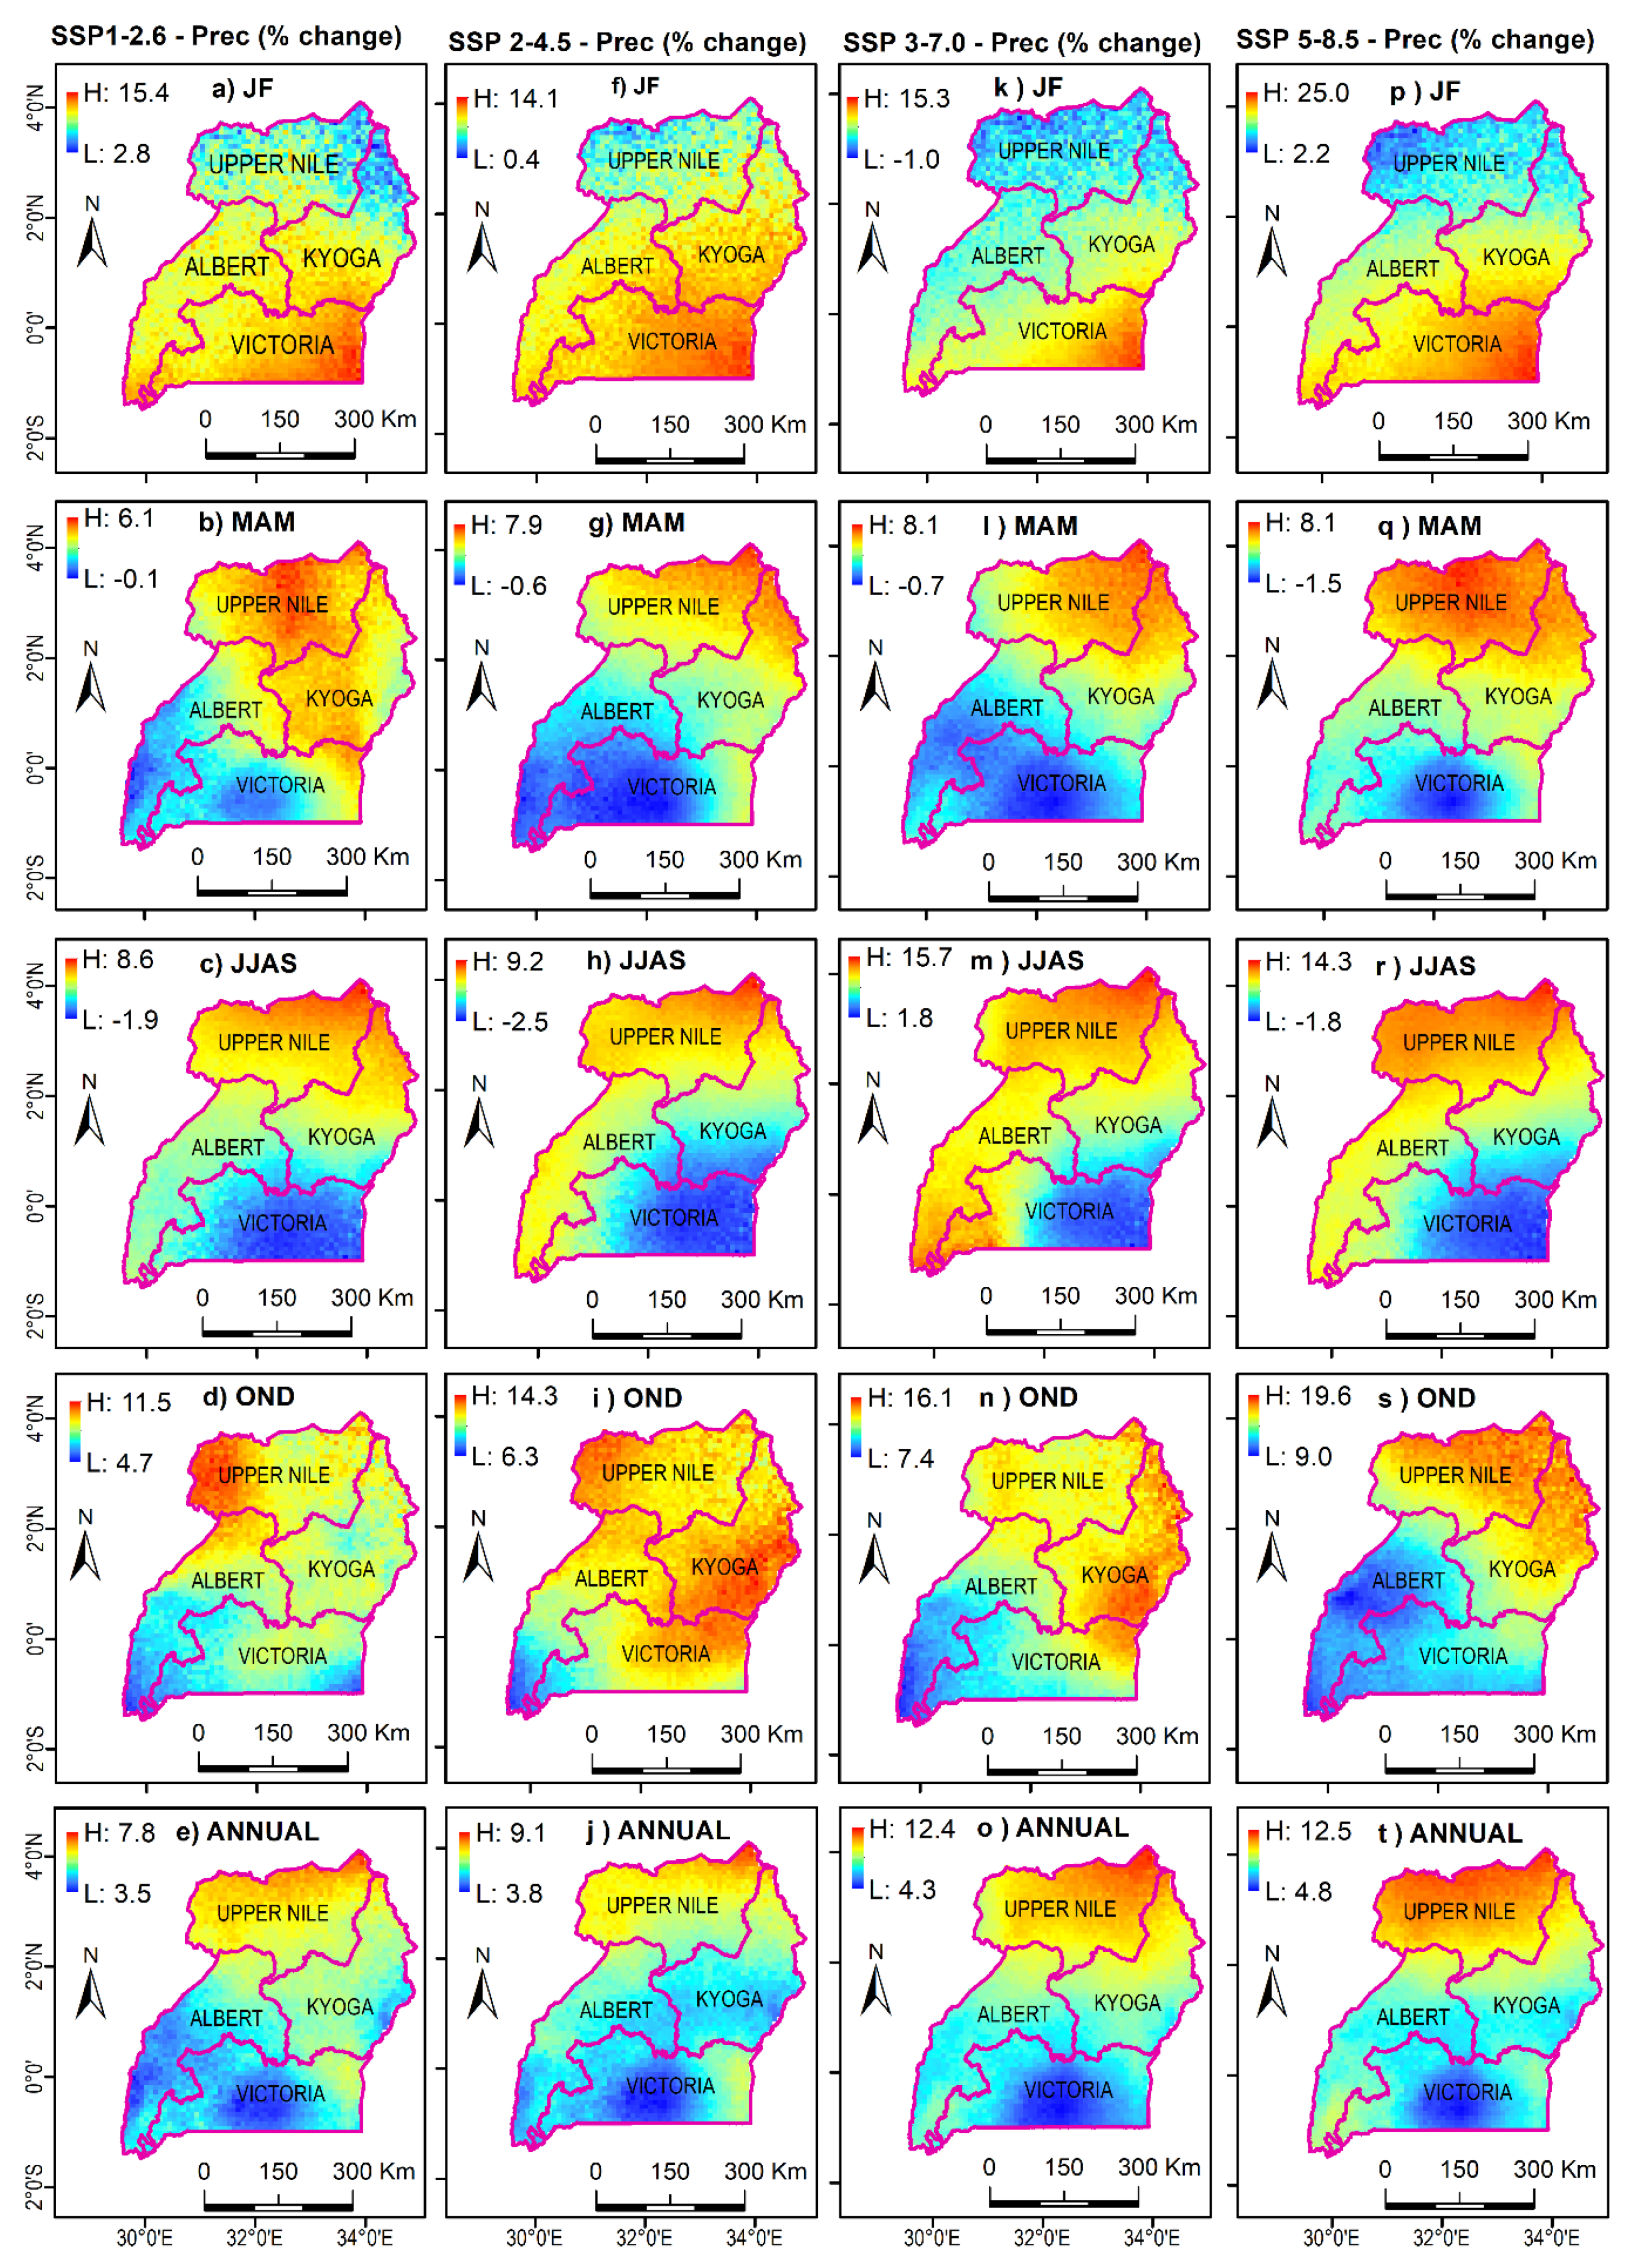
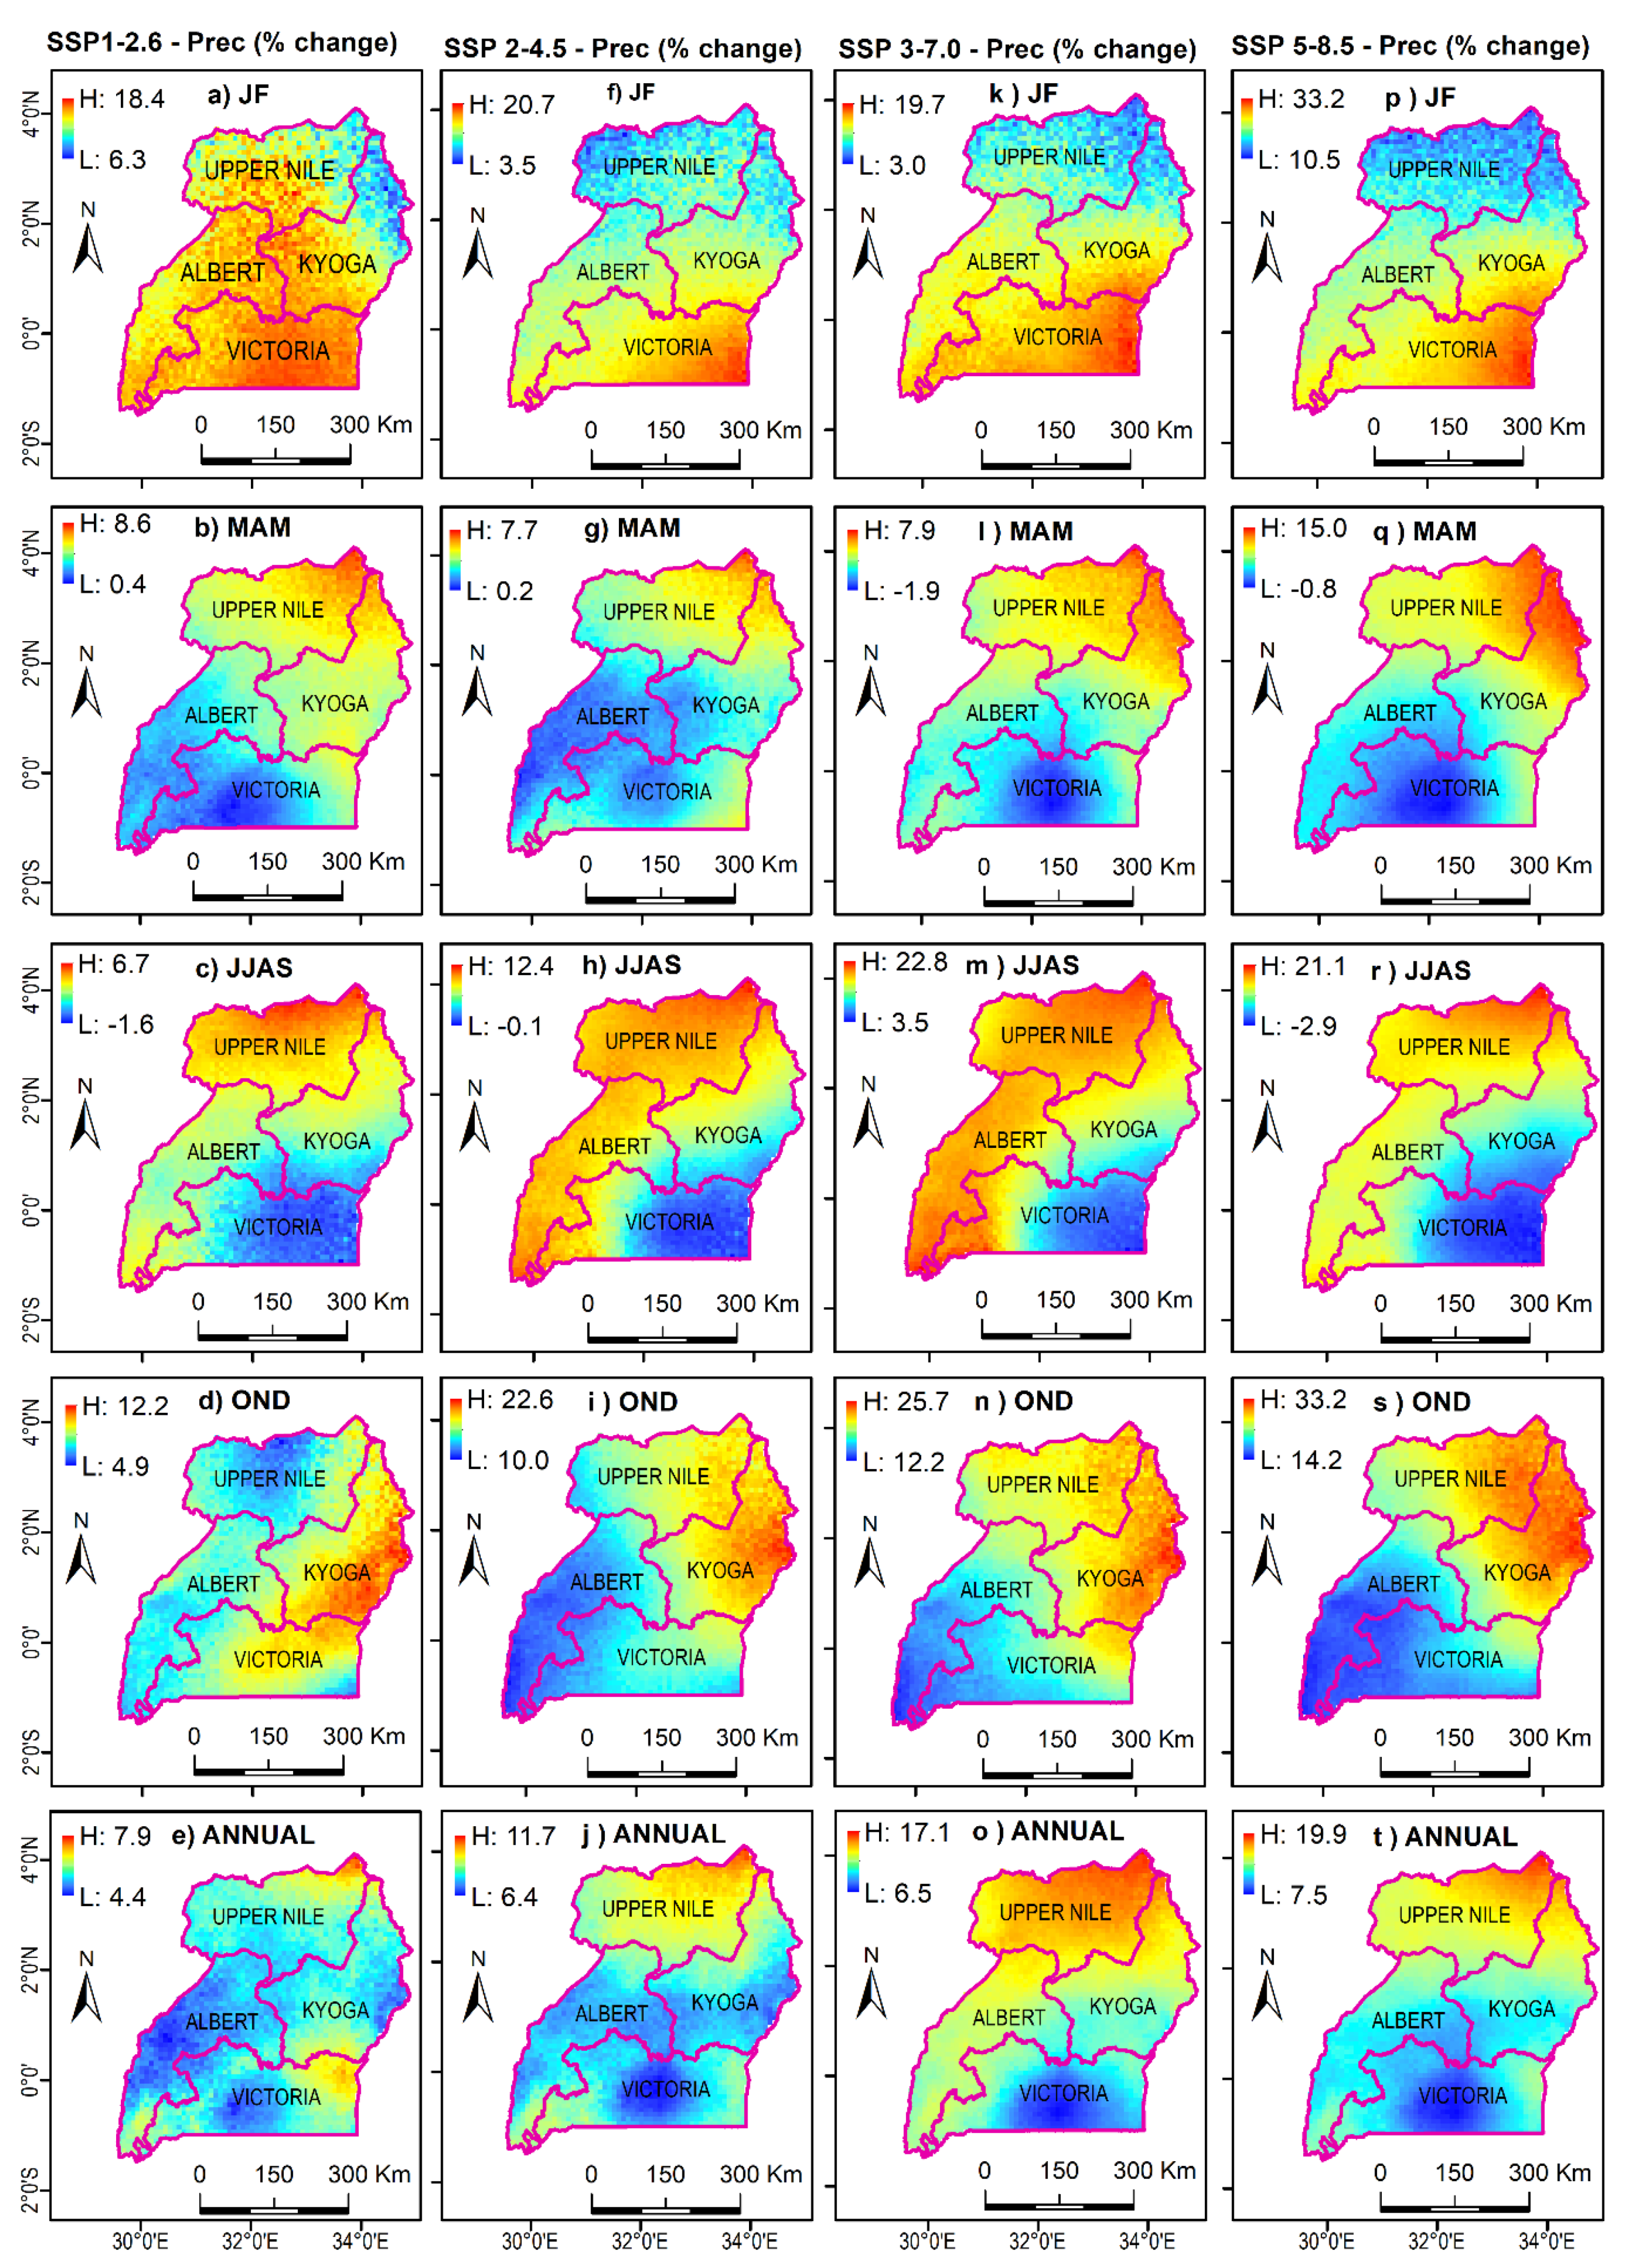
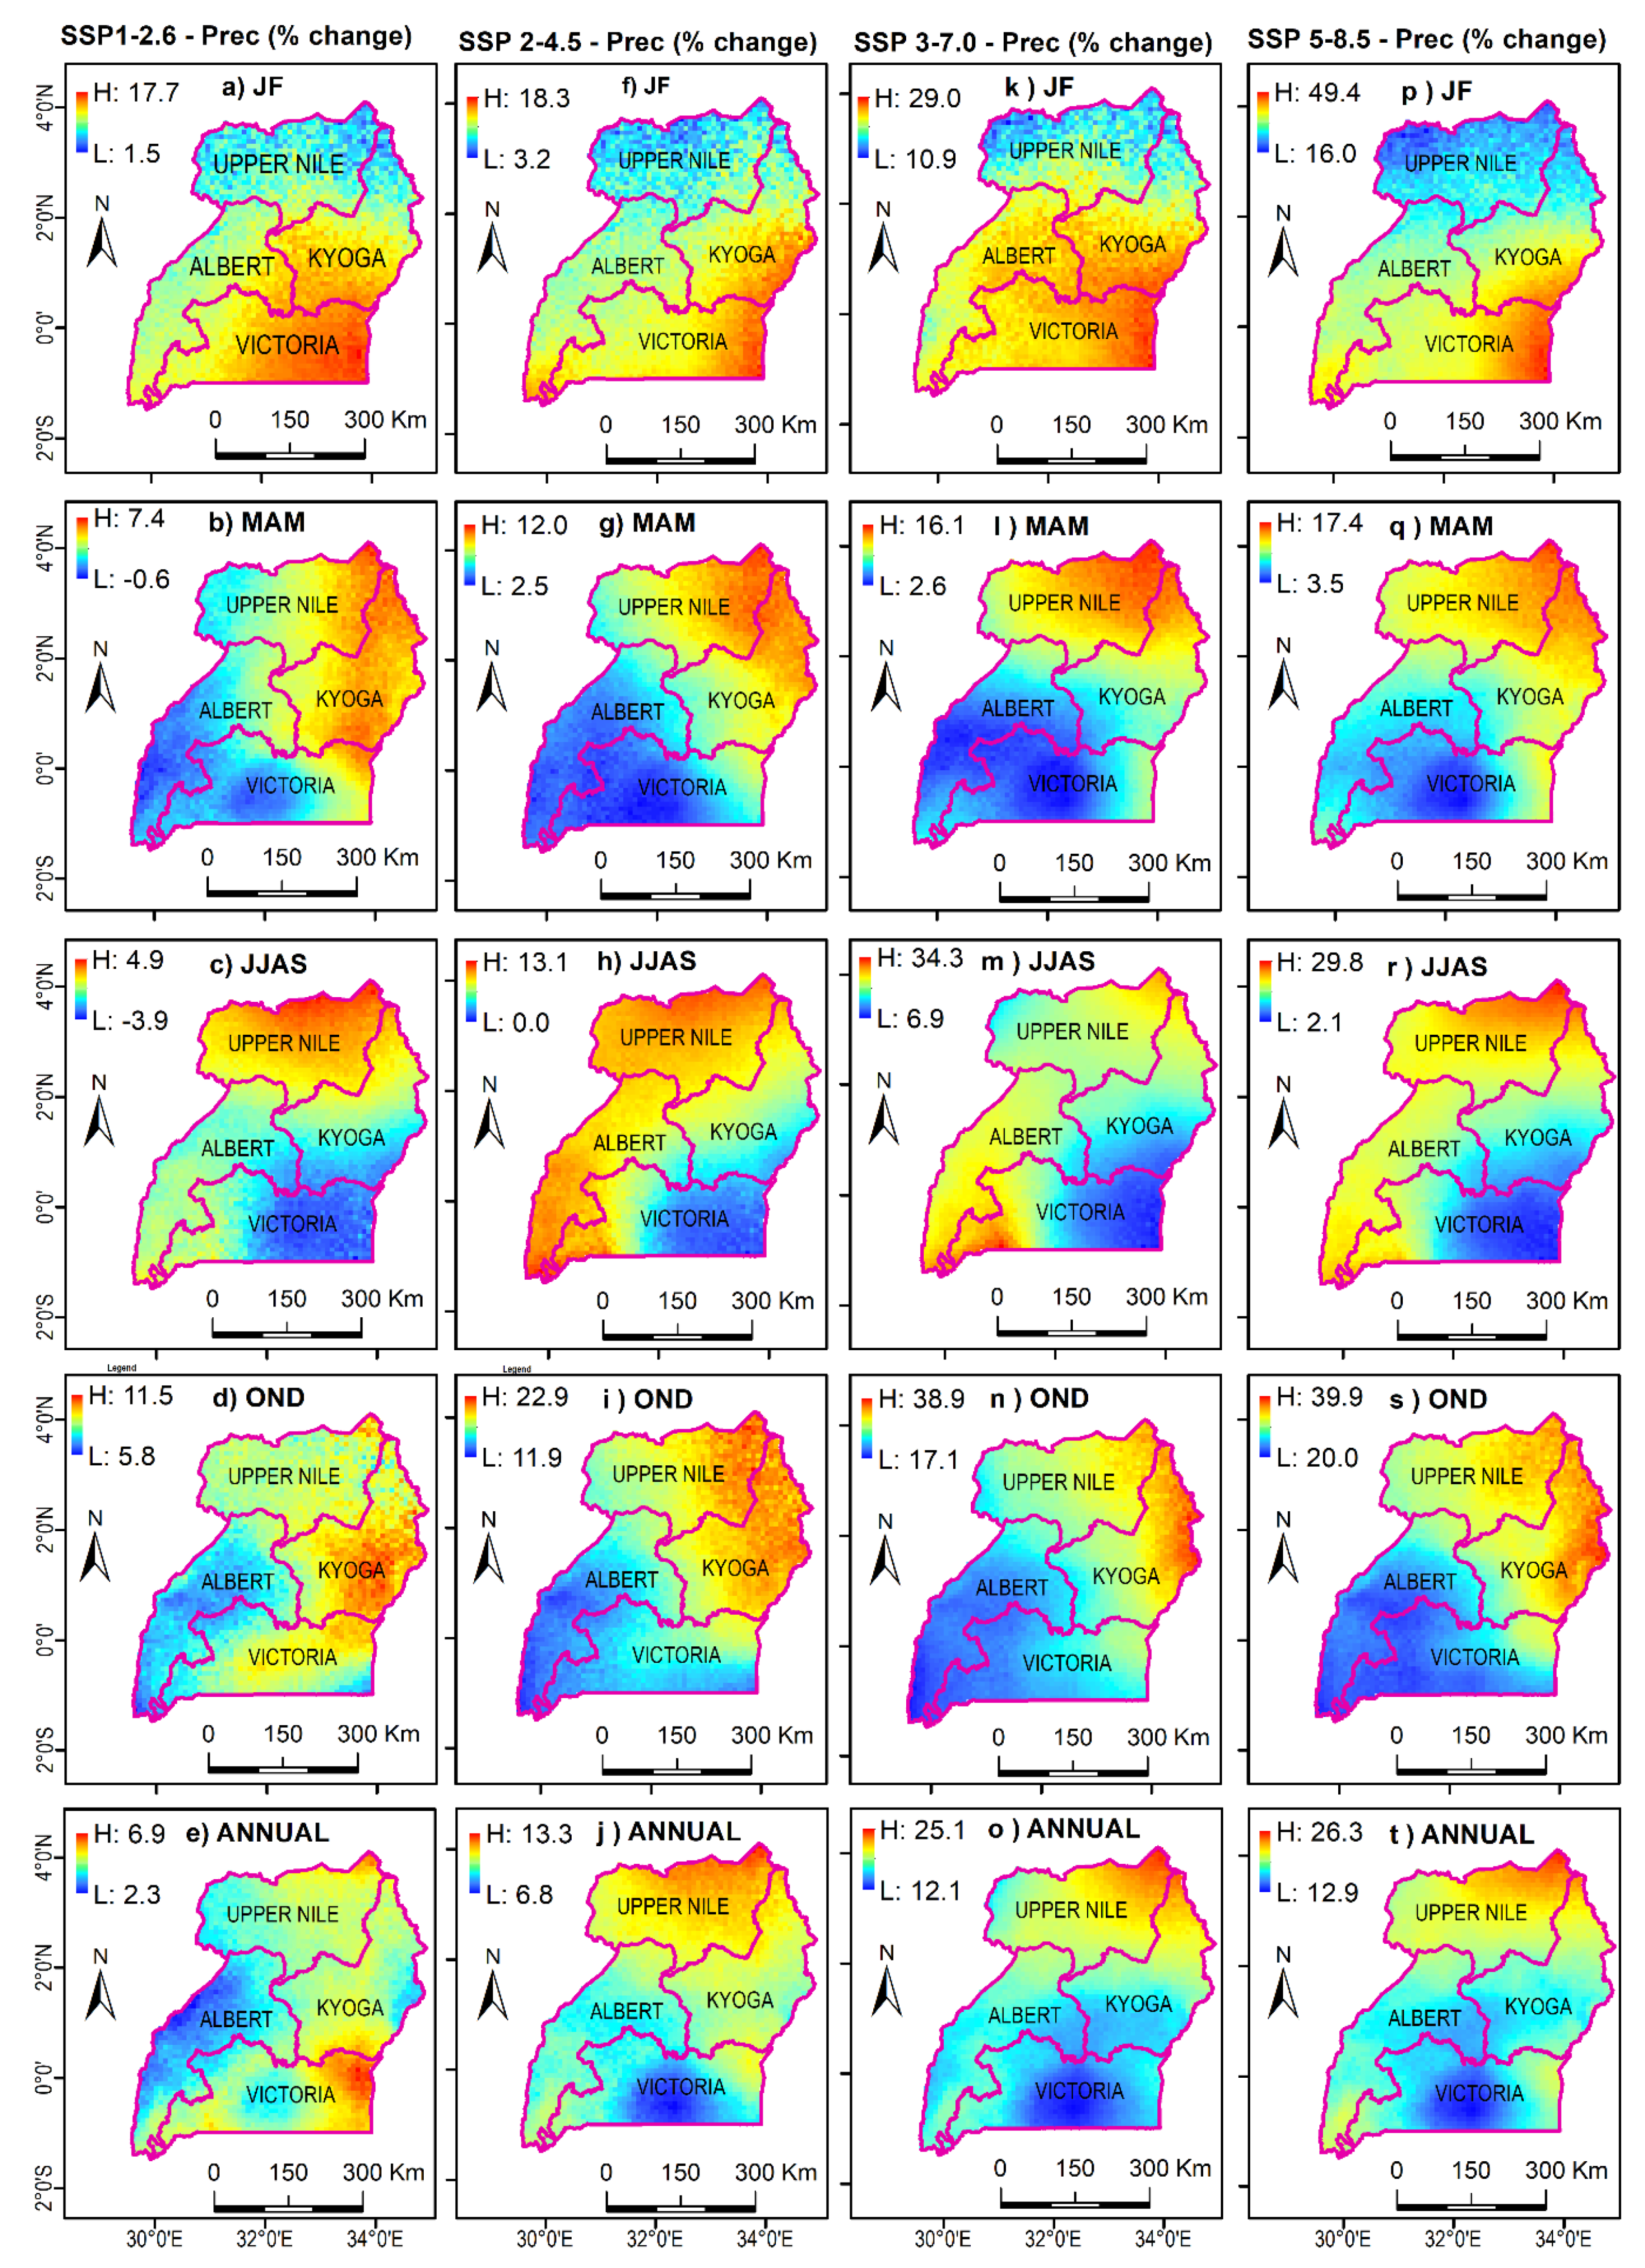
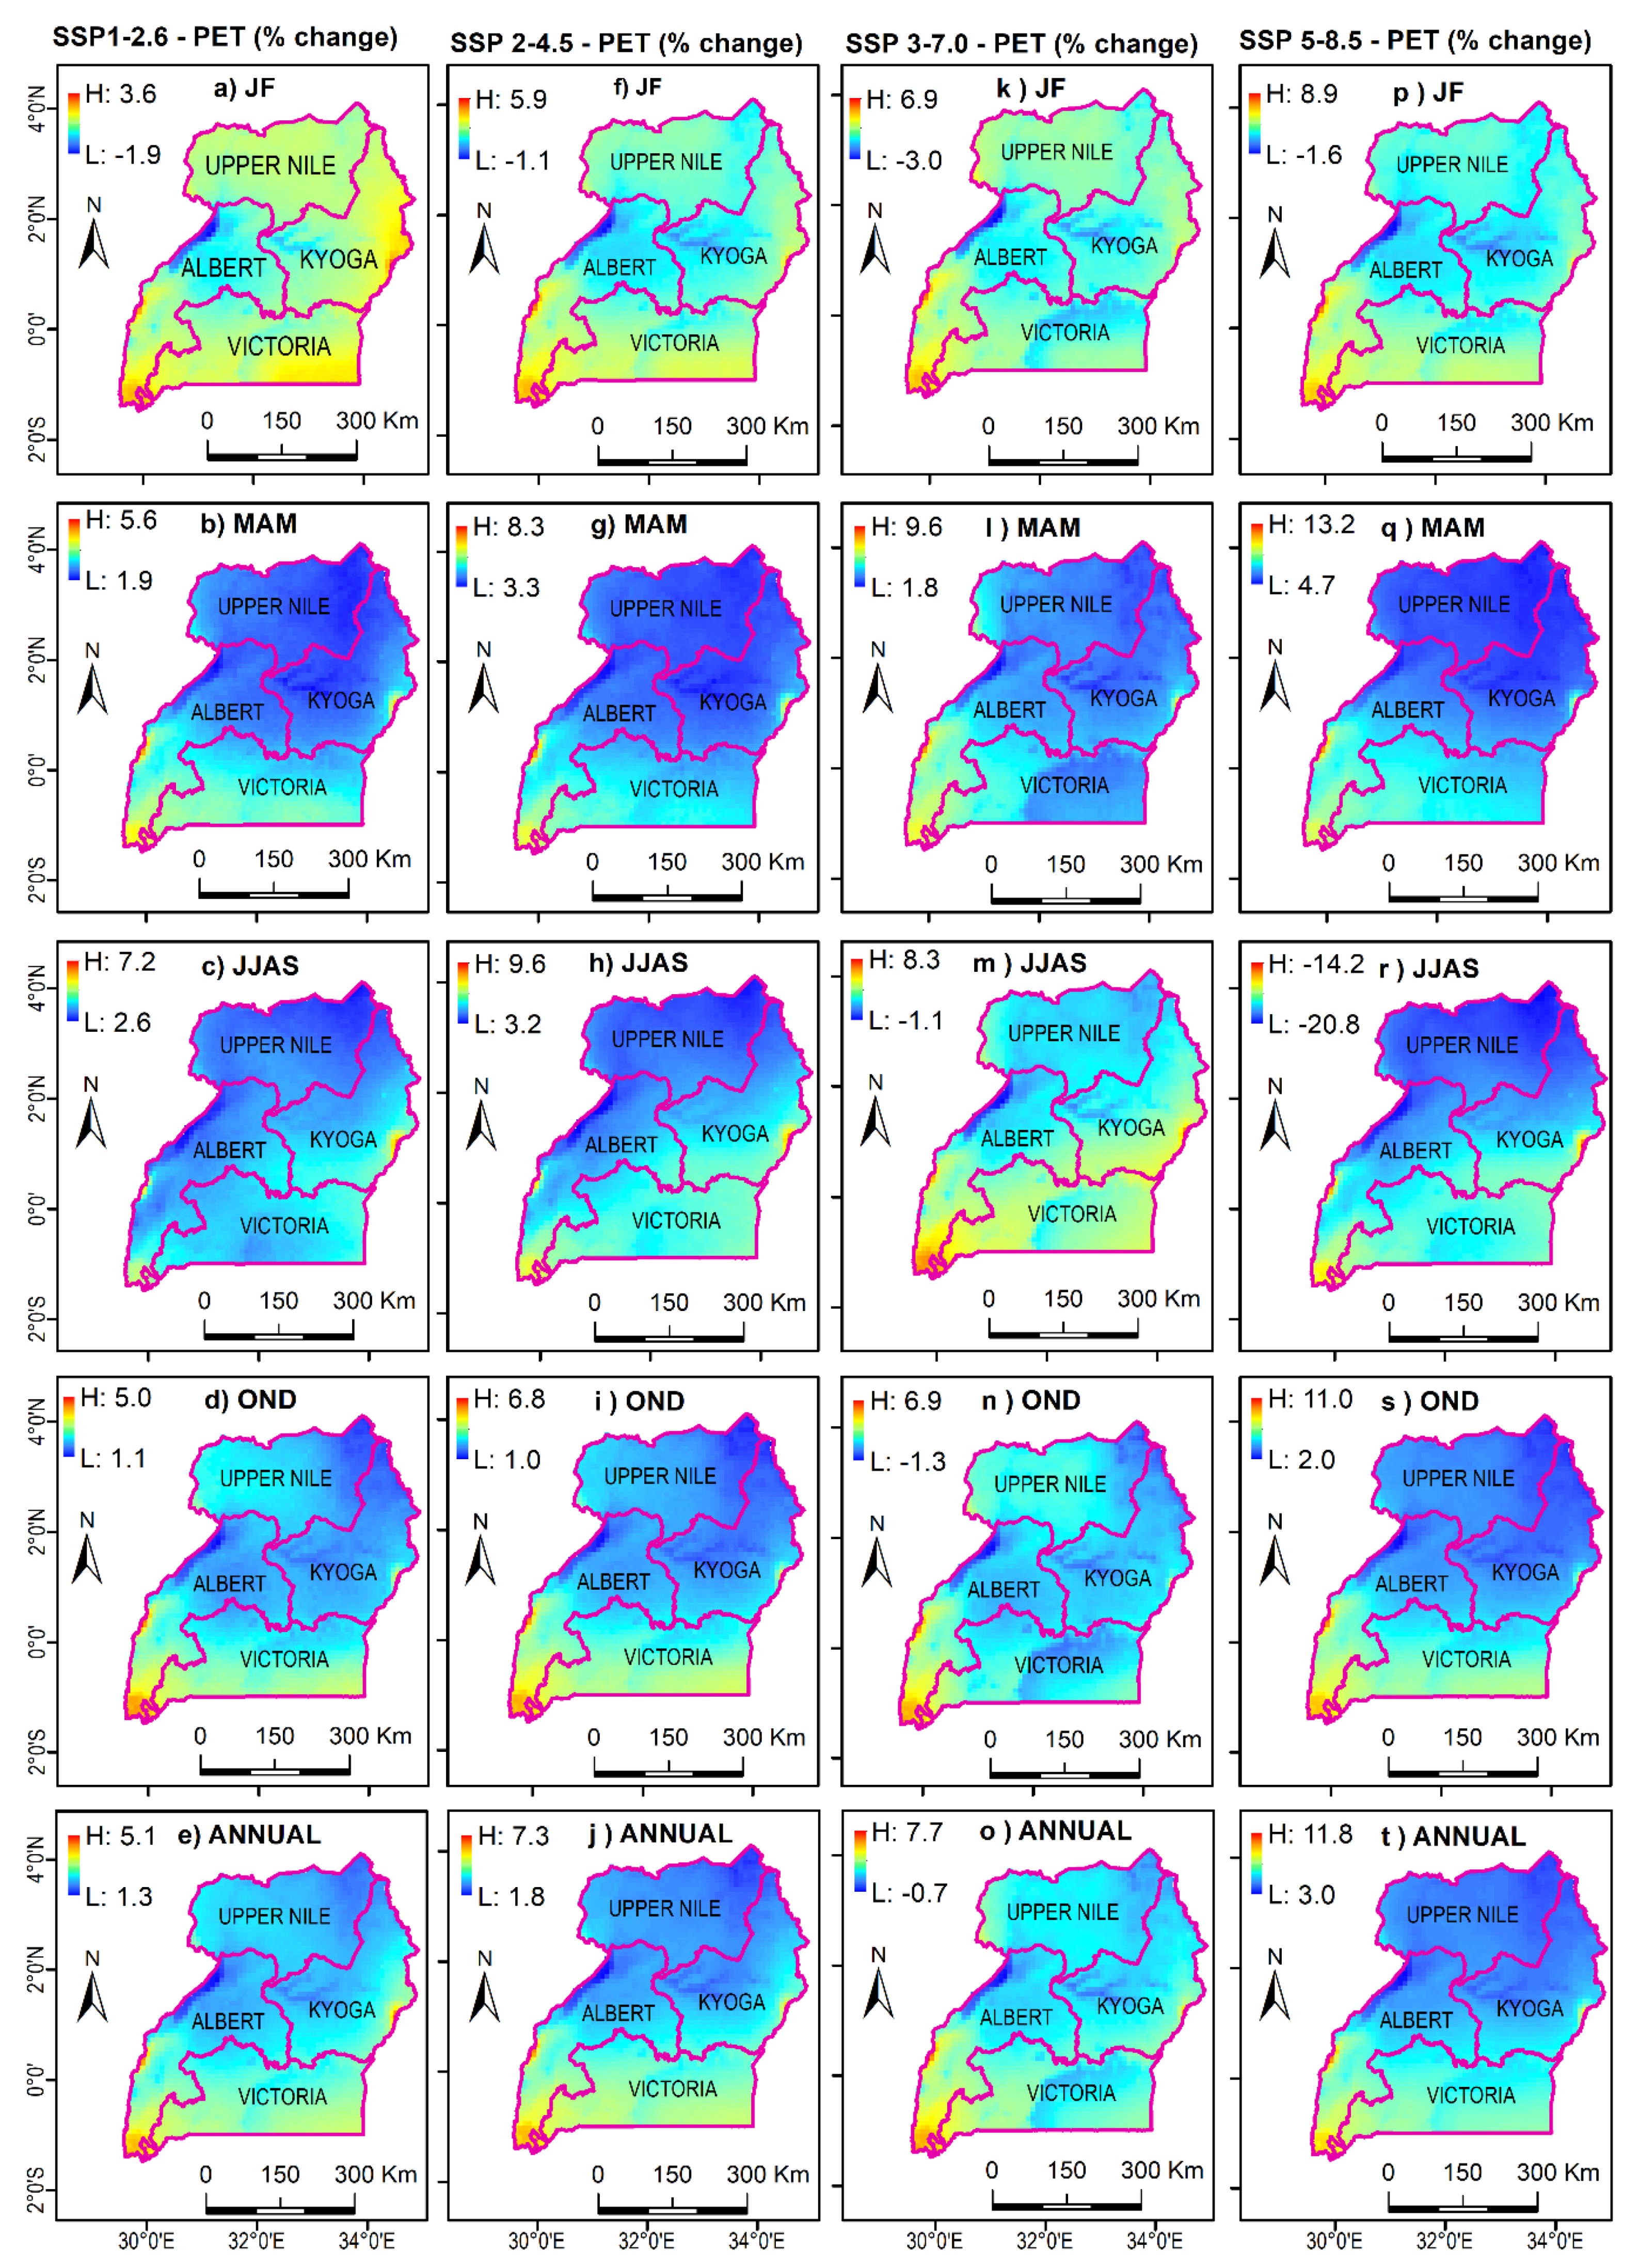
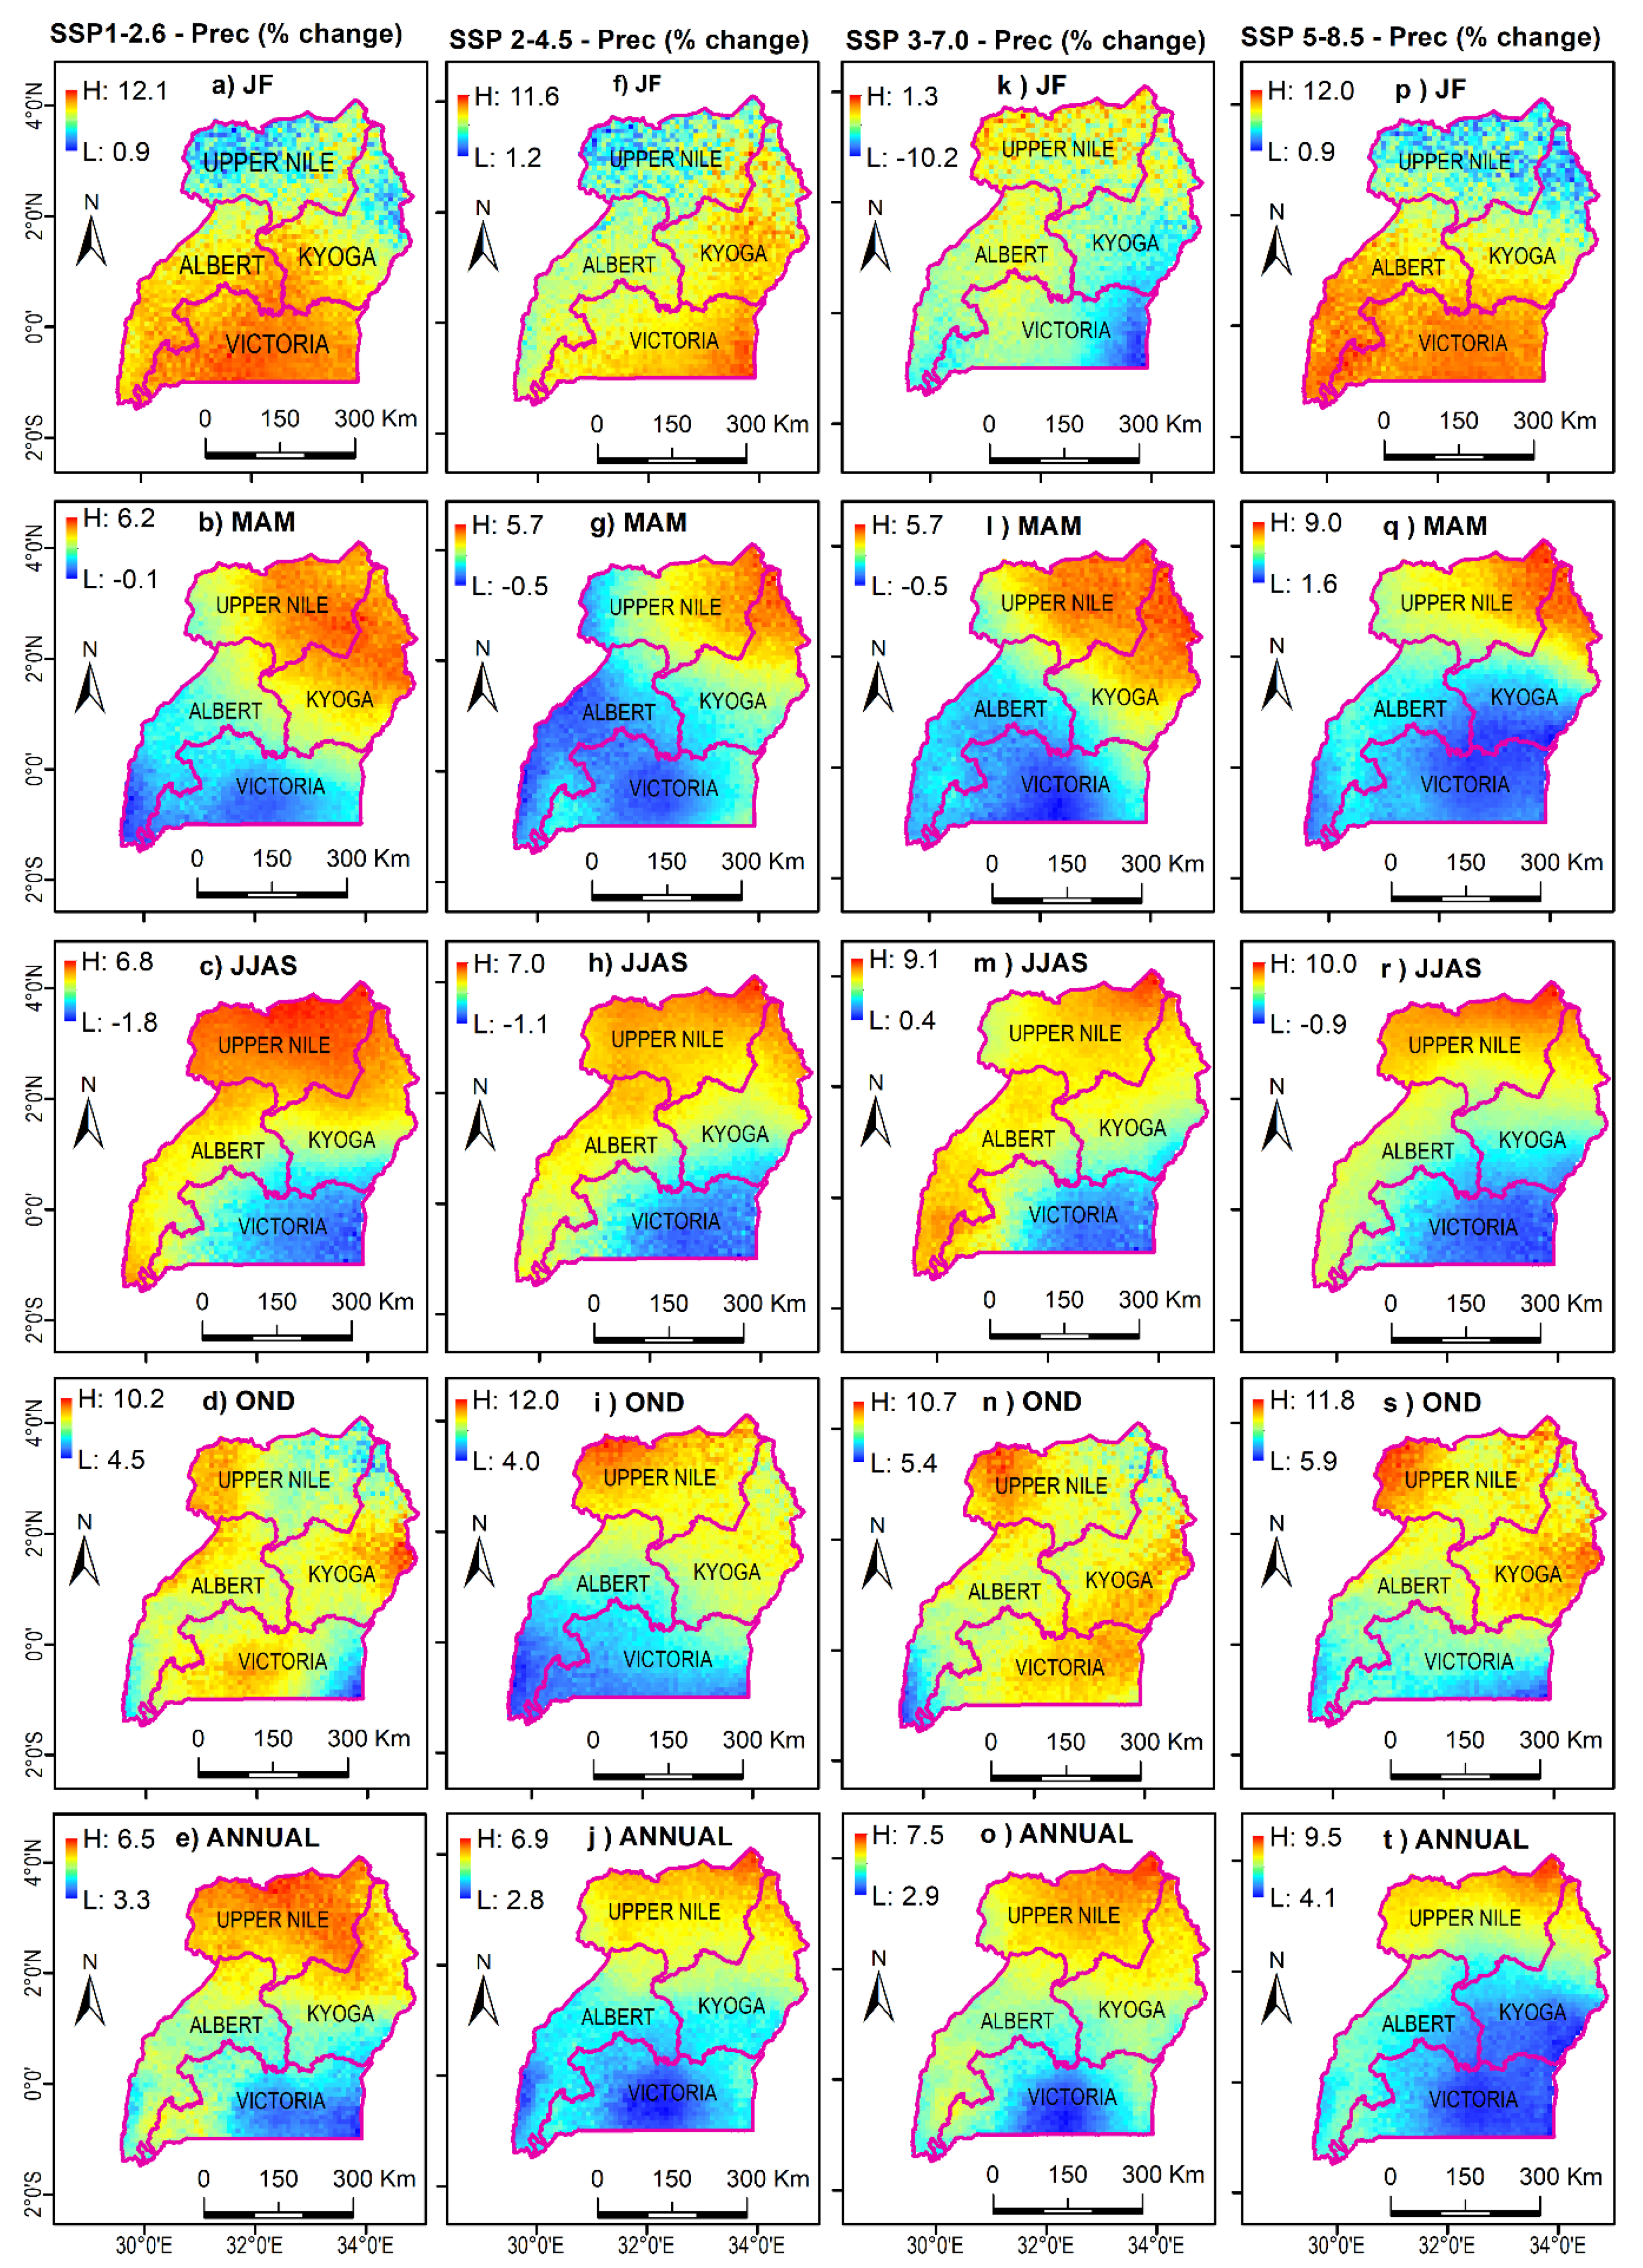
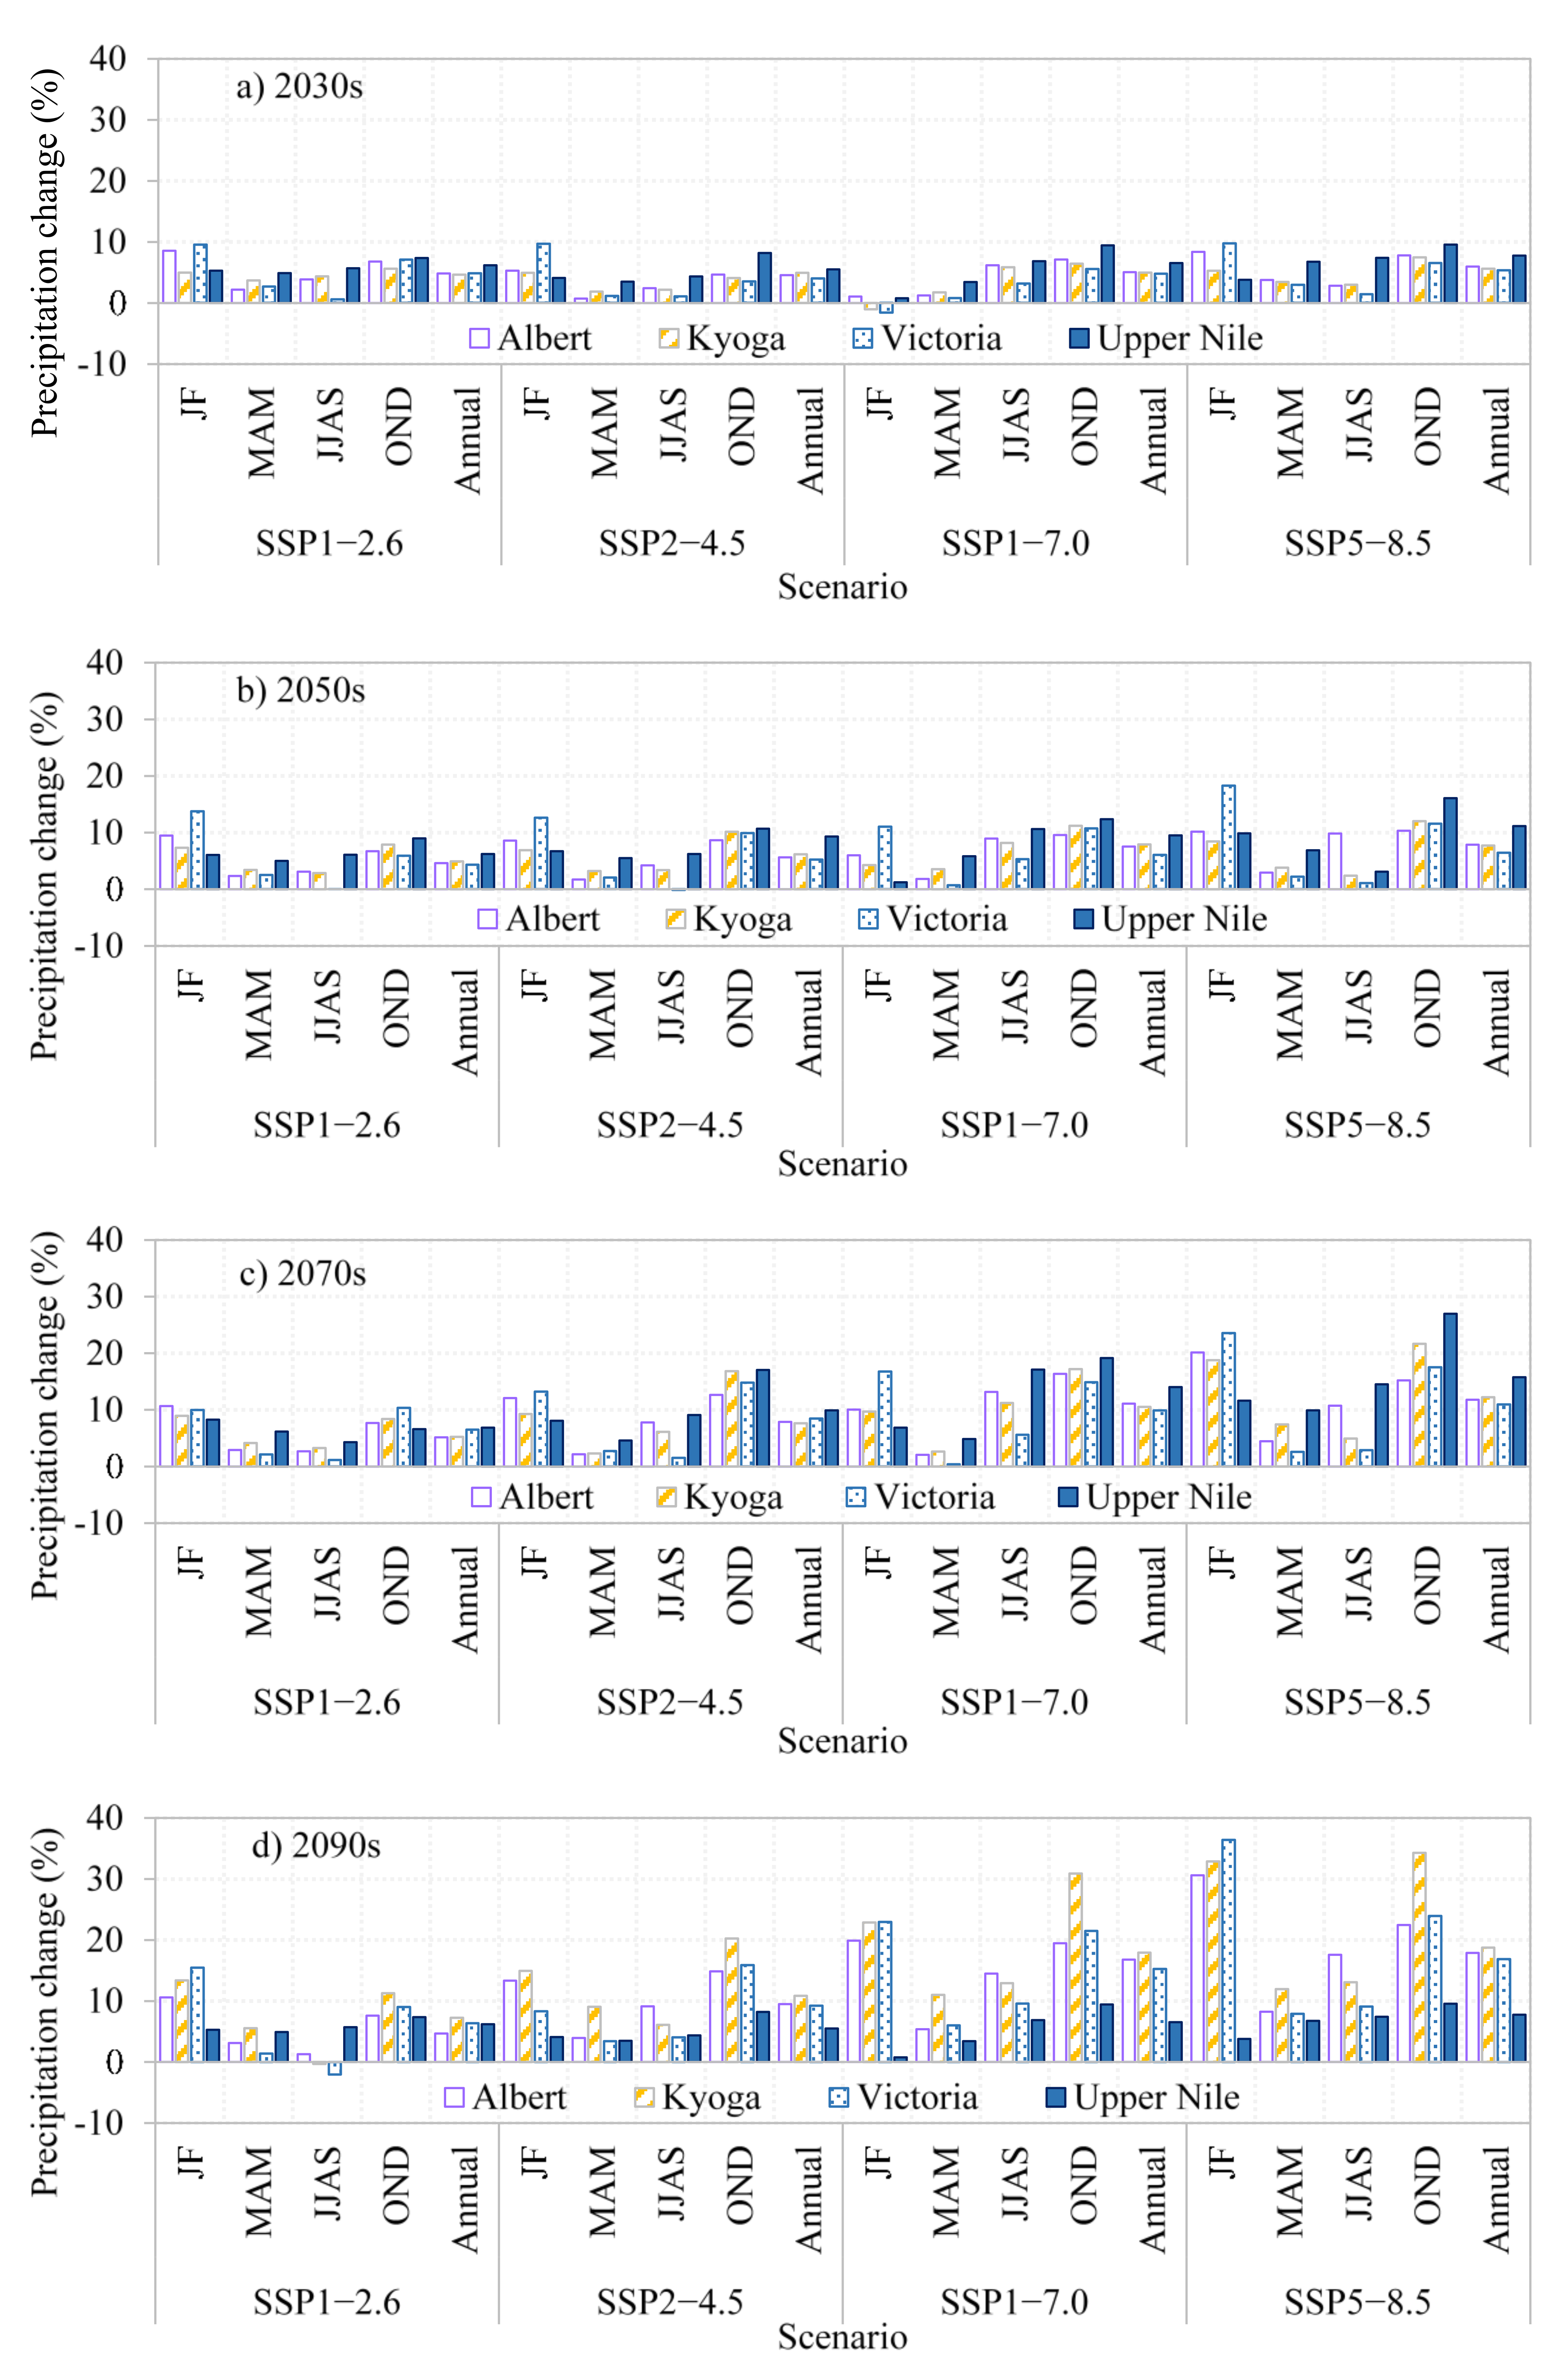
Future changes based on SSPs scenarios depict an increase in annual precipitation across all the WMZs with percentage change ranging from 2.8% to 9.5% for the 2030s. A larger change in precipitation is projected to occur towards the end of 21st century and under SSP3-7.0 and SSP5-8.5 relative to the baseline period. The projected increase for annual precipitation for the 2090s reaches 26.3% under SSP5-8.5.
iv.
Seasonal analyses show that the MAM and JJAS are projected to receive an insubstantial amount of precipitation, while JF and OND precipitation will experience an increase in most WMZs in Uganda.
v.
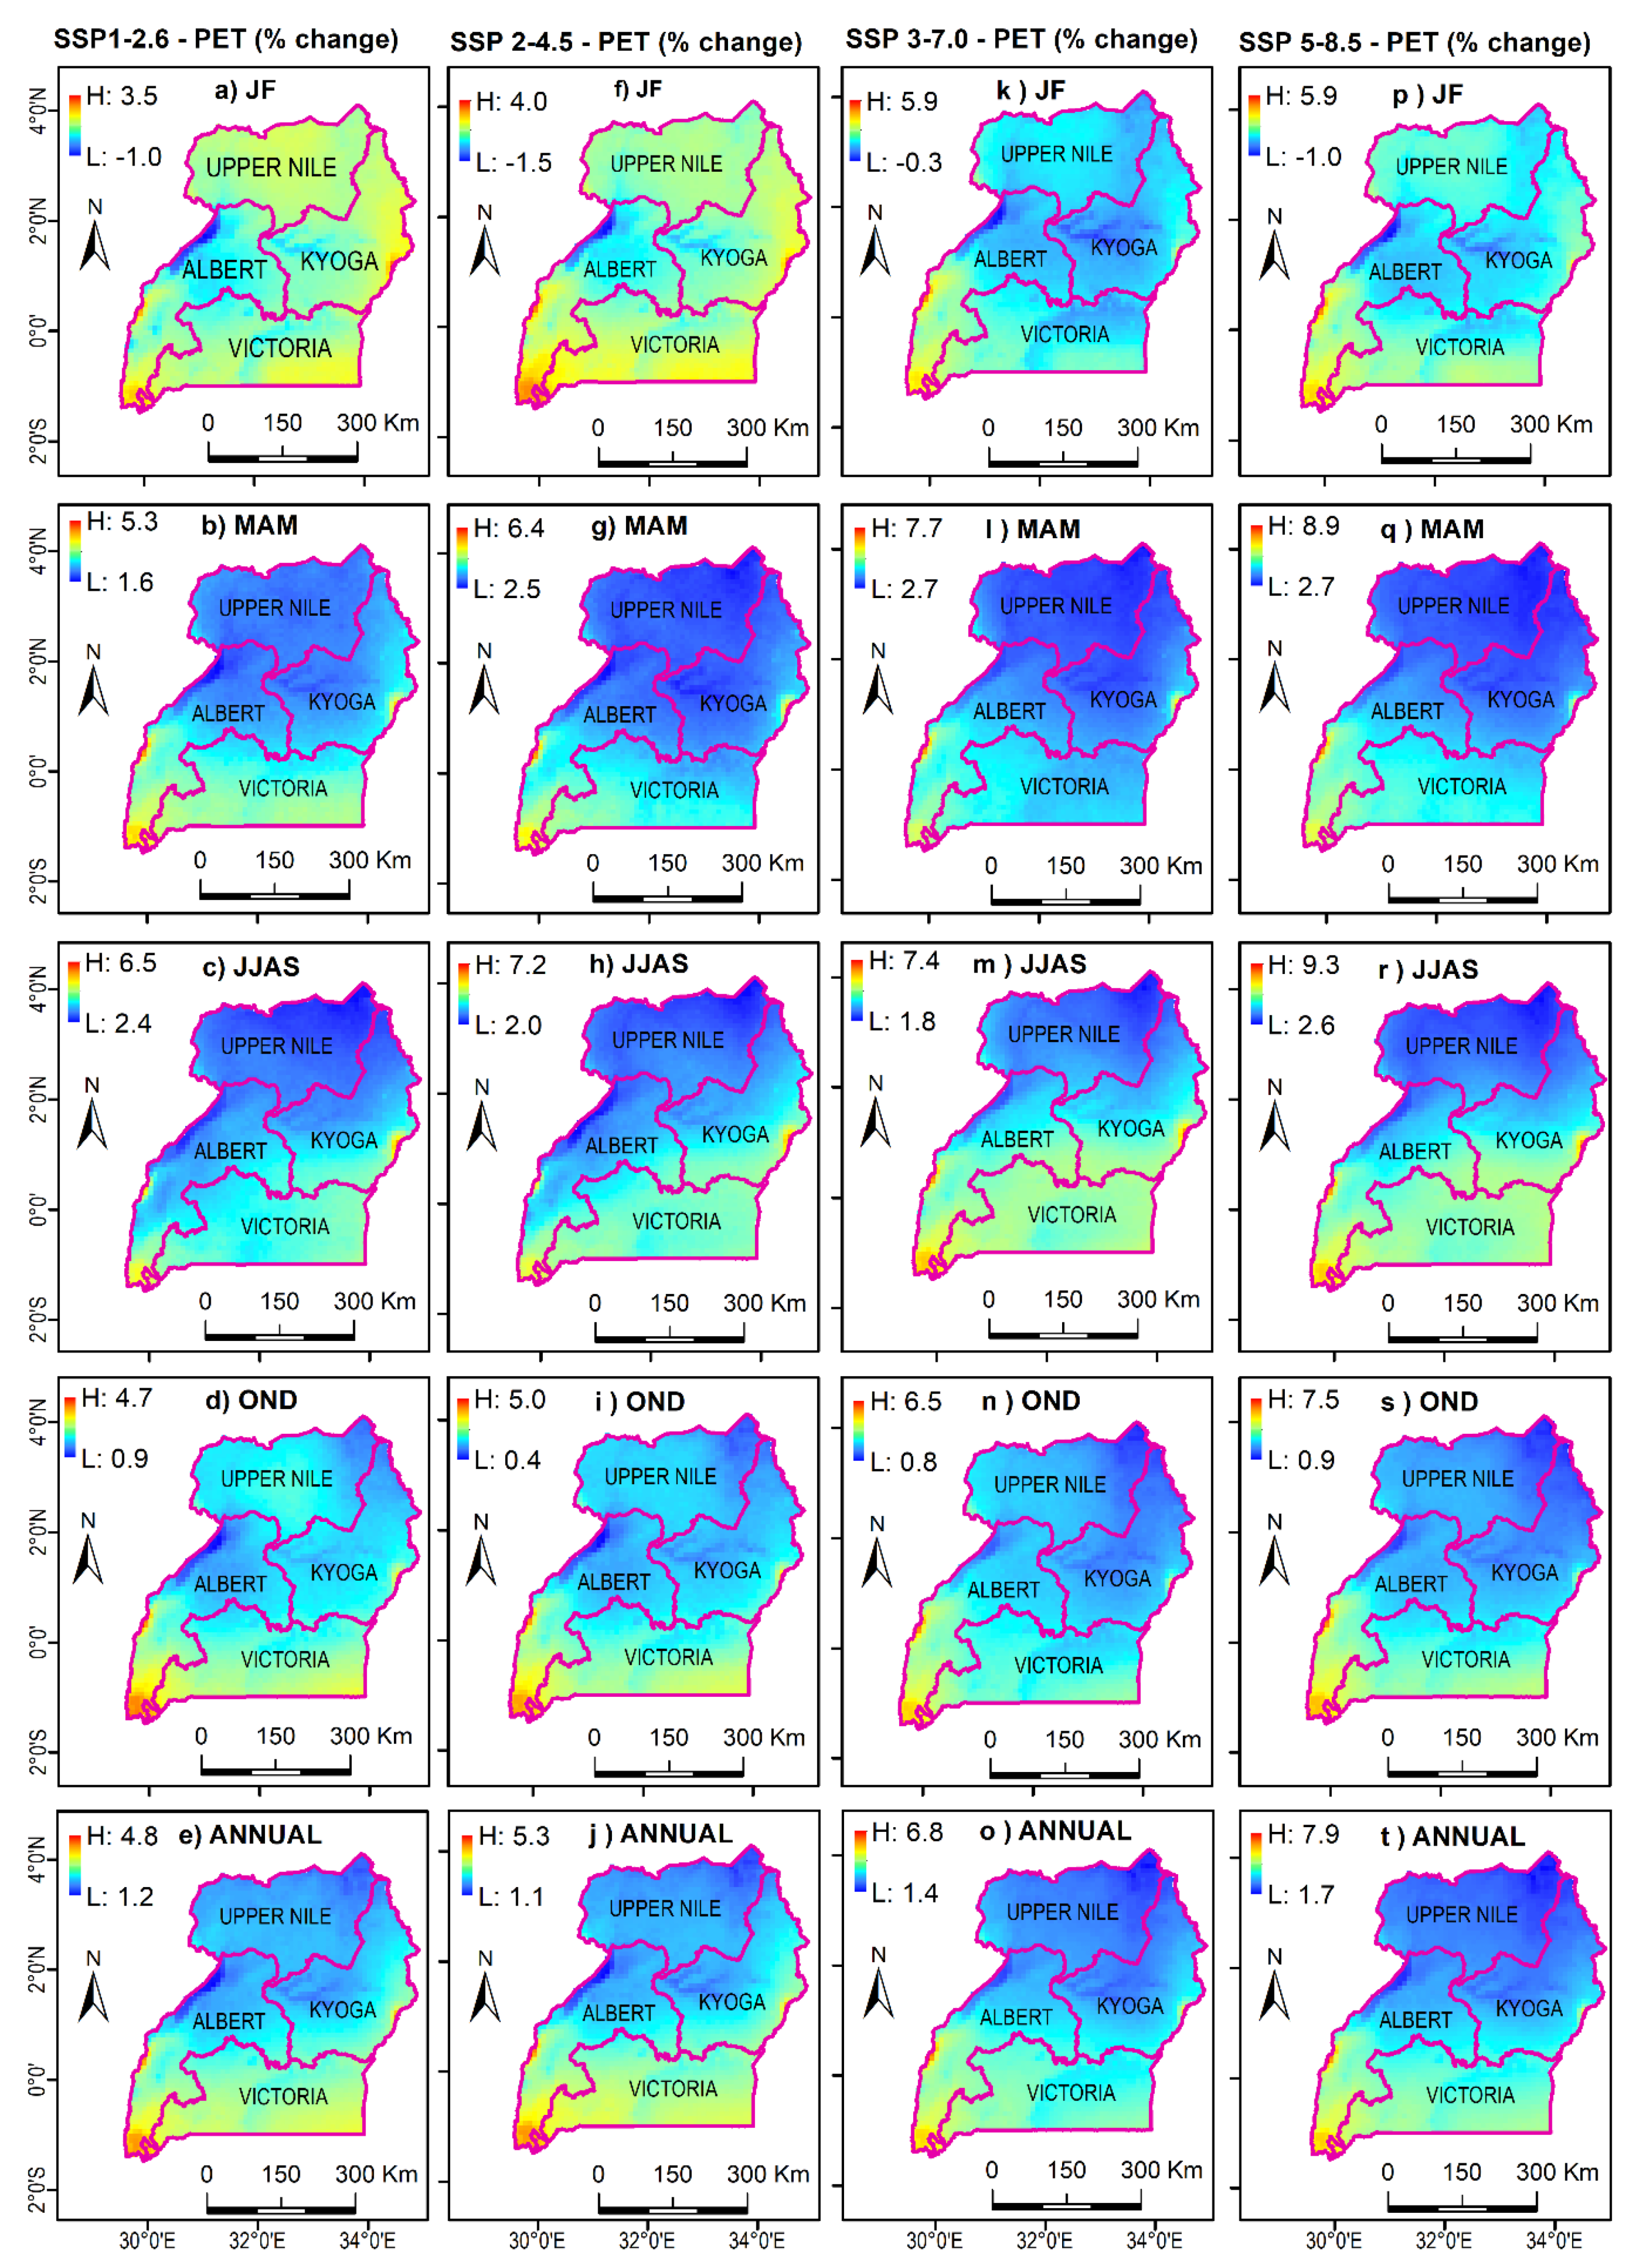
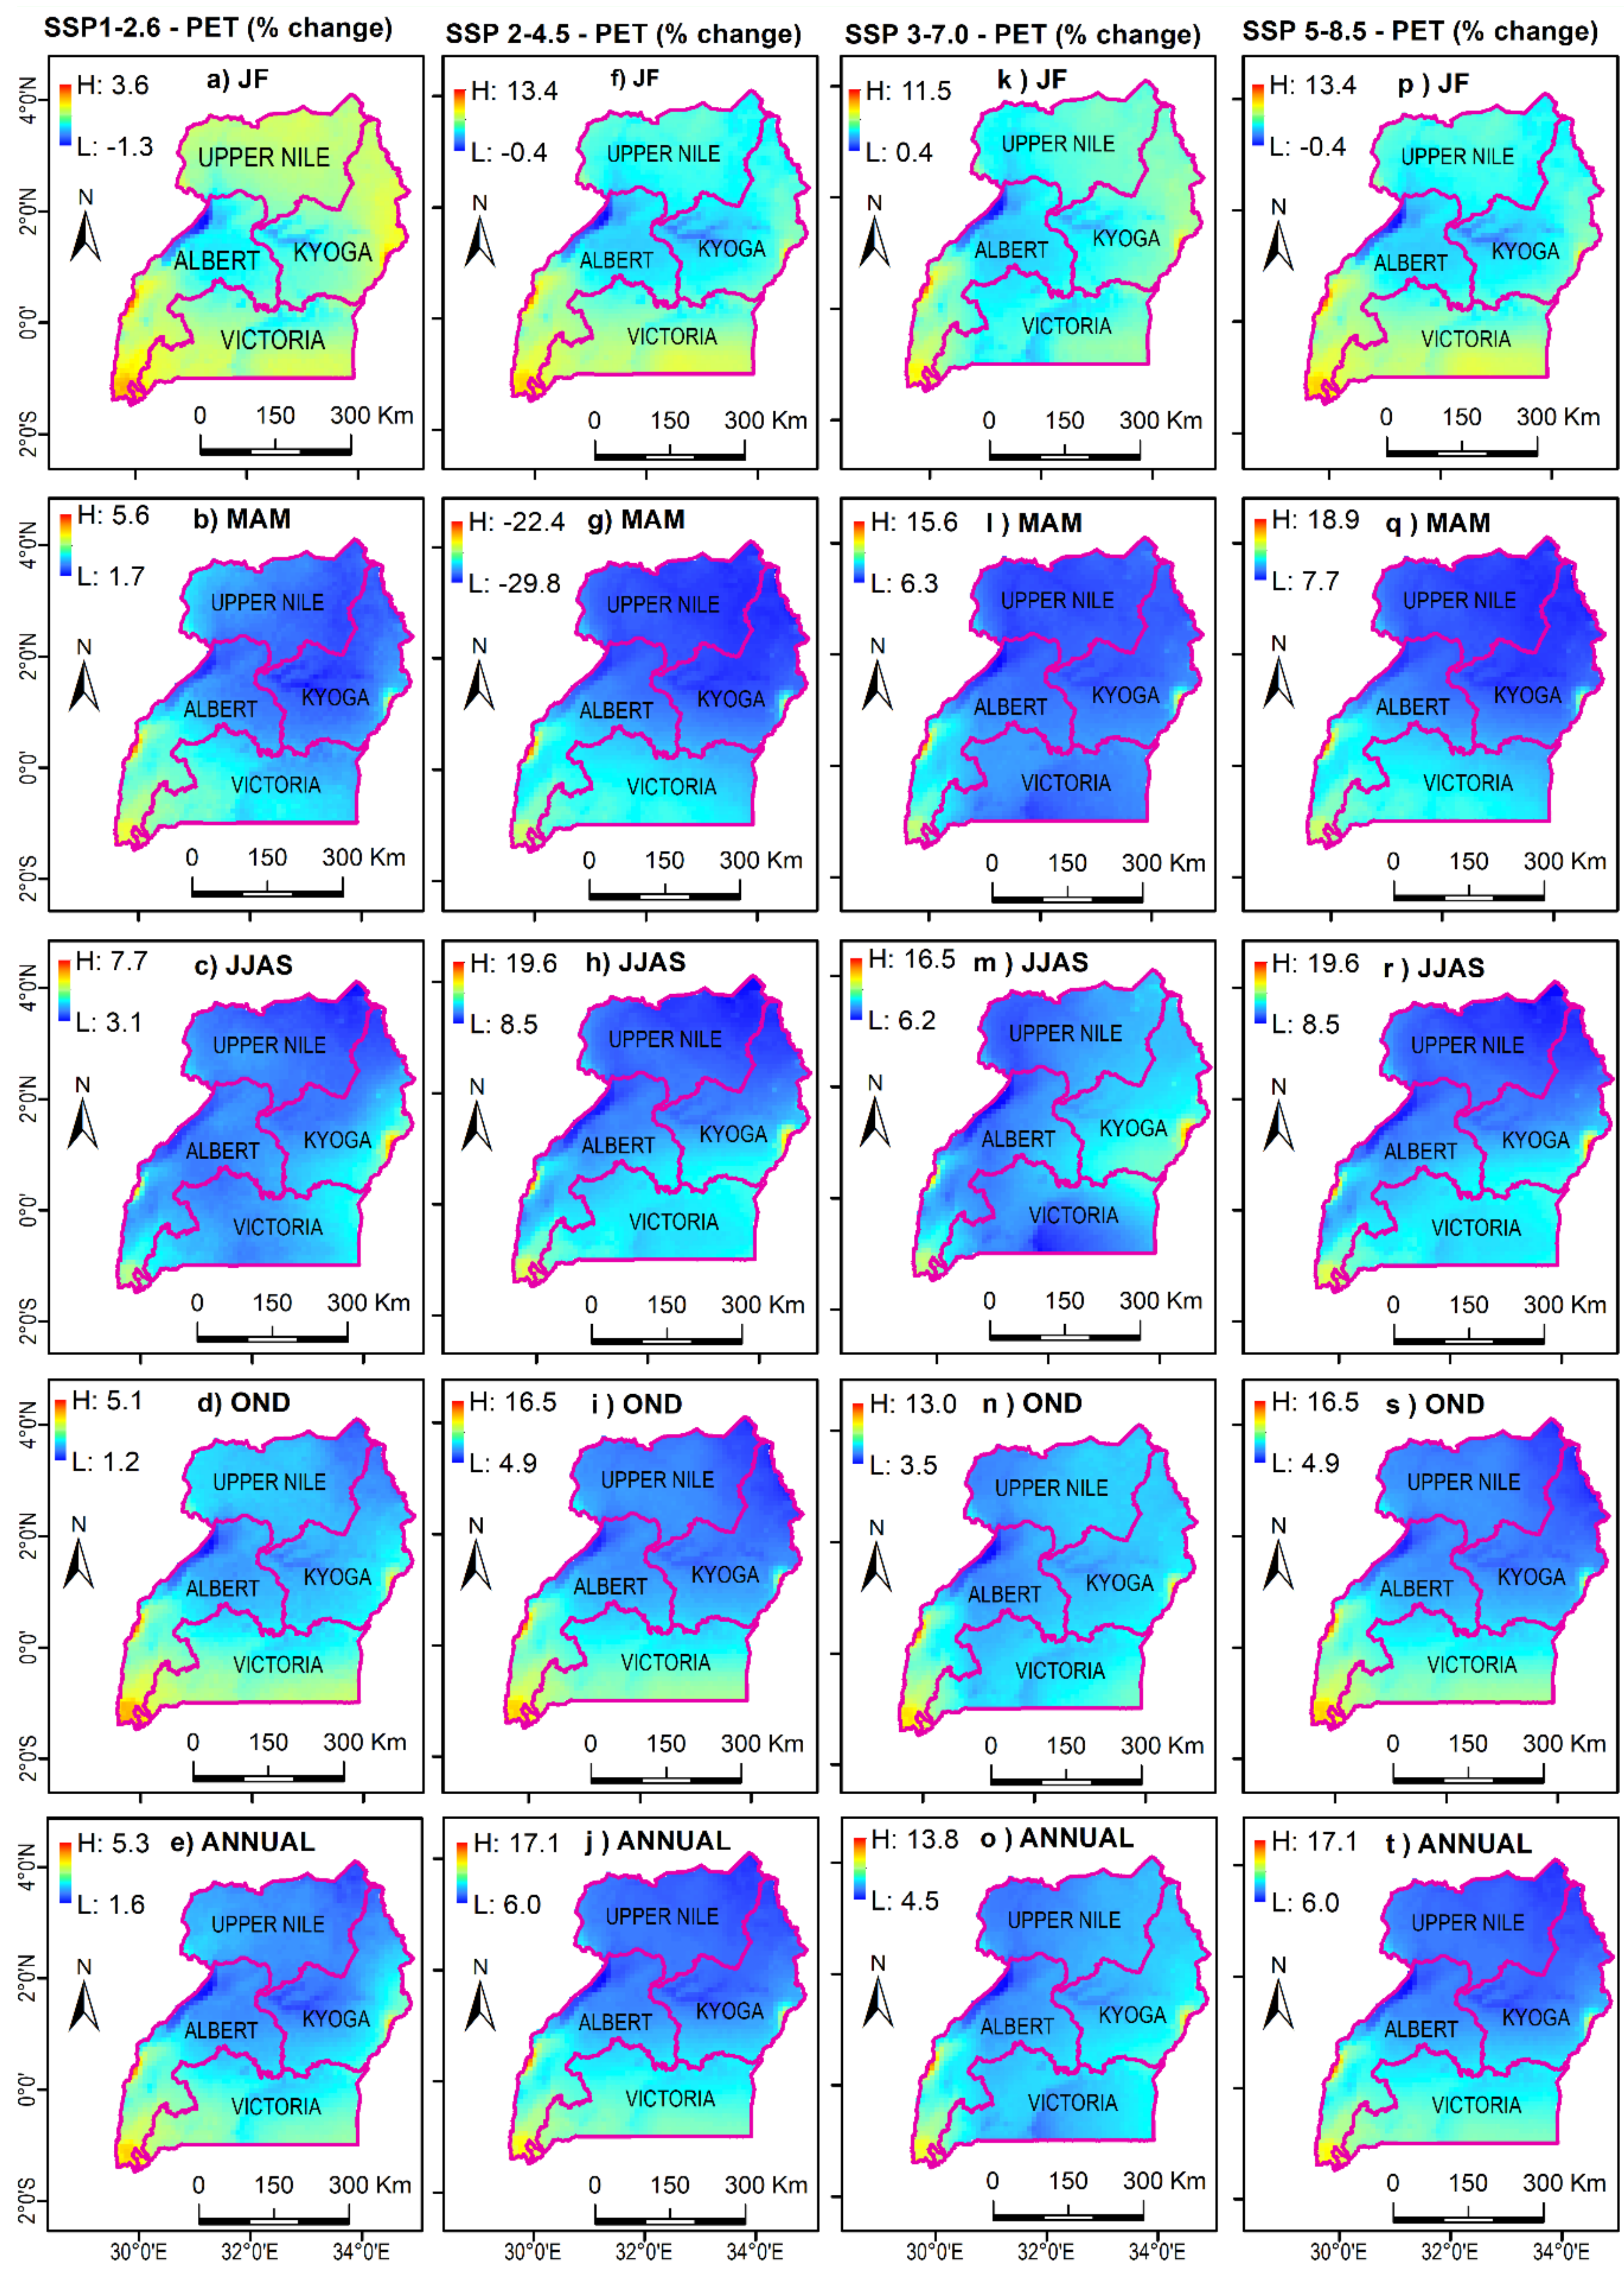
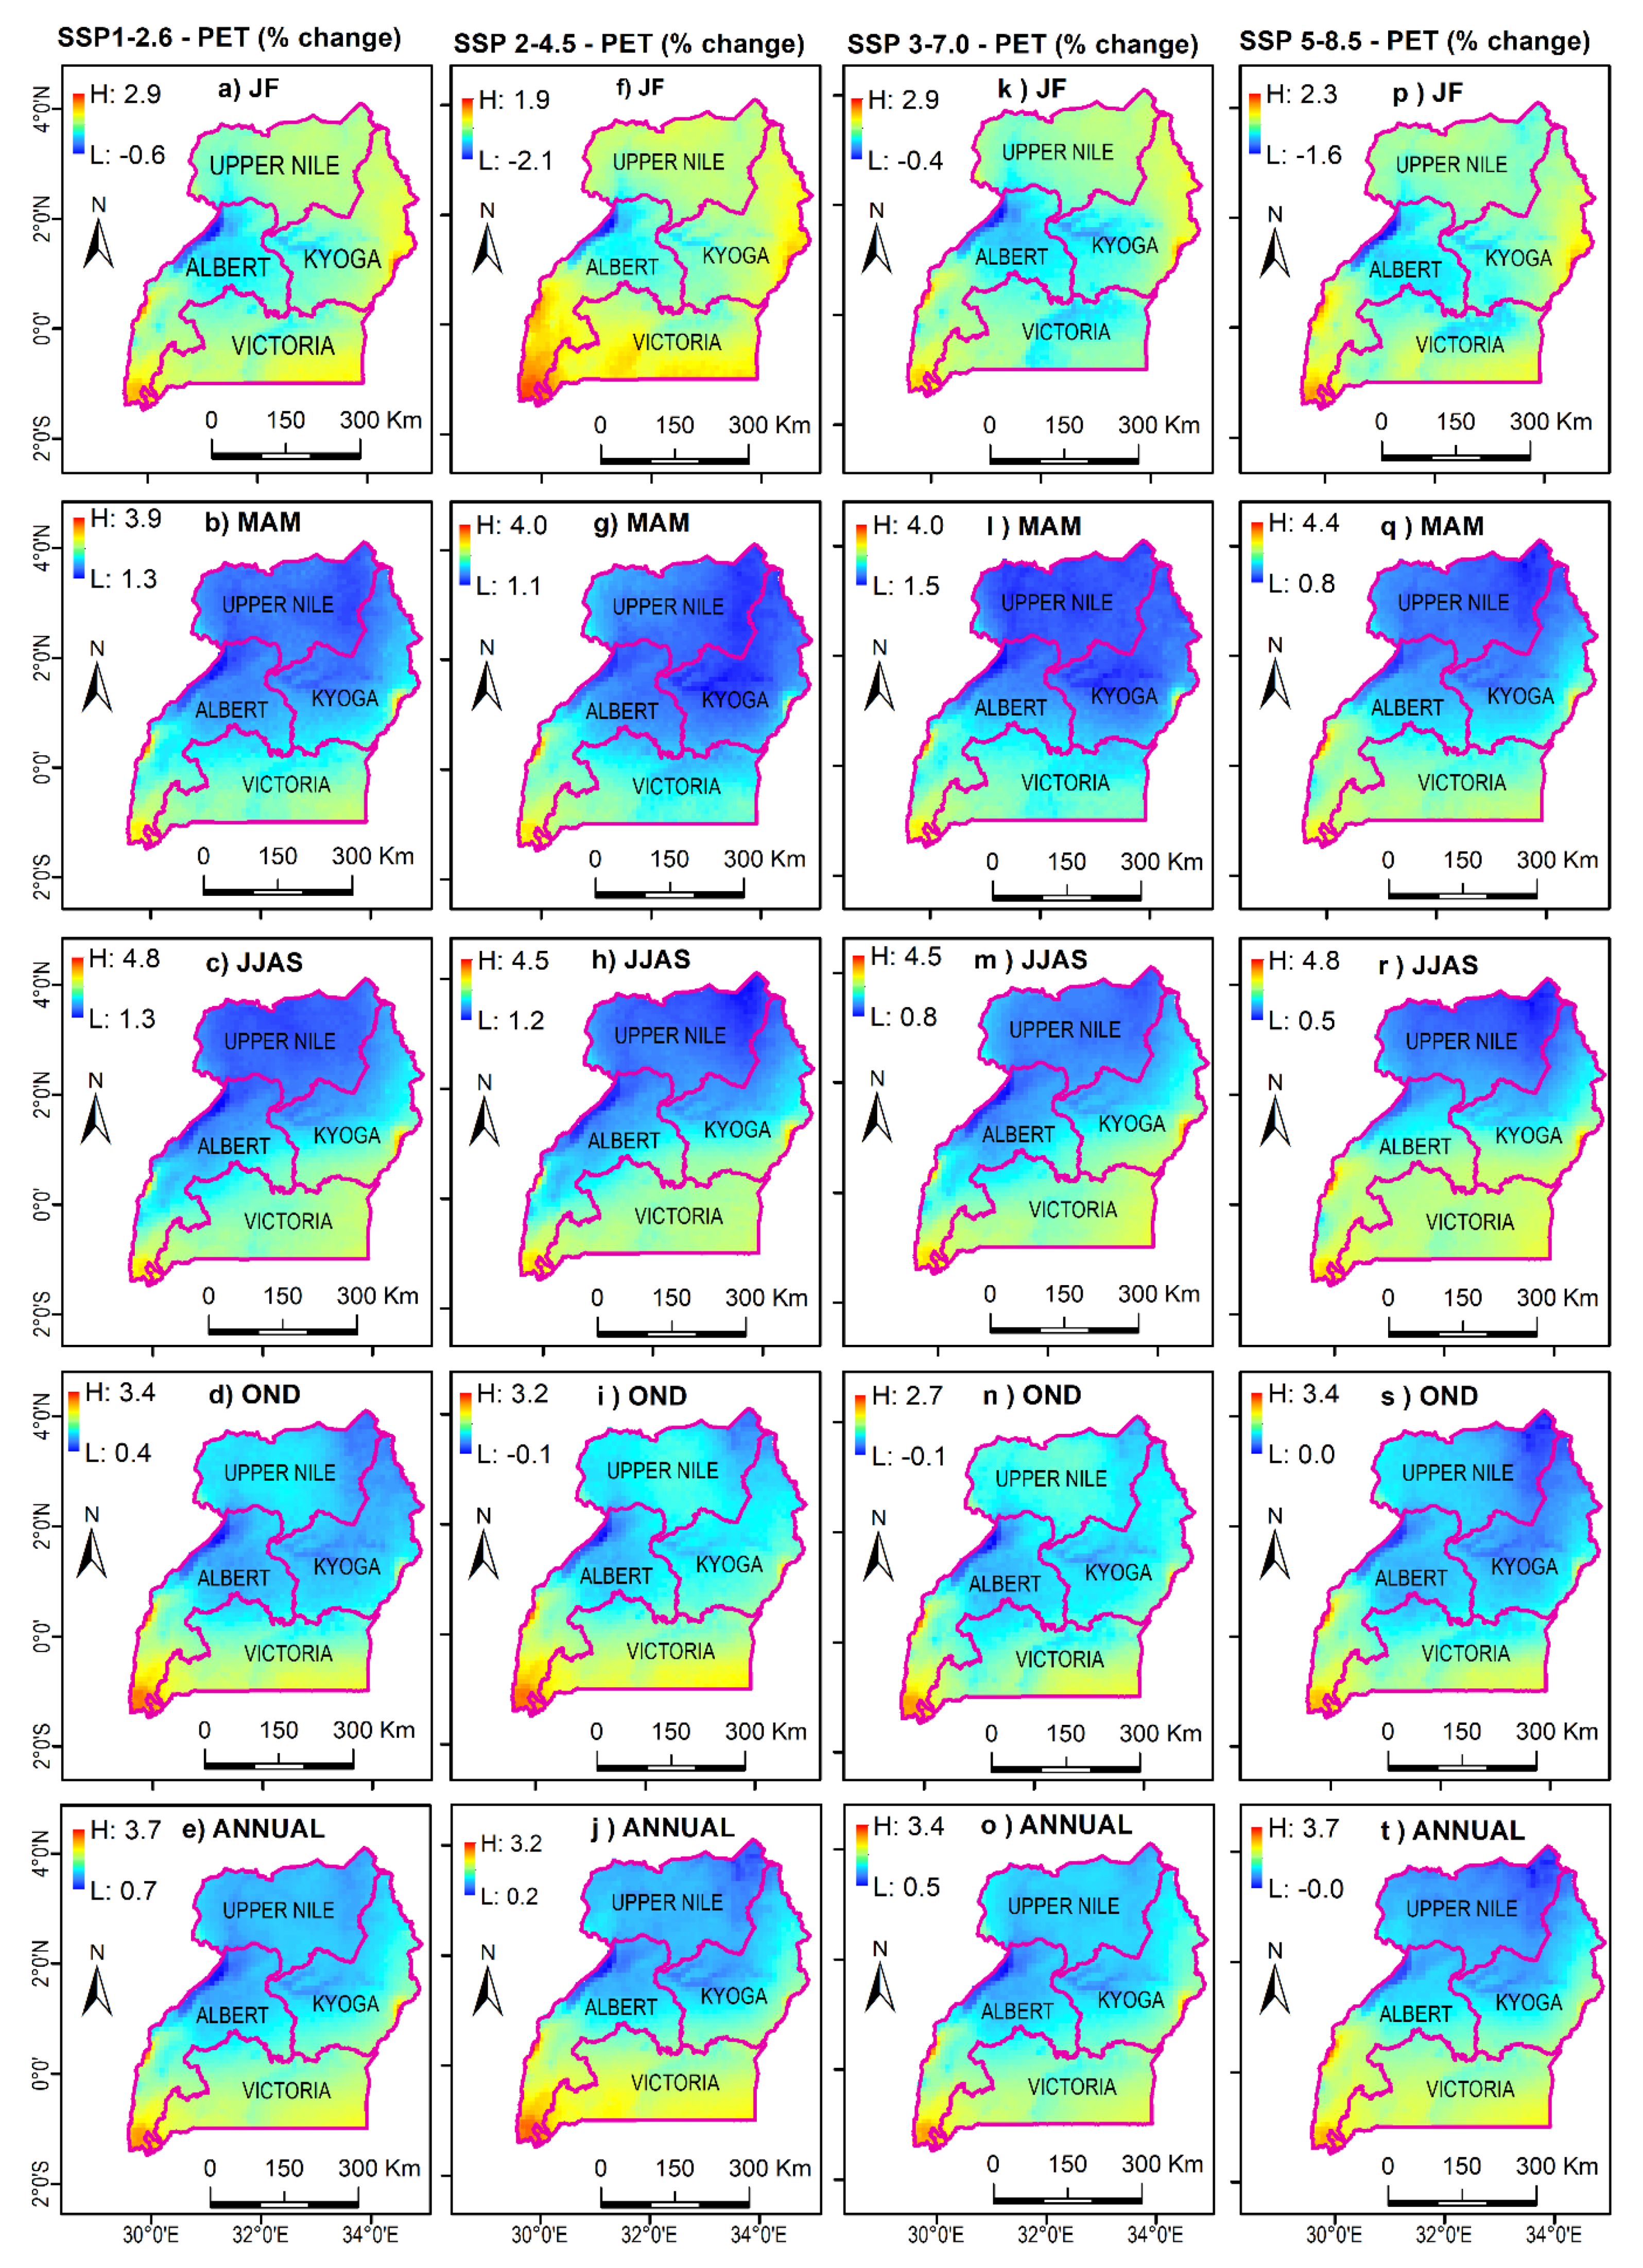
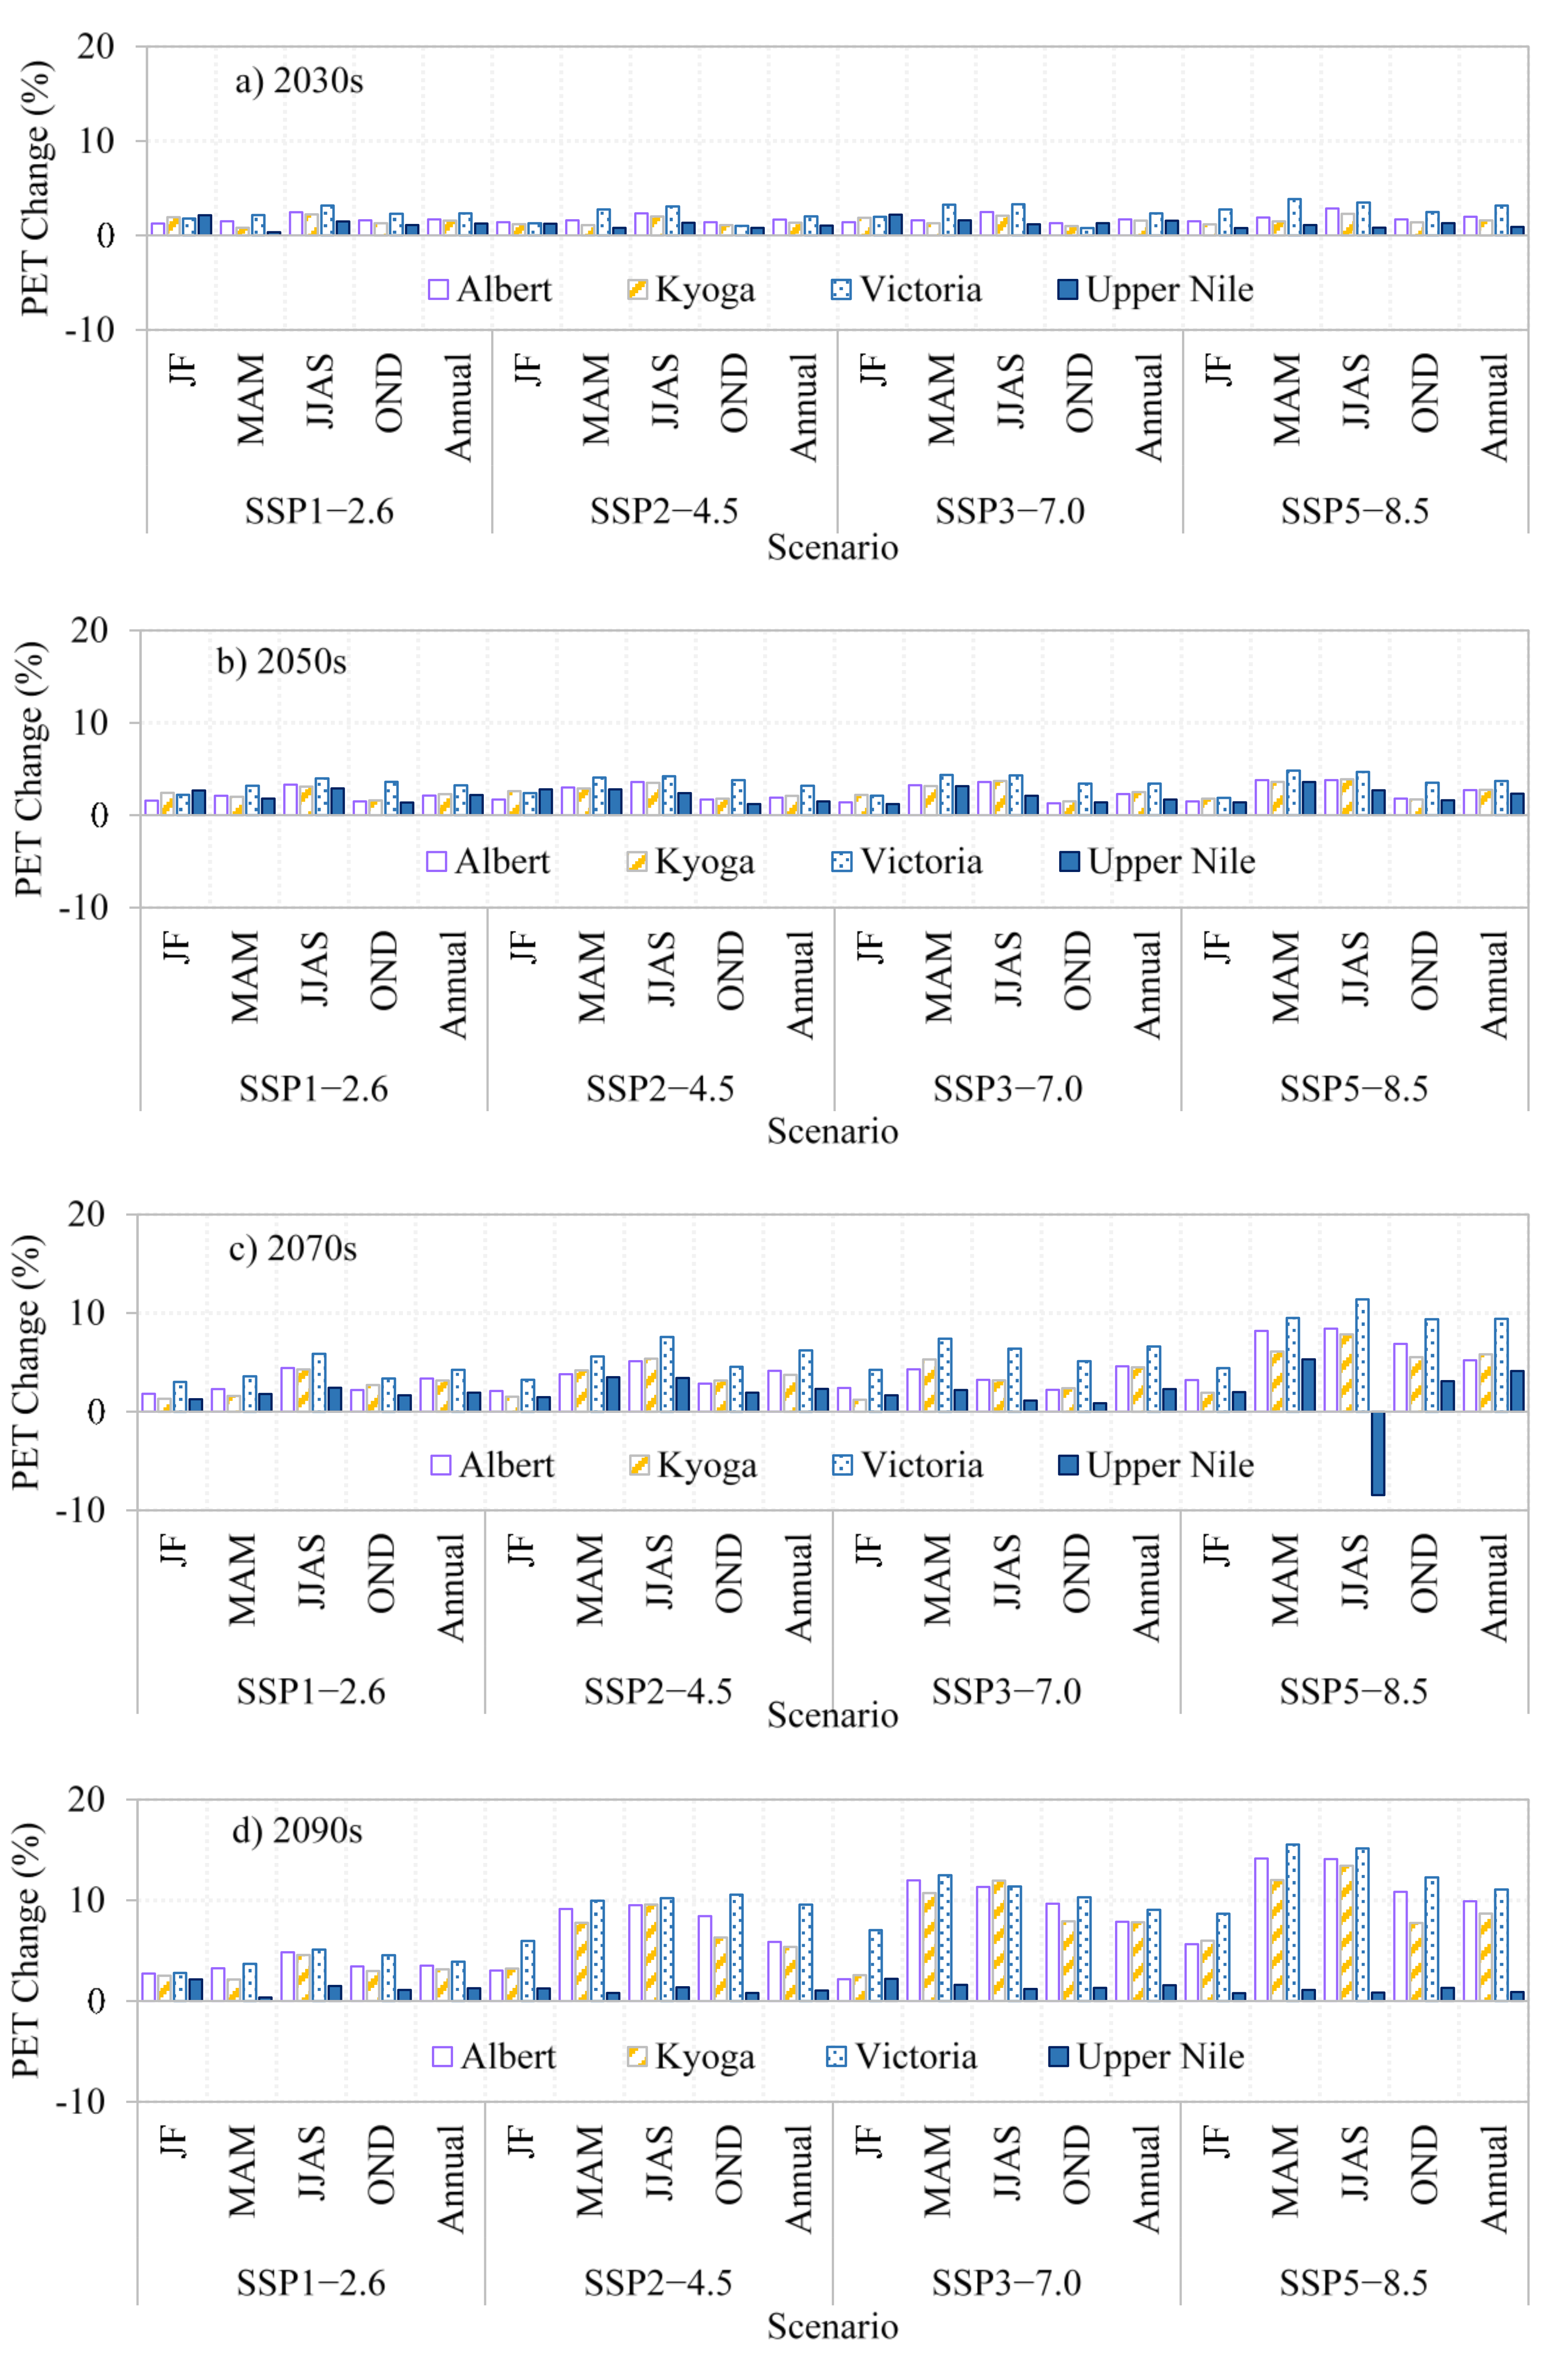
Likewise, impacts of climate change on PET demonstrate noticeable changes during the seasons, time periods, and scenarios under consideration. For instance, the largest increases in annual PET during the 2030s, 2050s, 2070s, 2090s (when all the scenarios or SSP1-2.6, SSP2-4.5, SSP3-7.0, and SSP5-8.5 are considered) will be in the ranges 1.1–4.0%, 4.8–7.9%, 5.1–11.8%, and 5.3–17.1, respectively. The lower and upper limits of these ranges in all cases were obtained under the SSP1-2.6 and SSP5-8.5, respectively.
The findings of this study highlight robust results on the future changes in key components of water balance including precipitation and PET among others. The results of this study are important to stakeholders and most especially the Directorate of Water Resources Management (DWRM) that is charged with responsibility of planning and implementing catchment-based water resources management [30]. While we used bias-corrected CMIP6 simulations to examine the future changes in precipitation and PET over WMZs across Uganda, the results should be interpreted with caution due to few limitations. Existing studies have pointed out the simulated precipitation over Uganda and the Greater Horn of Africa depends on the boundary layers, the model horizontal resolution, and the parameterization schemes [51,52,53,54]. In fact, in a recent study over East Africa [55] established that the biases in GCMs are not fully corrected to resemble observed patterns, despite the implementation of various robust statistical methods such as quantile approach. Even Regional Climate Models (RCMs) which are of spatially finer resolution than the GCMs were found to be largely biased in reproducing the East African climatology [56]. Conclusively, the use of a bottom-up, resource-based vulnerability technique [57] should be adopted in dealing with complexities of climate variables such as precipitation and PET in the wake of global warming and climate change. Moreover, the skills with which models reproduce observed climate give it the confidence to be employed for future projections due to the inherent uncertainties in the models [58,59]. Recent studies over the study region that evaluated CMIP6 noted various challenges of the latest phase six models in skilfully reproducing the climate [53,60]. The future projections for the region are also subject to a large model uncertainty [61]. Such uncertainties call for future studies over Uganda to incorporate the model weighting schemes such as climate model weighting by independence and performance (ClimWIP; [62] or reliability ensemble averaging REA; [63]).

Author Contributions

Conceptualization, C.O. and A.A.; methodology, C.O. and A.A.; validation, C.O. and A.A.; formal analysis, C.O., A.A., B.A., H.N., V.O. and H.T.; investigation, C.O. and A.A.; data curation, C.O. and A.A.; writing—review and editing, C.O., A.A, B.A., H.N., V.O. and H.T.; supervision, C.O. All authors have read and agreed to the published version of the manuscript.

Funding

This research received no external funding.

Institutional Review Board Statement

Not applicable.

Informed Consent Statement

Not applicable.

Data Availability Statement

WorldClim version 2.1 climate data are available at https://www.worldclim.org/data/worldclim21.html (accessed on 10 January 2020). The CMIP6 downscaled simulations can be obtained from https://www.worldclim.org/ (accessed on 10 January 2020).

Acknowledgments

The authors acknowledge that this paper was to some extent based on a Master of Science dissertation of Asiimwe (Asiimwe, [64]) entitled “Climate change impacts on precipitation and potential evapotranspiration across water management zones in Uganda.” under the supervision of Charles Onyutha.

Conflicts of Interest

The authors declare no conflict of interest.

Appendix A. Precipitation Changes in the 2050s, 2070s, and 2090s

Figure A1. Percentage change in precipitation over the period 2041–2060.
Atmosphere 12 00887 g0a1
Figure A2. Percentage change in precipitation over the period 2061–2080.
Atmosphere 12 00887 g0a2
Figure A3. Percentage change in precipitation over the period 2081–2100.
Atmosphere 12 00887 g0a3

Appendix B. PET Changes in the 2050s, 2070s, and 2090s

Figure A4. Percentage change in PET over the period 2041–2060.
Atmosphere 12 00887 g0a4
Figure A5. Percentage change in PET over the period 2061–2080.
Atmosphere 12 00887 g0a5
Figure A6. Percentage change in PET over the period 2081–2100.
Atmosphere 12 00887 g0a6

References

  1. Bates, B.C.; Kundzewicz, Z.W.; Wu, S.; Palutikof, J.P. Climate Change and Water—IPCC. 2008. Available online: https://www.ipcc.ch/publication/climate-change-and-water-2/ (accessed on 10 October 2020).
  2. United Nation (UN)—Water. United Nations World Water Annual Report 2015. Spotlight on 2015: A New Sustainable Development Agenda and a Global Goal for Water and Sanitation. 2015. Available online: https://www.unwater.org/publications/un-water-annual-report-2015/ (accessed on 12 April 2021).
  3. IPCC. Global Warming of 1.5° C: An IPCC Special Report on the Impacts of Global Warming of 1.5° C Above Pre-Industrial Levels and Related Global Greenhouse Gas Emission Pathways, in the Context of Strengthening the Global Response to the Threat of Climate Change, Sustainable Development, and Efforts to Eradicate Poverty; Intergovernmental Panel on Climate Change: Geneva, Switzerland, 2018; Available online: https://www.ipcc.ch/sr15/download/ (accessed on 15 May 2021).
  4. Shongwe, M.E.; Van Oldenborgh, G.J.; van den Hurk, B.; Van Aalst, M. Projected Changes in Mean and Extreme Precipitation in Africa under Global Warming. Part II: East Africa. J. Clim. 2011, 24, 3718–3733. [Google Scholar] [CrossRef] [Green Version]
  5. United Nation (UN)—Water. United Nations World Water Development Report 2020: Water and Climate Change; UNESCO: Paris, France, 2020; Available online: https://en.unesco.org/themes/water-security/wwap/wwdr/2020 (accessed on 12 February 2021).
  6. Green, D. The spatial distribution of extreme climate events, another climate inequity for the world’s most vulnerable people. Environ. Res. Lett. 2016, 11, 091002. [Google Scholar] [CrossRef]
  7. Bathiany, S.; Dakos, V.; Scheffer, M.; Lenton, T.M. Climate models predict increasing temperature variability in poor countries. Sci. Adv. 2018, 4, eaar5809. [Google Scholar] [CrossRef] [PubMed] [Green Version]
  8. Onyutha, C.; Tabari, H.; Rutkowska, A.; Nyeko-Ogiramoi, P.; Willems, P. Comparison of different statistical downscaling methods for climate change rainfall projections over the Lake Victoria basin considering CMIP3 and CMIP5. J. Hydro-Environ. Res. 2016, 12, 31–45. [Google Scholar] [CrossRef]
  9. Greve, P.; Seneviratne, S.I. Assessment of future changes in water availability and aridity. Geophys. Res. Lett. 2015, 42, 5493–5499. [Google Scholar] [CrossRef] [PubMed] [Green Version]
  10. Tabari, H.; Taye, M.T.; Willems, P. Water availability change in central Belgium for the late 21st century. Glob. Planet. Chang. 2015, 131, 115–123. [Google Scholar] [CrossRef]
  11. Konapala, G.; Mishra, A.K.; Wada, Y.; Mann, M.E. Climate change will affect global water availability through compounding changes in seasonal precipitation and evaporation. Nat. Commun. 2020, 11, 1–10. [Google Scholar] [CrossRef] [PubMed]
  12. Zhou, S.; Williams, A.P.; Lintner, B.R.; Berg, A.M.; Zhang, Y.; Keenan, T.F.; Cook, B.I.; Hagemann, S.; Seneviratne, S.I.; Gentine, P. Soil moisture–atmosphere feedbacks mitigate declining water availability in drylands. Nat. Clim. Chang. 2021, 11, 38–44. [Google Scholar] [CrossRef]
  13. Tabari, H.; Aghajanloo, M.-B. Temporal pattern of aridity index in Iran with considering precipitation and evapotranspiration trends. Int. J. Clim. 2013, 33, 396–409. [Google Scholar] [CrossRef]
  14. Greve, P.; Roderick, M.L.; Ukkola, A.M.; Wada, Y. The aridity index under global warming. Environ. Res. Lett. 2019, 14, 124006. [Google Scholar] [CrossRef] [Green Version]
  15. Tabari, H. Climate change impact on flood and extreme precipitation increases with water availability. Sci. Rep. 2020, 10, 1–10. [Google Scholar] [CrossRef]
  16. Ngoma, H.; Wen, W.; Ojara, M.; Ayugi, B. Assessing current and future spatiotemporal precipitation variability and trends over Uganda, East Africa, based on CHIRPS and regional climate model datasets. Theor. Appl. Clim. 2021, 133, 823–843. [Google Scholar] [CrossRef]
  17. Ongoma, V.; Chen, H.; Gao, C. Projected changes in mean rainfall and temperature over East Africa based on CMIP5 models. Int. J. Clim. 2018, 38, 1375–1392. [Google Scholar] [CrossRef]
  18. Sridharan, V.; Ramos, E.P.; Zepeda, E.; Boehlert, B.; Shivakumar, A.; Taliotis, C.; Howells, M. The Impact of Climate Change on Crop Production in Uganda—An Integrated Systems Assessment with Water and Energy Implications. Water 2019, 11, 1805. [Google Scholar] [CrossRef] [Green Version]
  19. Mubialiwo, A.; Onyutha, C.; Abebe, A. Historical Rainfall and Evapotranspiration Changes over Mpologoma Catchment in Uganda. Adv. Meteorol. 2020, 2020, 8870935. [Google Scholar] [CrossRef]
  20. Onyutha, C. Geospatial Trends and Decadal Anomalies in Extreme Rainfall over Uganda, East Africa. Adv. Meteorol. 2016, 2016, 6935912. [Google Scholar] [CrossRef] [Green Version]
  21. Mubialiwo, A.; Chelangat, C.; Onyutha, C. Changes in precipitation and evapotranspiration over Lokok and Lokere catchments in Uganda. Bull. Atmos. Sci. Technol. 2021, 2, 2. [Google Scholar] [CrossRef]
  22. Onyutha, C.; Acayo, G.; Nyende, J. Analyses of Precipitation and Evapotranspiration Changes across the Lake Kyoga Basin in East Africa. Water 2020, 12, 1134. [Google Scholar] [CrossRef]
  23. Onyutha, C.; Asiimwe, A.; Muhwezi, L.; Mubialiwo, A. Water availability trends across water management zones in Uganda. Atmos. Sci. Lett. 2021, e1059. [Google Scholar] [CrossRef]
  24. Niang, I.; Ruppel, O.C.; Abdrabo, M.A.; Essel, A.; Lennard, C.; Padgham, J.; Urquhart, P. Africa. In Climate Change 2014: Impacts, Adaptation, and Vulnerability. Part B: Regional Aspects. Contribution of Working Group II to the Fifth Assessment Report of the Intergovernmental Panel on Climate Change; Barros, V.R., Field, C.B., Dokken, D.J., Mastrandrea, M.D., Mach, K.J., Bilir, T.E., Chatterjee, M., Ebi, K.L., Estrada, Y.O., Genova, R.C., Eds.; Cambridge University Press: Cambridge, UK, 2014; pp. 1199–1265. [Google Scholar]
  25. Mehdi, B.; Dekens, J.; Herrnegger, M. Climatic impacts on water resources in a tropical catchment in Uganda and adaptation measures proposed by resident stakeholders. Clim. Chang. 2021, 164, 1–22. [Google Scholar] [CrossRef]
  26. Egeru, A.; Barasa, B.; Nampijja, J.; Siya, A.; Makooma, M.T.; Majaliwa, M.G.J. Past, Present and Future Climate Trends Under Varied Representative Concentration Pathways for a Sub-Humid Region in Uganda. Climate 2019, 7, 35. [Google Scholar] [CrossRef] [Green Version]
  27. Nsubuga, F.N.W.; Olwoch, J.M.; de Rautenbach, C.J.W.; Botai, O.J. Analysis of mid-twentieth century rainfall trends and variability over southwestern Uganda. Theor. Appl. Clim. 2014, 115, 53–71. [Google Scholar] [CrossRef] [Green Version]
  28. Nyeko-Ogiramoi, P.; Ngirane-Katashaya, G.; Willems, P.; Ntegeka, V. Evaluation and inter-comparison of Global Climate Models’ performance over Katonga and Ruizi catchments in Lake Victoria basin. Phys. Chem. Earth Parts A/B/C 2010, 35, 618–633. [Google Scholar] [CrossRef]
  29. National Planning Authority. The Uganda Vision 2040; Government of Uganda: Kampala, Uganda, 2013. Available online: http://www.npa.go.ug/uganda-vision-2040/ (accessed on 10 March 2021).
  30. Ministry of Water and Environment. Uganda Catchment Management Planning Guidelines; Republic of Uganda, Ministry of Water and Environment, Directorate of Water Resources Management: Kampala, Uganda, 2014.
  31. Republic of Uganda. Second National Development Plan (NDPII) 2015/16–2019/20; Government of Uganda: Kampala, Uganda, 2015. Available online: http://npa.go.ug/wp-content/uploads/NDPII-Final.pdf (accessed on 10 March 2021).
  32. Food and Agriculture Organization. Country Files, Uganda. 2020. Available online: http://www.fao.org/3/t0473e/T0473E11.htm (accessed on 10 November 2020).
  33. Yang, W.; Seager, R.; Cane, M.A.; Lyon, B. The Annual Cycle of East African Precipitation. J. Clim. 2015, 28, 2385–2404. [Google Scholar] [CrossRef] [Green Version]
  34. United States Geological Survey. USGS EROS Archive—Products Overview. 2020. Available online: https://lta.cr.usgs.gov (accessed on 7 January 2020).
  35. Fick, S.E.; Hijmans, R.J. WorldClim 2: New 1-km spatial resolution climate surfaces for global land areas. Int. J. Climatol. 2017, 37, 4302–4315. [Google Scholar] [CrossRef]
  36. Eyring, V.; Bony, S.; Meehl, G.A.; Senior, C.A.; Stevens, B.; Stouffer, R.J.; Taylor, K.E. Overview of the Coupled Model Intercomparison Project Phase 6 (CMIP6) experimental design and organization. Geosci. Model. Dev. 2016, 9, 1937–1958. [Google Scholar] [CrossRef] [Green Version]
  37. Hargreaves, G.H.; Samni, Z.A. Estimation of potential evapotranspiration. Proc. Am. Soc. Civ. Eng. 1982, 108, 223–230. [Google Scholar]
  38. Hargreaves, G.H.; Samni, Z.A. Reference crop evapotranspiration from temperature. Trans. Am. Soc. Agric. Eng. 1985, 1, 96–99. [Google Scholar] [CrossRef]
  39. Tabari, H.; Paz, S.M.; Buekenhout, D.; Willems, P. Comparison of statistical downscaling methods for climate change impact analysis on precipitation-driven drought. Hydrol. Earth Syst. Sci. 2021, 25, 3493–3517. [Google Scholar] [CrossRef]
  40. Riahi, K.; Van Vuuren, D.P.; Kriegler, E.; Edmonds, J.; O’Neill, B.C.; Fujimori, S.; Bauer, N.; Calvin, K.; Dellink, R.; Fricko, O.; et al. The Shared Socioeconomic Pathways and their energy, land use, and greenhouse gas emissions implications: An overview. Glob. Environ. Chang. 2017, 42, 153–168. [Google Scholar] [CrossRef] [Green Version]
  41. Blau, M.T.; Ha, K. The Indian Ocean Dipole and its Impact on East African Short Rains in Two CMIP5 Historical Scenarios with and without anthropogenic influence. J. Geophys. Res. Atmos. 2020, 125. [Google Scholar] [CrossRef]
  42. Chu, J.-E.; Ha, K.-J.; Lee, J.-Y.; Wang, B.; Kim, B.-H.; Chung, C.E. Future change of the Indian Ocean basin-wide and dipole modes in the CMIP5. Clim. Dyn. 2013, 43, 535–551. [Google Scholar] [CrossRef] [Green Version]
  43. Liebmann, B.; Hoerling, M.P.; Funk, C.; Bladé, I.; Dole, R.M.; Allured, D.; Quan, X.; Pegion, P.; Eischeid, J.K. Understanding Recent Eastern Horn of Africa Rainfall Variability and Change. J. Clim. 2014, 27, 8630–8645. [Google Scholar] [CrossRef]
  44. Lyon, B.; De Witt, D.G. A recent and abrupt decline in the East African long rains. Geophys. Res. Lett. 2012, 39, L02702. [Google Scholar] [CrossRef] [Green Version]
  45. Williams, A.P.; Funk, C. A westward extension of the warm pool leads to a westward extension of the Walker circulation, drying eastern Africa. Clim. Dyn. 2011, 37, 2417–2435. [Google Scholar] [CrossRef] [Green Version]
  46. Engelbrecht, F.; Adegoke, J.; Bopape, M.-J.; Naidoo, M.; Garland, R.; Thatcher, M.; McGregor, J.; Katzfey, J.; Werner, M.; Ichoku, C.; et al. Projections of rapidly rising surface temperatures over Africa under low mitigation. Environ. Res. Lett. 2015, 10, 085004. [Google Scholar] [CrossRef]
  47. Dike, V.N.; Shimizu, M.H.; Diallo, M.; Lin, Z.; Nwofor, O.K.; Chineke, T.C. Modelling present and future African climate using CMIP5 scenarios in HadGEM2-ES. Int. J. Clim. 2014, 35, 1784–1799. [Google Scholar] [CrossRef]
  48. Onyutha, C. Trends and variability of temperature and evaporation over the African continent: Relationships with precipitation. Atmósfera 2021, 34, 267–287. [Google Scholar] [CrossRef]
  49. Scheff, J.; Frierson, D. Scaling Potential Evapotranspiration with Greenhouse Warming. J. Clim. 2014, 27, 1539–1558. [Google Scholar] [CrossRef] [Green Version]
  50. Emori, S.; Brown, S.J. Dynamic and thermodynamic changes in mean and extreme precipitation under changed climate. Geophys. Res. Lett. 2005, 32. [Google Scholar] [CrossRef]
  51. Ayugi, B.; Tan, G.; Gnitou, G.T.; Ojara, M.A.; Ongoma, V. Historical evaluations and simulations of precipitation over East Africa from Rossby centre regional climate model. Atmos. Res. 2020, 232, 104705. [Google Scholar] [CrossRef]
  52. Kisembe, J.; Favre, A.; Dosio, A.; Lennard, C.; Sabiiti, G.; Nimusiima, A. Evaluation of rainfall simulations over Uganda in CORDEX regional climate models. Theor. Appl. Climatol. 2018, 137, 1117–1134. [Google Scholar] [CrossRef] [Green Version]
  53. Ngoma, H.; Wen, W.; Ayugi, B.; Babaousmail, H.; Karim, R.; Ongoma, V. Evaluation of precipitation simulations in CMIP6 models over Uganda. Int. J. Clim. 2021. [Google Scholar] [CrossRef]
  54. Nikulin, G.; Jones, C.; Giorgi, F.; Asrar, G.; Büchner, M.; Cerezo-Mota, R.; Christensen, O.B.; Déqué, M.; Fernandez, J.; Hänsler, A.; et al. Precipitation Climatology in an Ensemble of CORDEX-Africa Regional Climate Simulations. J. Clim. 2012, 25, 6057–6078. [Google Scholar] [CrossRef] [Green Version]
  55. Ayugi, B.; Tan, G.; Ruoyun, N.; Babaousmail, H.; Ojara, M.; Wido, H.; Mumo, L.; Ngoma, N.H.; Nooni, I.K.; Ongoma, V. Quantile Mapping Bias Correction on Rossby Centre Regional Climate Models for Precipitation Analysis over Kenya, East Africa. Water 2020, 12, 801. [Google Scholar] [CrossRef] [Green Version]
  56. Onyutha, C. Analyses of rainfall extremes in East Africa based on observations from rain gauges and climate change simulations by CORDEX RCMs. Clim. Dyn. 2020, 54, 4841–4864. [Google Scholar] [CrossRef]
  57. Füssel, H.M.; Klein, R.J. Climate change vulnerability assessments: An evolution of vulnerability matter in climate change discourses. Clim. Policy 2006, 7, 73–88. [Google Scholar]
  58. Brunner, L.; Lorenz, R.; Zumwald, M.; Knutti, R. Quantifying uncertainty in European climate projections using combined performance-independence weighting. Environ. Res. Lett. 2019, 14, 124010. [Google Scholar] [CrossRef]
  59. Hawkins, E.; Sutton, R. The Potential to Narrow Uncertainty in Regional Climate Predictions. Bull. Am. Meteorol. Soc. 2009, 90, 1095–1108. [Google Scholar] [CrossRef] [Green Version]
  60. Akinsanola, A.A.; Ongoma, V.; Kooperman, G.J. Evaluation of CMIP6 models in simulating the statistics of extreme precipitation over Eastern Africa. Atmos. Res. 2021, 254, 105509. [Google Scholar] [CrossRef]
  61. Tabari, H.; Hosseinzadehtalaei, P.; AghaKouchak, A.; Willems, P. Latitudinal heterogeneity and hotspots of uncertainty in projected extreme precipitation. Environ. Res. Lett. 2019, 14, 124032. [Google Scholar] [CrossRef] [Green Version]
  62. Knutti, R.; Sedláček, J.; Sanderson, B.M.; Lorenz, R.; Fischer, E.M.; Eyring, V. A climate model projection weighting scheme accounting for performance and interdependence. Geophys. Res. Lett. 2017, 44, 1909–1918. [Google Scholar] [CrossRef] [Green Version]
  63. Giorgi, F.; Mearns, L.O. Calculation of Average, Uncertainty Range, and Reliability of Regional Climate Changes from AOGCM Simulations via the “Reliability Ensemble Averaging” (REA) Method. J. Clim. 2002, 15, 1141–1158. [Google Scholar] [CrossRef]
  64. Asiimwe, A. Impacts of Climate Change on Precipitation and Potential Evapotranspiration Across Water Management Zones in Uganda. Master’s Thesis, Kyambogo University, Kyambogo, Uganda, 2021. [Google Scholar]
Figure 1. Uganda’s WMZs and some physical features including lakes, rivers, rift valley, wetlands, and mountains.
Atmosphere 12 00887 g001
Figure 2. Historical annual and seasonal (ae) precipitation and (fj) PET.
Atmosphere 12 00887 g002
Figure 3. Projected percentage changes in (a,f,k,p) JF, (b,g,l,q) MAM, (c,h,m,r) JJAS, (d,i,n,s) OND, and (e,j,o,t) annual precipitation for the 2030s based on (ae) SSP1-2.6 (fj) SSP2-4.5, (ho) SSP3-7.0, and (p) SSP5-8.5.
Atmosphere 12 00887 g003
Figure 4. Projected percentage changes in precipitation averaged over each WMZ for the (a) 2030s, (b) 2050s, (c) 2070s, and (d) 2090s.
Atmosphere 12 00887 g004
Figure 5. Climate change (%) impact on (a,f,k,p) JF, (b,g,l,q) MAM, (c,h,m,r) JJAS, (d,i,n,s) OND, and (e,j,o,t) annual PET based on (ae) SSP1-2.6 (fj) SSP2-4.5, (ho) SSP3-7.0, and (pt) SSP5-8.5.
Atmosphere 12 00887 g005
Figure 6. Projected changes in PET averaged over each WMZ during the (a) 2030s, (b) 2050s, (c) 2070s, and (d) 2090s.
Atmosphere 12 00887 g006
Table 1. Areas of the WMZs in Uganda.
WMZsAreas Calculated in This Research (km2)MWE (2014)
Area (km2)
Area Difference (km2)
Albert56,70245,00011,702
Kyoga57,25858,000−742
Upper Nile59,90850,0009908
Victoria61,66578,100−16,435
TOTAL235,533231,1004433
Table 2. Overview of the GCMs.
No.ModelInstitutionOriginal Spatial Resolution
1BCC-CSM2-MRBeijing Climate Center, China Meteorological
Administration, China.
1.1 × 1.1°
2CNRM-CM6-1National Center for Meteorological Research,
Météo-France and CNRS laboratory, France
1.4 × 1.4°
3CNRM-ESM2-1National Center for Meteorological Research,
Météo-France and CNRS laboratory, France
1.4 × 1.4°
4CanESM5Canadian Centre for Climate Modelling and Analysis, Environment and Climate Change Canada,
Victoria, BC V8W 2P2, Canada
2.8 × 2.8°
5IPSL-CM6A-LRInstitute Pierre-Simon Laplace, France2.5 × 1.3°
6MIROC-ES2LAtmosphere and Ocean Research Institute
(The University of Tokyo), National Institute for
Environmental Studies, and Japan Agency for
Marine-Earth Science and Technology, Japan.
2.8 × 2.8°
7MIROC6Atmosphere and Ocean Research Institute
(The University of Tokyo), National Institute for
Environmental Studies, and Japan Agency for Marine-Earth Science and Technology, Japan.
1.4 × 1.4°
8MRI-ESM2-0Meteorological Research Institute, Tsukuba,
Ibaraki 305-0052, Japan
1.1 × 1.1°
Table 3. Long-term mean of historical precipitation and PET for the four WMZs.
WMZTime Scale
JFMAMJJASONDAnnual
Precipitation (mm)
Albert93.5369.3362.0336.51161.3
Kyoga72.3399.3435.6240.81148.1
Victoria158.0508.6254.4358.11279.2
Upper Nile39.7340.2552.0234.11166.2
PET (mm)
Albert329.4455.0572.2469.41826.1
Kyoga417.9542.2646.8570.72177.6
Victoria296.3418.1550.0428.71693.0
Upper Nile460.3584.9667.4616.02328.5
Publisher’s Note: MDPI stays neutral with regard to jurisdictional claims in published maps and institutional affiliations.

