Article

Future Climate Change Impact on Urban Heat Island in Two Mediterranean Cities Based on High-Resolution Regional Climate Simulations

by
Stavros Ch. Keppas
1,*,
Sofia Papadogiannaki
1,
Daphne Parliari
1,
Serafim Kontos
1,
Anastasia Poupkou
1,2,
Paraskevi Tzoumaka
3,
Apostolos Kelessis
3,
Prodromos Zanis
4,
Giampietro Casasanta
5,
Francesca de’Donato
6,
Stefania Argentini
5 and
Dimitrios Melas
1
1
Laboratory of Atmospheric Physics, School of Physics, Aristotle University of Thessaloniki, 54124 Thessaloniki, Greece
2
Research Centre for Atmospheric Physics and Climatology, Academy of Athens, 84 Solonos St., 10680 Athens, Greece
3
Department of Environment, Municipality of Thessaloniki, Kleanthous 18, 54642 Thessaloniki, Greece
4
Department of Meteorology and Climatology, School of Geology, Aristotle University of Thessaloniki, 54124 Thessaloniki, Greece
5
CNR-ISAC—Italian National Research Council, Institute of Atmospheric Science and Climate, via Fosso del Cavaliere 100, 00133 Rome, Italy
6
Department of Epidemiology, Regional Health Authority, 00147 Rome, Italy
*
Author to whom correspondence should be addressed.
Atmosphere 2021, 12(7), 884; https://doi.org/10.3390/atmos12070884
Submission received: 11 June 2021 / Revised: 2 July 2021 / Accepted: 3 July 2021 / Published: 7 July 2021
(This article belongs to the Special Issue Urban Climate and Air Quality in Mediterranean Cities)

Abstract

:
The Mediterranean is recognized among the most responsive regions to climate change, with annual temperatures projected to increase by 1–5 °C until 2100. Large cities may experience an additional stress discomfort due to the Urban Heat Island (UHI) effect. In the present study, the WRF-ARW numerical weather prediction model was used to investigate the climate change impact on UHI for two Mediterranean cities, Rome and Thessaloniki. For this purpose, three 5-year time-slice simulations were conducted (2006–2010, 2046–2050, 2096–2100) under the Representative Concentration Pathway (RCP) 8.5 emission scenario, with a spatial resolution of 2 km. In order to comprehensively investigate the urban microclimate, we analyze future simulation data across sections crossing urban/non-urban areas, and after grouping them into three classes depending on the location of the grid cells. The urban areas of both cities present increased average minimum temperature (Tmin) in winter/summer compared to other rural areas, with an UHI of ~+1.5–3 °C on average at night/early morning. Considering UHI under future climate change, we found no significant variations (~±0.2 °C). Finally, we found that the numbers of days with Tmin ≥ 20 °C will mostly increase in urban coastal areas until 2100, while the largest increase of minimum Discomfort Index (DImin) is expected in urban low-ground areas.

1. Introduction

Climate change is considered to be one of the most significant global threats of the current century, while it has been proven that the leading contribution to global warming is made by the anthropogenic emissions of greenhouse gases [1,2]. However, the extent of the temperature increase cannot be accurately estimated, as the concentrations of the greenhouse gases are unknown in the future atmosphere. For such reason, the estimations of the future climate are based on various Representative Concentration Pathway (RCP) emission scenarios. Four different scenarios are provided by the Coupled Model Intercomparison Project phase 5 (CMIP5) based on the additional amount of energy into the Earth’s climate system (radiative forcing). Thus, the RCP 2.6, 4.5, 6 and 8.5 scenarios correspond to a radiative forcing increase of 2.6, 4.5, 6 and 8.5 W m−2 by the year 2100, relative to preindustrial levels [3,4,5,6,7,8]. According to these scenarios, the mean global temperature is expected to increase on average by 1–4.5 °C by the end of this century, relative to the 1850–1860 mean temperature [9]. Studies focusing on the Mediterranean Sea estimate that the temperature will increase by 3–5 °C under the RCP 8.5 emission scenario until the end of the century, varying with the region and the season [10,11,12,13].
Summer is the season most affected by global warming [14,15], and also the most threatening season to human life due to the increasing temperature and number of heat waves in the next 80 years. In the future, due to the warming Earth, heat waves, which are considered as extremes in the present climate, may be more frequent [16]. In particular, in a “business-as-usual” (RCP 8.5) scenario, there will be 40–60 extra days of maximum temperature > 30 °C and an average temperature increase by 4–5 °C in Europe by the end of the 21st century. Furthermore, the occurrence of 3–4 heat waves per year is projected until 2100, which may have a significant impact on public health in future summers [14,17,18,19,20]. Focusing on Greece, an increase in hot days, with Tmax > 35 °C ranging between 14 and 21 days for 2021–2050 and between 49 and 56 days for 2071–2100, was projected under the A1B scenario [21].
Urban areas will experience an enhanced impact of the earlier described climate change, as they are characterized by different land uses. In fact, urban areas are constructed from materials (e.g., asphalt and concrete) with properties (such as albedo and heat capacity) different than the natural environment surrounding them [22,23,24,25,26]. As a result, the temperature is usually higher within urban centers rather than in the surrounding areas, especially during calm nights [27,28,29,30,31]. This phenomenon, which is enhanced by the anthropogenic heating, is referred to as Urban Heat Island (UHI). As urban populations in Europe are expected to increase to 84% by 2050 from 70% in 2014 and the average rate of urbanization in Mediterranean cities is ~+1.9% per year [3,32], the investigation of the urban microclimate change may provide insight into modifying the landscape of our cities to mitigate the UHI effect.
Investigating UHI is of high importance, as the added heat load caused by UHI can cause greater heat stress and adverse health effects in Mediterranean cities [23,32,33,34,35,36,37,38]. The UHI usually seems to be stronger at night. The urban structures store heat during the day, preventing cities from cooling as much as rural areas. Thus, prolonged heat waves usually produce long periods of stressful temperatures, which increase public health risk compared to isolated hot days [9,39,40,41]. According to [41], there was an excess in heat-related mortality within the urban center of Shanghai by 20 deaths per 100,000 of population, compared to the exurban areas. In addition, various studies show that extreme and prolonged heat waves can have a significant impact on mortality in large urban areas [42,43,44,45,46,47].
Various studies have been conducted focusing on the microclimate of Mediterranean cities, where discomfort due to warm summers may become fairly unaffordable. Such studies present variable results regarding the season and daytime of the occurrence of the strongest UHI, but generally similar in terms of the intensity. In order to comprehensively simulate the urban environments, urban canopy models (UCMs) are used to provide with urban parameterizations [48,49]. Over the last decade, various studies have focused on the UHI change using climate models coupled to UCMs [50,51,52,53,54,55,56,57,58,59]. References [30,60] showed that UHI in Athens can exceed 4 °C during the night, while the effect is almost eliminated during the day. In Thessaloniki, the UHI effect varies between 1 and 4 °C, being stronger on summer nights but exhibiting greater variability during the winter [61]. In Cyprus, in the city of Nicosia, UHI appears to be weaker, not exceeding 1.5 °C, while the effect is stronger during the winter [62]. Moving to cities of the central and western Mediterranean, UHI in Rome usually fluctuates between 3 and 5 °C during summer nights, while in winter it is often <2 °C [63,64]. Finally, while UHI in Barcelona may exceed 7 °C every 1000 days, the UHI effect is more intense in the winter (2–5 °C) and weaker in summer [65]. A satellite analysis conducted by [66] reveals that the UHI effect in five Mediterranean cities has been intensified within the period 2001–2017, by +0.3 to +0.9 °C.
Many recent studies show that especially minimum temperature may be regionally amplified due to urbanization under present or future conditions [67,68,69,70,71]. As an illustration, the authors of [72] report that an urbanization scenario would increase minimum temperature in European urban areas by +0.6 °C until 2035, which is fairly comparable to the temperature change suggested by the RCP 8.5 scenario. Some of the previously mentioned studies conclude that the temperature over rural areas increases more significantly than in the urban ones. This would result in reducing the UHI effect. On the other hand, there are studies reporting that even appropriate urban parameterization in regional climate models cannot sufficiently represent the UHI during heat waves [73]. Finally, there is a part of the literature review that shows no significant changes in the UHI intensity in the future under various RCP scenarios in different cities, such as Athens [74], New Jersey [75], Brussels [76] and Montreal [77]. Meanwhile, the authors of [78] indicate that 13 out of 20 cities in Canada will experience an enhancement of the UHI effect by up to +0.25 °C under the RCP 8.5 scenario, a result which does not significantly differentiate under the moderate 2.6 scenario. In addition, the UHI change seems to be proportional to the city size, exhibiting an inverse relationship with the altitude. Hence, as there are various conclusions through various studies and methodologies, it seems that there is still uncertainty on the evolution of UHI under the future climate.
The present study aims to analyze the present and future climate (under the RCP 8.5 scenario) of the urban and surrounding non-urban areas of two Mediterranean cities with different structure, shape, size, location and topographical characteristics. In order to investigate the microclimate of the cities and the differentiation of the urban to the non-urban microclimate of them, the UHI effect, but also the discomfort caused by the urban structure, as part of the climatology of the cities, is examined. For the purposes of this analysis, we deployed a high-resolution model coupled with a single-layer urban canopy model. The data and the methodology used in this work are presented in Section 2, the validation results of the numerical weather prediction model for the cities of Thessaloniki and Rome are shown in Section 3, the results are described in Section 4 and the conclusions in Section 5.

2. Data and Methodology

2.1. The Regional Climate Modeling System
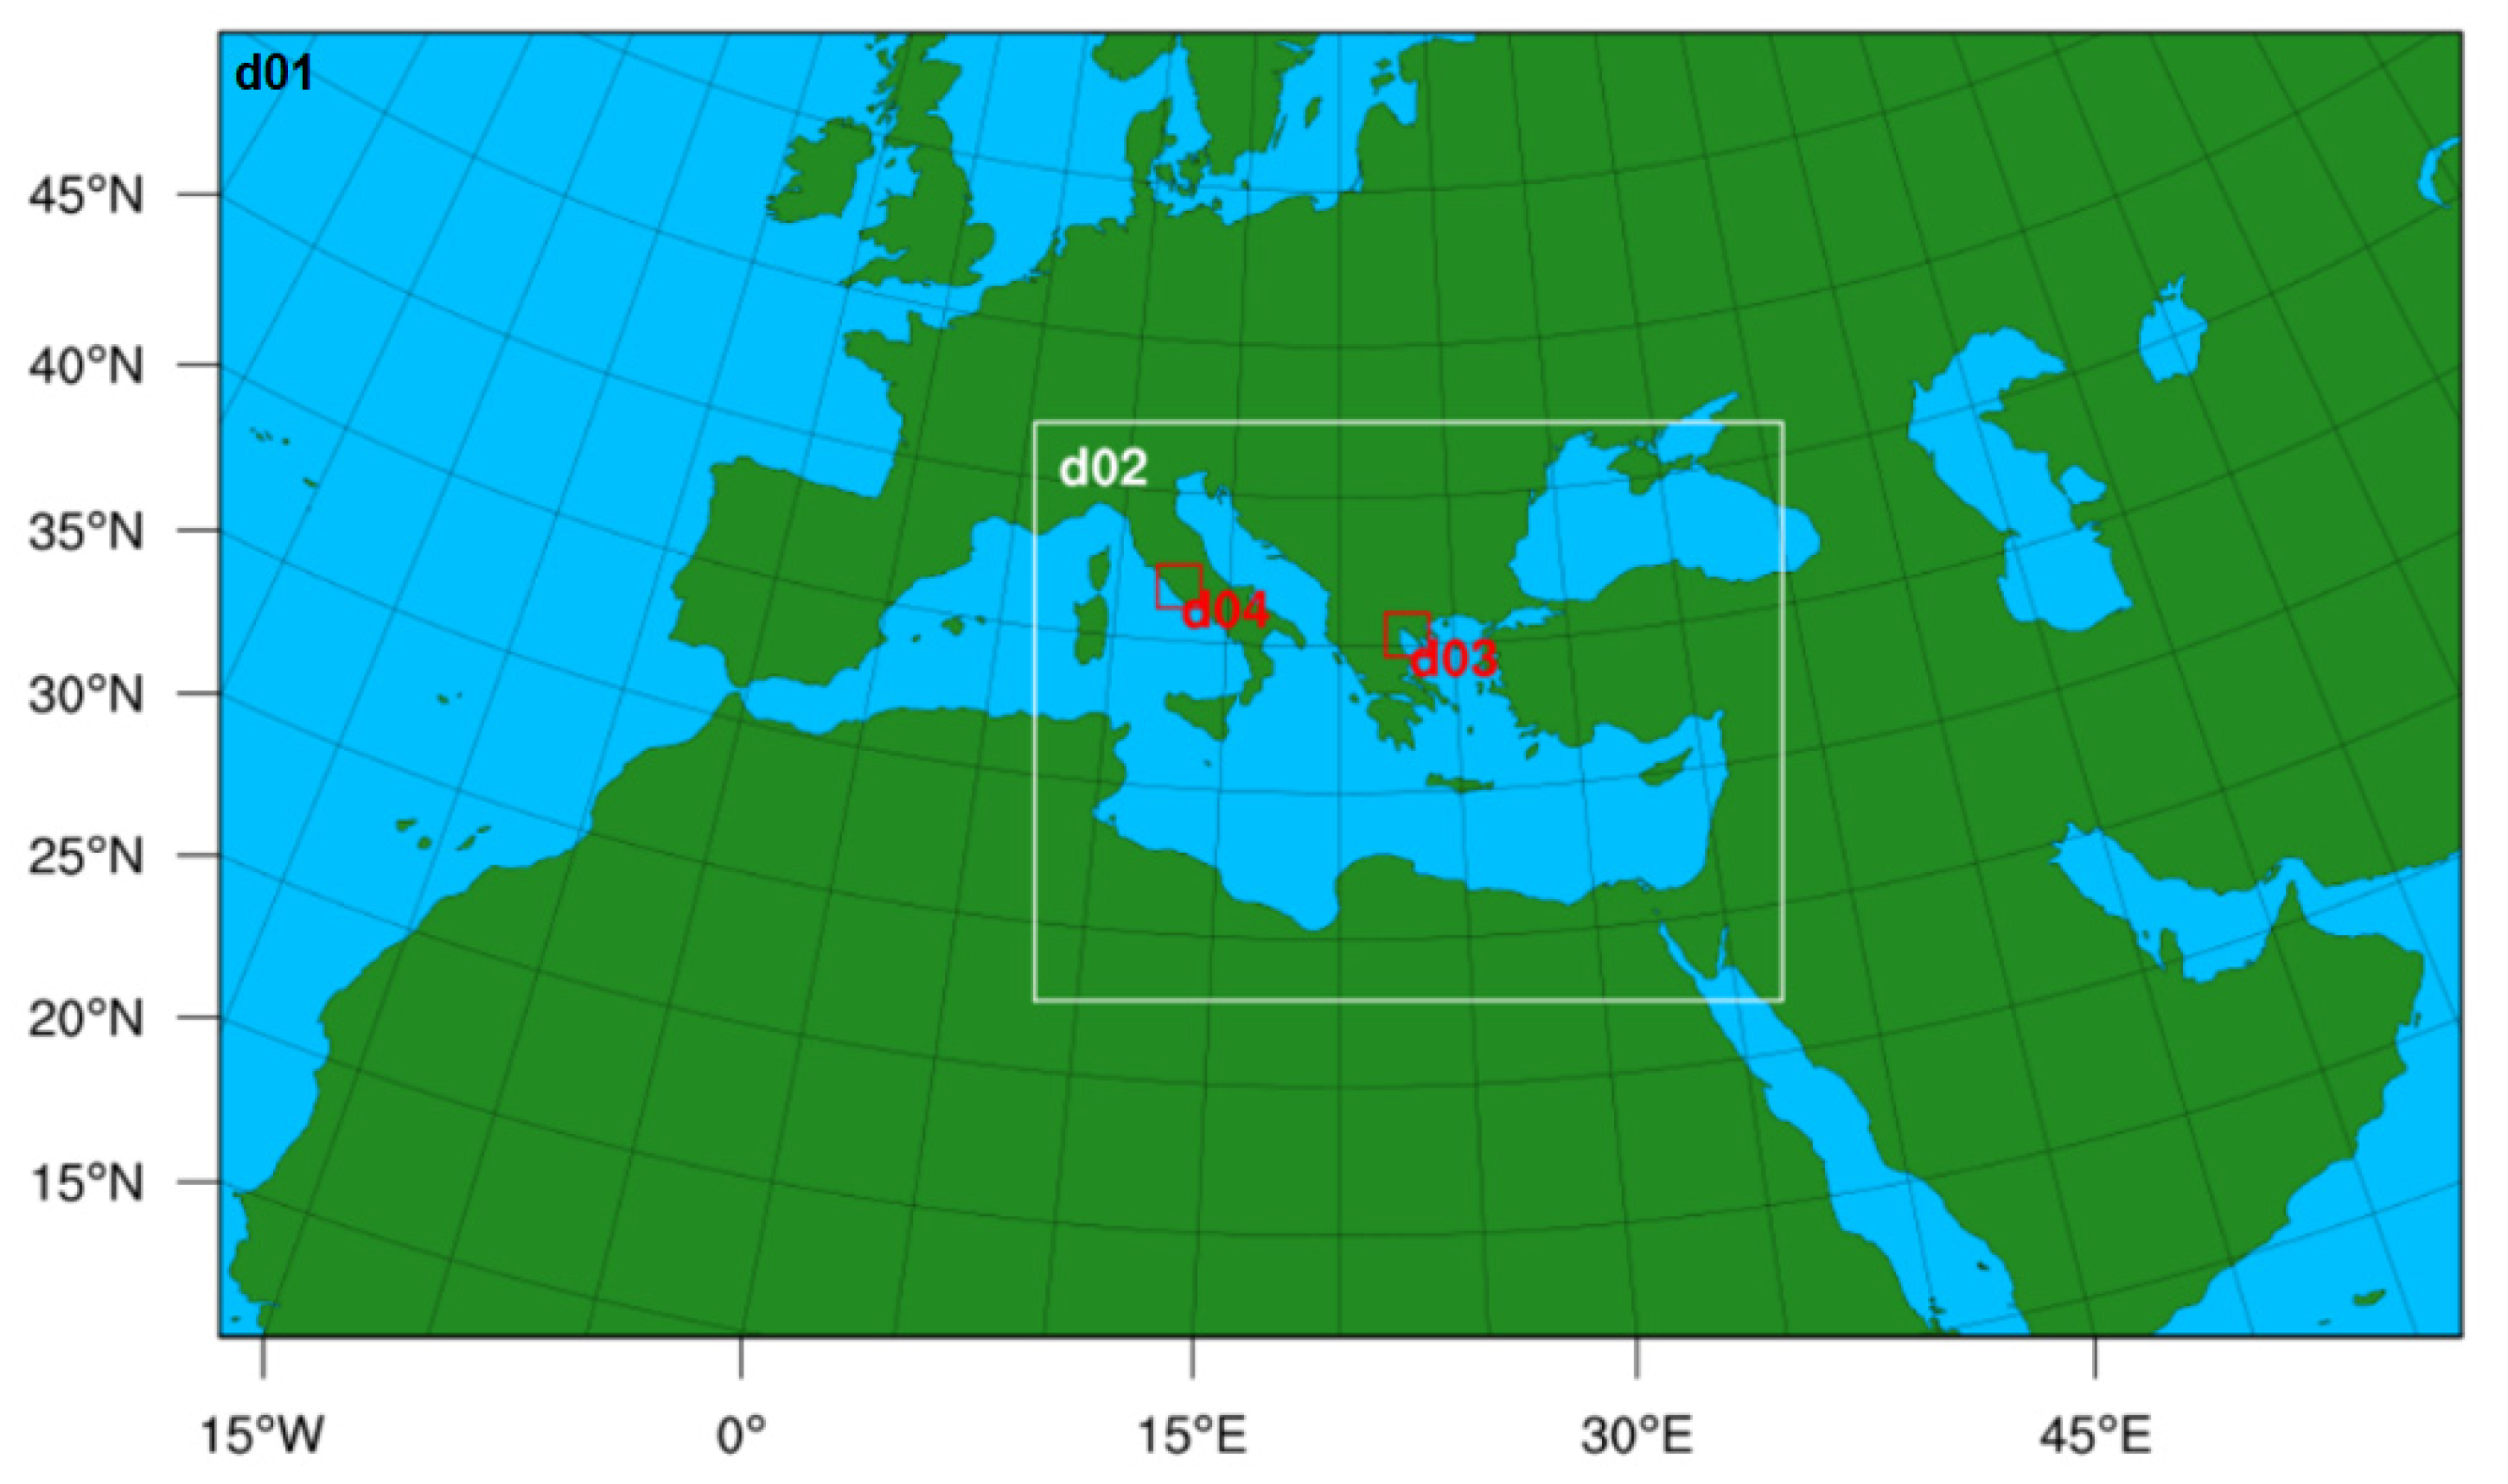
In this study, the climate simulations were conducted through the regional WRF-ARW numerical weather prediction model. The WRF model simulations were produced for the purposes and needs of the forecasting system for urban heat island effect (LIFE-ASTI) project (https://app.lifeasti.eu/, accessed on 6 July 2021). In total, four nested domains were set for Europe, central–east Mediterranean and Thessaloniki/Rome, with horizontal grid resolutions of 50 km (d01), 10 km (d02) and 2 km (d03, d04), respectively (Figure 1). We analyzed part of the datasets referring to the domains of Thessaloniki and Rome, d03 and d04. The physics schemes used for these simulations are based on the set up of previous simulations focusing on the analysis of the UHI effect in Greece [79]. The selected schemes are shown in Table 1. In order to better simulate physical processes in the urban areas, the single-layer urban canopy model (SLUCM) was used to comprehensively represent the urban environment and the physical processes that take part within it (i.e., energy fluxes between urban surface and atmosphere, street canyons and urban geometry, shadowing of buildings affecting radiation, temperature over artificial surfaces) [80,81]. This scheme incorporates three distinct types of urban land-use type: (a) high-density residential, (b) low-density residential and (c) industrial-commercial areas. In order to properly represent the urban fabric of these Mediterranean cities, the urban area fractions from [79] were adopted for these three types (i.e., 0.5, 0.9 and 0.95, respectively). It should be noted that the WRF model comprises three sub-models for the estimation of the urban fabric’s feedback on climate: (a) the SLUCM [80], which assumes a 2D canyon-like urban morphology, (b) the Building Effect Parameterization (BEP) [82] with 3D morphology and (c) BEP coupled with the Building Energy Model (BEP + BEM) [83]. The first sub-model utilizes a single layer approach, while the other two follow a multi-layer approach, suitable for applications on regions where the height of the buildings is higher than that represented by the first sub-model. Taking into account the lack of detailed information about properties of the buildings being demanded by BEP and BEP + BEM, the relatively coarse first layer utilized in climate modeling (30 m in the present study) and the good performance of SLUCM in other Mediterranean cities [84], the latter is chosen for the investigation of the effect of urban environment on climate.
Regarding the land use input, the Global Land Cover by National Mapping Organizations version 1 (GLCNMO v1), with a resolution of 30″ (arcseconds), was used for d01 and d02 [85]. The land use of all the other domains was represented by the version 2012 of the Corine Land Cover (CLC), which provides a spatial resolution of 100–250 m and categorizes the land use into 5 main classes (artificial areas, agricultural areas, forests, wetlands and water bodies) and 44 different sub-classes [86].
The WRF model was run for three periods, the reference period 2006–2010, which represents the present climate, and the periods 2046–2050 and 2096–2100, which provide an insight into the climate of the middle and end of the 21st century. The boundary conditions used for these periods were obtained from the National Centre for Atmospheric Research (NCAR) and the Community Earth System Model (CESM), which participated in phase 5 of the Coupled Model Intercomparison Experiment (CMIP5). The data, with a spatial resolution of 1°, were used in a 6 h time-step, referring to the Representative Concentration Pathway 8.5 (RCP8.5) [87], the so-called “business-as-usual” or “worst-case” high emissions scenario.

2.2. Study Areas

The LIFE-ASTI project focuses on the development of a forecasting system for the UHI effect for two Mediterranean cities, Thessaloniki and Rome. Then, the system may be replicated to other cities experiencing the impacts of the UHI effect. The two cities were selected as they are located in the Mediterranean area, which usually experiences hot and dry summers, and the discomfort is estimated to be fairly unaffordable in the future, as described in the introduction. Some general characteristics of the cities are described in the following paragraphs.
Thessaloniki is a medium sized city located in the eastern Mediterranean, in northern Greece, on the north coast of the Thermaikos gulf and to the east of the mount Chortiatis (with a peak of 1202 m). It is the second largest city in Greece, with a metropolitan population of ~1.1 million residents and an area of ~112 km2. The climate of the city can be characterized as Mediterranean with dry and hot summers, but wet and mild winters. The mean annual temperature of Thessaloniki is ~16 °C and the mean annual precipitation is ~450 mm [61].
On the other hand, Rome is a larger city of 3.7 million people, which is located in central–west Italy in a valley enclosed by mountains (Colli Albani, Sabatini and Tolfa mounts, not exceeding 1300 m). The climate of the city is similarly characterized by hot summers and mild winters, with mean annual temperature of ~16.5 °C and mean annual precipitation of 802 mm [88].

2.3. The Observational Data

The model performance was assessed with the evaluation of near-surface air temperature (SAT, °C), defined at 2 m above ground level. The WRF-simulated and the observational data were paired in space with the “nearest neighbor” technique, in which the model grid point nearest to the location of the measuring site is selected for extracting the model data. As the d03 and d04 results were used for the evaluation process, the maximum distance between a model grid point and actual station location was of up to 2 km.
Daily measurements of mean temperature were retrieved for Rome and Thessaloniki, covering the period 2006–2010 or 2008–2010 depending on the availability of the data. To represent the area of Thessaloniki (Figure 2a), 10 ground-based stations from 4 weather networks were selected (Department of Geology of the Aristotle University of Thessaloniki, Region of Central Macedonia, Municipality of Thessaloniki, National Centers for Environmental Information-National Oceanic and Atmospheric Administration (NOAA)) and clustered according to CORINE Land Cover (CLC) classes. Out of these 10 sites, 9 were categorized as Artificial Surfaces and 1 as Forest and semi-Forest natural Areas. The area of Rome was represented by 14 ground-based stations (Figure 2b) from Meteo Lazio and Agenzia Regionale per la Protezione Ambientale del Lazio (ARPA Lazio) weather monitoring networks, which were again classified according to CLC. Most of them (i.e., 9) were located in areas classified as Artificial Surfaces, while 4 of them were found in Agricultural Areas, and 1 in Forest and semi-Forest natural Areas.
To perform model validation, simulated time series for SAT were compared with daily averaged time series for observed temperatures for both cities. Several statistical measures were computed to quantitatively evaluate the model performance, as proposed in similar previous studies [83]. These measures include: mean bias (MB), mean absolute error (MAE), root mean-squared error (RMSE), correlation coefficient (R) and index of agreement (IoA). MB, MAE and RMSE measure the error or deviation between observed and simulated values, while R and IoA are used to determine the trend relationship between observed and predicted values [96].
The statistical distribution of modeled and observed data was displayed using boxplot graphs with a five-number summary (“minimum”, first quartile (Q1), median, third quartile (Q3) and “maximum”). Boxplots are used to show the variability or dispersion of the data.

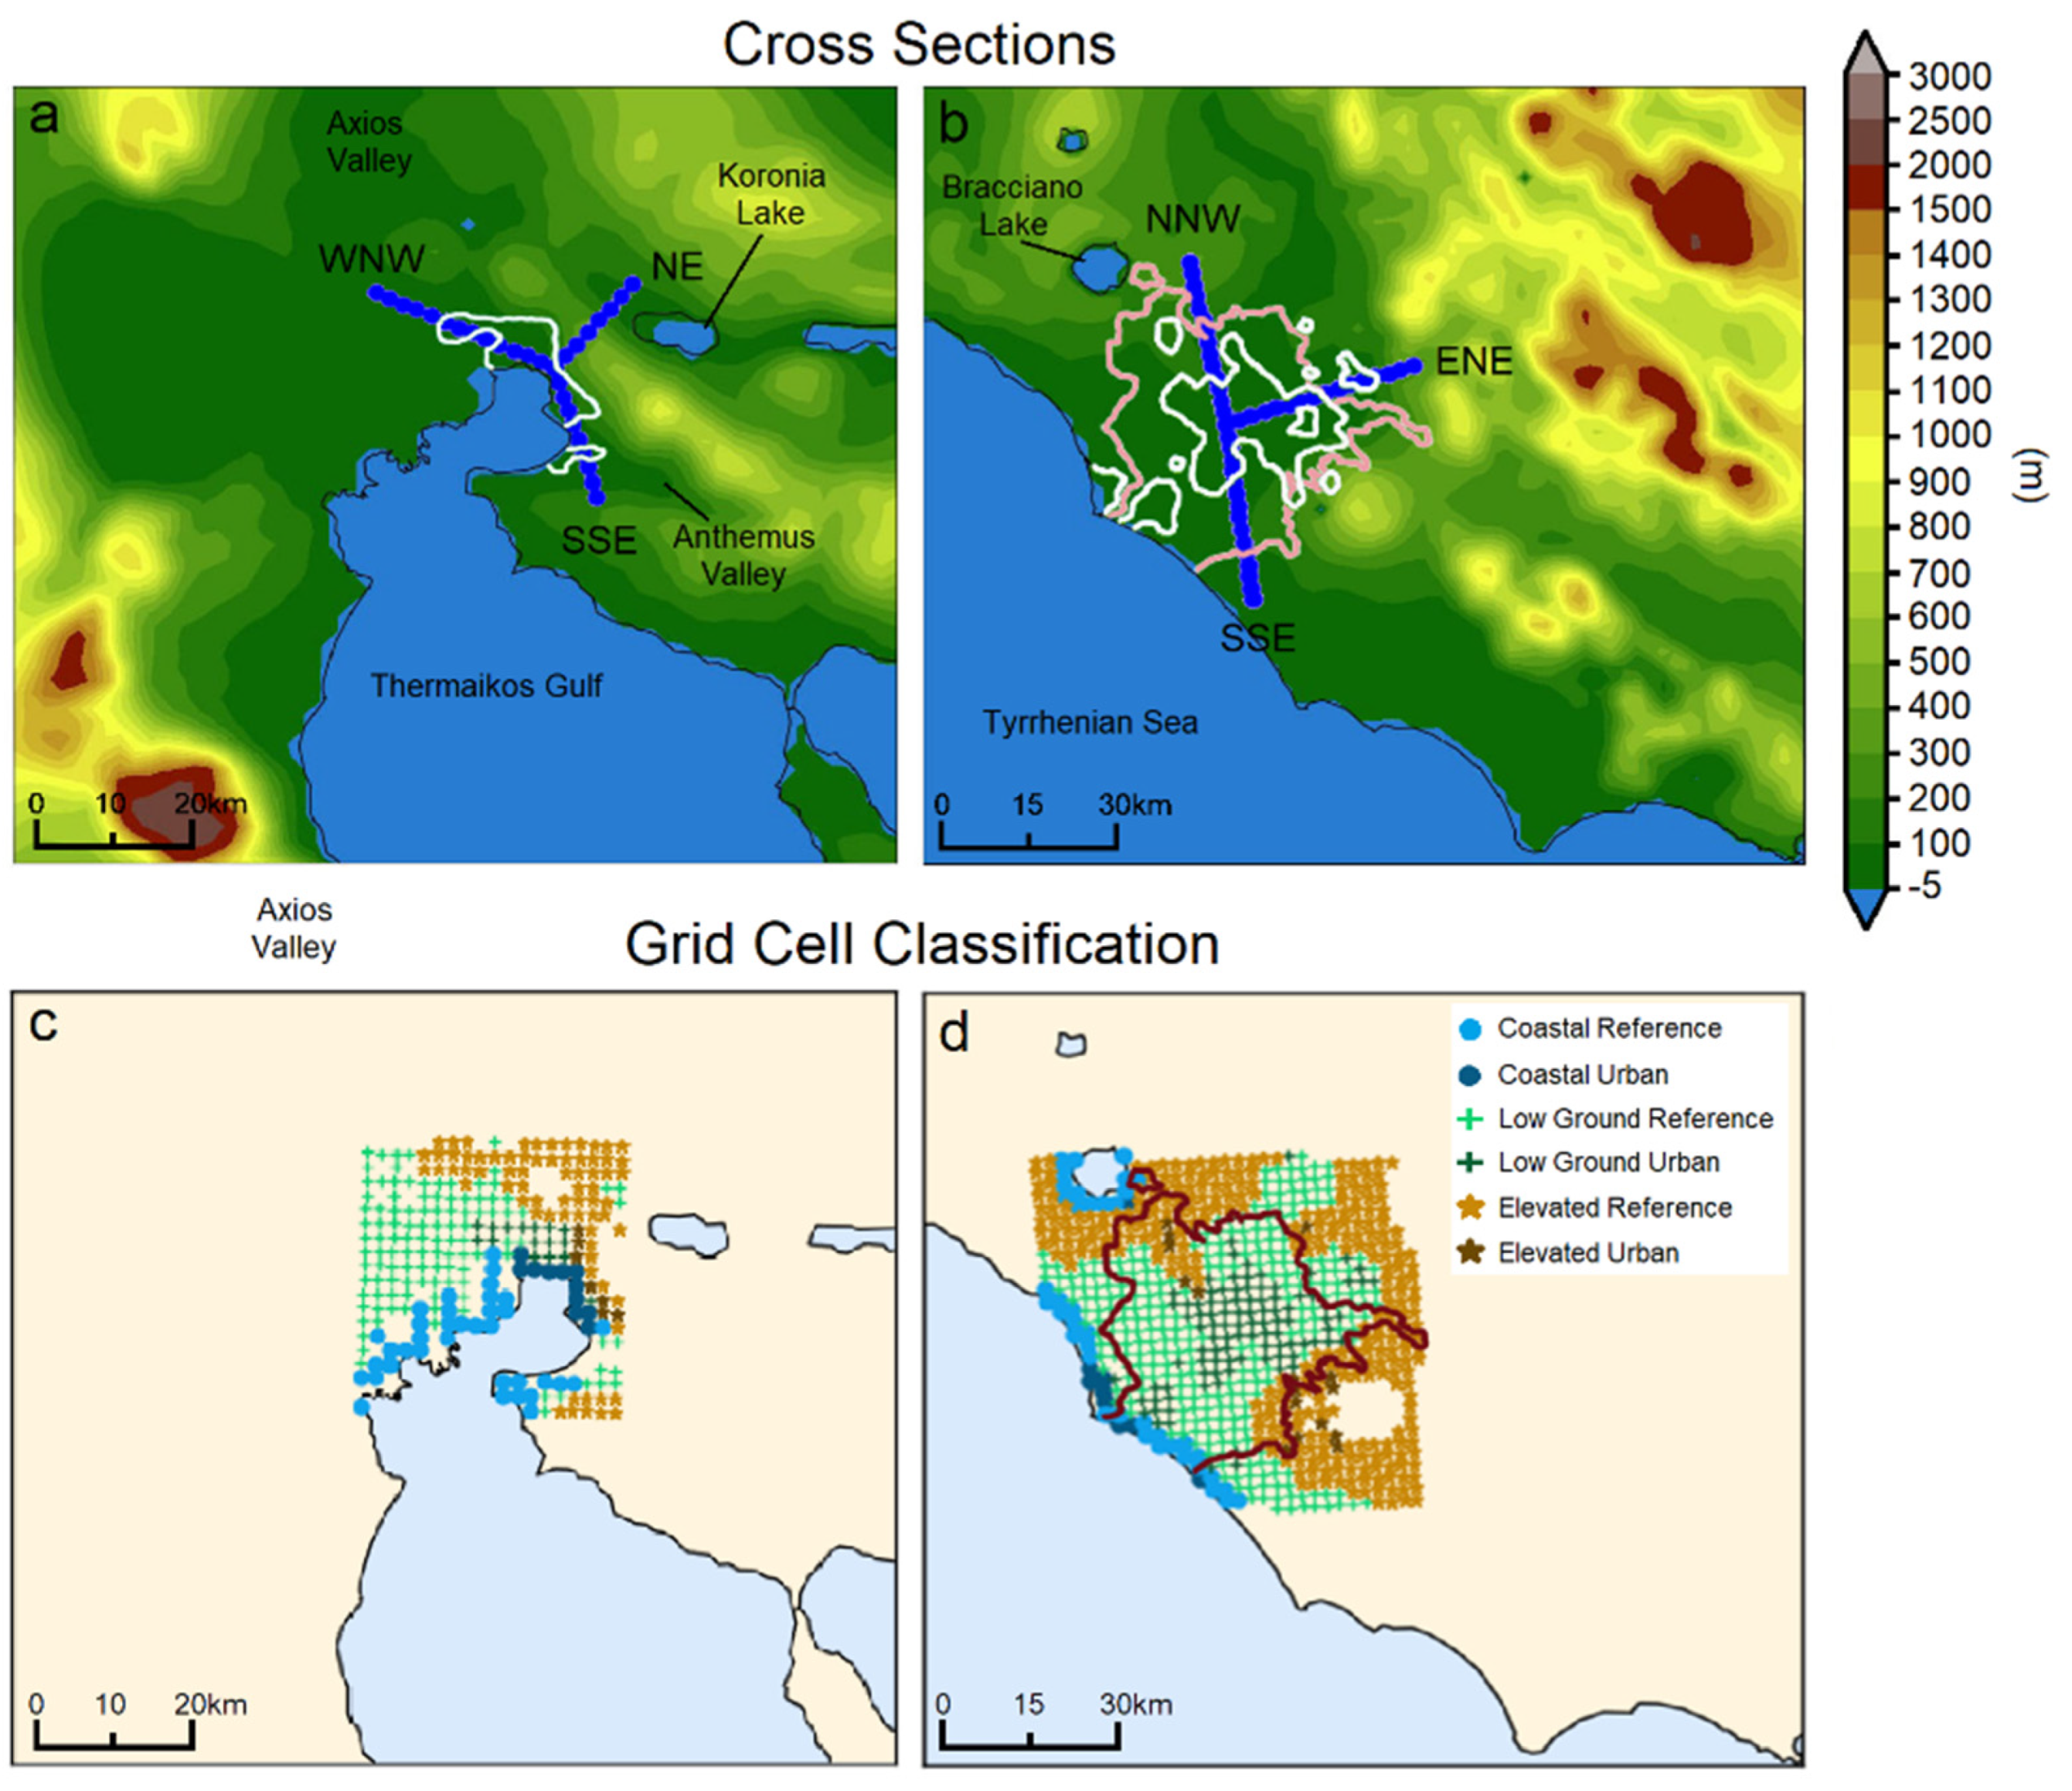
2.4. Cross-Sections and Grid Cell Classification

In order to analyze the urban microclimate and UHI effect in the present and future, we deployed two different approaches. The first approach focuses on the analysis of the temperature along three sections, which cross the urban and non-urban areas. The choice of these three sections was based on the different topographical characteristics of the two cities and surrounding areas. In the case of Thessaloniki (Figure 3a), which is an elongated rather than a circular shaped city, (a) the WNW section is representative of the western areas (i.e., katabatic wind occurrence being called “Vardaris” [97] and larger temperature range due to continental low-ground fields), which are located closer to the low-ground areas of Axios valley, (b) the SSE section crosses the southeastern parts of the city, the climate of which is affected by the sea and the smaller Anthemus valley, which is surrounded by mounts and hills (400–1200 m), and (c) the NE section, which crosses elevated areas across the narrow dimension of the city. For the city of Rome (Figure 3b), the NNW cross-section comprises low-level areas far from the sea, while the ENE section represents an area of elevation (~800–1000 m) and the SSE section is placed over low-level areas, which are close to the coastline and affected by the sea. All temperatures have been reduced to the sea level using an average lapse rate of 6.5 °C km−1.
In the second approach, we consider all the cells of the city domain, classifying them according to the following: (a) all the cells neighboring to the sea (coastal cells), (b) cells with an altitude between 0 and 100 m (ground cells) and (c) cells with an altitude of 100–300 m (elevated cells) (Figure 3c,d). The limit of 300 m is roughly the highest altitude in the cities of Thessaloniki and Rome. In Thessaloniki, the grid cells were selected excluding elevated areas to the east of the city (Figure 3a,c). Land use characterization is defined based on the Corine land use categories described in Section 2.1.

2.5. The Discomfort Index (DI)

One of the goals of the present study is to investigate the heat sensation in the urban areas during the summertime at present and in the future. Discomfort Index (DI) is one of the most commonly used indices in climate studies referring to urban areas, as it describes the thermal sensation experienced by the residents of an urban area [37,56]. For this reason, we used the Discomfort Index (DI), proposed by [98]:
D I = T 2 m 0.55 · ( 1 0.01 · R H 2 m ) · ( T 2 m 14.5 )
where T2m is the temperature at 2m (in °C) and RH2m is the relative humidity at 2m (in %).
The DI scale a priori defines a classification of discomfort for a population, as shown in Table 2.

3. Model Evaluation

Daily temperature values have been averaged separately for each city according to CLC class. Error statistics from daily mean temperatures are shown in Table 3 and Table 4. All stations exhibit a satisfactory correlation suggested by the index of agreement (IoA) (IoA > 0.91 and IoA > 0.92, for Thessaloniki and Rome, respectively) between the modeled and the observed near-surface air temperatures. It should be noted that all stations demonstrate IoA above the least desirable value of 0.8 in WRF simulations, a threshold that is being used extensively in similar studies [99,100]. In addition, the high correlation coefficient (R) shows that the model results and the observations are fairly correlated (>0.84 for Thessaloniki and >0.85 for Rome). On the contrary, mean absolute error (MAE) fails to remain below 2 °C.
Overall, the model is biased hot, overestimating SAT in terms of total mean bias (MB) and MAE (averaged MB = 0.43 °C and 0.51 °C, averaged MAE = 3.52 °C and 2.92 °C, Thessaloniki and Rome, respectively) for all CLC classes. Literature has already confirmed the magnitude of error metrics for Thessaloniki [79] and Rome [63]. Artificial Surfaces perform better in Rome than Thessaloniki; in contrast, Forest and semi-Forest natural Areas exhibit the opposite behavior. A plausible reason for this differentiation might be the degree of the sufficient representation of the urban surface properties of the two cities assigned to the modeling system. However, MAE and RMSE perform better for both land categories in Rome rather than Thessaloniki. For both sites, model performance is comparatively weaker for non-urban areas. MB and MAE are lower for man-made surfaces (MB = 0.4 °C and 0.05 °C, MAE = 3.36 °C and 2.71 °C, Thessaloniki and Rome, respectively) than forest areas (MB = 0.46 °C and 0.72 °C, MAE = 3.69 °C and 3.13 °C, Thessaloniki and Rome, respectively). In agreement to the above, R and IoA show better performance for urban areas (R = 0.85 and 0.88, IoA = 0.92 and 0.93, Thessaloniki and Rome, respectively). Root mean square errors (RMSEs) improved from 3.69 °C (3.13 °C) to 3.36 °C (2.71 °C) between forest and artificial forest areas for Thessaloniki (and Rome), which confirms that urban characteristics were easier to simulate with this model.
Comparative boxplots between observed (blue boxes) and modeled values (red boxes), grouped by CLC, are shown in Figure 4. Classes for both sites appear to be balanced to a satisfying degree, fairly consistent with a normal distribution. The median (black line inside box) is fairly close to the center of the box, the whiskers are of approximately equal length, extending symmetrically from either side of the box, and data are equally spread around medians and whiskers. Modeled and observed boxes were overall even in size and medians are at the same level. However, this seems to be less the case for Agricultural Areas in Rome, which depict slightly disturbing uneven boxes. Indicatively, the largest difference between modeled and observed medians was detected in the category “Forest and semi-Forest natural Areas” in Rome (1.03 °C) and the minimum difference between medians was detected in the category “Artificial Surfaces”, again in Rome (0.01 °C). This confirms the conclusion stated above that non-urban areas are generally more complex for the model to represent. Boxes in Thessaloniki were shorter than Rome, suggesting that dispersion is smaller in the first city. However, in the case of Thessaloniki, the largest difference between modeled and observed medians was detected in the category “Artificial Surfaces” (−0.22 compared to 0.13 for “Forest and semi-Forest natural Areas”). This may be a result due to the narrow and elongated shape of the city of Thessaloniki.
Considering all of the above, model performance is considered satisfying based on MB, R and IoA, that are in line with previous studies [79,99,101]. Although there are studies showing that the WRF may perform better in urban than non-urban (agricultural and forest) areas [26,30], our study seems to agree with a significant body of literature demonstrating that the WRF model provides the most representative simulations over large urban areas across the world rather than forests, cropland and pasture areas [99,102,103,104,105].

4. Results and Discussion

4.1. Regional Temperature Changes over the Two Domains

Temperature is one of the meteorological parameters that is expected to be significantly affected until the end of this century. In this section, we provide an overview of the temperature trends occurring at present and in the future climate during summer and winter, focusing on the urban areas. As the topography, the distance from the sea and the existence of artificial structures (i.e., urban areas) can strongly impact on the surface temperature, an analysis of the entire domains of Thessaloniki and Rome should give a better insight of the present and future climate of urban and non-urban areas.
During summertime, the average temperature (Tavg) at 03UTC is ~22–24 °C along the coastlines in the metropolitan areas of Thessaloniki and Rome, while low-ground areas further to the inland present Tavg ~ 19 °C (Figure 5a–d). Such an impact is extended in a reverse way throughout the day (26–28 °C to 32 °C, respectively), regardless of the existence of urban areas. However, early in the morning (03UTC), urban areas of Rome and Thessaloniki present increased temperatures similar to those of the maritime/lake areas (Figure 5a,c). It is fairly illustrative the fact that the center of Rome is characterized by similar surface air temperatures (~23 °C) to the lake Bracciano located at the north-east of the city (Figure 5c). Similarly, the urban area of Thessaloniki seems to be the only area on the coastline extended to ~4 km to the inland, where Tavg at 03UTC is ~25 °C, as over Thermaikos Gulf at the south and lakes Koronia and Volvi at the northeast (Figure 5a). It should be noted that at 12UTC, parts of the urban areas of both cities present similar temperatures to the low-ground areas far from the sea (~32 °C). It is interesting though that generally, the temperatures along the coastlines at 12UTC are increased by ~1 °C in Thessaloniki compared to Rome, which could be attributed to the spatially restricted and shallow gulf of Thermaikos against the open sea body to the west of Rome.
In the middle of the century, the expected temperature increase is of the order of +0.9 °C along the coastline and +1.4 °C across the inland in both cities. Furthermore, until 2100, Tavg will increase by an order of +3.7 °C, over the coastline, to +4.7 °C, over the inland. While Tavg increase seems to be fairly uniform during the day/night around Rome (Figure 5g,h,k,l), temperature differences around Thessaloniki are higher by ~+0.4 °C during night/early morning compared to the noon (Figure 5e,f,i,j). Finally, it should be highlighted that Tavg increase is slightly larger over the domain of Thessaloniki by +0.2–0.3 °C compared to the domain of Rome. This finding may be associated with the presence of the large sea body to the west of Rome, which is in contrast to the much narrower sea body to the south of Thessaloniki. According to [106,107,108], a significant part of the increasing heat (due to global warming) is used by the evaporation mechanism over the sea, and thus the land/sea surface warming ratio varies between 1.36 and 1.84 [109]. Our results suggest surface land/coastal warming ratios between 1.2 and 1.5 (Figure 5e–l), in agreement with such studies.
Regarding the winter, it seems that the temperature variations, in general, are more subtle in both cities in the present climate. The urban areas present an increased temperature at 03UTC, by ~1 °C or slightly more (Figure 6a,c). At this time of day, the city of Thessaloniki seems to be colder by ~2–3 °C, relative to the maritime area, while the city of Rome is colder by ~4–5 °C than the temperature over the sea. However, Thessaloniki is colder than Rome by ~1 °C in an average winter, which can again be attributed to the lack of significant sea bodies nearby. At 12UTC, average winter temperature seems to be fairly similar (~11 and 13 °C in Thessaloniki and Rome, respectively) across low-ground areas (Figure 6b,d).
In the future climate, temperature changes are estimated to be smaller during winter compared to summer, while Rome exhibits minor increases (by 0.3 and 0.7 °C until 2050 and 2100, respectively) compared to Thessaloniki (Figure 6e–l). In particular, for the domain of Thessaloniki, there is a range of increase of 0.5–1.3 °C and 2.3–2.9 °C for the middle and the end of the 21st century. Respectively, these ranges are 0.3–0.9 °C and 1.8–2.5 °C for Rome. The temperature increase over the urban area of Thessaloniki appears to be around the middle of the above-mentioned ranges, with the exception of the very coastal urban regions at 03UTC during the period 2096–2100, which are in those with the largest increase (+2.7 °C). Nevertheless, the urban area of Rome is of the areas of the lowest increases within the ranges previously described. An exception is observed again at 03UTC, when the urban area demonstrates a large (comparatively to other areas) increase of +2.2 °C. It is observed that the warming land/sea ratio pattern does not follow the same trend as in summer. In fact, this ratio can be unity or even less in most cases, though preserving a high value of ~1.8 at 12UTC within the period 2046–2050.

4.2. Seasonal UHI Effect (UHI(s))

UHI effect shows different intensity in different seasons. In this section, we consider as UHI(s) the temperature difference between areas with urban and other land use areas (gray and other various colors respectively, in Figure 7 and Figure 8). Increased temperatures cause discomfort to local populations during summer, when there is significant heat load [36,37]. However, during the winter, this regime may be considered favorable in large cities due to lower energy demands for heating [110,111,112]. This seems to occur in both the cities we investigated in the current study, Thessaloniki and Rome (Figure 7 and Figure 8).
Generally, the UHI(s) effect has a significant impact on the minimum temperatures in both Thessaloniki and Rome during either winter (Figure 7c,d and Figure 8c,d) or summer (Figure 7a,b and Figure 8a,b) nights. For the reference period, minimum temperature (Tmin) in Thessaloniki within the urban area is on average ~7.3 °C, while it drops to ~4.5–5.5 °C in the suburban or rural areas around UHI(s) intensity ~+1.8–2.8 °C. It should be noted that west and north surrounding areas are colder, especially during the night, where average Tmin is lower by up to 0.5–1.5 °C when comparing with the eastern parts (Figure 7c,d). In Rome, Tmin is ~8.1 °C in the city and 6.2–6.5 °C in the suburban/rural areas, correspondingly (UHI(s) intensity ~+1.6–1.9 °C). During summer nights, Tmin in Thessaloniki drops to 21.9–22.7 °C on average in the rural areas, while in the urban area, Tmin remains at higher levels, ~24.9 °C (UHI intensity ~+2.2–3 °C). In Rome, Tmin in the city center is ~22.6 °C, while in rural and suburban areas, Tmin drops on average to ~20.5–20.6 °C, respectively (UHI(s) intensity ~+2–2.1 °C).
During the day, the UHI effect is practically eliminated or even reversed, especially in Thessaloniki. In particular, during winter in Thessaloniki, maximum temperature (Tmax) reaches 11.4, while in the surrounding areas, it fluctuates between 10.9 and 11.5 °C (UHI(s) intensity ~ −0.1–+0.5 °C). In a similar pattern, Winter Tmax does not exceed 13.7 °C on average in the center of Rome, while it varies between 13.1 and 13.9 °C in the surrounding areas (UHI(s) intensity ~ −0.2–+0.6 °C). During summertime, Tmax seems to be strongly affected by local factors (such as the topography), and thus the UHI effect is either weak or unclear. In Thessaloniki, Tmax reaches 31.3 °C, but in suburban/rural areas, Tmax can be between 29.6 and 31.7 °C. Theoretically, this means that the UHI(s) intensity may be between −1.7 and +0.4 °C. However, there are factors, such as the distance from the sea and consequently the impact of the sea breeze, that distort the UHI signature, especially in the summer. This can be seen in both cities. In Thessaloniki, areas west–northwest from the city are slightly warmer (by up to +0.4 °C). However, there is a sudden drop of Tmax (by −1.7 °C) at a location 12 km further to the southeast (Figure 7a), which is fairly close to the coastline. Possible reasons for this temperature drop may be the impact of the sea in combination with the land use (forest and semi-natura areas; this particular grid point falls into the category of scrub and/or herbaceous vegetation associations—sclerophyllous vegetation). In a similar pattern, in Rome, Tmax slightly increases (up to +0.1 °C) when comparing urban to northern surrounding areas, while it decreases (up to −3.2 °C) moving from the urban area to the southern surroundings located close to the sea (Figure 8a; regions at +16–30 km further to the south). In both cities, when moving further to the inland (Figure 7b and Figure 8b), the UHI(s) intensity during the day is reversed by up to 1.1–1.3 °C.
Looking to the future, and considering that geometry and size and all the traits of the cities remain the same, the UHI effect across the cross-sections of Figure 7 and Figure 8 seems to not significantly change. The temperature is expected to increase almost uniformly in and around the cities of Thessaloniki and Rome. Thus, we should expect an increase of winter (summer) Tmin by +0.4 °C (+1.2 °C) and +2.1 °C (+4.1 °C) in Rome and by +0.8 °C (+1.2 °C) and 2.7 °C (+4.3 °C) in Thessaloniki by 2050 and 2100, respectively. Similar changes are predicted for Tmax.

4.3. The UHI from Classified Grid Cells

In this section of the current study, we try to analyze and compare urban and non-urban grid cells with similar geomorphological characteristics (such as altitude and distance from the sea).

4.3.1. Temperature Diurnal Cycle

Firstly, we try to detect any changes regarding the UHI effect along the diurnal cycle until the end of this century during summer and winter, comparing to the reference period. For the city of Rome, it seems that there are no significant changes or clear trends in the UHI effect during both seasons. Nevertheless, we should note that by 2100, during summertime, UHI seems to be enhanced by +0.1 °C between 6 and 18UTC in the low-level urban area (thus the city center) (Figure 9b). Meanwhile, coastal urban areas appear to be cooler by −0.1 °C on summer nights (21-00UTC) (Figure 9d). In winter, the only change is observed in the night–morning (18-06UTC) in coastal areas, by up to +0.15 °C. Significant changes were also not observed in Thessaloniki. However, some trends may need further discussion. During winter, there is a decreasing trend (by ~−0.1 °C) of the UHI between 15 and 21UTC in all classes. In summer, UHI is expected to be weaker by 2100 in the morning (0–9UTC) by up to −0.23 °C in coastal and low-level areas, and −0.14 °C in elevated areas (Figure 9a). In contrast, UHI seems to strengthen by <0.1 °C during the afternoon (12–18UTC) by 2100 in all areas, except for coastal, where UHI enhances by 0.2 °C (Figure 9b).

4.3.2. UHI under Tropical Nights

It is also of high importance to examine the UHI effect during periods of increased heat stress, when urban populations are affected the most. For this reason, we present UHI statistics for days with Tmin ≥ 20 °C or tropical nights as they are defined [113]. It should be noted that such nights, following a heatwave day, can add extra heat stress and discomfort to populations. For both cities, urban areas of the classes “coastal” and “low-level” exhibit a larger number of tropical nights per year, while elevated areas in urban and rural areas present similar frequency (Figure 10). In particular, coastal urban areas are characterized by the largest frequency of tropical nights per year compared to the other two classes. For the coastal class, the urban/reference (from now on, we will refer to the rural/non-urban areas as reference areas) areas of Thessaloniki exhibit 81/60, 120/78 and 209/120 tropical nights per year during the periods 2006–2010, 2046–2050 and 2096–2100, respectively (Figure 10a). This suggests an increasing urban/reference ratio of tropical nights by the end of the century, from 1.35 to 1.74. For Rome coastal areas, tropical nights appear 82/63, 120/82 and 210/125 times per year during the periods 2006–2010, 2046–2050 and 2096–2100, respectively (Figure 10b). This results in slightly lower ratios from 1.3 to 1.68 until the end of the 21st century compared to Thessaloniki. Regarding the low-level areas, there is also an increasing trend from 74 (73) to 148 (144) tropical nights per year for Thessaloniki (Rome). However, the ratio between urban and reference tropical nights seems to remain the same (~1.16) until 2100 in both cities, with an insignificant increase to 1.19 for Thessaloniki. Elevated areas present an increase from ~50 to ~120 tropical nights per year, exhibiting a ratio of ~1.
Deepening this analysis, it was found that coastal urban areas (in both cities) in the present climate are characterized by ~20 extra tropical nights per year, with Tmin between 20 and 23 °C compared to reference areas in both cities, which will increase to ~90 extra tropical nights per year by 2100 (Figure 11a and Figure 12a). Minimum Discomfort Index (DImin) between 24 and 27 °C also presents an increasing trend in the future. However, the urban coastal areas will exhibit only 6 extra tropical nights per year in Thessaloniki, with DImin between 24 and 27 °C, and just 3 more tropical nights per year in Rome by the end of the century (Figure 11b and Figure 12c). Regarding Tmax and maximum Discomfort Index (DImax), there were no significant trends in both cities, except for cases of DImax 27–29 °C (where most of the population suffers discomfort), in which urban areas of Thessaloniki will present almost 5 more days per year with such DImax (Figure 11 and Figure 12c,d).
Focusing on the low-level urban areas, it seems that Tmin > 26°C will be recorded during 7 more days per year by 2100 in both cities compared to the reference areas, where in the present climate there is no difference between them (Figure 11e and Figure 12e). Another significant finding is the fact that DImin between 24 and 27 °C (a regime where >50% of the population feels discomfort) will be observed on 7 extra nights per year compared to the reference area in both cities. In addition, extra days with DImin between 27 and 29 °C (at which most of population suffers discomfort) will increase by 1 per year in the urban areas relative to the reference areas (Figure 11f and Figure 12f). Although extra days in urban areas in both cities with Tmax > 30 °C will increase from ~30 in 2010 to ~90 per year by 2100, urban areas will present ~20 more days per year with DImax ≤ 24 °C, which may be due to the relatively drier environment of the urban environment throughout the day (Figure 11 and Figure 12g,h). Additionally, it should be noted that the number of extra days with DImax between 24 and 27 °C in reference areas will decrease by ~40 per year in both cities, which also suggests a warming urban environment.
Finally, concerning the elevated areas, it seems that there are no significant trends in the differences of the number of the days of all the aforementioned classes between urban and reference areas of Thessaloniki, fluctuating around an order of ±2 days per year. In other words, urban and reference elevated areas do not demonstrate significant differences in the present, which will be preserved in the future (Figure 11i–l). On the other hand, urban areas of Rome may present some trends. Urban elevated areas will present 5 extra days of Tmin between 20 and 23 °C compared to reference ones by 2100, up from just 2 extra days in the present. Furthermore, tropical nights in reference areas with Tmin ≥ 26 °C will increase to an extra 3 compared to the urban areas, up from just 1 in the present (Figure 12i). Such changes do not seem to have a significant impact on DImin (Figure 12j). However, extra days with Tmax ≥ 36 and DImax between 27 and 29 °C in urban elevated areas will increase by 2 days until 2100 (Figure 12k,l).

5. Conclusions

High-resolution simulations (2 × 2 km) were carried out with WRF-ARW coupled to a single-layer urban canopy model for the two Mediterranean cities, Thessaloniki and Rome, in the framework of the LIFE-ASTI project (https://app.lifeasti.eu/, accessed on 6 July 2021), for the period 2006-2010, referred to as the reference period, and the two future periods 2046-2050 and 2096-2100. The simulations were conducted under the RCP 8.5 emission scenario, considering no changes in the structure and size of the cities. The model evaluation with observed data based on statistical measures, such as MB, R and IoA, indicated that the overall model’s performance is satisfactory.
It should be noted that the current analysis did not include any possible future changes in the land use of the two cities and the surrounding areas. Furthermore, any future changes in urban pollutant emissions were not considered. Therefore, the present work was a sensitivity study of UHI as affected by the warming level raised due to the well-mixed greenhouse gases, though preserving the land use and local air pollution as fixed and non-interactive. In addition to the previous limitations, we should highlight the fact that the empirical approach of the flow pattern (turbulence, eddy circulation, etc.) cannot represent the interaction between temperature and velocity fields appropriately, adding an extra uncertainty on the simulation outputs [114].
In order to investigate the UHI effect in the two cities, we followed two approaches. The first approach was based on the use of representative horizontal cross-sections, spanning both urban and surrounding areas with similar environmental characteristics. The second approach was based on grid cell classification of the simulated data into six classes, namely, coastal urban, coastal reference, low-ground urban, low-ground reference, elevated urban and elevated reference.
Regarding the entire domains of Thessaloniki and Rome for the summer and winter climate, we noted the following:
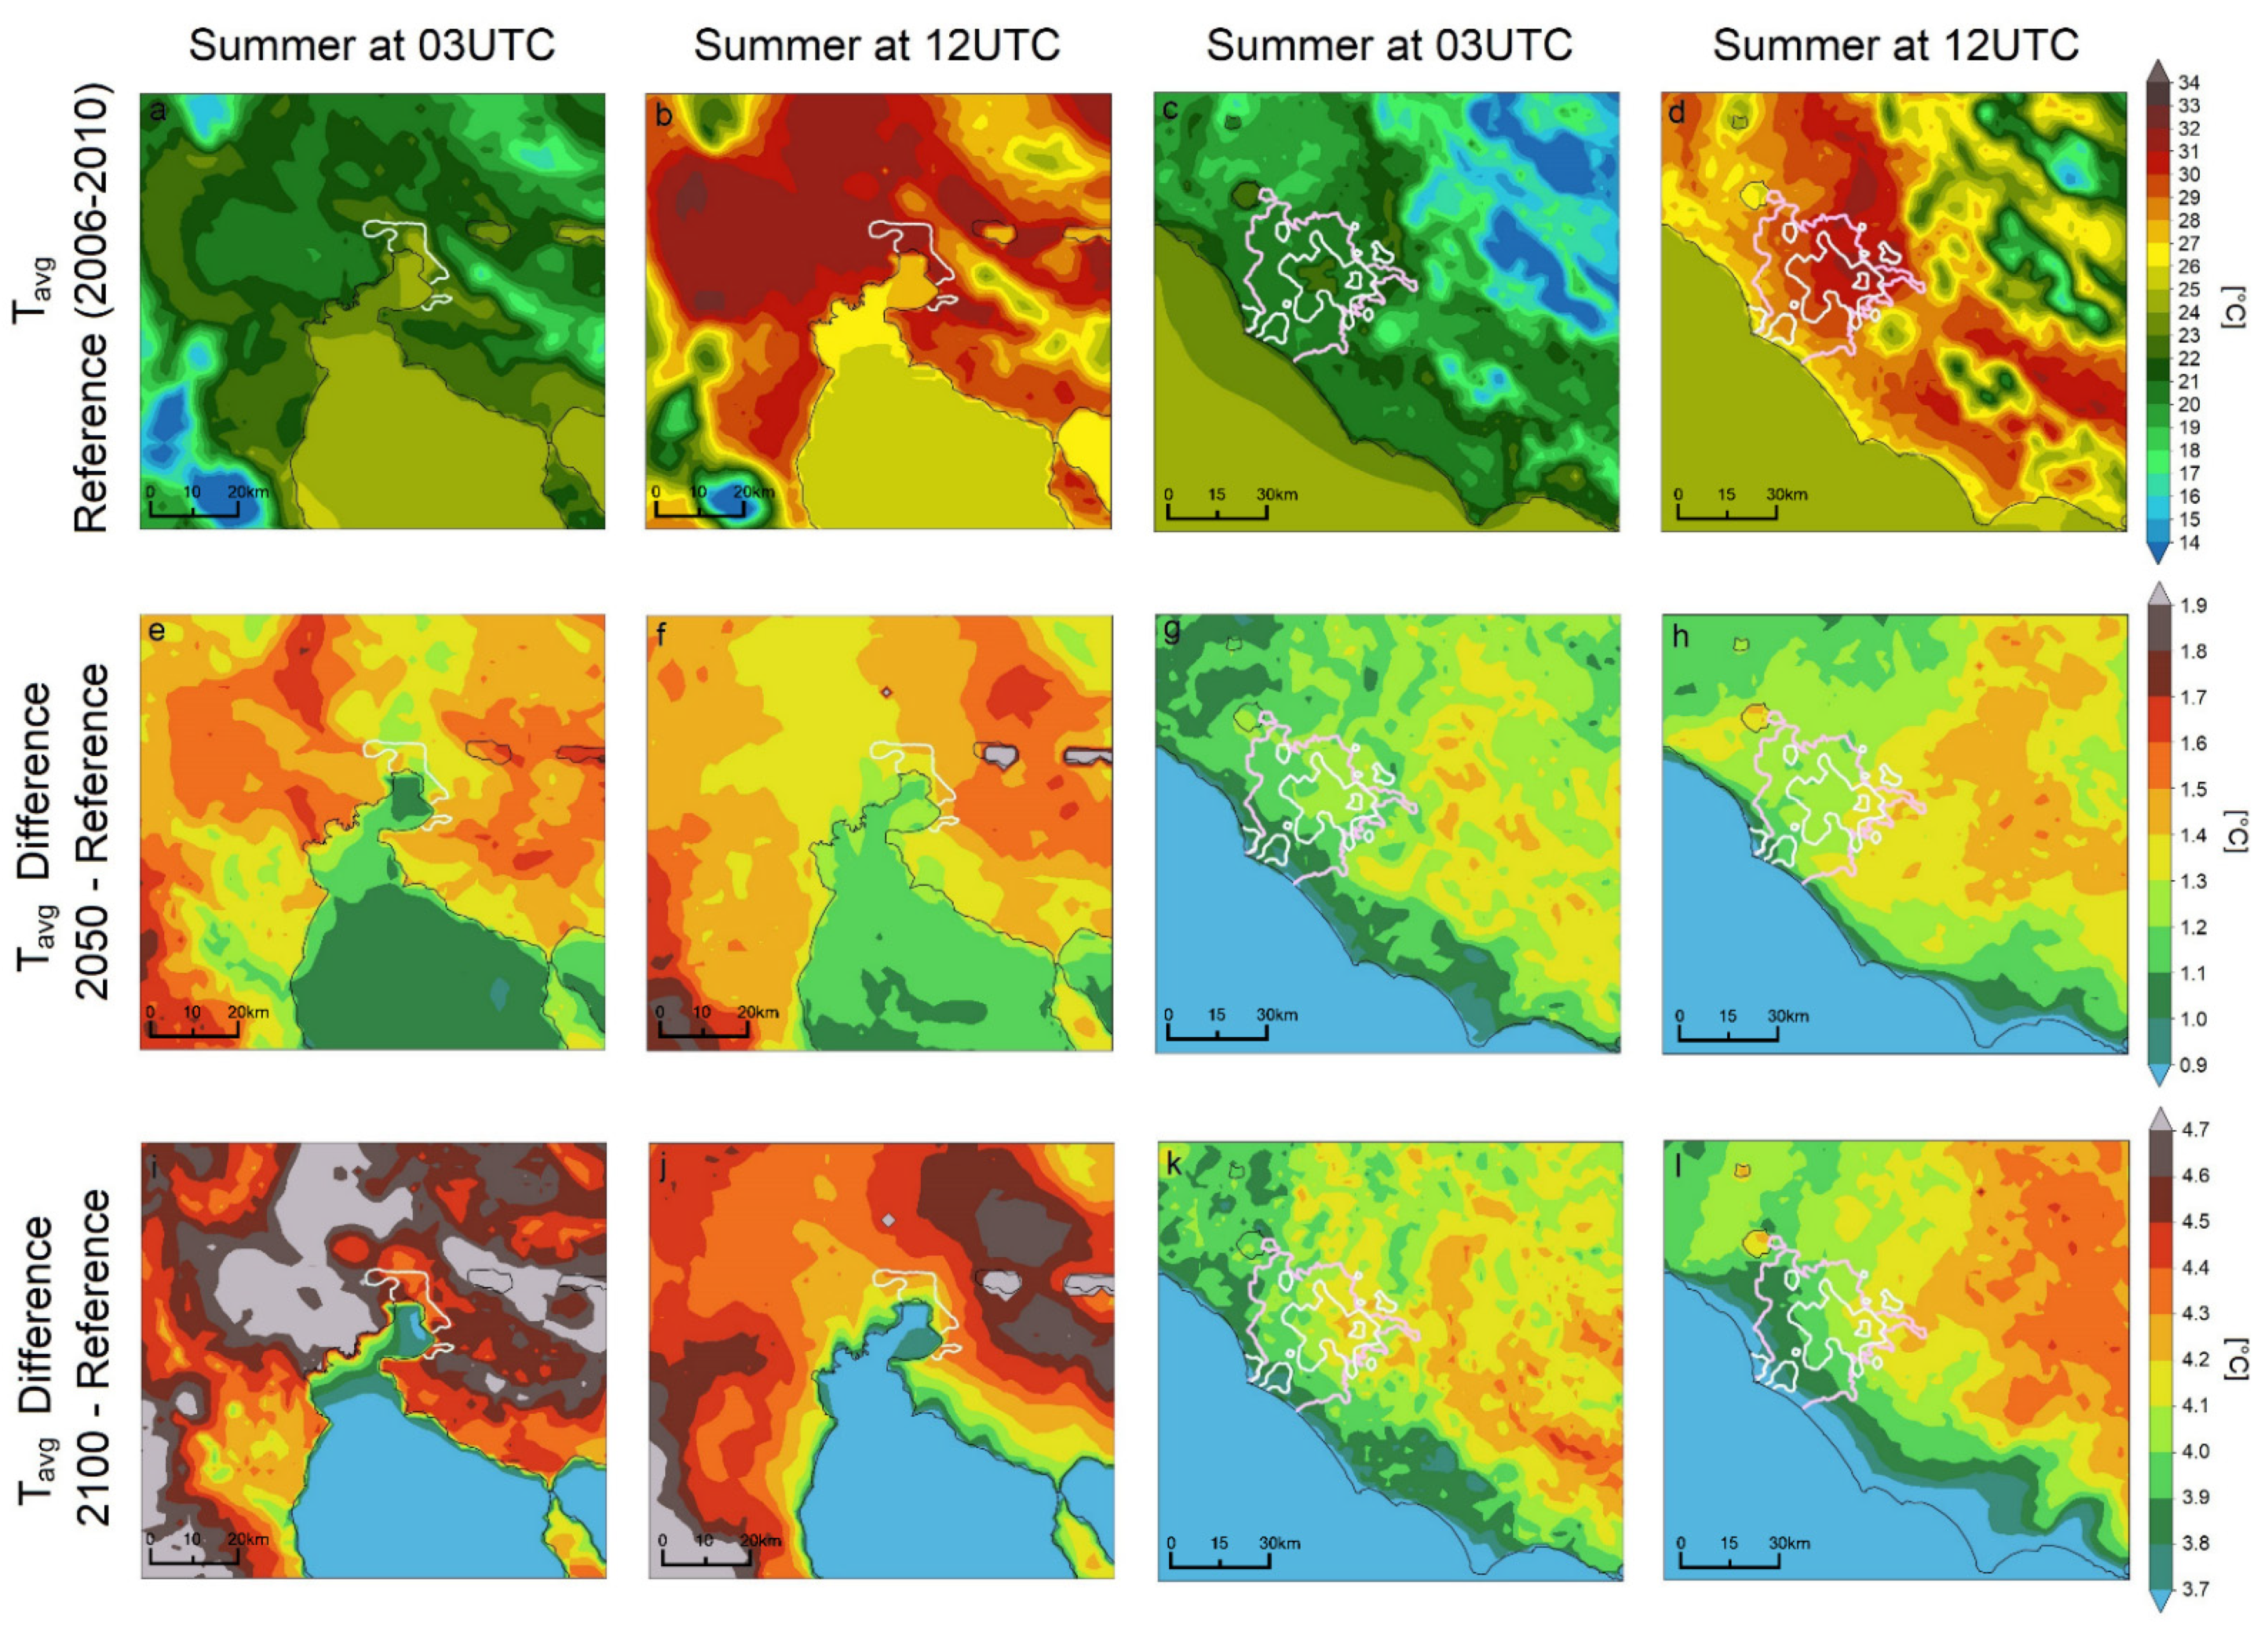
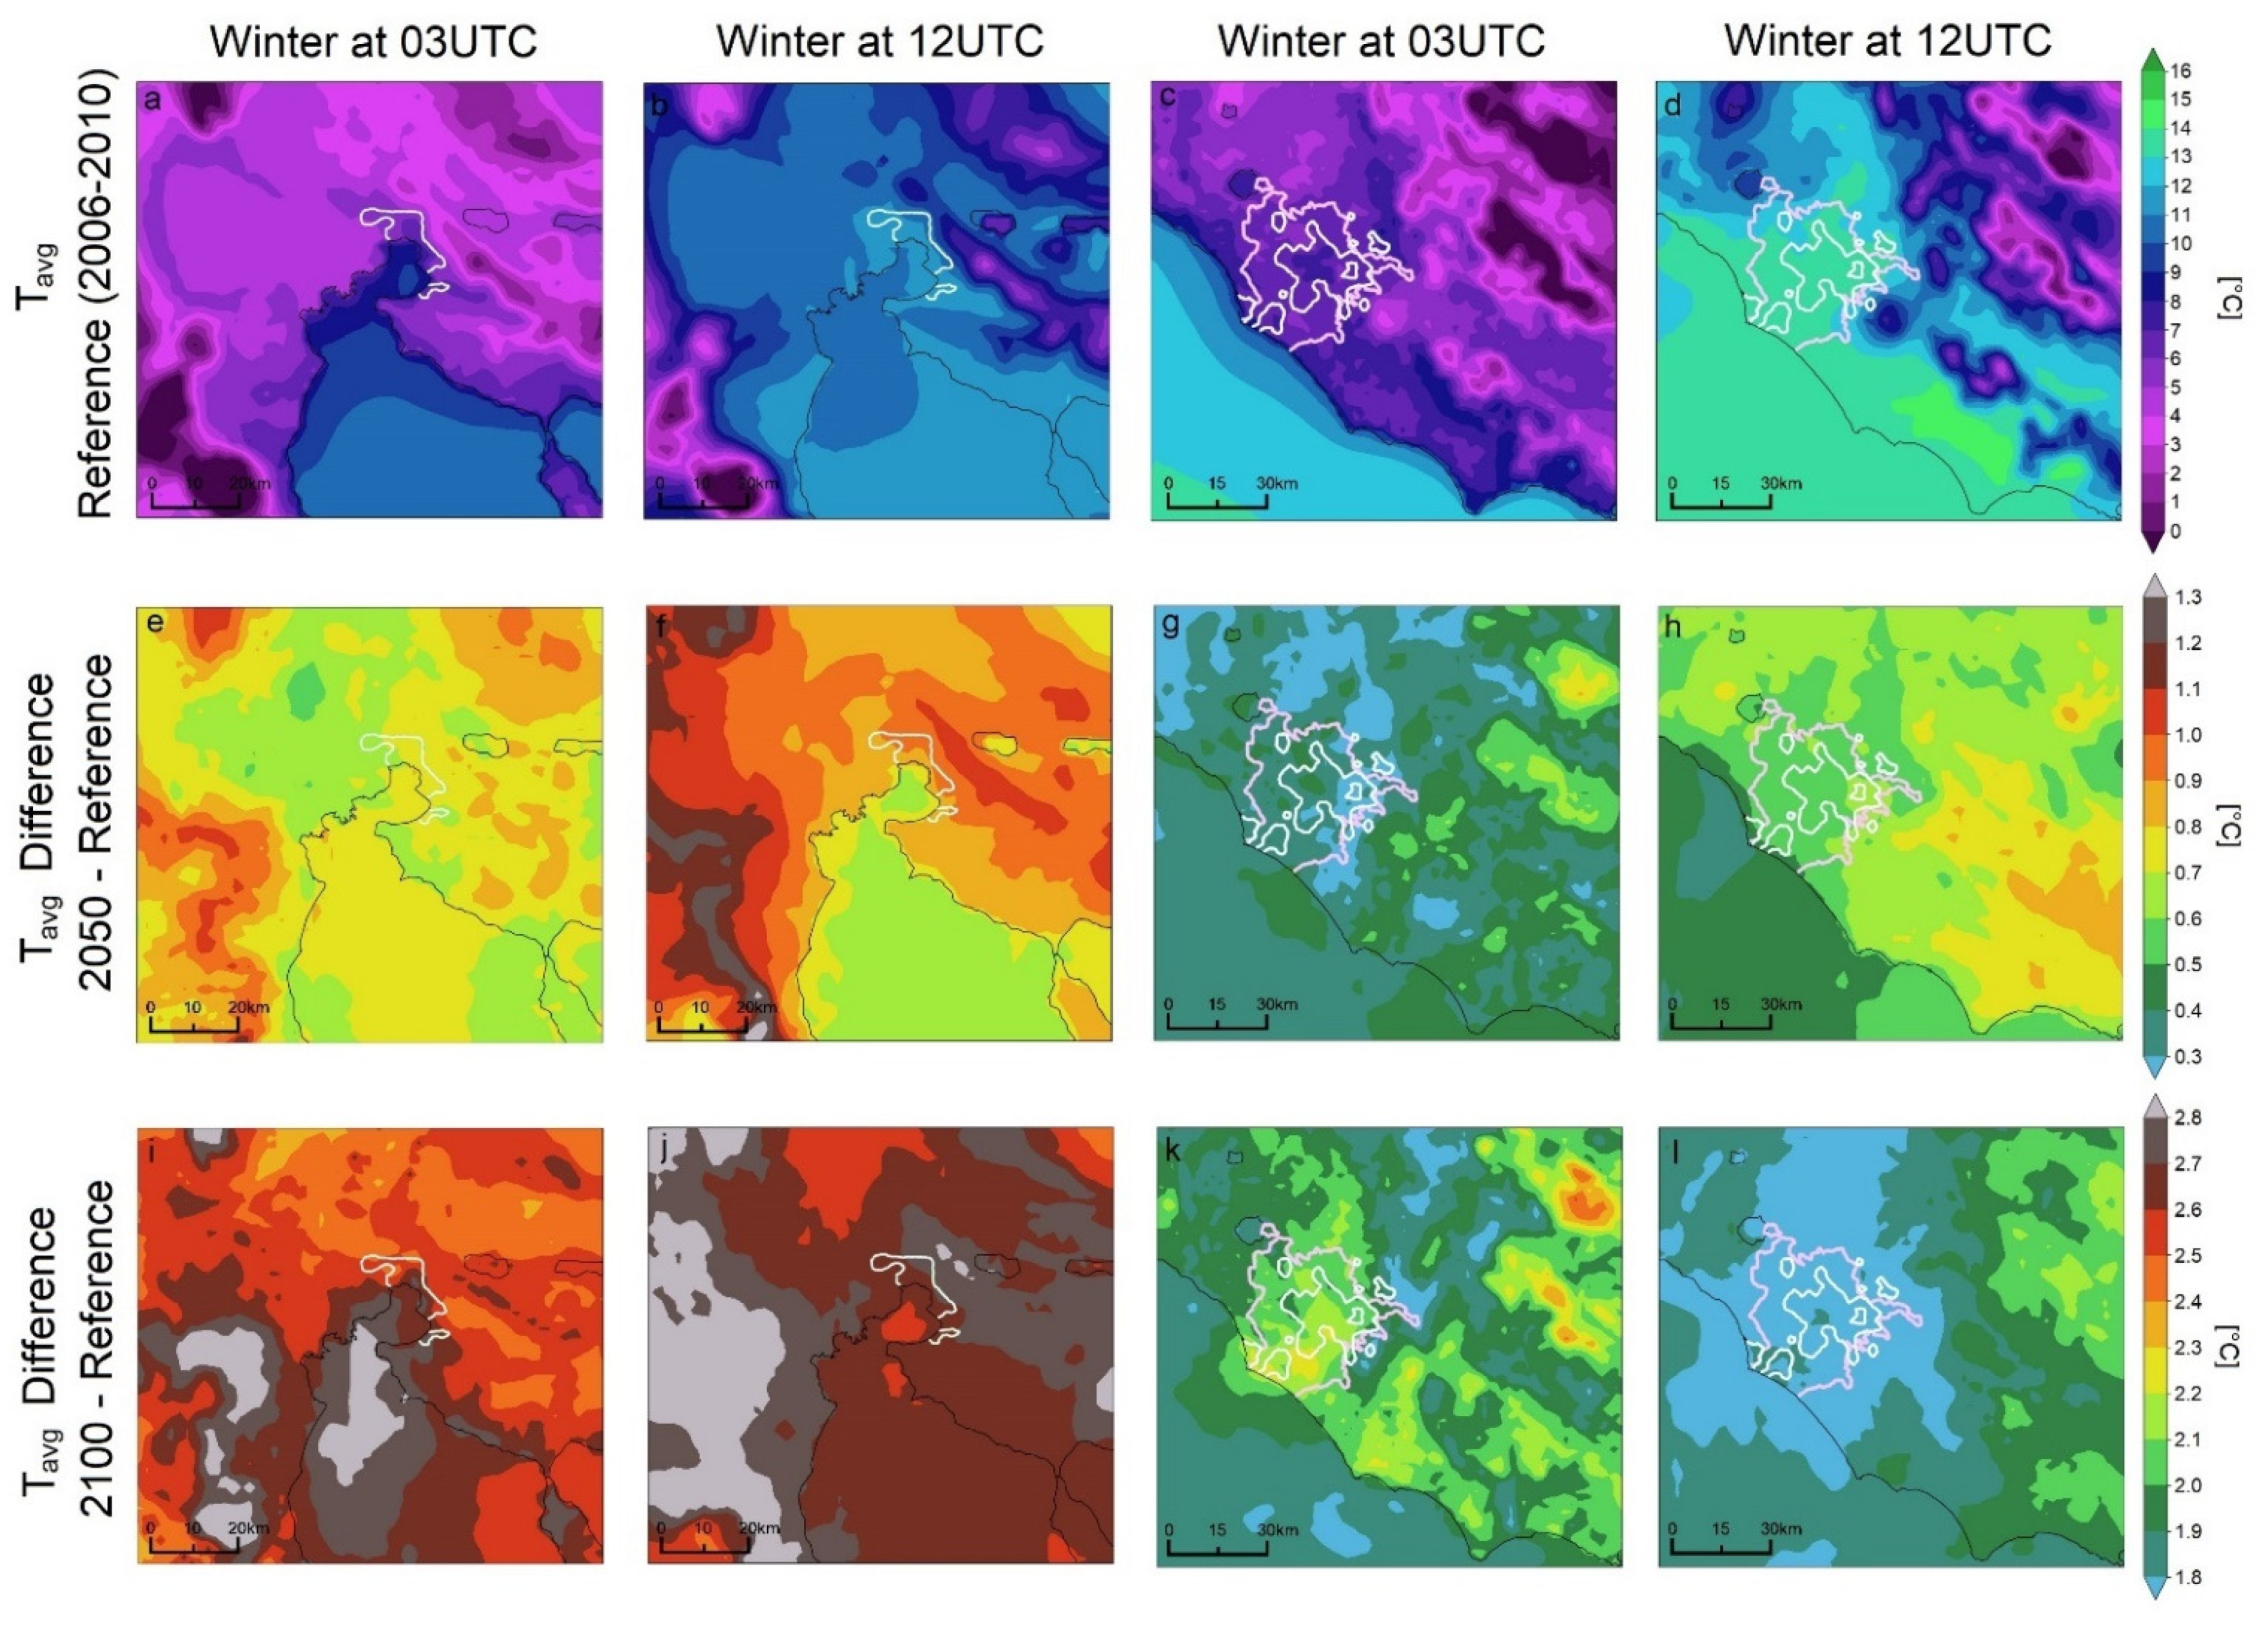
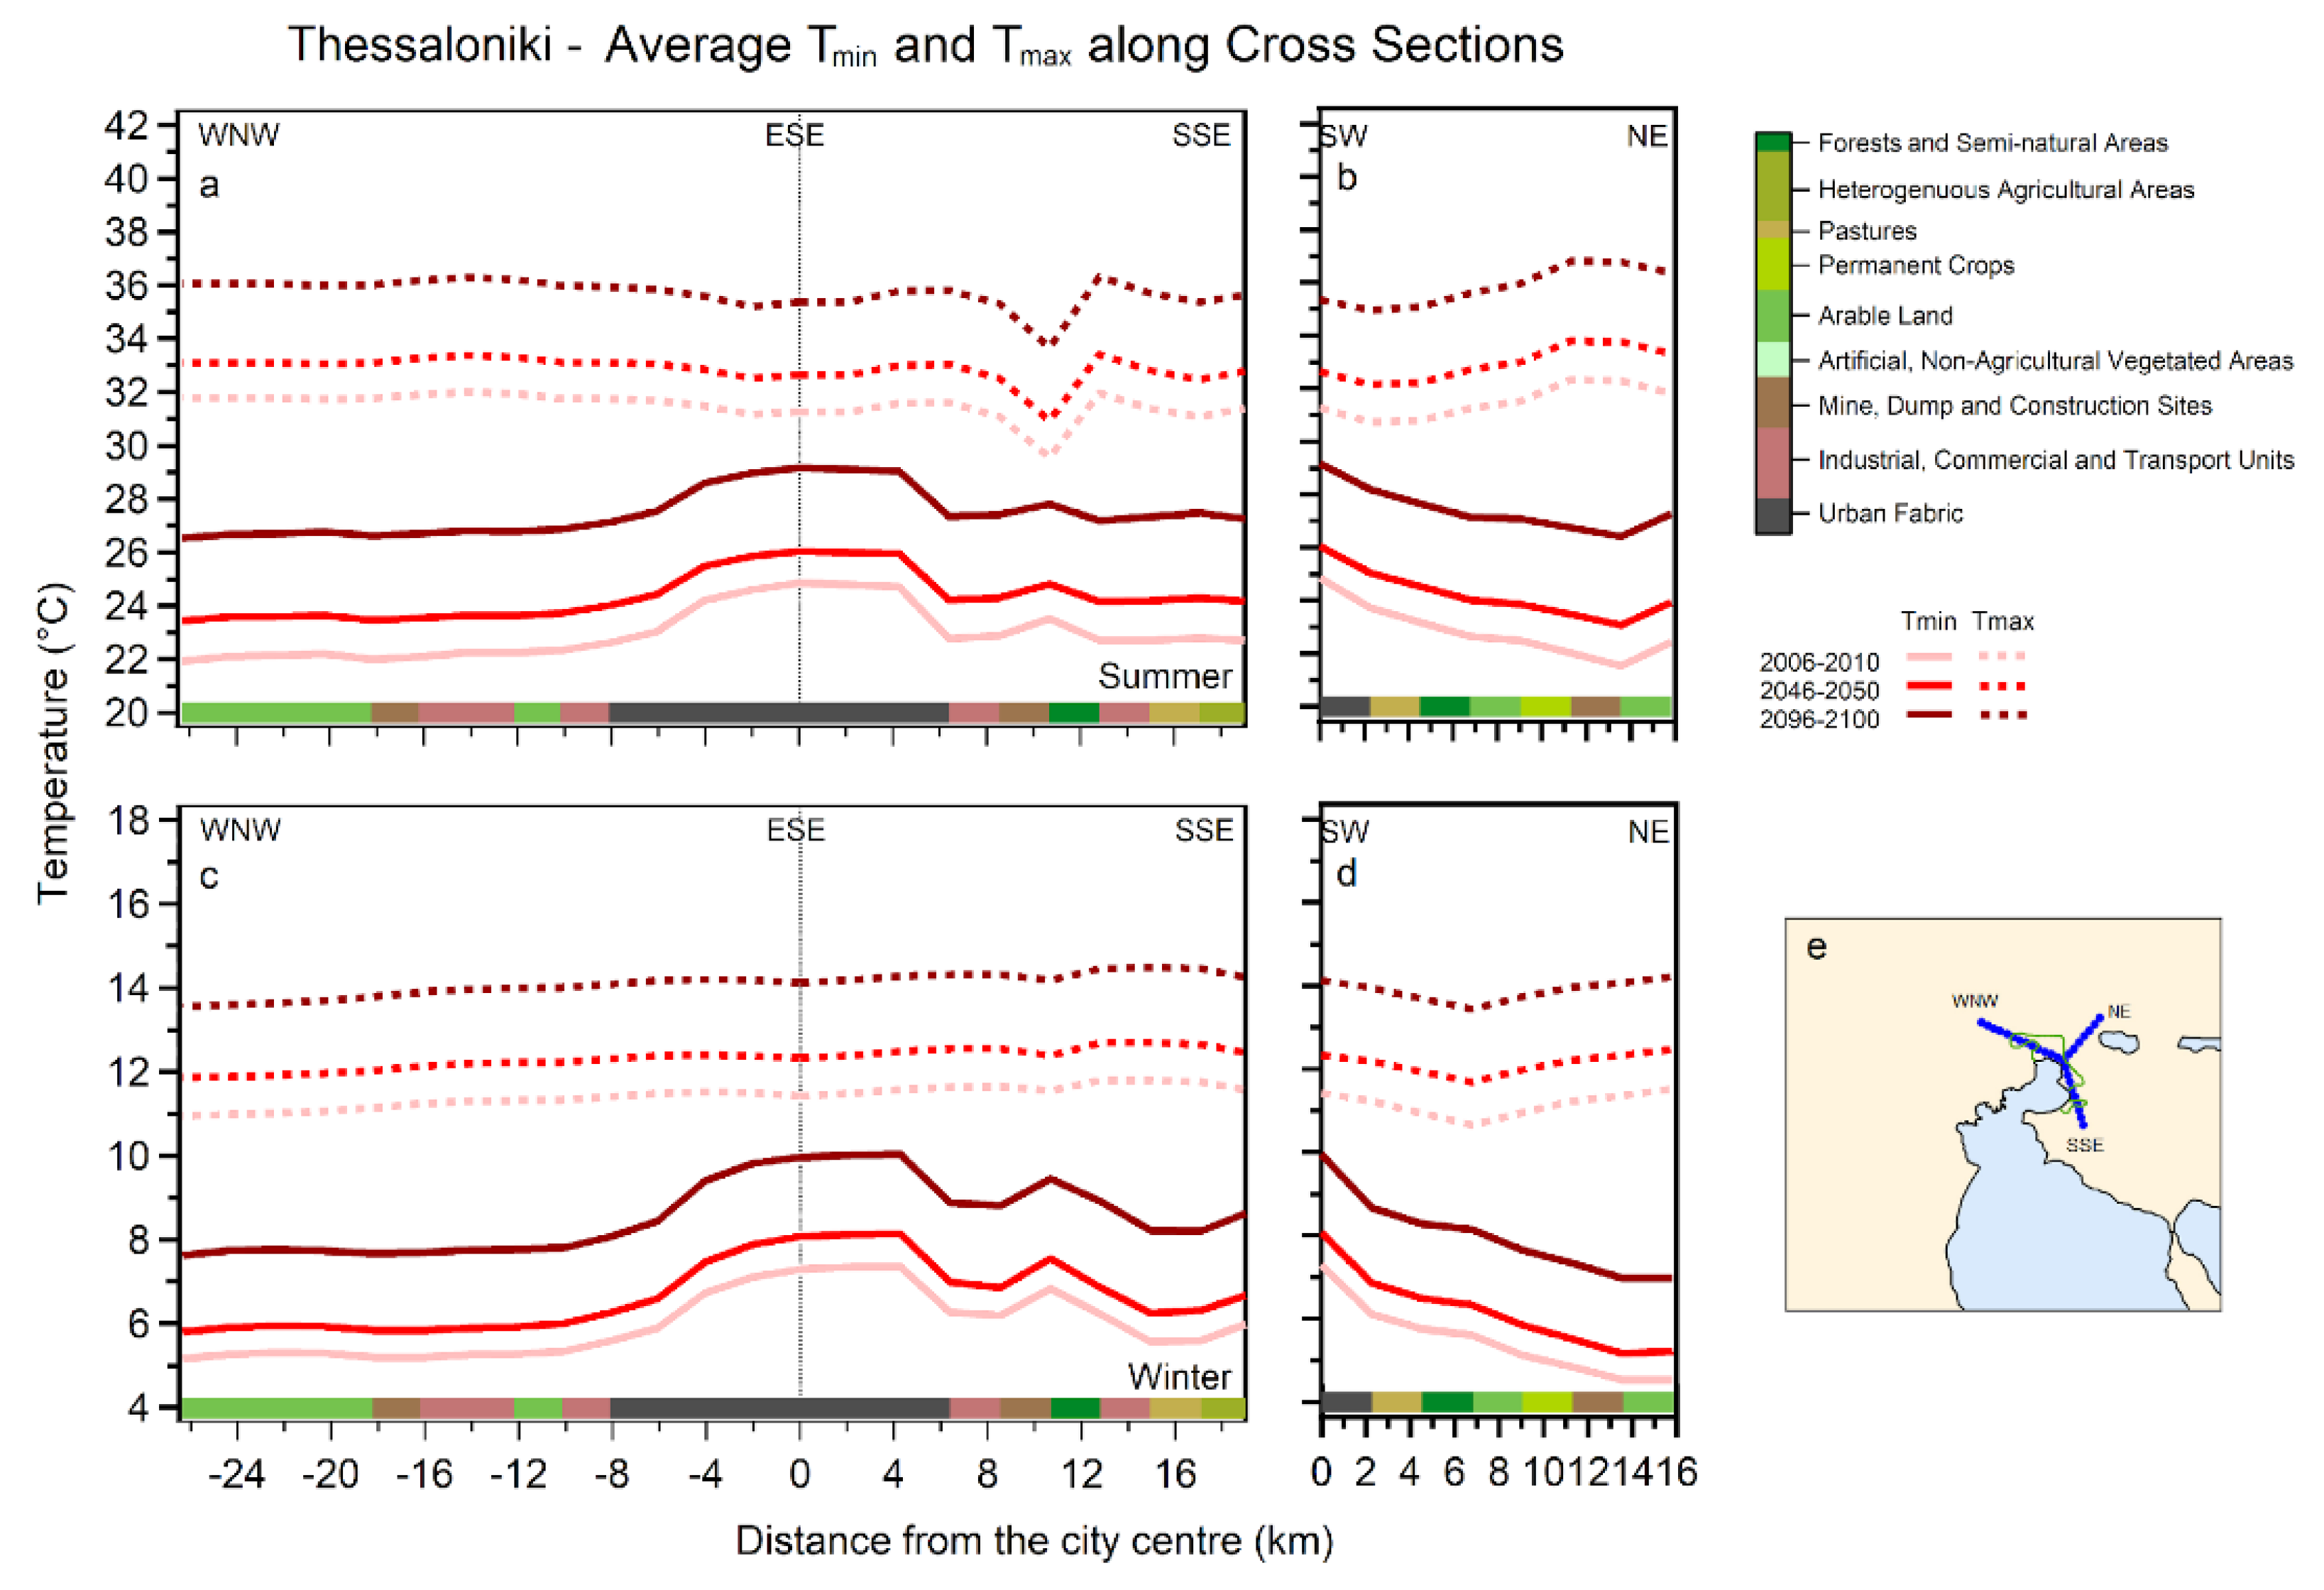
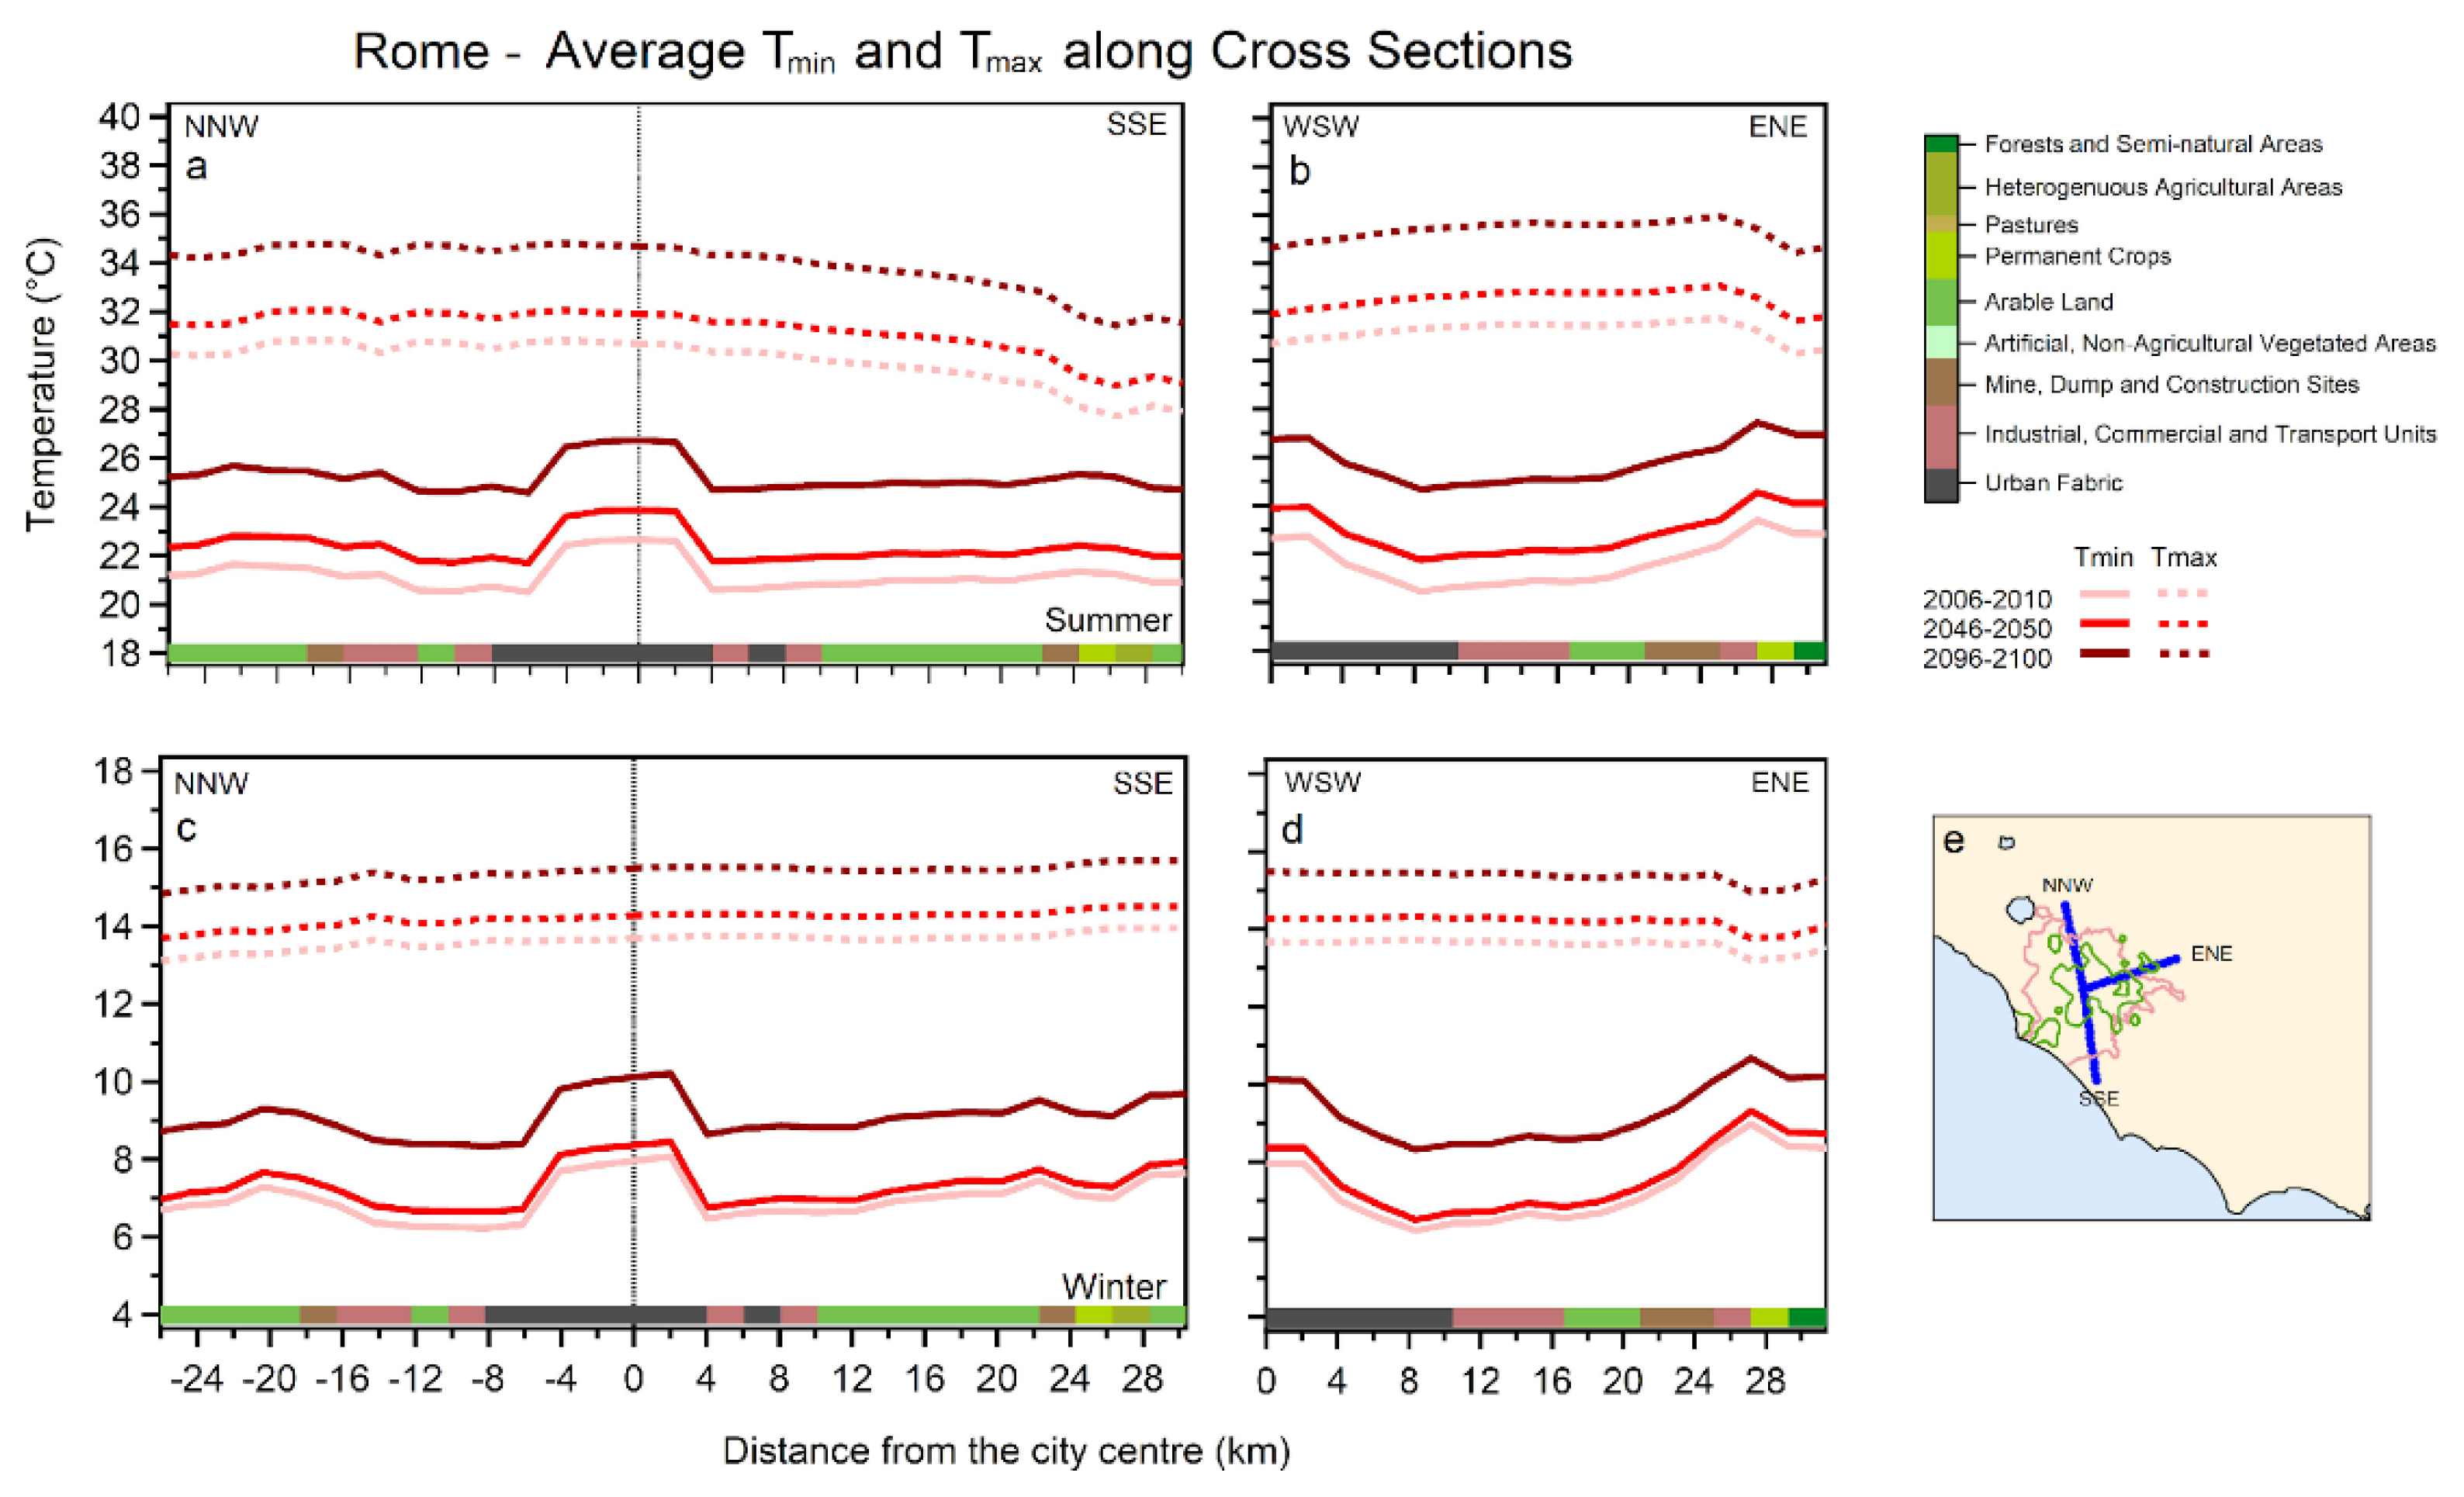
  • During the summertime of the reference period, the coastal areas (including the urban areas) for both the domains of Thessaloniki and Rome exhibit an average temperature range between 23 and 27 °C (at 03 and 12UTC), while the low-ground areas far from the sea show a wider range (19-32 °C).
  • The average temperature under the business-as-usual scenario is expected to increase by ~1.5/4.5 °C and ~1.3/4.2 °C in summer and ~0.8/2.6 °C and ~0.6/1.8 °C in winter until 2050/2100 in the domains of Thessaloniki and Rome, respectively.
Focusing on the traits and changes of the UHI simulated for the two cities, we conclude that:
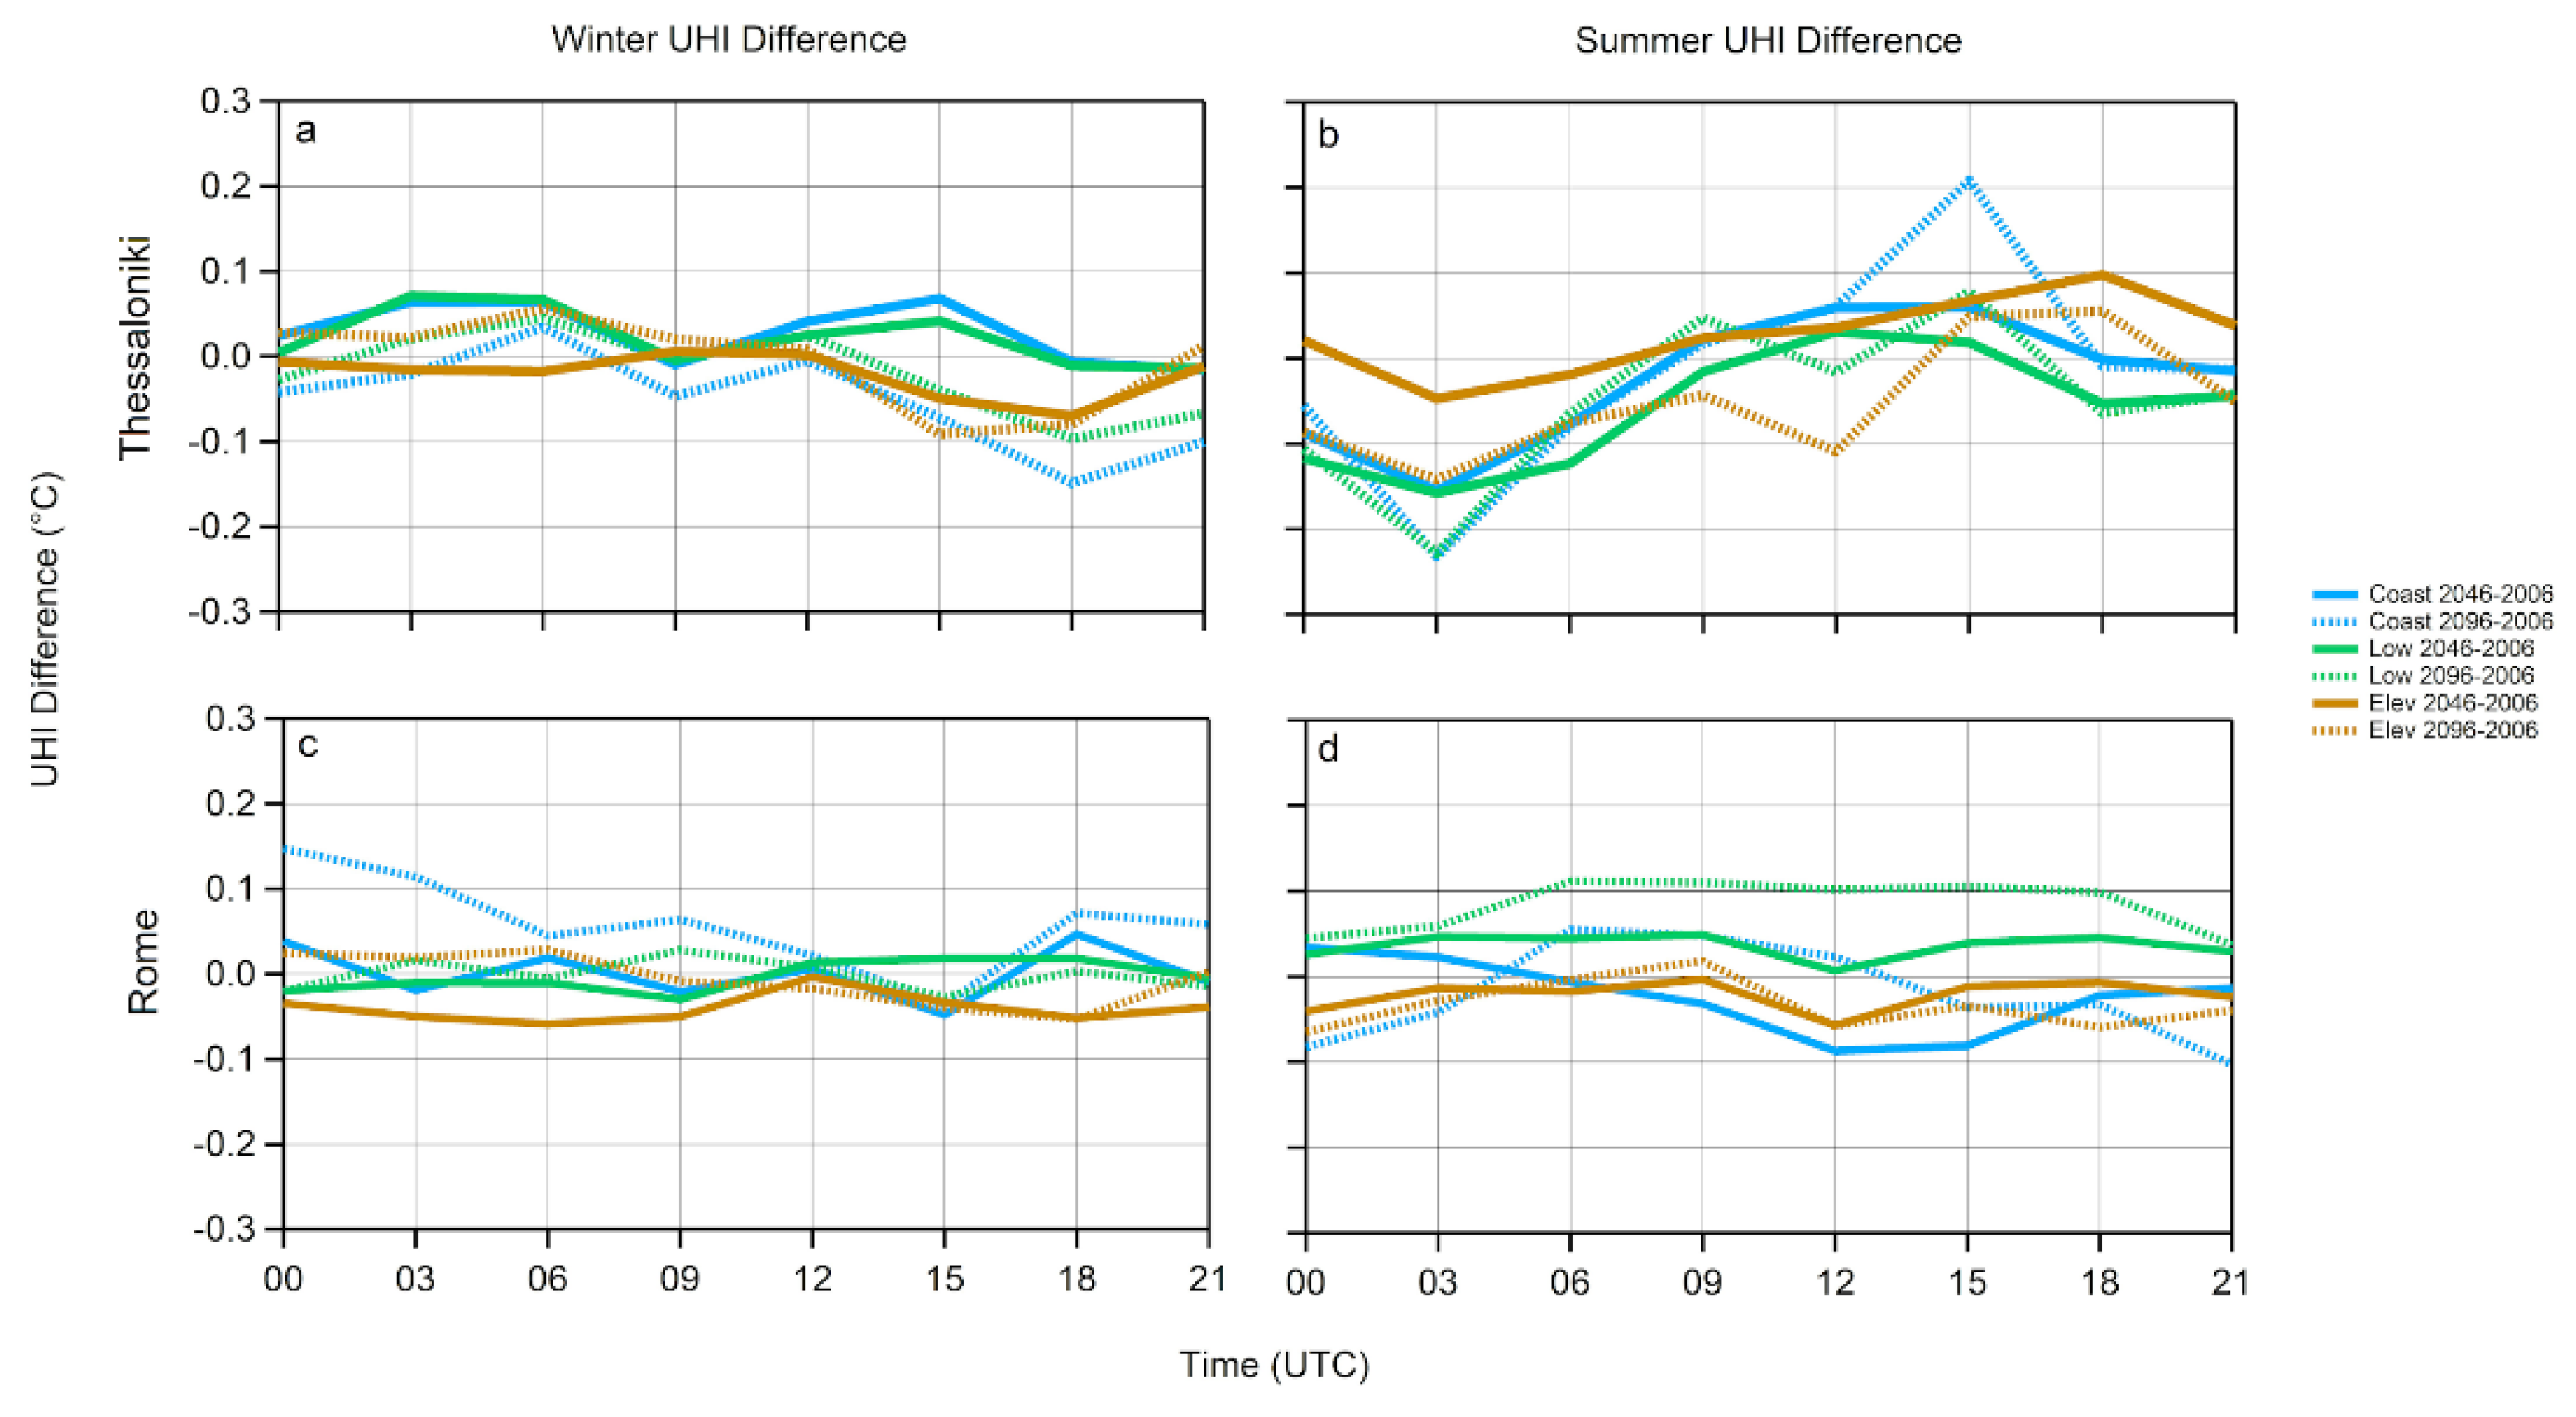
  • Urban areas of Thessaloniki and Rome exhibit an UHI(s) intensity of +1.8-2.8 °C and +1.6-1.9 °C in the winter and +2.2-3 °C and ~+2 °C in the summer, respectively.
  • The UHI(s) effect exhibits higher variation in Thessaloniki (than in Rome) due to its complex surrounding landscape. Thus, west and north low-ground surrounding rural areas are colder (by 0.5-1.5 °C) than eastern ones.
  • In both Thessaloniki and Rome, the UHI on an average winter or summer afternoon can be around 0 °C.
Finally, following the grid cell classification, we found that UHI may present different characteristics at each of the three classes (coastal, low-ground, elevated) in the future. The most important conclusions are mentioned below:
  • Although UHI changes insignificantly until the end of the century, some changes may be detected. Rome urban low-ground areas seem to exhibit a change of +0.1 °C UHI intensity in summer daytime in contrast to coastal areas, which present a negative UHI intensity trend of −0.1 °C on summer nights. In Thessaloniki, the largest UHI changes are expected along the coastline in summer, where UHI tends to increase by +0.2 in the afternoon and decrease by −0.2 in the morning. The latter decrease seems to occur in all classes. Winter UHI changes are fairly subtle (around or less than 0.1 °C) in both cities.
When we chose to analyze the UHI effect under the criterion of Tmin ≥ 20 °C in the low-ground urban area, it seems that both cities present similar trends. Here, we summarize the most important findings:
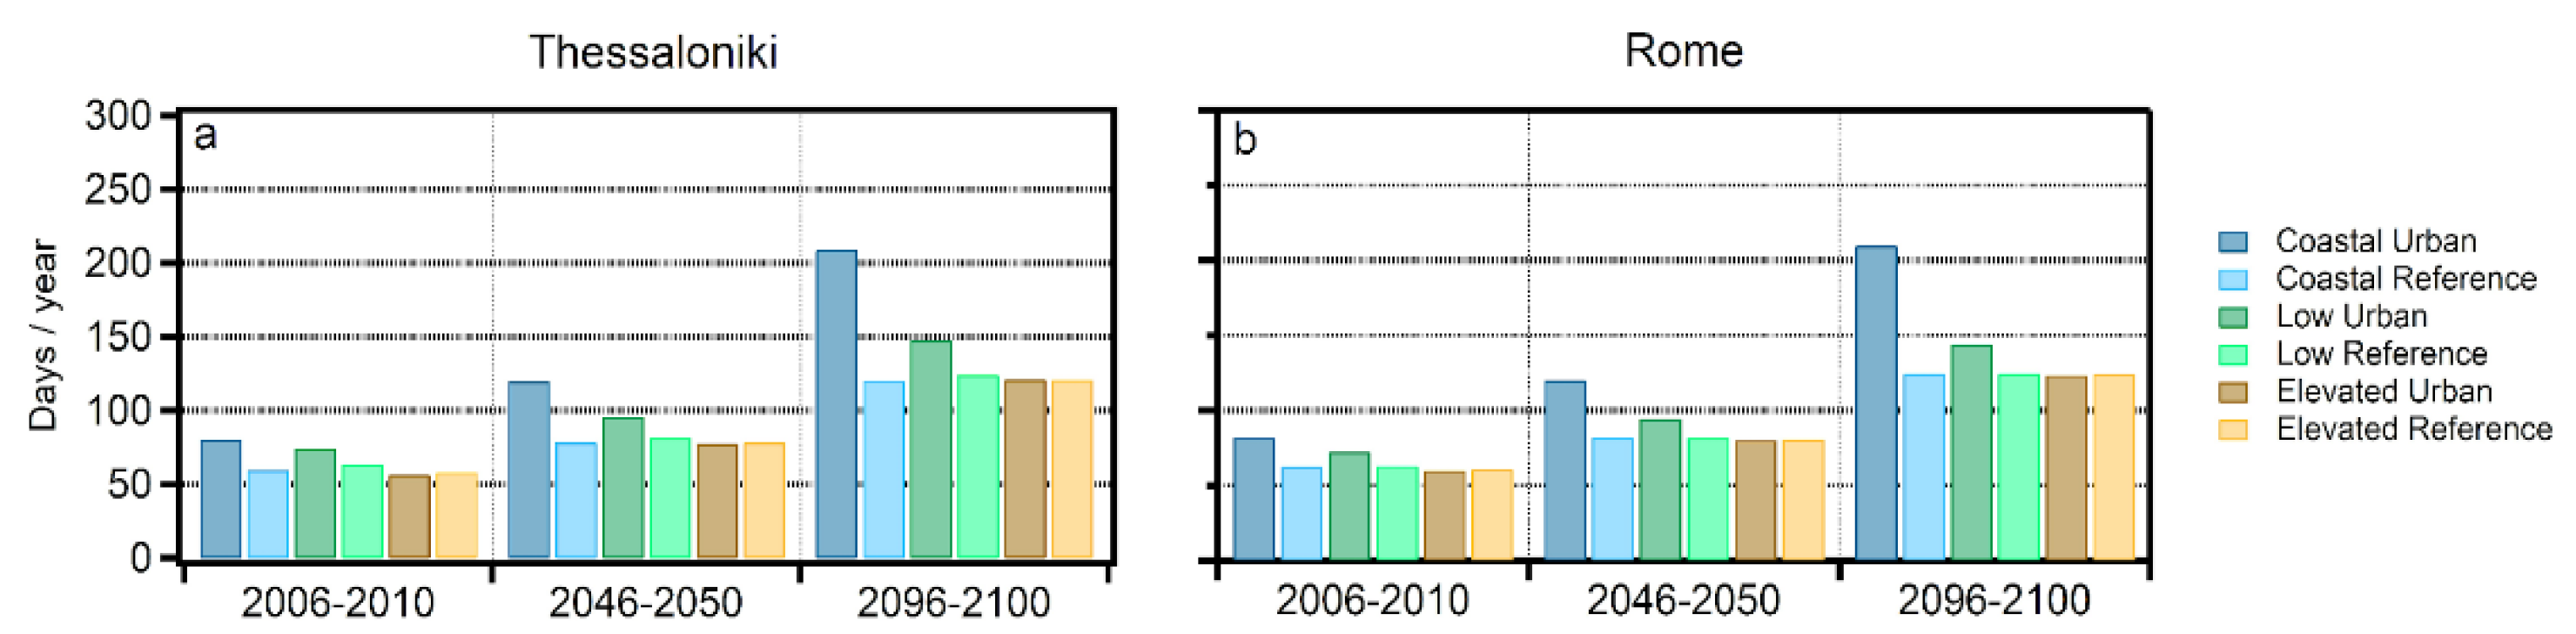
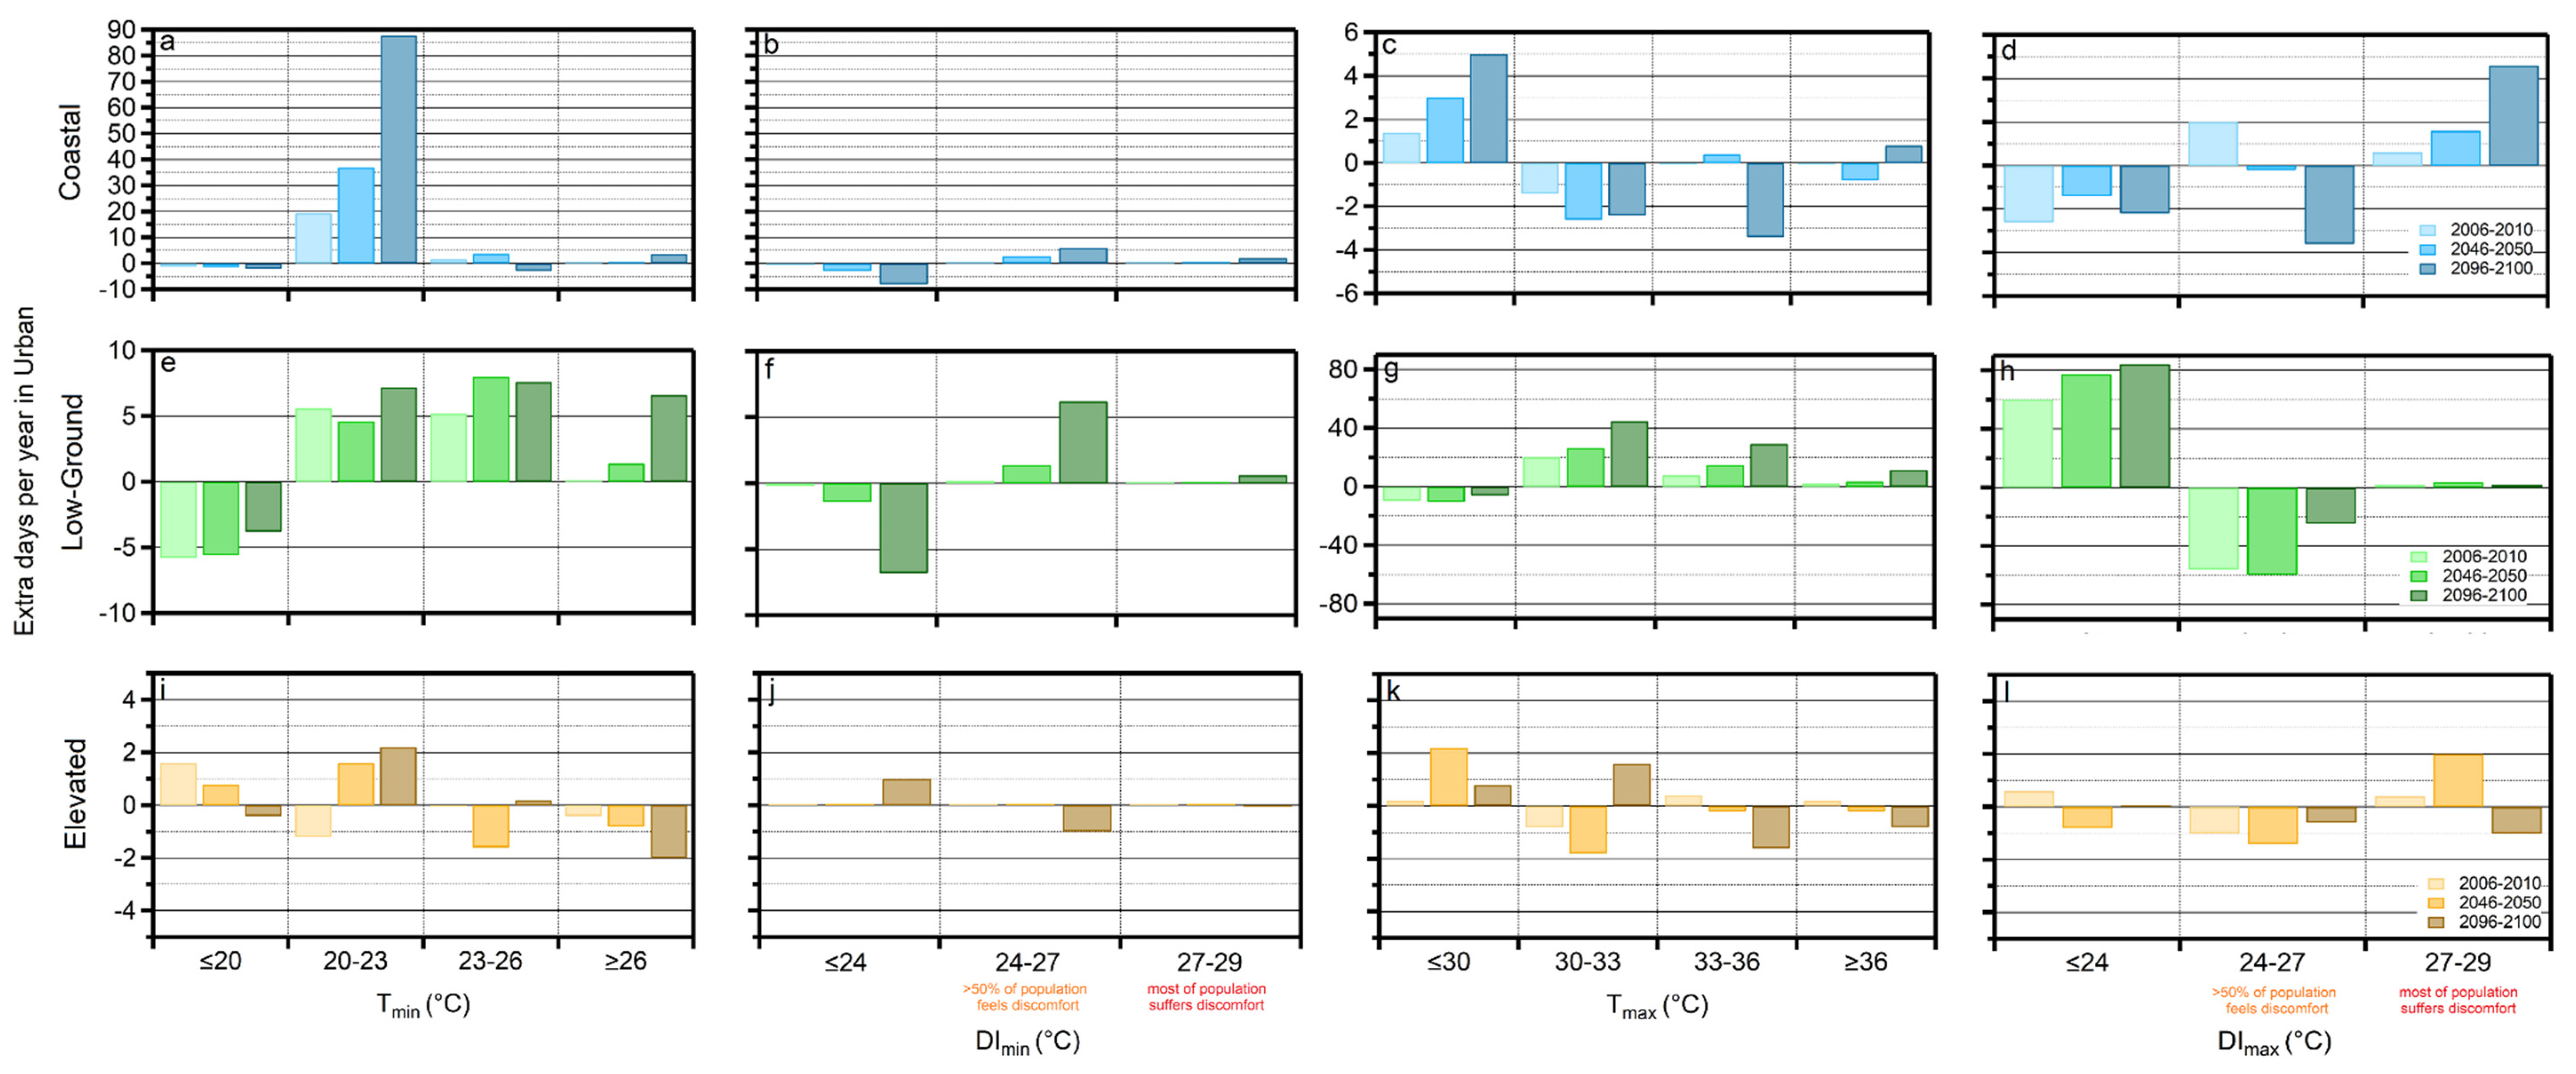
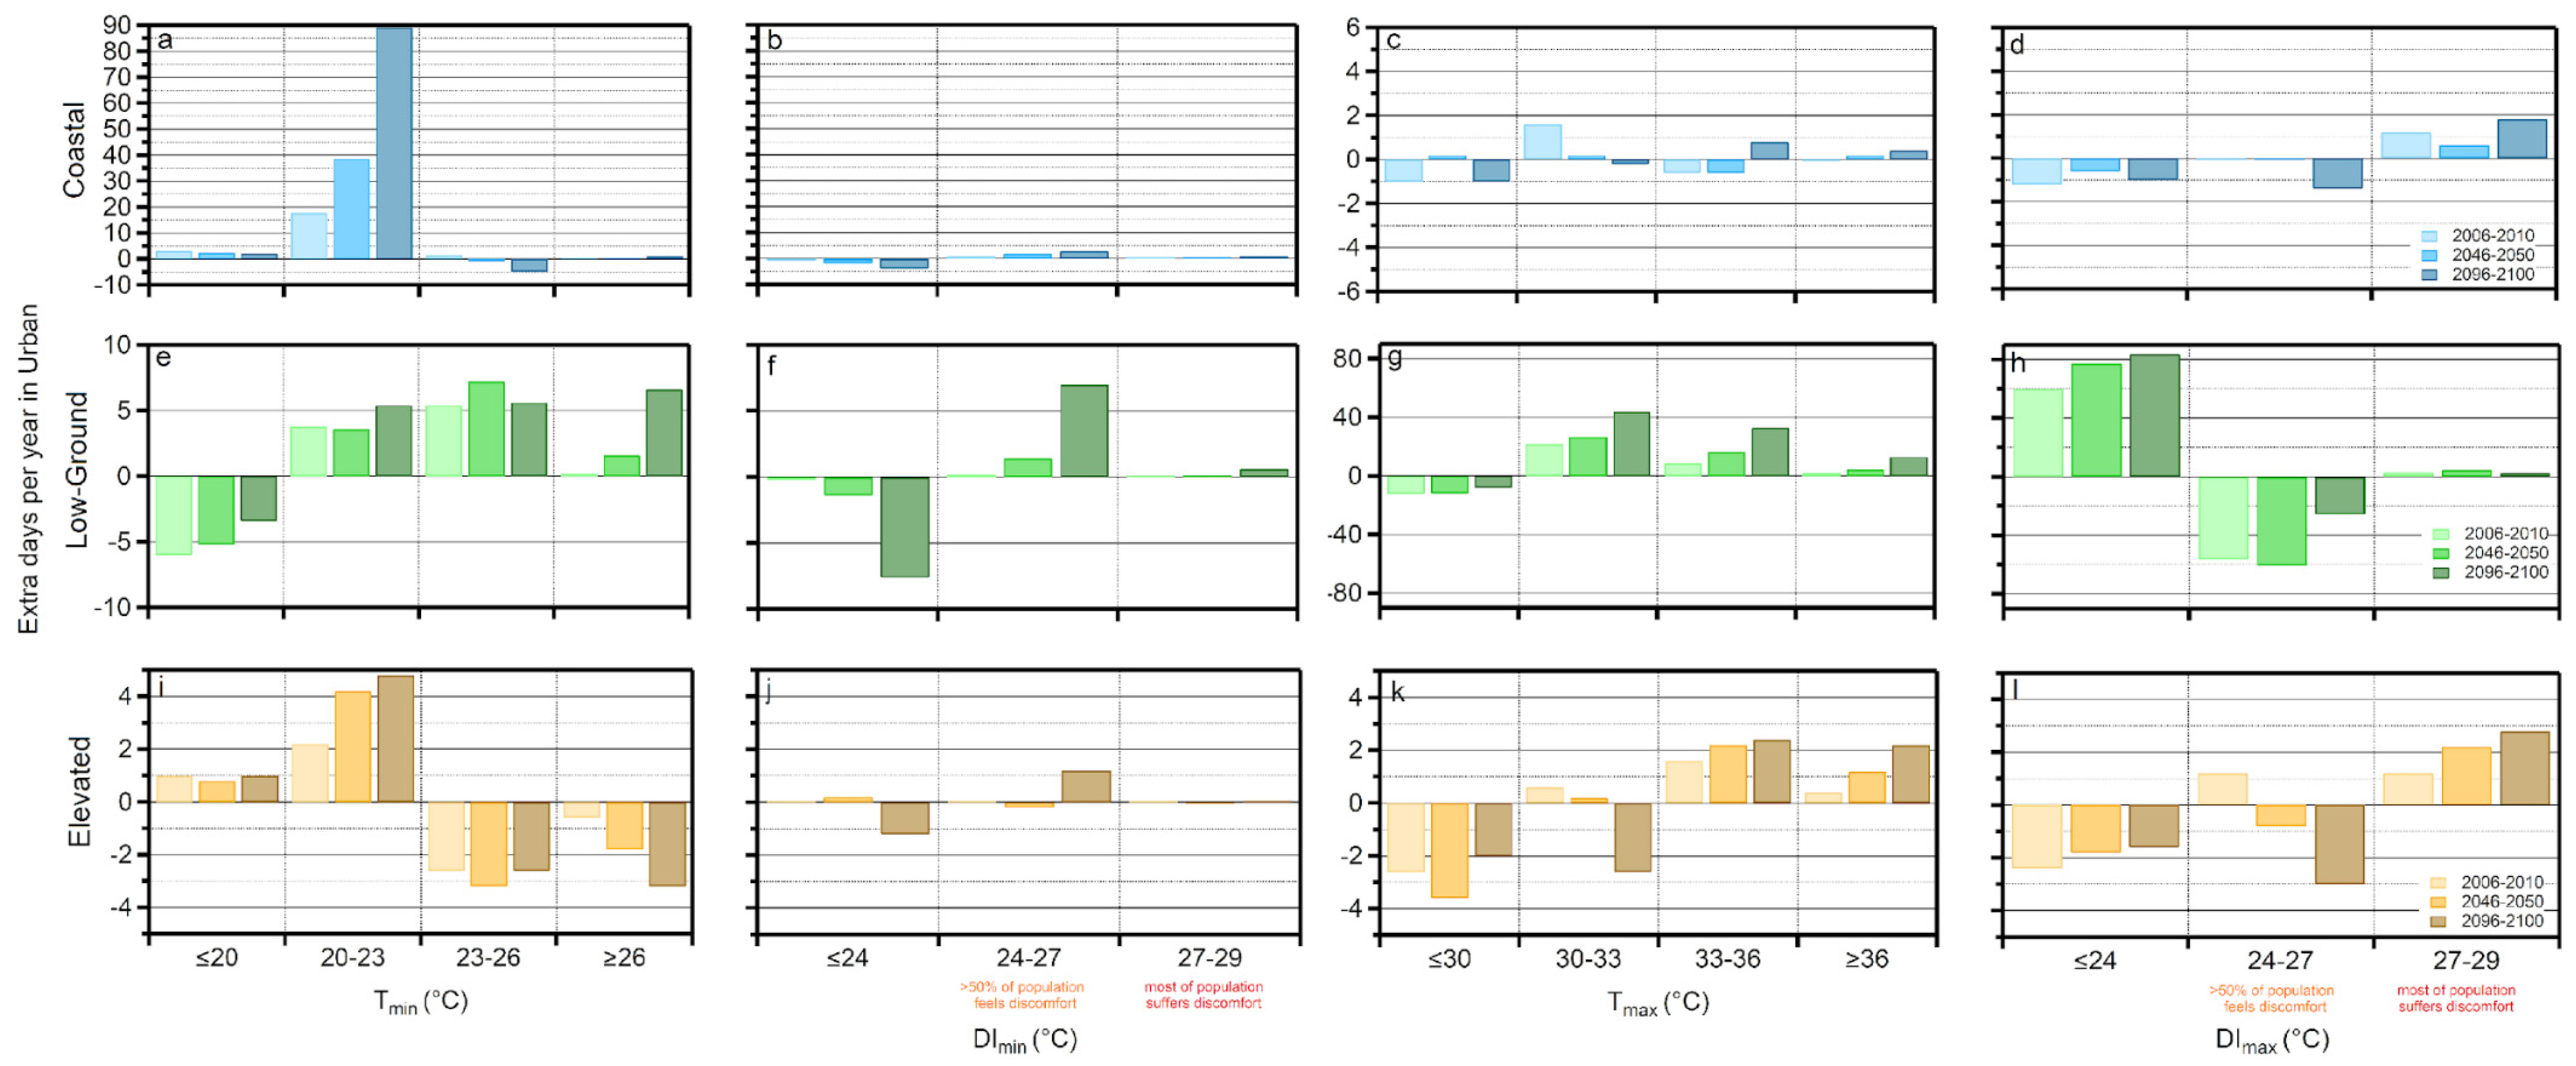
  • The ratio of days with Tmin ≥ 20 °C between urban and reference areas is expected to increase in coastal areas, from 1.3 to 1.7, in both cities by 2100 in coastal areas. This ratio is ~1.15–1.19 and ~1, and remains similar until the end of the century in low-ground and elevated areas.
  • Coastal urban areas of both cities presented the most significant excess in the number of days with Tmin between 20 and 23 °C of all classes with ~30 days/year (in the reference period). This number will increase to ~90 days/year until 2100.
  • The largest increase of the number of days with Tmin > 26 °C and DImin between 24 and 27 °C was observed in the class of low-ground areas by the end of the century. We expect an excess of 7 days with such a discomfort regime in urban areas against the surroundings in both cities. In addition, although days with Tmax > 30 °C will increase by 60/year in urban areas against the surroundings until 2100, this change is not depicted in the number of days with DImax > 24 °C, possibly because of the dry urban environment.
  • Regarding elevated areas, the changes seem to be insignificant (of the order of up to 5 days/year) in both cities until 2100, but with a decreasing trend in the number of extra days in urban areas with Tmin ≥ 26 °C (−2 days/year compared to the present) and an increasing number of days with Tmax ≥ 36 °C (+2 days/year compared to the present).
From the present analysis, we assume that, under a “business-as-usual” emission scenario (RCP8.5), although no significant changes should be expected in UHI in both cities on average, when focusing on days with increased Tmin coastal and especially low-ground urban areas, there seems to be a slightly enhanced heat stress by the end of the century. Future work should be conducted with higher resolution simulations and under other emission scenarios, also focusing on trends of the wind flow and heat fluxes in and around Mediterranean urban centers in order to completely investigate their future microclimate. Such work may be useful for planning mitigation strategies aiming to upgrade the urban microclimate.

Author Contributions

Conceptualization, S.C.K.; methodology, S.C.K.; software, S.C.K. and S.K.; validation, S.P. and D.P.; formal analysis, S.C.K.; investigation, S.C.K., S.P. and D.P.; resources, S.C.K. S.K., P.T., A.K.; data curation, S.C.K., S.P. and D.P.; writing—original draft preparation, S.C.K., S.P. and D.P.; writing—review and editing, P.Z., A.P., G.C., F.d. and S.A.; visualization, S.C.K., S.P. and D.P.; supervision, P.Z. and D.M.; project administration, P.Z. and D.M.; funding acquisition, P.Z. and D.M. All authors have read and agreed to the published version of the manuscript.

Funding

This research was funded by the LIFE Programme of the European Union in the framework of the project “Implementation of a forecasting system for urban heat island effect for the development of adaptation strategies—LIFE ASTI”, grant number LIFE 17 CCA/GR/000108.

Institutional Review Board Statement

Not applicable.

Informed Consent Statement

Not applicable.

Data Availability Statement

Upon request to the authors.

Acknowledgments

Results presented in this work have been produced using the Aristotle University of Thessaloniki (AUTh) High-Performance Computing Infrastructure and Resources. We finally thank the Faculty of Meteorology and Climatology, Department of Geology, AUTh, the Municipality of Thessaloniki, the Directorate of Environment, Industry, Energy and Natural resources, Department of Environment and Hydroeconomy, Region of Central Macedonia, National Centers for Environmental Information—NOAA, and the Meteo Lazio and Agenzia Regionale per la Protezione Ambientale del Lazio (ARPA Lazio) for the help that they provided for the purposes of the present study.

Conflicts of Interest

The authors declare no conflict of interest. The funders had no role in the design of the study; in the collection, analyses, or interpretation of data; in the writing of the manuscript, or in the decision to publish the results.

References

  1. Kweku, D.W.; Bismark, O.; Maxwell, A.; Desmond, K.A.; Danso, K.B.; Oti-Mensah, E.A.; Quachie, A.T.; Adormaa, B.B.; Koomson, D. Greenhouse effect: Greenhouse gases and their impact on global warming. J. Sci. Res. Rep. 2017, 17, 1–9. [Google Scholar] [CrossRef]
  2. Stocker, T. (Ed.) Climate Change 2013: The Physical Science Basis: Working Group I Contribution to the Fifth Assessment Report of the Intergovernmental Panel on Climate Change; Cambridge University Press: Cambridge, UK; New York, NY, USA, 2014. [Google Scholar]
  3. Jubb, I.; Canadell, P.; Dix, M. Representative Concentration Pathways (RCPs); Australian Climate Change Science Program: Arlington, VA, USA, 2013; pp. 5–7. [Google Scholar]
  4. Masui, T.; Matsumoto, K.; Hijioka, Y.; Kinoshita, T.; Nozawa, T.; Ishiwatari, S.; Kato, E.; Shukla, P.R.; Yamagata, Y.; Kainuma, M. An emission pathway for stabilization at 6 Wm−2 radiative forcing. Clim. Chang. 2011, 109, 59–76. [Google Scholar] [CrossRef]
  5. Nazarenko, L.; Schmidt, G.; Miller, R.; Tausnev, N.; Kelley, M.; Ruedy, R.; Russell, G.L.; Aleinov, I.; Bauer, M.; Bauer, S.; et al. Future climate change under RCP emission scenarios with GISS ModelE2. J. Adv. Model. Earth Syst. 2015, 7, 244–267. [Google Scholar] [CrossRef] [Green Version]
  6. Schwalm, C.R.; Glendon, S.; Duffy, P.B. RCP8.5 tracks cumulative CO2emissions. Proc. Natl. Acad. Sci. USA 2020, 117, 19656–19657. [Google Scholar] [CrossRef]
  7. Taylor, K.E.; Stouffer, R.J.; Meehl, G.A. An overview of CMIP5 and the experiment design. Bull. Am. Meteorol. Soc. 2012, 93, 485–498. [Google Scholar] [CrossRef] [Green Version]
  8. Van Vuuren, D.P.; Stehfest, E.; Elzen, M.G.J.D.; Kram, T.; Van Vliet, J.; Deetman, S.; Isaac, M.; Goldewijk, K.K.; Hof, A.; Beltran, A.M.; et al. RCP2.6: Exploring the possibility to keep global mean temperature increase below 2 °C. Clim. Chang. 2011, 109, 95–116. [Google Scholar] [CrossRef]
  9. Oke, T.R. The energetic basis of the urban heat island. Q. J. R. Meteorol. Soc. 1982, 108, 1–24. [Google Scholar] [CrossRef]
  10. Kambezidis, H.; Psiloglou, B.; Varotsos, K.; Giannakopoulos, C. Climate change and thermal comfort in Greece. Climate 2021, 9, 10. [Google Scholar] [CrossRef]
  11. Lionello, P.; Scarascia, L. The relation between climate change in the Mediterranean region and global warming. Reg. Environ. Chang. 2018, 18, 1481–1493. [Google Scholar] [CrossRef]
  12. Moatti, J.P.; Thiébault, S. (Eds.) The Mediterranean Region under Climate Change: A Scientific Update; IRD Editions: Paris, France, 2018. [Google Scholar]
  13. Zittis, G.; Hadjinicolaou, P.; Klangidou, M.; Proestos, Y.; Lelieveld, J. A multi-model, multi-scenario, and multi-domain analysis of regional climate projections for the Mediterranean. Reg. Environ. Chang. 2019, 19, 2621–2635. [Google Scholar] [CrossRef] [Green Version]
  14. Giorgi, F.; Lionello, P. Climate change projections for the Mediterranean region. Glob. Planet. Chang. 2008, 63, 90–104. [Google Scholar] [CrossRef]
  15. Lelieveld, J.; Hadjinicolaou, P.; Kostopoulou, E.; Chenoweth, J.; El Maayar, M.; Giannakopoulos, C.; Hannides, C.; Lange, M.A.; Tanarhte, M.; Tyrlis, E.; et al. Climate change and impacts in the Eastern Mediterranean and the Middle East. Clim. Chang. 2012, 114, 667–687. [Google Scholar] [CrossRef] [Green Version]
  16. Meehl, G.A.; Tebaldi, C. More intense, more frequent, and longer lasting heat waves in the 21st century. Science 2004, 305, 994–997. [Google Scholar] [CrossRef] [Green Version]
  17. Beniston, M. The 2003 heat wave in Europe: A shape of things to come? An analysis based on Swiss climatological data and model simulations. Geophys. Res. Lett. 2004, 31. [Google Scholar] [CrossRef] [Green Version]
  18. Kuglitsch, F.G.; Toreti, A.; Xoplaki, E.; Della-Marta, P.M.; Zerefos, C.S.; Türkeş, M.; Luterbacher, J. Heat wave changes in the eastern Mediterranean since 1960. Geophys. Res. Lett. 2010, 37. [Google Scholar] [CrossRef] [Green Version]
  19. Watts, N.; Adger, W.N.; Agnolucci, P.; Blackstock, J.; Byass, P.; Cai, W.; Chaytor, S.; Colbourn, T.; Collins, M.; Cooper, A.; et al. Health and climate change: Policy responses to protect public health. Lancet 2015, 386, 1861–1914. [Google Scholar] [CrossRef]
  20. Zittis, G.; Hadjinicolaou, P.; Fnais, M.; Lelieveld, J. Projected changes in heat wave characteristics in the eastern Mediterranean and the Middle East. Reg. Environ. Chang. 2016, 16, 1863–1876. [Google Scholar] [CrossRef]
  21. Zanis, P.; Katragkou, E.; Ntogras, C.; Marougianni, G.; Tsikerdekis, A.; Feidas, H.; Anadranistakis, E.; Melas, D. Transient high-resolution regional climate simulation for Greece over the period 1960-2100: Evaluation and future projections. Clim. Res. 2015, 64, 123–140. [Google Scholar] [CrossRef] [Green Version]
  22. Mohajerani, A.; Bakaric, J.; Jeffrey-Bailey, T. The urban heat island effect, its causes, and mitigation, with reference to the thermal properties of asphalt concrete. J. Environ. Manag. 2017, 197, 522–538. [Google Scholar] [CrossRef]
  23. Morabito, M.; Crisci, A.; Messeri, A.; Orlandini, S.; Raschi, A.; Maracchi, G.; Munafò, M. The impact of built-up surfaces on land surface temperatures in Italian urban areas. Sci. Total Environ. 2016, 551, 317–326. [Google Scholar] [CrossRef] [PubMed]
  24. Parker, D.E. Urban heat island effects on estimates of observed climate change. Wiley Interdiscip. Rev. Clim. Chang. 2010, 1, 123–133. [Google Scholar] [CrossRef]
  25. Phelan, P.E.; Kaloush, K.; Miner, M.; Golden, J.; Phelan, B.; Silva, H., III; Taylor, R.A. Urban heat island: Mechanisms, implications, and possible remedies. Annu. Rev. Environ. Resour. 2015, 40, 285–307. [Google Scholar] [CrossRef]
  26. Yang, L. Integration of a numerical model and remotely sensed data to study urban/rural land surface climate processes. Comput. Geosci. 2000, 26, 451–468. [Google Scholar] [CrossRef]
  27. Christen, A.; Vogt, R. Energy and radiation balance of a central European city. Int. J. Clim. 2004, 24, 1395–1421. [Google Scholar] [CrossRef]
  28. Ciardini, V.; Caporaso, L.; Sozzi, R.; Petenko, I.; Bolignano, A.; Morelli, M.; Melas, D.; Argentini, S. Interconnections of the urban heat island with the spatial and temporal micrometeorological variability in Rome. Urban Clim. 2019, 29, 100493. [Google Scholar] [CrossRef]
  29. Founda, D.; Santamouris, M. Synergies between Urban Heat Island and Heat Waves in Athens (Greece), during an extremely hot summer (2012). Sci. Rep. 2017, 7, 10973. [Google Scholar] [CrossRef] [Green Version]
  30. Giannaros, T.M.; Melas, D.; Daglis, I.; Keramitsoglou, I.; Kourtidis, K. Numerical study of the urban heat island over Athens (Greece) with the WRF model. Atmos. Environ. 2013, 73, 103–111. [Google Scholar] [CrossRef]
  31. Voogt, J.; Oke, T. Thermal remote sensing of urban climates. Remote Sens. Environ. 2003, 86, 370–384. [Google Scholar] [CrossRef]
  32. Tseliou, A.; Tsiros, I.X.; Lykoudis, S.; Nikolopoulou, M. An evaluation of three biometeorological indices for human thermal comfort in urban outdoor areas under real climatic conditions. Build. Environ. 2010, 45, 1346–1352. [Google Scholar] [CrossRef]
  33. De’Donato, F.K.; Stafoggia, M.; Rognoni, M.; Poncino, S.; Caranci, N.; Bisanti, L.; DeMaria, M.; Forastiere, F.; Michelozzi, P.; Pelosini, R.; et al. Airport and city-centre temperatures in the evaluation of the association between heat and mortality. Int. J. Biometeorol. 2008, 52, 301–310. [Google Scholar] [CrossRef]
  34. Guo, Y.; Gasparrini, A.; Armstrong, B.G.; Tawatsupa, B.; Tobias, A.; Lavigne, E.; Coelho, M.d.Z.S.; Pan, X.; Kim, H.; Hashizume, M.; et al. Heat wave and mortality: A multicountry, multicommunity study. Environ. Health Perspect. 2017, 125, 087006. [Google Scholar] [CrossRef] [Green Version]
  35. Kolokotsa, D.; Psomas, A.; Karapidakis, E. Urban heat island in southern Europe: The case study of Hania, Crete. Sol. Energy 2009, 83, 1871–1883. [Google Scholar] [CrossRef]
  36. McGregor, G.; Markou, M.; Bartzokas, A.; Katsoulis, B. An evaluation of the nature and timing of summer human thermal discomfort in Athens, Greece. Clim. Res. 2002, 20, 83–94. [Google Scholar] [CrossRef] [Green Version]
  37. Poupkou, A.; Nastos, P.; Melas, D.; Zerefos, C. Climatology of discomfort index and air quality index in a large urban Mediterranean agglomeration. Water Air Soil Pollut. 2011, 222, 163–183. [Google Scholar] [CrossRef]
  38. Scortichini, M.; De’Donato, F.; De Sario, M.; Leone, M.; Åström, C.; Ballester, F.; Basagaña, X.; Bobvos, J.; Gasparrini, A.; Katsouyanni, K.; et al. The inter-annual variability of heat-related mortality in nine European cities (1990–2010). Environ. Health 2018, 17, 66. [Google Scholar] [CrossRef] [PubMed] [Green Version]
  39. Kalkstein, L.S.; Greene, S.; Mills, D.M.; Samenow, J. An evaluation of the progress in reducing heat-related human mortality in major U.S. cities. Nat. Hazards 2011, 56, 113–129. [Google Scholar] [CrossRef]
  40. Schwartz, J. Who is sensitive to extremes of temperature? A case-only analysis. Epidemiology 2005, 16, 67–72. [Google Scholar] [CrossRef] [PubMed]
  41. Tan, J.; Zheng, Y.; Song, G.; Kalkstein, L.S.; Kalkstein, A.J.; Tang, X. Heat wave impacts on mortality in Shanghai, 1998 and 2003. Int. J. Biometeorol. 2007, 51, 193–200. [Google Scholar] [CrossRef]
  42. Bark, N. Deaths of Psychiatric Patients During Heat Waves. Psychiatr. Serv. 1998, 49, 1088–1090. [Google Scholar] [CrossRef]
  43. Canoui-Poitrine, F.; Cadot, E.; Spira, A. Excess deaths during the August 2003 heat wave in Paris, France. Revue d’Épidémiologie et de Santé Publique 2006, 54, 127–135. [Google Scholar] [CrossRef] [Green Version]
  44. D’Ippoliti, D.; Michelozzi, P.; Marino, C.; De’Donato, F.; Menne, B.; Katsouyanni, K.; Kirchmayer, U.; Analitis, A.; Medina-Ramón, M.; Paldy, A.; et al. The impact of heat waves on mortality in 9 European cities: Results from the EuroHEAT project. Environ. Health 2010, 9, 37. [Google Scholar] [CrossRef] [PubMed] [Green Version]
  45. Heaviside, C.; Vardoulakis, S.; Cai, X.-M. Attribution of mortality to the urban heat island during heatwaves in the West Midlands, UK. Environ. Health 2016, 15, S27. [Google Scholar] [CrossRef] [Green Version]
  46. Laaidi, K.; Zeghnoun, A.; Dousset, B.; Bretin, P.; Vandentorren, S.; Giraudet, E.; Beaudeau, P. The Impact of Heat Islands on Mortality in Paris during the August 2003 Heat Wave. Environ. Health Perspect. 2012, 120, 254–259. [Google Scholar] [CrossRef] [Green Version]
  47. Semenza, J.C.; Rubin, C.H.; Falter, K.H.; Selanikio, J.D.; Flanders, W.D.; Howe, H.L.; Wilhelm, J.L. Heat-related deaths during the July 1995 heat wave in Chicago. N. Engl. J. Med. 1996, 335, 84–90. [Google Scholar] [CrossRef] [PubMed]
  48. Baklanov, A.; Korsholm, U.; Mahura, A.; Petersen, C.; Gross, A.; Baklanov, A.; Korsholm, U.; Mahura, A.; Petersen, C.; Gross, A. ENVIRO-HIRLAM: On-line coupled modelling of urban meteorology and air pollution. Adv. Sci. Res. 2008, 2, 41–46. [Google Scholar] [CrossRef]
  49. Huszár, P.; Halenka, T.; Belda, M.; Žák, M.; Sindelarova, K.; Miksovsky, J. Regional climate model assessment of the urban land-surface forcing over central Europe. Atmos. Chem. Phys. Discuss. 2014, 14, 12393–12413. [Google Scholar] [CrossRef] [Green Version]
  50. Adachi, S.A.; Kimura, F.; Kusaka, H.; Inoue, T.; Ueda, H. Comparison of the Impact of Global Climate Changes and Urbanization on Summertime Future Climate in the Tokyo Metropolitan Area. J. Appl. Meteorol. Clim. 2012, 51, 1441–1454. [Google Scholar] [CrossRef]
  51. Arsiso, B.K.; Tsidu, G.M.; Stoffberg, G.H.; Tadesse, T. Influence of urbanization-driven land use/cover change on climate: The case of Addis Ababa, Ethiopia. Phys. Chem. Earth Parts A/B/C 2018, 105, 212–223. [Google Scholar] [CrossRef]
  52. Halenka, T.; Belda, M.; Huszar, P.; Karlicky, J.; Novakova, T.; Zak, M. On the comparison of urban canopy effects parameterisation. Int. J. Environ. Pollut. 2019, 65, 177–194. [Google Scholar] [CrossRef]
  53. Hamdi, R.; Van de Vyver, H.; De Troch, R.; Termonia, P. Assessment of three dynamical urban climate downscaling methods: Brussels’s future urban heat island under an A1B emission scenario. Int. J. Climatol. 2014, 34, 978–999. [Google Scholar] [CrossRef]
  54. Hatchett, B.J.; Koračin, D.; Mejía, J.F.; Boyle, D.P. Assimilating urban heat island effects into climate projections. J. Arid. Environ. 2016, 128, 59–64. [Google Scholar] [CrossRef] [Green Version]
  55. Hoffmann, P.; Schoetter, R.; Schlünzen, K.H. Statistical-dynamical downscaling of the urban heat island in Hamburg, Germany. Meteorol. Z. 2018, 27, 89–109. [Google Scholar] [CrossRef]
  56. McCarthy, M.P.; Best, M.; Betts, R.A. Climate change in cities due to global warming and urban effects. Geophys. Res. Lett. 2010, 37. [Google Scholar] [CrossRef] [Green Version]
  57. Silva, V.D.P.R.D.; De Azevedo, P.V.; Brito, R.S.; Campos, J.H.B.D.C. Evaluating the urban climate of a typically tropical city of northeastern Brazil. Environ. Monit. Assess. 2010, 161, 45–59. [Google Scholar] [CrossRef]
  58. McCarthy, M.P.; Harpham, C.; Goodess, C.M.; Jones, P.D. Simulating climate change in UK cities using a regional climate model, HadRM3. Int. J. Clim. 2012, 32, 1875–1888. [Google Scholar] [CrossRef]
  59. Oleson, K.W.; Bonan, G.B.; Feddema, J.; Jackson, T. An examination of urban heat island characteristics in a global climate model. Int. J. Clim. 2011, 31, 1848–1865. [Google Scholar] [CrossRef] [Green Version]
  60. Mihalakakou, G.; Santamouris, M.; Papanikolaou, N.; Cartalis, C.; Tsangrassoulis, A. Simulation of the Urban Heat Island Phenomenon in Mediterranean Climates. Pure Appl. Geophys. 2004, 161, 429–451. [Google Scholar] [CrossRef]
  61. Giannaros, T.M.; Melas, D. Study of the urban heat island in a coastal Mediterranean City: The case study of Thessaloniki, Greece. Atmos. Res. 2012, 118, 103–120. [Google Scholar] [CrossRef]
  62. Theophilou, M.; Serghides, D. Estimating the characteristics of the Urban Heat Island Effect in Nicosia, Cyprus, using multiyear urban and rural climatic data and analysis. Energy Build. 2015, 108, 137–144. [Google Scholar] [CrossRef]
  63. Fabrizi, R.; Bonafoni, S.; Biondi, R. Satellite and Ground-Based Sensors for the Urban Heat Island Analysis in the City of Rome. Remote Sens. 2010, 2, 1400–1415. [Google Scholar] [CrossRef] [Green Version]
  64. Guattari, C.; Evangelisti, L.; Balaras, C.A. On the assessment of urban heat island phenomenon and its effects on building energy performance: A case study of Rome (Italy). Energy Build. 2018, 158, 605–615. [Google Scholar] [CrossRef]
  65. Martin-Vide, J.; Moreno-Garcia, M.C. Probability values for the intensity of Barcelona’s urban heat island (Spain). Atmos. Res. 2020, 240, 104877. [Google Scholar] [CrossRef]
  66. Polydoros, A.; Mavrakou, T.; Cartalis, C. Quantifying the Trends in Land Surface Temperature and Surface Urban Heat Island Intensity in Mediterranean Cities in View of Smart Urbanization. Urban Sci. 2018, 2, 16. [Google Scholar] [CrossRef] [Green Version]
  67. Argüeso, D.; Evans, J.; Fita, L.; Bormann, K.J. Temperature response to future urbanization and climate change. Clim. Dyn. 2014, 42, 2183–2199. [Google Scholar] [CrossRef]
  68. Doan, Q.; Kusaka, H. Numerical study on regional climate change due to the rapid urbanization of greater Ho Chi Minh City’s metropolitan area over the past 20 years. Int. J. Clim. 2016, 36, 3633–3650. [Google Scholar] [CrossRef]
  69. Grossman-Clarke, S.; Schubert, S.; Fenner, D. Urban effects on summertime air temperature in Germany under climate change. Int. J. Climatol. 2017, 37, 905–917. [Google Scholar] [CrossRef]
  70. Kabisch, N.; Haase, D. Diversifying European agglomerations: Evidence of urban population trends for the 21st century. Popul. Space Place 2011, 17, 236–253. [Google Scholar] [CrossRef]
  71. Li, H.; Zhou, Y.; Li, X.; Meng, L.; Wang, X.; Wu, S.; Sodoudi, S. A new method to quantify surface urban heat island intensity. Sci. Total. Environ. 2018, 624, 262–272. [Google Scholar] [CrossRef]
  72. Berckmans, J.; Hamdi, R.; Dendoncker, N. Bridging the Gap between Policy-Driven Land Use Changes and Regional Climate Projections. J. Geophys. Res. Atmos. 2019, 124, 5934–5950. [Google Scholar] [CrossRef]
  73. Hamdi, R.; Duchêne, F.; Berckmans, J.; Delcloo, A.; Vanpoucke, C.; Termonia, P. Evolution of urban heat wave intensity for the Brussels Capital Region in the ARPEGE-Climat A1B scenario. Urban Clim. 2016, 17, 176–195. [Google Scholar] [CrossRef]
  74. Van der Schriek, T.; Varotsos, K.V.; Giannakopoulos, C.; Founda, D. Projected future temporal trends of two different urban heat islands in Athens (Greece) under three climate change scenarios: A statistical approach. Atmosphere 2020, 11, 637. [Google Scholar] [CrossRef]
  75. Rosenzweig, C.; Solecki, W.D.; Parshall, L.; Chopping, M.; Pope, G.; Goldberg, R. Characterizing the urban heat island in current and future climates in New Jersey. Glob. Environ. Chang. Part B Environ. Hazards 2005, 6, 51–62. [Google Scholar] [CrossRef]
  76. Lauwaet, D.; De Ridder, K.; Saeed, S.; Brisson, E.; Chatterjee, F.; van Lipzig, N.; Maiheu, B.; Hooyberghs, H. Assessing the current and future urban heat island of Brussels. Urban Clim. 2016, 15, 1–15. [Google Scholar] [CrossRef] [Green Version]
  77. Roberge, F.; Sushama, L. Urban heat island in current and future climates for the island of Montreal. Sustain. Cities Soc. 2018, 40, 501–512. [Google Scholar] [CrossRef]
  78. Gaur, A.; Eichenbaum, M.K.; Simonovic, S.P. Analysis and modelling of surface Urban Heat Island in 20 Canadian cities under climate and land-cover change. J. Environ. Manag. 2018, 206, 145–157. [Google Scholar] [CrossRef] [PubMed]
  79. Giannaros, C.; Nenes, A.; Giannaros, T.M.; Kourtidis, K.; Melas, D. A comprehensive approach for the simulation of the Urban Heat Island effect with the WRF/SLUCM modeling system: The case of Athens (Greece). Atmos. Res. 2018, 201, 86–101. [Google Scholar] [CrossRef]
  80. Kusaka, H.; Kondo, H.; Kikegawa, Y.; Kimura, F. A simple single-layer urban canopy model for atmospheric models: Comparison with multi-layer and slab models. Bound. Layer Meteorol. 2001, 101, 329–358. [Google Scholar] [CrossRef]
  81. Kusaka, H.; Kimura, F. Coupling a Single-Layer Urban Canopy Model with a Simple Atmospheric Model: Impact on Urban Heat Island Simulation for an Idealized Case. J. Meteorol. Soc. Jpn. 2004, 82, 67–80. [Google Scholar] [CrossRef] [Green Version]
  82. Martilli, A.; Clappier, A.; Rotach, M.W. An Urban Surface Exchange Parameterisation for Mesoscale Models. Bound. Layer Meteorol. 2002, 104, 261–304. [Google Scholar] [CrossRef]
  83. Salamanca, F.; Martilli, A.; Tewari, M.; Chen, F. A study of the urban boundary layer using different urban parameterizations and high-resolution urban canopy parameters with WRF. J. Appl. Meteorol. Climatol. 2011, 50, 1107–1128. [Google Scholar] [CrossRef]
  84. Giannaros, C. Sensitivity Analysis and Optimization of a Mesoscale Atmospheric Model. Ph.D. Thesis, Aristotle University of Thessaloniki, Thessaloniki, Greece, 2018. [Google Scholar]
  85. Tateishi, R.; Uriyangqai, B.; Al-Bilbisi, H.; Ghar, M.A.; Tsend-Ayush, J.; Kobayashi, T.; Kasimu, A.; Hoan, N.T.; Shalaby, A.; Alsaaideh, B.; et al. Production of global land cover data–GLCNMO. Int. J. Digital Earth 2011, 4, 22–49. [Google Scholar] [CrossRef]
  86. Büttner, G. CORINE land cover and land cover change products. In Land Use and Land Cover Mapping in Europe; Springer: Dordrecht, The Netherlands, 2014; pp. 55–74. [Google Scholar]
  87. Meinshausen, M.; Smith, S.J.; Calvin, K.; Daniel, J.S.; Kainuma, M.L.T.; Lamarque, J.F.; Matsumoto, K.; Montzka, S.; Raper, S.C.B.; Riahi, K.; et al. The RCP greenhouse gas concentrations and their extensions from 1765 to 2300. Clim. Chang. 2011, 109, 213–241. [Google Scholar] [CrossRef] [Green Version]
  88. Salvati, L.; Zambon, I.; Pignatti, G.; Colantoni, A.; Cividino, S.; Perini, L.; Pontuale, G.; Cecchini, M. A Time-Series Analysis of Climate Variability in Urban and Agricultural Sites (Rome, Italy). Agriculture 2019, 9, 103. [Google Scholar] [CrossRef] [Green Version]
  89. Hong, S.Y.; Lim, J. The WRF single-moment 6-class microphysics scheme (WSM6). Asia Pac. J. Atmos. Sci. 2006, 42, 129–151. [Google Scholar]
  90. Kain, J.S. The Kain–Fritsch convective parameterization: An update. J. Appl. Meteorol. 2004, 43, 170–181. [Google Scholar] [CrossRef] [Green Version]
  91. Hong, S.Y.; Noh, Y.; Dudhia, J. A new vertical diffusion package with an explicit treatment of entrainment processes. Mon. Weather. Rev. 2006, 134, 2318–2341. [Google Scholar] [CrossRef] [Green Version]
  92. Janjic, Z.I. The Mellor-Yamada Level 2.5 Turbulence Closure Scheme in the NCEP Eta Model; World Meteorological Organization-Publications-WMO TD: Geneva, Switzerland, 1996; pp. 4–14. [Google Scholar]
  93. Monin, A.S.; Obukhov, A.M. Basic laws of turbulent mixing in the surface layer of the atmosphere. Contrib. Geophys. Inst. Acad. Sci. USSR 1954, 151, e187. [Google Scholar]
  94. Tewari, M.; Chen, F.; Wang, W.; Dudhia, J.; LeMone, M.A.; Mitchell, K.; Ek, M.; Gayno, G.; Wegiel, J.; Cuenca, R.H. Implementation and verification of the unified NOAH land surface model in the WRF model. In Proceedings of the 20th Conference on Weather Analysis and Forecasting/16th Conference on Numerical Weather Prediction, Seattle, WA, USA, 14 January 2004; Volume 1115. [Google Scholar]
  95. Iacono, M.; Delamere, J.S.; Mlawer, E.J.; Shephard, M.W.; Clough, S.A.; Collins, W.D. Radiative forcing by long-lived greenhouse gases: Calculations with the AER radiative transfer models. J. Geophys. Res. Space Phys. 2008, 113. [Google Scholar] [CrossRef]
  96. Schlünzen, K.H.; Sokhi, R.S. Overview of tools and methods for meteorological and air pollution mesoscale model evaluation and user training. Jt. Rep. WMO COST 2008, 728, 116. [Google Scholar]
  97. Koletsis, I.; Giannaros, T.; Lagouvardos, K.; Kotroni, V. Observational and numerical study of the Vardaris wind regime in northern Greece. Atmos. Res. 2016, 171, 107–120. [Google Scholar] [CrossRef]
  98. Thom, E.C. The Discomfort index. Weatherwise 1959, 12, 57–61. [Google Scholar] [CrossRef]
  99. Bhati, S.; Mohan, M. WRF model evaluation for the urban heat island assessment under varying land use/land cover and reference site conditions. Theor. Appl. Clim. 2016, 126, 385–400. [Google Scholar] [CrossRef]
  100. Emery, C.; Tai, E.; Yarwood, G. Enhanced meteorological modeling and performance evaluation for two Texas ozone episodes. In Prepared for the Texas Natural Resource Conservation Commission, by ENVIRON International Corporation; ENVIRON: Novato, CA, USA, 2001. [Google Scholar]
  101. Keppas, S.; Parliari, D.; Kontos, S.; Poupkou, A.; Papadogiannaki, S.; Tzoumaka, P.; Kelessis, A.; Dimitrios, M. Urban heat island and future projections: A study in Thessaloniki, Greece. In Proceedings of the International Conference on Environmental Protection and Disaster RISKs, Sofia, Bulgaria, 29–30 September 2020; Springer: Cham, Switzerland, 2020; pp. 201–212. [Google Scholar]
  102. Li, X.X.; Koh, T.Y.; Entekhabi, D.; Roth, M.; Panda, J.; Norford, L.K. A multi-resolution ensemble study of a tropical urban environment and its interactions with the background regional atmosphere. J. Geophys. Res. Atmos. 2013, 118, 9804–9818. [Google Scholar] [CrossRef]
  103. Li, H.; Wolter, M.; Wang, X.; Sodoudi, S. Impact of land cover data on the simulation of urban heat island for Berlin using WRF coupled with bulk approach of Noah-LSM. Theor. Appl. Climatol. 2018, 134, 67–81. [Google Scholar] [CrossRef]
  104. Miao, S.; Chen, F.; LeMone, M.A.; Tewari, M.; Li, Q.; Wang, Y. An observational and modeling study of characteristics of urban heat island and boundary layer structures in Beijing. J. Appl. Meteorol. Climatol. 2009, 48, 484–501. [Google Scholar] [CrossRef]
  105. Mughal, M.O.; Li, X.X.; Yin, T.; Martilli, A.; Brousse, O.; Dissegna, M.A.; Norford, L.K. High-resolution, multilayer modeling of Singapore’s urban climate incorporating local climate zones. J. Geophys. Res. Atmos. 2019, 124, 7764–7785. [Google Scholar] [CrossRef]
  106. Joshi, M.M.; Gregory, J.; Webb, M.J.; Sexton, D.M.H.; Johns, T.C. Mechanisms for the land/sea warming contrast exhibited by simulations of climate change. Clim. Dyn. 2008, 30, 455–465. [Google Scholar] [CrossRef]
  107. Manabe, S.; Stouffer, R.J.; Spelman, M.J.; Bryan, K. Transient responses of a coupled ocean–atmosphere model to gradual changes of atmospheric CO2. Part I. Annual mean response. J. Clim. 1991, 4, 785–818. [Google Scholar] [CrossRef]
  108. Sutton, R.T.; Dong, B.; Gregory, J. Land/sea warming ratio in response to climate change: IPCC AR4 model results and comparison with observations. Geophys. Res. Lett. 2007, 34. [Google Scholar] [CrossRef]
  109. Jones, P.D.; Osborn, T.J.; Briffa, K.R.; Folland, C.K.; Horton, E.B.; Alexander, L.V.; Parker, D.E.; Rayner, N.A. Adjusting for sampling density in grid box land and ocean surface temperature time series. J. Geophys. Res. Space Phys. 2001, 106, 3371–3380. [Google Scholar] [CrossRef] [Green Version]
  110. Hinkel, K.M.; Nelson, F.E.; Klene, A.E.; Bell, J.H. The urban heat island in winter at Barrow, Alaska. Int. J. Clim. 2003, 23, 1889–1905. [Google Scholar] [CrossRef] [Green Version]
  111. Hirano, Y.; Fujita, T. Evaluation of the impact of the urban heat island on residential and commercial energy consumption in Tokyo. Energy 2012, 37, 371–383. [Google Scholar] [CrossRef]
  112. Magli, S.; Lodi, C.; Lombroso, L.; Muscio, A.; Teggi, S. Analysis of the urban heat island effects on building energy consumption. Int. J. Energy Environ. Eng. 2015, 6, 91–99. [Google Scholar] [CrossRef] [Green Version]
  113. Giannakopoulos, C.; Kostopoulou, E.; Varotsos, K.V.; Tziotziou, K.; Plitharas, A. An integrated assessment of climate change impacts for Greece in the near future. Reg. Environ. Chang. 2011, 11, 829–843. [Google Scholar] [CrossRef] [Green Version]
  114. Mirzaei, P.A.; Haghighat, F. Approaches to study urban heat island–abilities and limitations. Build. Environ. 2010, 45, 2192–2201. [Google Scholar] [CrossRef]
Figure 1. The four two-way nested domains in Europe (d01), central–eastern Mediterranean (d02) and Thessaloniki/Rome (d03/d04).
Atmosphere 12 00884 g001
Figure 2. Weather stations for (a) Thessaloniki and (b) Rome.
Atmosphere 12 00884 g002
Figure 3. The cross-sections (blue lines) across the urban and surrounding areas (a,b) and the classified grid cells according to land use, elevation and location (see Section 2.3 for the method description) (c,d) in Thessaloniki and Rome, respectively. In maps (a,b), the altitude is shown in color shades, and the urban areas with globe Corine land use categories ≤ 11 (artificial urban surfaces) are depicted with white lines. The administrative area of Rome is shown with a pink solid line in (b) and red in (d).
Atmosphere 12 00884 g003
Figure 4. Boxplots of daily mean temperature (°C) distributions for Thessaloniki (a) and Rome (b), 2006–2010 or 2008–2010 based on data availability.
Atmosphere 12 00884 g004
Figure 5. Summer average temperature (Tavg) at 03UTC and 12UTC in Thessaloniki (a,b) and Rome (c,d) during the reference period (2006–2010). Summer Tavg difference at 03UTC and 12UTC between 2046 and 2050 and reference period in Thessaloniki (e,f) and Rome (g,h). Summer Tavg difference at 03UTC and 12UTC between 2096 and 2100 and reference period in Thessaloniki (i,j) and Rome (k,l). The white solid line indicates the urban areas with globe Corine land use categories ≤ 11 (artificial urban surfaces), while the pink solid line shows the administrative area of Rome. Summer period is defined as the three-month period of June, July and August.
Atmosphere 12 00884 g005
Figure 6. Winter average temperature (Tavg) at 03UTC and 12UTC in Thessaloniki (a,b) and Rome (c,d) during the reference period (2006–2010). Winter Tavg difference at 03UTC and 12UTC between 2046 and 2050 and reference period in Thessaloniki (e,f) and Rome (g,h). Winter Tavg difference at 03UTC and 12UTC between 2096 and 2100 and reference period in Thessaloniki (i,j) and Rome (k,l). The white solid line indicates the urban areas with globe Corine land use categories ≤ 11 (artificial urban surfaces), while the pink solid line shows the administrative area of Rome. Winter period is defined as the three-month period of December, January and February.
Atmosphere 12 00884 g006
Figure 7. Minimum and Maximum temperature (Tmin and Tmax, with solid and dashed lines, respectively) along the cross-section of the figure (e) for summer (a,b) and winter (c,d) for the greater area of Thessaloniki. Each of the simulated periods, 2006–2010, 2046–2050 and 2096–2100, is represented by pink, red and dark red color, correspondingly.
Atmosphere 12 00884 g007
Figure 8. Minimum and maximum temperature (Tmin and Tmax, with solid and dashed lines, respectively) along the cross-section of the figure (e) for summer (a,b) and winter (c,d) for the greater area of Rome. Each of the simulated periods, 2006–2010, 2046–2050 and 2096–2100, is represented by pink, red and dark red color, correspondingly.
Atmosphere 12 00884 g008
Figure 9. UHI differences between two future periods (2046–2050, solid lines, and 2096–2100, dashed lines) and the reference period (2006–2010) for coastal (blue), low-level (green) and elevated areas (brown) in Thessaloniki (a,c) and Rome (b,d) for summer and winter, respectively.
Atmosphere 12 00884 g009
Figure 10. Number of days with Tmin ≥ 20 °C in coastal (blue), low-level (green) and elevated (brown) urban/reference areas (darker/lighter color shade) as simulated for 5-year periods 2006-2010, 2046-2050 and 2096-2100 for Thessaloniki (a) and Rome (b).
Atmosphere 12 00884 g010
Figure 11. Extra days per year of specific class of Tmin, DImin, Tmax and DImax in urban areas compared to reference areas of coastal (ad), low-ground (eh) and elevated (il) regions of the city of Thessaloniki for the periods 2006-2010 (light shaded bars), 2046-2050 (medium shaded bars) and 2096-2100 (dark shaded bars). All the data refer to days where Tmin ≥ 20 °C at low-ground urban areas.
Atmosphere 12 00884 g011
Figure 12. Extra days per year of specific class of Tmin, DImin, Tmax and DImax in urban areas compared to reference areas of coastal (ad), low-ground (eh) and elevated (il) regions of the city of Rome for the periods 2006-2010 (light shaded bars), 2046-2050 (medium shaded bars) and 2096-2100 (dark shaded bars). All the data refer to days where Tmin ≥ 20 °C at low-ground urban areas.
Atmosphere 12 00884 g012
Table 1. Physics parametrizations used in the present study.
PhysicsParametrizationReferences
Microphysics (clouds)WRF single-moment 6-class (WSM6)[89]
Cumulus (convection) *Kain-Fritsch (KF)[90]
Planetary boundary layerYSU scheme[91]
Surface layerMonin-Obukhov (Janjic Eta) Scheme[92,93]
Land surfaceNoah model[94]
Short-wave radiationRRTMG[95]
* Cumulus parametrization is only used in d01 and d02.
Table 2. The Discomfort Index (DI) and the relation to the discomfort feeling of the population.
DI ≤ 21 °CNo Discomfort
21 °C ≤ DI < 24 °CLess than half of the population feels discomfort
24 °C ≤ DI < 27 °CMore than half of the population feels discomfort
27 °C ≤ DI < 29 °CMost of the population suffers discomfort
29 °C ≤ DI < 32 °CEveryone feels severe stress
DI ≥ 32 °CState of medical emergency
Table 3. Thessaloniki model performance metrics grouped by CLC.
CategoryMB (°C)MAE (°C)RIoARMSE (°C)
Artificial Surfaces0.403.360.850.923.36
Forest and semi-Forest natural Areas0.463.690.840.913.69
Table 4. Rome model performance metrics grouped by CLC.
CategoryMB (°C)MAE (°C)RIoARMSE (°C)
Artificial Surfaces0.052.710.880.932.71
Agricultural Areas0.772.930.870.932.93
Forest and semi-Forest natural Areas0.723.130.850.923.13
Publisher’s Note: MDPI stays neutral with regard to jurisdictional claims in published maps and institutional affiliations.

