Article

An Improved Weighting Method of Time-Lag-Ensemble Averaging for Hourly Precipitation Forecasts and Its Application in a Typhoon-Induced Heavy Rainfall Event

1
Hunan Meteorological Service, Changsha 410118, China
2
Key Laboratory of Preventing and Reducing Meteorological Disaster in Hunan Province, Changsha 410118, China
*
Author to whom correspondence should be addressed.
Atmosphere 2021, 12(7), 875; https://doi.org/10.3390/atmos12070875
Submission received: 18 May 2021 / Revised: 1 July 2021 / Accepted: 2 July 2021 / Published: 6 July 2021
(This article belongs to the Section Atmospheric Techniques, Instruments, and Modeling)

Abstract

:
Heavy rainfall events often cause great societal and economic impacts. The prediction ability of traditional extrapolation techniques decreases rapidly with the increase in the lead time. Moreover, deficiencies of high-resolution numerical models and high-frequency data assimilation will increase the prediction uncertainty. To address these shortcomings, based on the hourly precipitation prediction of Global/Regional Assimilation and Prediction System-Cycle of Hourly Assimilation and Forecast (GRAPES-CHAF) and Shanghai Meteorological Service-WRF ADAS Rapid Refresh System (SMS-WARR), we present an improved weighting method of time-lag-ensemble averaging for hourly precipitation forecast which gives more weight to heavy rainfall and can quickly select the optimal ensemble members for forecasting. In addition, by using the cross-magnitude weight (CMW) method, mean absolute error (MAE), root mean square error (RMSE) and correlation coefficient (CC), the verification results of hourly precipitation forecast for next six hours in Hunan Province during the 2019 typhoon Bailu case and heavy rainfall events from April to September in 2020 show that the revised forecast method can more accurately capture the characteristics of the hourly short-range precipitation forecast and improve the forecast accuracy and the probability of detection of heavy rainfall.

1. Introduction

Short, extreme rainfall events are a frequent occurrence in China, often with great societal and economic impacts. However, due to their small scale, short life history, abrupt onset and dissipation, and complex moving path, forecasts and early warning have always been difficult [1,2]. In previous studies, the short-range forecast was mainly based on radar echo, satellite cloud image and other data for extrapolation. The mature methods used in China include extrapolation techniques and empirical prediction methods, such as traditional and improved optical flow methods and ingredients-based methodology [3,4,5]. It has been revealed that due to the lack of the physical mechanism of the evolution of the severe convective system, the prediction ability of this method decreases rapidly with the increase in the forecast lead times, and the available time limit of extrapolation is less than one hour [6]. With the continuous development of numerical weather precipitation techniques and the improvement of computer performance, especially the method of combining extrapolation prediction with high-resolution numerical prediction, the prediction skills of mesoscale models for precipitation have been continuously improved [7,8].
Compared with deterministic model prediction, ensemble prediction can provide uncertain prediction information by using multiple initial values or models to estimate the probability distribution of prediction error [9,10,11]. Previous studies have shown that even low-resolution ensemble models have higher prediction skills than single high-resolution models [12,13]. Although ensemble forecasting has significantly improved short and medium-term forecasting skills, it is still insufficient for local short-range heavy precipitation weather forecasting [14]. As the precipitation forecast is greatly influenced by the “spin-up” of the numerical model and the initial values, the traditional numerical forecast model which updates the initial field of the model every six hours or more is not suitable for short-range forecast. It is necessary to develop a data assimilation and analysis system with a short time interval. Therefore, the model based on the rapid update cycle (RUC) system plays an increasingly important role in short-term rainstorm weather forecasts and early warning [15,16,17,18,19,20]. In recent years, a great number of scientific research institutions in China have established rapid update assimilation forecasting systems with different techniques. Meteorological research institutions in Beijing [21], Shanghai [22,23], Guangzhou [24,25] and Wuhan [26] have established RUC forecast systems for short-range forecast and meteorological services in north, east, south, and central China, respectively.
Although the RUC forecasting system provides an early warning long enough for short-term forecasting, due to high-frequency data assimilation and the “imperfection” of high-resolution models, post-processing techniques of model products have become an important way to take full advantage of the performance of high-resolution models. In addition, due to the “fast update” feature of the RUC system, there are multiple forecasts with different initial times for the same forecast lead time, but the forecast deviation of each initial time is different, which brings challenges to forecasters [27,28]. The time-lag-ensemble prediction technique solves this problem. It was first proposed and applied by Hoffman [29] in medium- and long-range forecasting, and then introduced by Hou et al. [30] and Walser et al. [31] into short-range ensemble forecasting. In recent years, many scholars have applied this method to short-range precipitation forecasting, which has significantly improved the ability of short-range precipitation forecasting. However, previous studies focused more on the correction of accumulated precipitation rather than on the correction of hourly precipitation. Tang and Zheng [19] improved the hourly short-range precipitation forecasting ability of GRAPES-RAFS by identifying the optimal forecast members through TS (Threat Score). Although the TS score is able to measure different levels of precipitation, it is not enough to verify the cross-magnitude precipitation. For example, in China, the precipitation within the range of 25–49.9 mm is defined as heavy rain, and 50–99.9 mm as rainstorm. When the observed precipitation is 50 mm and the predicted precipitation is 49 mm, the absolute error of the predicted precipitation is small and the prediction is accurate, but the TS score is 0. Therefore, using the TS score to select ensemble members does not apply to heavy rainfall quantitative forecast. We pay more attention to the occurrence of heavy precipitation for very short-range precipitation forecast (0–6 h), but previous methods do not consider any specific weighting allocated to events more likely to cause significant impacts such as extreme rainfall events. Moreover, the classification of short-range precipitation is usually the same as that of 24 h, and there is no special grading method for the hourly rainfall intensity. In order to solve these problems, based on the objective classification of hourly rainfall intensity, we present a cross-magnitude weight (CMW) method for very short-range precipitation. This method adds more weight to heavy rain and determines the final forecast result by evaluating forecasts of hourly precipitation at different forecast initial times.
The remainder of this paper is organized as follows. In Section 2, we introduce two RUC assimilation models popularly used in China. The weighting method of time-lag-ensemble averaging for hourly precipitation forecasts is shown in Section 3. Results are then presented in Section 4. These include an evaluation of forecasts of rainfall produced by typhoon Bailu, which primarily impacted Fujian, but also parts of Hunan, in August 2019. Section 5 presents the conclusions and discussions.

2. Brief Introductions of the Two Models

Global/Regional Assimilation and Prediction System-Cycle of Hourly Assimilation and Forecast (GRAPES-CHAF) are developed on the basis of the GRAPES-meso model. The IFS analysis field provided by ECMWF model is used for the initial boundary data of GRAPES-CHAF. The initial guess field is obtained from the 3-h ECMWF forecast at 1200 UTC every day. The initial guess field at other times is from the 1-h GRAPES-CHAF forecast. The initial field is obtained by assimilating the observation data through GRAPES-3DVAR. The number of horizontal grid points is 634 × 434, and there are 55 layers in the vertical direction.
Shanghai Meteorological Service-WRF ADAS Rapid Refresh System (SMS-WARR) is developed on the basis of the WRF model, and the boundary field is derived from the GFS forecast field at 1200 UTC every day. The initial guess field is from the GFS 6-h forecast at 1200 UTC every day. The initial guess field at other times is from the SMB-WARR 1-h forecast. The initial field is obtained by assimilating the observation data through ADAS. The number of horizontal grid points is 525 × 625, and there are 51 layers in the vertical direction.
These two models are mainly aimed at the short-range weather forecast, with 1 h and 24 h lead time, respectively. Radar, satellite, aircraft, ground and sounding observation are assimilated hourly. The horizontal resolution is 3 km. Since the resolution of 3 km can explicitly distinguish cloud physical processes, no convection parameterization scheme was used. Table 1 shows the physical parameterization schemes used in the two models.

3. Methods

3.1. Study Area

The area we studied is Hunan Province, located in the middle reaches of the Yangtze River, surrounded by mountains and hills in the east, south, and west (Figure 1). It is an asymmetric horseshoe-shaped basin, high in the West and low in the East, high in the South and low in the north. Due to the obvious influence of terrain on rainfall, especially in mountainous regions [32,33,34], the rainstorm occurred frequently from April to September in Hunan Province.

3.2. Classification of Hourly Precipitation Intensity

Based on the hourly precipitation of 97 national observation stations in Hunan Province from April to September during 2015–2019, the hourly precipitation can be divided into six grades: no precipitation (x < 0.1 mm), light rain (0.1 mm ≤ x < 3 mm), moderate rain (3 mm ≤ x < 10 mm), heavy rain (10 mm ≤ x < 20 mm), rainstorm (20 mm ≤ x < 45 mm) and extraordinary rain (x ≥ 45 mm) (Table 2).

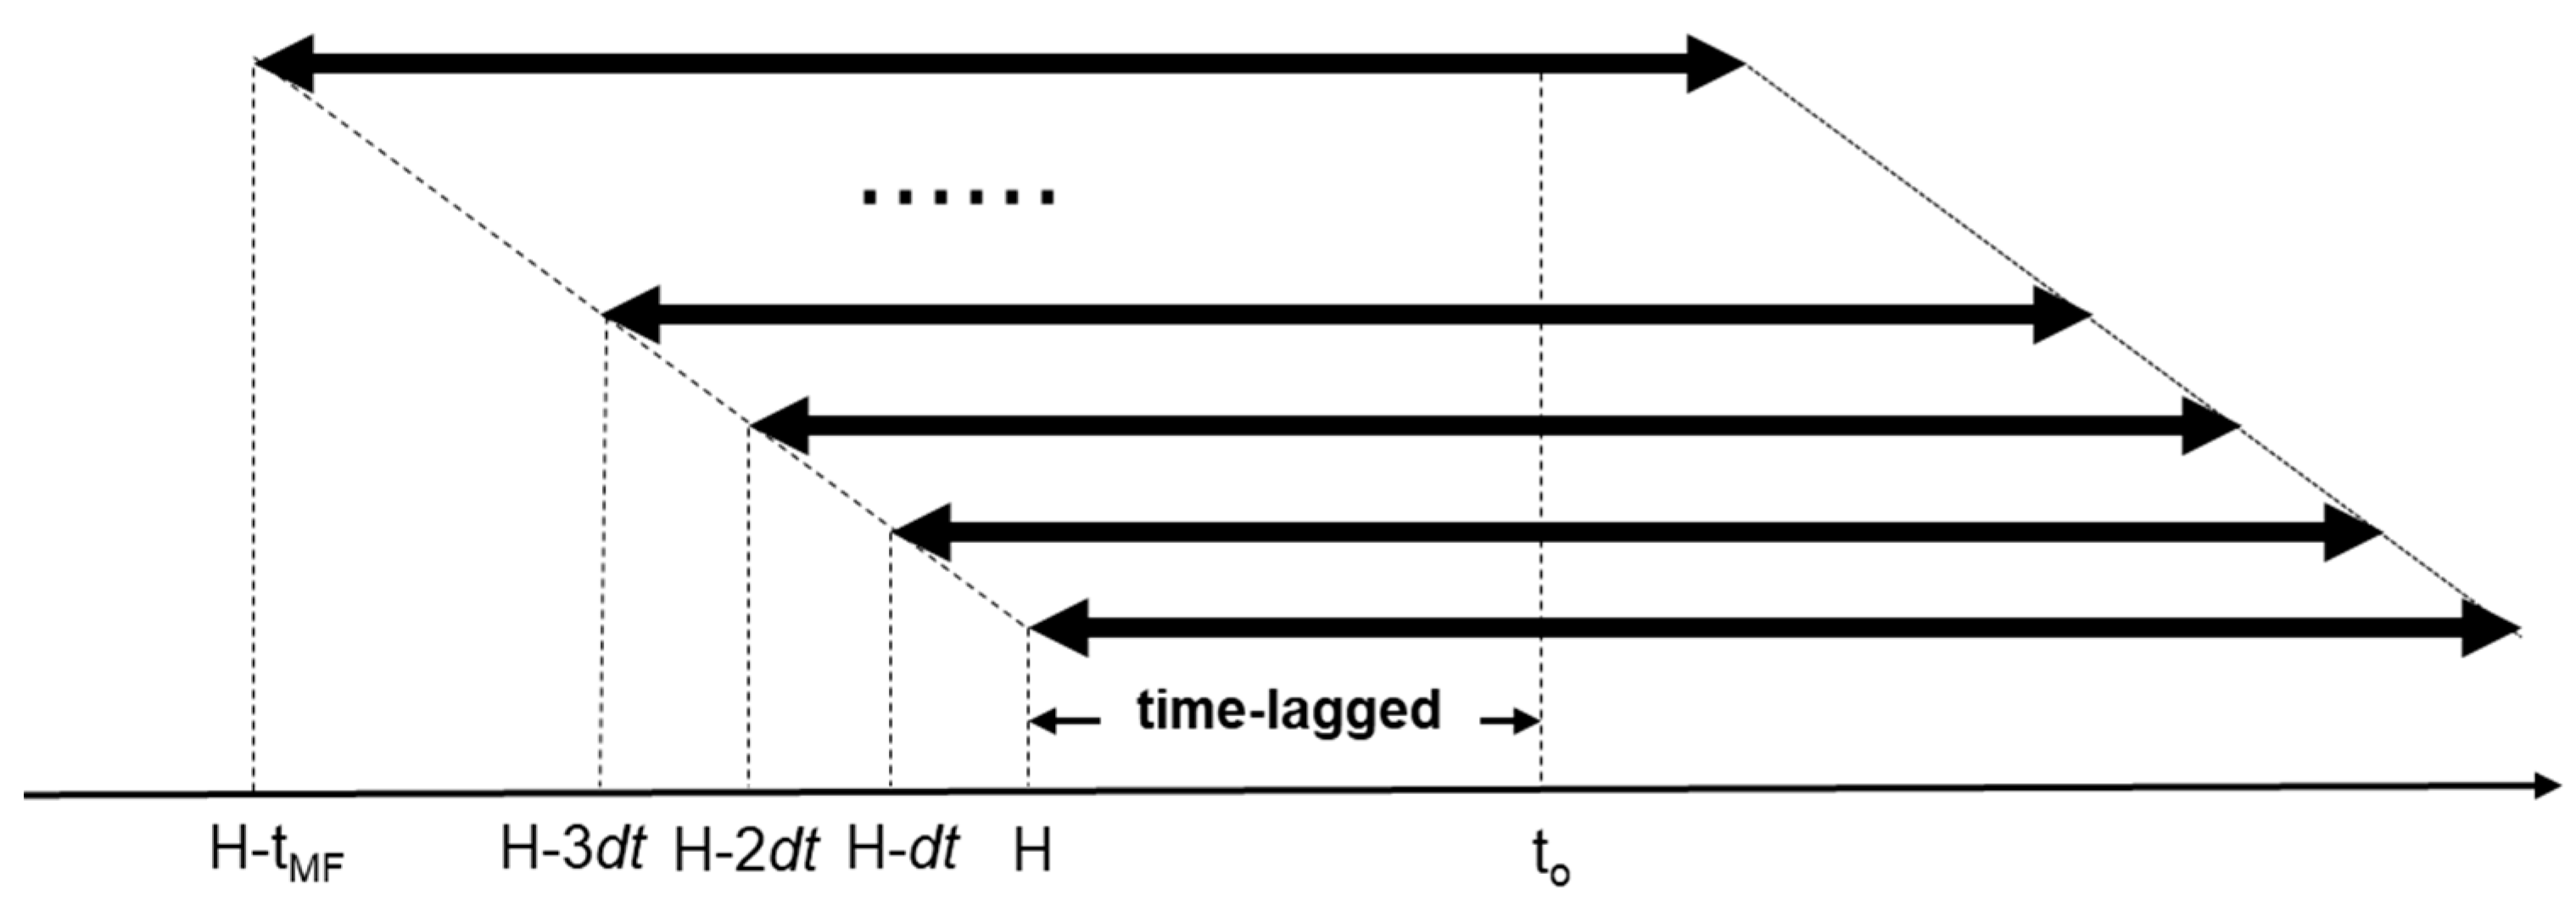
3.3. Time-Lag-Ensemble Forecasting Method

Although the models can distinguish the mesoscale and mesoscale convective activities, they have some shortcomings. The time-lag-ensemble forecasting method integrates the model forecast results of different forecast reference times and forecast lead times for the same time, selects different weights to obtain the revised hourly precipitation forecast, which can effectively improve the forecast error caused by the “spin-up” of the model and the uncertainty of the initial field. Based on the hourly precipitation products of GRAPES-CHAF and SMS-WARR within 24 h, the ensemble members of the two models are formed by the time-lag-ensemble method, respectively. Figure 2 shows the composition of the ensemble members at the current time (H). The formula for calculating the number of ensemble members (N) of the forecast field is as follows:
N = ( I N T [ M L d t ] i ) n
where N is the number of ensemble members, INT is the rounding operator, M is the longest forecast lead time for optional model prediction, L is the forecast lead time of the prediction time for the current time H, dt is the prediction time interval of the model, i is the time lag caused by computation and data transmission, and n is the number of models.
For the two models, the longest forecast lead time is 24 h, the forecast lead time of t0 is the next six hours of the current time H, and the prediction time interval (dt) of the model is one hour. Nearly two hours have passed since the mode products were transmitted to Hunan, so the time lag is about two hours. There are 16 ensemble members that can forecast the precipitation in the next six hours for each model through calculation. Based on GRAPES-CHAF and SMS-WARR, the initial fields at different times at intervals of 1h are used for prediction, and then the ensemble members are constructed from the prediction results at the same time (Figure 2). For example, the ensemble members include −03Z, −04Z, −05Z, …, −18Z of two patterns, with a total of 32 members, which are denoted as M1, M2, M3... M32, respectively.
By comparing the distribution of the frequency of highest precipitation forecast scores of ensemble members in GRAPES-CHAF and SMS-WARR with 32 different ensemble members in the next six hours (Figure 3), it can be found that the highest score of time-lagged ensemble members occur more frequently when they are close to or far away from the forecast reference time, and few high scores occur in the middle of forecast reference times in GRAPES-CHAF. In SMS-WARR model, the highest scores of ensemble members appear more frequently when they are close to the forecast reference time, and little difference among other ensemble members. Through statistics, it can be found that although some members of the two models obtain the highest score when they are close to the forecast reference time, the probability is less than 20%. Due to the continuous adjustment and updating of the model, it costs lots of time to select the best forecast member manually. Through the time-lag-ensemble forecasting method, the revised precipitation forecast products can be directly provided, and the forecast efficiency can be greatly improved.

3.4. Optimal Integration Method of Cross-Magnitude Weight

How to correctly verify the prediction capacity of each member, so as to select the members with high forecast scores, has become an important factor affecting the effect of the final ensemble revision forecast. In this study, on the basis of objective classification of hourly precipitation intensity, we allocated different weights to precipitation with different magnitudes and establish a new verification method suitable for hourly precipitation, that is, a cross-magnitude weight method (Table 3).
A high score indicates an accurate prediction. The weight of different grades of precipitation is different. The highest scores of light rain, moderate rain, heavy rain and rainstorm are 1, 1.5, 2 and 4, respectively.
When there is no precipitation observed but the model predicts precipitation, the score is calculated by the score reduction method, and the greater the deviation, the greater the score reduction. For example, if there is no precipitation observed and the forecast is light rain, moderate rain, heavy rain or rainstorm, the scores will be reduced by 0.2, 0.3, 0.5 and 0.8 points, respectively. When there is no precipitation in observation and forecast, there is no score.
The cross-magnitude weight method sets up a calculation method according to the scoring when the observed and the predicted precipitation are of adjacent magnitude. When the difference between them is small, it is considered that they are of the same magnitude, and the highest score is obtained according to the observed precipitation magnitude, instead of zero by the traditional scoring method.
Moreover, prediction underestimation or overestimation can still be scored, but the score should be lower than the highest score of the right grade. For example, the observation is rainstorm, if the forecast is heavy rain, the score is 1.5, which is lower than the highest score of heavy rain grade (2 points); if the forecast is moderate rain, the score is 0.5, which is lower than the highest score of moderate rain grade (1.5 points); if the forecast is light rain, the score is 0, which is lower than the highest score of light rain grade (1 point).
Based on the hourly precipitation data of Hunan automatic weather stations, the hourly precipitation of ensemble members with 16 different forecast reference times in the past three hours in each model is dynamically evaluated by using the cross-magnitude weight method. The forecast of the ensemble members with the top three scores is selected to revise the hourly forecast in the next six hours. The process is shown schematically in Figure 4.

4. Results

In this paper, four metrics are designed to evaluate the accuracy of hourly precipitation forecasting in Hunan in the next six hours by using the CMW method, mean absolute error (MAE), root mean square error (RMSE) and correlation coefficient (CC) statistical methods. Table 4 lists the specific calculation methods of the plans.

4.1. Revised Forecast for Typhoon Bailu

Hunan Province is one of the inland provinces which are often directly or indirectly affected by typhoons. The heavy rainfall caused by typhoons often leads to floods and other disasters, causing huge losses to the national economy and personal property. Due to many uncertainties in the development and evolution of heavy rainfall caused by the typhoon, the short-term forecast and nowcasting are very difficult [35,36]. Therefore, it is very important to verify the forecast ability of the revised forecasting method in typhoon rainstorms.
From 25 to 26 August 2019, Typhoon Bailu caused rainstorms in southeast Hunan, and the strongest precipitation occurred in the early morning of 26 August. The 38 h from 08:00 on the 25th to 20:00 on the 26th were selected as the study period.
Table 5 shows verification scores of four forecast plans for hourly precipitation in the next six hours during the impact period (08:00 on 25th to 20:00 on 26th) and the strongest precipitation period (20:00 on August 25th to 02:00 on 26th) caused by typhoon in Hunan Province. The CMW score and CC of Plan 1 is the highest, reaching 0.078 and 0.239, respectively. Moreover, the score of MAE and RMSE of Plan 1 are 0.835 and 2.121, respectively, which were the lowest among the four plans. It should be noted that the Probability of Detection (POD) of Plan 1 for short-range precipitation reaches 50.535%, which is higher than that of the other three plans, while the False Alarm Ratio (FAR) is lower than that of the other three plans. It can be seen that the score of the revised forecast is significantly higher than the latest time forecast and single member forecast, especially in the forecast of the strongest precipitation period. In the period of the strongest rainfall, Plan 1 is more accurate for the area of 25 mm and above, while the other schemes are different for the area of heavy rain and above. In particular, for Plan 3 and Plan 4, the areas with rainfall forecast greater than 50 mm are to the east and north, respectively compared with the observation. Moreover, the forecast is obviously smaller in the areas where heavy rain is observed (Figure 5). Although the FAR of Plan 1 is slightly higher than that of Plan 2, the POD is significantly improved compared to Plan 2, and both POD and FAR are better than Plan 3 and Plan 4. Furthermore, the score of CMW, MAE, RMSE, CC and POD of Plan 1 are 0.081, 0.813, 2.162 and 0.185, respectively, and the four statistical indicators are better than the other three plans (Table 5). It is worth mentioning that the prediction effect of Plan 1 in the strongest precipitation period of the typhoon is better than that in the whole influence period of the typhoon. The revised forecast improves the prediction ability of RUC forecast models for the heavy precipitation process.
By comparing the hourly forecast of the ensemble member with the highest score and the equally weighted average forecast of ensemble members with top three scores, and the forecast at the nearest forecast reference time (Figure 6), it can be seen that in the early, middle and late stages of typhoon precipitation, the score of Plan 1 is the highest. The scores of Plan 2 and Plan 4 are higher than that of Plan 3 in the early stage of typhoon precipitation. In the middle stage of typhoon precipitation, there is little difference among them, but Plan 4 has almost no ability to predict the later stage of typhoon precipitation.

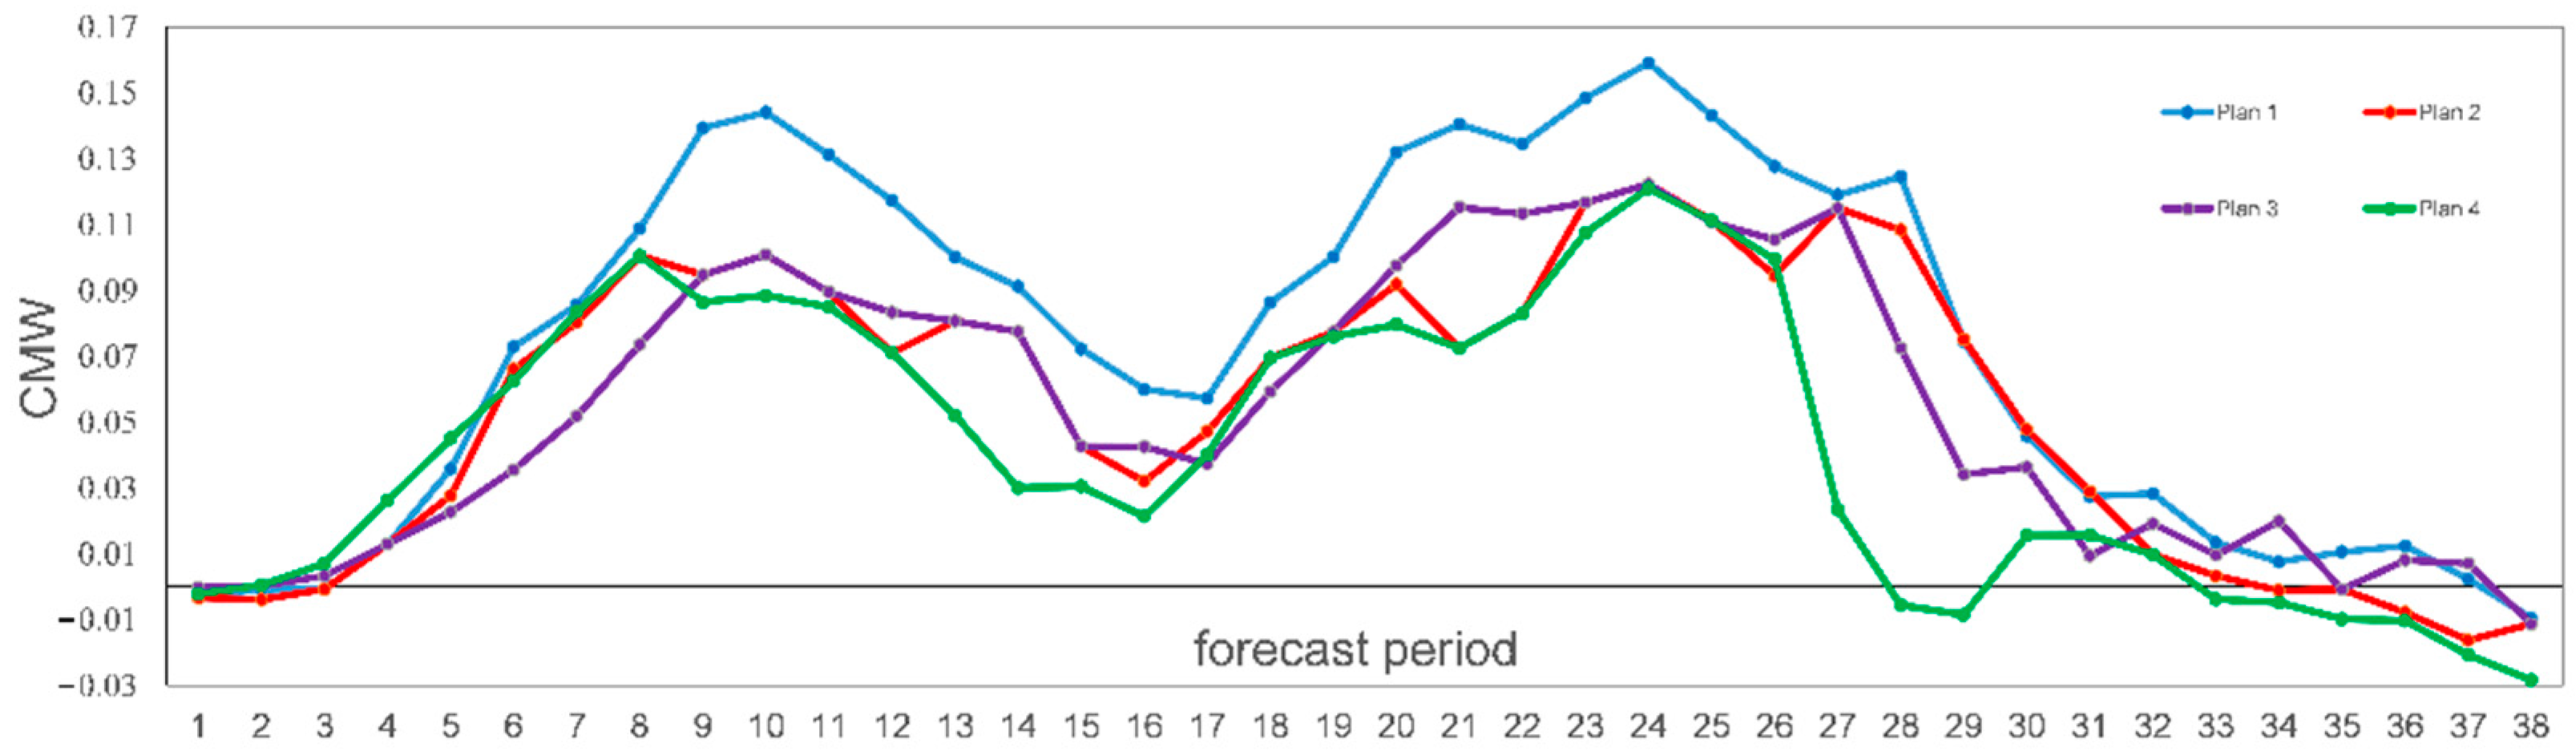
4.2. Statistical Verification for the Period from April to September in 2020

In order to know whether the score of precipitation forecast has been improved with this CMW method, we compared verification scores of four forecast plans for hourly precipitation in the next six hours from April to September in 2020 (Table 6). The results show that the statistical scores of the average precipitation forecast of the top three members (Plan 1) selected by the cross-magnitude weight method are higher than those of the other three plans. The CMW score of Plan 1 ranked first (0.034), followed by Plan 2 and Plan 4 (0.026 and 0.021), and Plan 3 was the lowest (0.014). Moreover, the MAE and RMSE of Plan 3 are 1.057 and 2.823, respectively, much higher than the other three plans. However, the difference between MAE and RMSE of Plan 1, Plan 2 and Plan 4 are very small. Taking Plan 4 as an example, its CMW score is lower than Plan 1, but its MAE and RMSE scores are slightly higher than Plan 1. The reason for this inconsistency is that in the precipitation verification of long time series, no precipitation and small precipitation usually account for the majority, and the error between observation and forecast is small, which makes RMSE/MAE value small. For the same reason, Plan 4 has the highest CC score. However, they are not good enough to evaluate heavy rainfall. The CMW score of Plan 1 is higher than that of others because it gives different weights to different magnitudes of precipitation, the greater the precipitation magnitude is, the greater the weight is. By further comparing the POD and FAR of the four plans for short-range heavy rainfall (greater than 20 mm/h), the POD of Plan 1 (32.967%) is obviously higher than that of the other three plans, while there is little difference in FAR among the four plans. Therefore, the reason for the highest CMW score of Plan 1 is that the forecast of heavy precipitation is the best, and the forecast of heavy precipitation is usually the focus of the short-range forecast. By calculating FAR, it can be found that the FAR of the four plans is not much different, but the POD of Plan 1 is much higher than the other three plans.

5. Conclusions and Discussion

In this study, based on the hourly precipitation forecast of the GRAPES-CHAF and SMS-WARR models, 16 different ensemble members are constructed for each model by using the time-lag-ensemble method. Meanwhile, on the basis of the statistics of hourly rainfall intensity in Hunan Province, considering the accuracy of wet or dry prediction, the score weight of precipitation with different magnitudes and the score weight of the difference between observation and forecast, we present an optimal integration method of cross-magnitude weight for the hourly precipitation forecast in the next six hours. The revised precipitation forecast products can be directly provided, and the forecast efficiency can be greatly improved.
In order to evaluate the accuracy of the new revised method, we designed four forecast plans to verify the hourly forecast precipitation during typhoon Bailu in 2019 and during April to September 2020 by using CMW, MAE, RMSE and CC. The four plans are the average forecast of ensemble members with top three scores, forecast of ensemble member with the highest score, forecast at the nearest forecast reference time of GRAPES-CHAF, forecast at the nearest forecast reference time of SMS-WARR. The result shows that the score of the improved time-lag-ensemble forecasting method is significantly higher than the latest time forecast and single-member forecast, especially for precipitation areas greater than 25 mm. Heavy rainfall forecast is usually the focus of a short-range forecast. As the CMW method gives higher weight to heavy rainfall, the POD is obviously higher than that of the latest time forecast of GRAPES-CHAF and SMS-WARR.
The objective forecast revised method in this paper can quickly select the optimal model members and has a good application prospect in short-range hourly precipitation forecast (especially rainstorm forecast). Moreover, the method is not sensitive to terrain and other underlying surface information and can be applied in other regions. We must acknowledge that there is a significant weakness in this analysis. This study mainly focuses on the correction of precipitation forecast, which largely depends on the prediction ability of the model itself. The forecast revised ability is insufficient when the forecast deviation of the rainfall position of the model is large. Jeong [37] proposed a statistical parameter correction technique to correct the daily distribution of the predicted near-surface temperature and wind speed. In a future study, we will try to revise the hourly precipitation distribution to further improve the POD of short-range heavy precipitation. In addition, more physical quantities and massive data can be utilized in the future to explore the objective revised method of quantitative precipitation forecast based on machine learning.

Author Contributions

Conceptualization, L.Z. and L.X.; methodology, L.Z. and M.L.; validation, M.L. and J.C.; formal analysis, L.X. and L.Z.; data curation, L.Z. and M.L.; writing—original draft preparation, L.Z. and L.X.; writing—review and editing, L.X. and L.Z.; project administration, L.Z. All authors have read and agreed to the published version of the manuscript.

Funding

This research received no external funding.

Acknowledgments

The authors would like to thank the three anonymous reviewers for their valuable comments and thoughtful suggestions to improve the quality of the paper. The research in this paper is supported by the Innovation and Development Program of China Meteorological Administration (grant number CXFZ2021J020), Open Funds of China Meteorological Administration/Guangdong Key Laboratory of Regional Numerical Weather Prediction (grant number J201805), Hunan Research and Development Program of Key Fields (grant number 2019SK2161), and the Innovation and Development Program of Hunan Meteorological Administration (grant number XQKJ21C009).

Conflicts of Interest

The authors declare no conflict of interest.

References

  1. Schmid, W.; Mecklenburg, S.; Joss, J. Short-term risk forecasts of heavy rainfall. Water Sci. Technol. J. Int. Assoc. Water Pollut. Res. 2002, 45, 121–125. [Google Scholar] [CrossRef]
  2. Mao, D.Y.; Zhou, Y.H.; Zhang, F.H. Mesoscale analysis of torrential rain in Hunan in early summer of 2005. Meteorology 2006, 32, 63–70. (In Chinese) [Google Scholar] [CrossRef]
  3. Zhang, X.L.; Yang, B.; Sheng, J. Development of Operations on Forecasting Severe Convective Weather in China. Adv. Meteorol. Sci. Technol. 2018, 8, 8–18. [Google Scholar]
  4. Cao, C.Y.; Chen, Y.Z.; Liu, D.H.; Li, C.; Li, H.; He, J. The optical flow method and its application to nowcasting. Acta Meteorol. Sin. 2015, 73, 471–480. (In Chinese) [Google Scholar] [CrossRef]
  5. Tian, F.Y.; Zheng, Y.G.; Zhang, T. Sensitivity Analysis of Short-duration Heavy Rainfall Related Diagnostic Parameters with Point-area Verification. J. Appl. Meteorol. Sci. 2015, 26, 385–396. (In Chinese) [Google Scholar] [CrossRef]
  6. Wilson, J.W.; Feng, Y.; Chen, M.; Roberts, R.D. Nowcasting challenges during the Beijing Olympics: Successes, failures, and implications for future nowcasting systems. Weather Forecast. 2010, 25, 1691–1714. [Google Scholar] [CrossRef]
  7. Yu, X.D.; Zheng, Y.G.; Wang, X.M. The advance in the nowcasting techniques on thunderstorms and seere convection. Acta Meteorol. Sin. 2013, 70, 311–337. (In Chinese) [Google Scholar] [CrossRef]
  8. Zheng, Y.G.; Zhou, K.H.; Sheng, J.; Lin, Y.; Tian, F.; Tang, W.; Lan, Y.; Zhu, W. Advances in techniques of monitoring, forecasting and warning of severe convective weather. J. Appl. Meteorol. Sci. 2015, 26, 641–657. (In Chinese) [Google Scholar] [CrossRef]
  9. Zhang, X.B.; Wan, Q.L.; Xue, J.S.; Ding, W.Y.; Li, H.R. The impact of different physical processes and their parameterizations on forecast of a heavy rainfall in South China in annually first raining season. J. Trop. Meteorol. 2015, 21, 194–210. [Google Scholar] [CrossRef]
  10. Huo, Z.H.; Duan, W.S.; Zhou, F.F. Ensemble Forecasts of Tropical Cyclone Track with Conditional Nonlinear Optimal Perturbations. Adv. Atmos. Sci. 2019, 36, 231–247. [Google Scholar] [CrossRef]
  11. Duan, W.S.; Wang, Y.; Huo, Z.H.; Zhou, F.F. Ensemble forecastmethods for numerical weather prediction and climate prediction: Thinking and prospect. Clim. Environ. Res. 2019, 24, 396–406. (In Chinese) [Google Scholar] [CrossRef]
  12. Grimit, E.P.; Mass, C.F. Initial results of a mesoscale short-range ensemble forecasting system over the Pacific Northwest. Weather Forecast. 2002, 17, 192–205. [Google Scholar] [CrossRef] [Green Version]
  13. Zhang, L.F.; Luo, Y. The effect of initial condition on numerical precipitation prediction and ensemble forecast. Sci. Meteorol. Sin. 2010, 30, 640–656. [Google Scholar] [CrossRef]
  14. Yan, Z.H.; Wang, Y.H.; Guo, H. Review and Prospect of operational numerical forecast of National Meteorological Center. Meteorology 2010, 36, 26–32. (In Chinese) [Google Scholar] [CrossRef]
  15. Benjamin, S.G.; Grell, G.A.; Brown, J.M.; Smirnova, T.G.; Bleck, R. Mesoscale weather prediction with the ruc hybrid isentropic–terrain-following coordinate model. Mon. Weather Rev. 2004, 132, 473–494. [Google Scholar] [CrossRef]
  16. Smith, T.L.; Benjamin, S.G.; Gutman, S.I.; Sahm, S. Short-range forecast impact from assimilation of gps-ipw observations into the rapid update cycle. Mon. Weather Rev. 2007, 135, 2914–2930. [Google Scholar] [CrossRef]
  17. Tang, X.; Sun, J.; Zhang, Y.; Tong, W. Constraining the Large-Scale Analysis of a Regional Rapid-Update-Cycle System for Short-Term Convective Precipitation Forecasting. J. Geophys. Res. Atmos. 2019, 124. [Google Scholar] [CrossRef]
  18. Benjamin, S.G.; Weygandt, S.S.; Brown, J.M.; Hu, M.; Alexander, C.R.; Smirnova, T.G.; Olson, J.B.; James, E.P.; Dowell, D.C.; Grell, G.A.; et al. A North American Hourly Assimilation and Model Forecast Cycle: The Rapid Refresh. Mon. Weather Rev. 2016, 144, 151221155337008. [Google Scholar] [CrossRef]
  19. Tang, W.Y.; Zheng, Y.G. Improvement of Hourly Precipitation Forecast Using a Time-Lagged Ensemble Based on Rapid Refresh Assimilation and Forecast. Meteor. Mon. 2019, 45, 305–317. (In Chinese) [Google Scholar] [CrossRef]
  20. Yu, X.D.; Zheng, Y.G. Research and operational progress of severe convective weather in China. Acta Meteorol. Sin. 2020, 78, 391–418. (In Chinese) [Google Scholar] [CrossRef]
  21. Chen, M.; Fan, S.Y.; Zheng, Z.F.; Zhong, J. The performance of the proximity sounding based on the BJ-RUC system and its preliminary implementation in the convective potential forecast. Acta Meteorol. Sin. 2011, 69, 181–194. (In Chinese) [Google Scholar] [CrossRef]
  22. Chen, B.D.; Wang, X.F.; Li, H.; Zhang, L. An Overview of the Key Techniques in Rapid Refresh Assimilation and Forecast. Adv. Meteorol. Sci. Technol. 2013, 32, 29–35. [Google Scholar] [CrossRef]
  23. Fu, N.; Chen, B.D.; Tan, Y.; Zhou, W. Time-Lag Ensemble Forecasting Experiment and Evaluation Based on SMB-WARR. Meteorol. Mon. 2013, 39, 1247–1256. [Google Scholar] [CrossRef]
  24. Chen, Z.H.; Huang, Y.Y.; Wang, Q.L.; Xue, J.S.; Ding, W.Y.; Zhang, C.Z. Flood season test and analysis of rapid updating cycle assimilation forecast system. J. Trop. Meteorol. 2010, 25, 49–54. (In Chinese) [Google Scholar] [CrossRef]
  25. Xu, D.S.; Zhang, Y.X.; Zhang, C.Z.; Zhong, S.X.; Dai, G.F.; Chen, Z.T. Comparison of different retrieval schemes for radar reflectivity in the high-resolution regional model in South China. J. Trop. Meteorol. 2016, 32, 9–18. [Google Scholar]
  26. Wang, Y.H.; Peng, J.X.; Gong, Y.; Cui, C. Establishment and Real-time Forecasting Verification of AREM-RUC 3h Rapid Update Assimilation and Forecast System. Torrential Rain Disasters 2011, 30, 296–304. [Google Scholar] [CrossRef]
  27. Cui, F.E.; Chang, J.Z.; Yan, C.Y.; Zhang, C.Y. Cause analysis and numerical prediction test of a local heavy rain at the southern foot of Yanshan Mountain. Adv. Meteorol. Sci. Technol. 2019, 9, 53–60. (In Chinese) [Google Scholar] [CrossRef]
  28. Yang, L.M.; Ge, Y.; CI, D.B.; Zeng, L.Z. Prediction ability test of swc-warms model products for disastrous weather process in Tibet. Tibet. Sci. Technol. 2019, 54–56. (In Chinese) [Google Scholar] [CrossRef]
  29. Hoffman, R.N.; Kalnay, E. Lagged average forecasting, an alternative to Monte Carlo forecasting. Tellus 1983, 35, 100–118. [Google Scholar] [CrossRef]
  30. Hou, D.; Kalnay, E.; Droegemier, K.K. Objective verification of the SAMEX’ 98 ensemble forecasts. Mon. Weather Rev. 2001, 129, 73–91. [Google Scholar] [CrossRef]
  31. Walser, A.; Luthi, D.; Schar, C. Predictability of precipitation in a cloud-resolving model. Mon. Weather Rev. 2004, 132, 560–577. [Google Scholar] [CrossRef]
  32. Yuter, S.E.; Houze, R.A. Microphysical modes of precipitation growth determined by S-band vertically pointing radar in orographic precipitation during MAP. Q. J. R. Meteorol. Soc. 2010, 129, 455–476. [Google Scholar] [CrossRef]
  33. James, C.N.; Houze, R.A. Modification of precipitation by coastal orography in storms crossing northern California. Mon. Weather Rev. 2005, 133, 3110–3131. [Google Scholar] [CrossRef]
  34. Zhong, S.X. Diurnal variation of the duration and environment for heavy rainfall during the warm season in South China. Atmos. Sci. Lett. 2020, 21, 1–6. [Google Scholar] [CrossRef]
  35. Wang, Y.P.; Wang, T. Numerical Simulation of a Heavy Rainstorm in Northeast China Caused by the Residual Vortex of Typhoon 1909 (Lekima). Atmosphere 2021, 12, 120. [Google Scholar] [CrossRef]
  36. Dong, L.; Zhang, F.Q. An Observation-Based Ensemble Subsetting Technique for Tropical Cyclone Track Prediction. Weather Forecast. 2016, 31, 57–70. [Google Scholar] [CrossRef] [Green Version]
  37. Jeong, J.; Lee, S.J. A Statistical Parameter Correction Technique for WRF Medium-Range Prediction of Near-Surface Temperature and Wind Speed Using Generalized Linear Model. Atmosphere 2018, 9, 291. [Google Scholar] [CrossRef] [Green Version]
Figure 1. The location and topography of Hunan Province in China.
Atmosphere 12 00875 g001
Figure 2. Sketch map of the construction of time-lagged ensemble members. (H is the current time, t0 is the forecast lead time and dt is the prediction time interval of the model).
Atmosphere 12 00875 g002
Figure 3. Frequency of highest precipitation forecast scores in the next six hours for 32 different ensemble members in the GRAPES-CHAF and SMS-WARR model.
Atmosphere 12 00875 g003
Figure 4. Schematic diagram of the optimal integration method of cross-magnitude weight for hourly precipitation forecasts.
Atmosphere 12 00875 g004
Figure 5. (a) Observation, (b) the average forecast of ensemble members with top three scores, (c) the forecast of the ensemble member with the highest score, (d) forecast at the nearest forecast reference time of the GRAPES-CHAF model and (e) the SMS-WARR model from 20:00 on the 25 August to 02:00 on the 26 August 2019.
Atmosphere 12 00875 g005
Figure 6. Verification of hourly precipitation forecast by using CMW method in the next six hours.
Atmosphere 12 00875 g006
Table 1. The parameterization schemes in GRAPES-CHAF and SMS-WARR models.
Physical ProcessGRAPES-CHAFSMS-WARR
MicrophysicsWSM6Thompson
Longwave radiationRRTMRPTMG
Shortwave radiationECMWFRPTMG
Near-surface layerM-OMonin-Obukhov (Janjic Eta)
Boundary layer schemeMRFMYJ
Land-surface process schemeSLABNoah
Table 2. Magnitude distribution of hourly precipitation (Unit: mm).
ObservationHourly PrecipMagnitude
No precip0 ≤ x < 0.1100
Light rain0.1 ≤ x < 310−2
Moderate rain3 ≤ x < 1010−3
Heavy rain10 ≤ x < 2010−4
Rainstorm20 ≤ x < 4510−5
Extraordinary rainstorm45 ≤ x10−6
Table 3. Cross-magnitude weight method *.
ObservationNo Precip
0 ≤ G < 0.1
Light Rain
0.1 ≤ G < 3
Moderate Rain
3 ≤ G < 10
Heavy Rain
10 ≤ G < 20
Rainstorm
20 ≤ G
Forecast
No rain
0 ≤ R < 0.1
0−0.2−0.3−0.5−0.8
Light rain
0.1 ≤ R < 3
−0.21 (R − G ≤ 3)0.80.50
Moderate rain
3 ≤ R < 10
−0.30.81.5 (−3 ≤ R − G ≤ 5)10.5
Heavy rain
10 ≤ R < 20
−0.50.512 (−5 ≤ R − G ≤ 10)1.5
Rainstorm and extraordinary rainstorm
20 ≤ R
−0.800.51.54 (G − R ≤ 10)
* G is the observed precipitation, R is the predicted precipitation, and the range value in brackets is the scoring condition when the observed and predicted precipitation are of adjacent magnitude. When the difference between the observed and predicted precipitation is within this range, they are regarded as the same magnitude.
Table 4. Four calculation plans of forecast products.
ProgrammeMethod
Plan 1Average forecast of ensemble members with the top three scores
Plan 2Forecast of ensemble member with the highest score
Plan 3Forecast at the nearest forecast reference time of GRAPES-CHAF
Plan 4Forecast at the nearest forecast reference time of SMS-WARR
Table 5. The different verification scores of hourly precipitation forecast in the next six hours from 20:00 on 25 August to 02:00 on 26 August 2019.
ProgramScore during Typhoon ProcessScore of Maximum Precipitation Period
CMWMAERMSECC* POD (%)* FAR (%)CMWMAERMSECC* POD (%)* FAR (%)
Plan 10.0780.8352.1210.23950.53550.6740.0810.8132.1620.18555.567457.264
Plan 20.0570.8572.4400.18841.52652.4210.0610.8452.6350.10645.68355.573
Plan 30.0570.8592.4420.20040.68253.3190.0600.8662.5570.22142.67860.732
Plan 40.0450.8462.4660.15636.99851.0020.0460.9942.7670.12638.89564.965
* The Probability of Detection (POD) and False Alarm Ratio (FAR) of the hourly precipitation over 20 mm.
Table 6. The different verification scores of hourly precipitation forecast in the next six hours from April to September in 2020.
ProgramCMWMAERMSECC* POD (%)* FAR (%)
Plan 10.0340.7182.1010.20232.96754.492
Plan 20.0260.7782.2200.14229.53453.381
Plan 30.0141.0572.8230.13023.69356.014
Plan 40.0210.7022.0480.25122.13052.010
* The POD and FAR of the hourly precipitation over 20 mm.
Publisher’s Note: MDPI stays neutral with regard to jurisdictional claims in published maps and institutional affiliations.

