
Real-World Vehicle Volatile Organic Compound Emissions and Their Source Profile in Chengdu Based on a Roadside and Tunnel Study

 ,
,  ,
,
Abstract
:
1. Introduction
2. Methodology
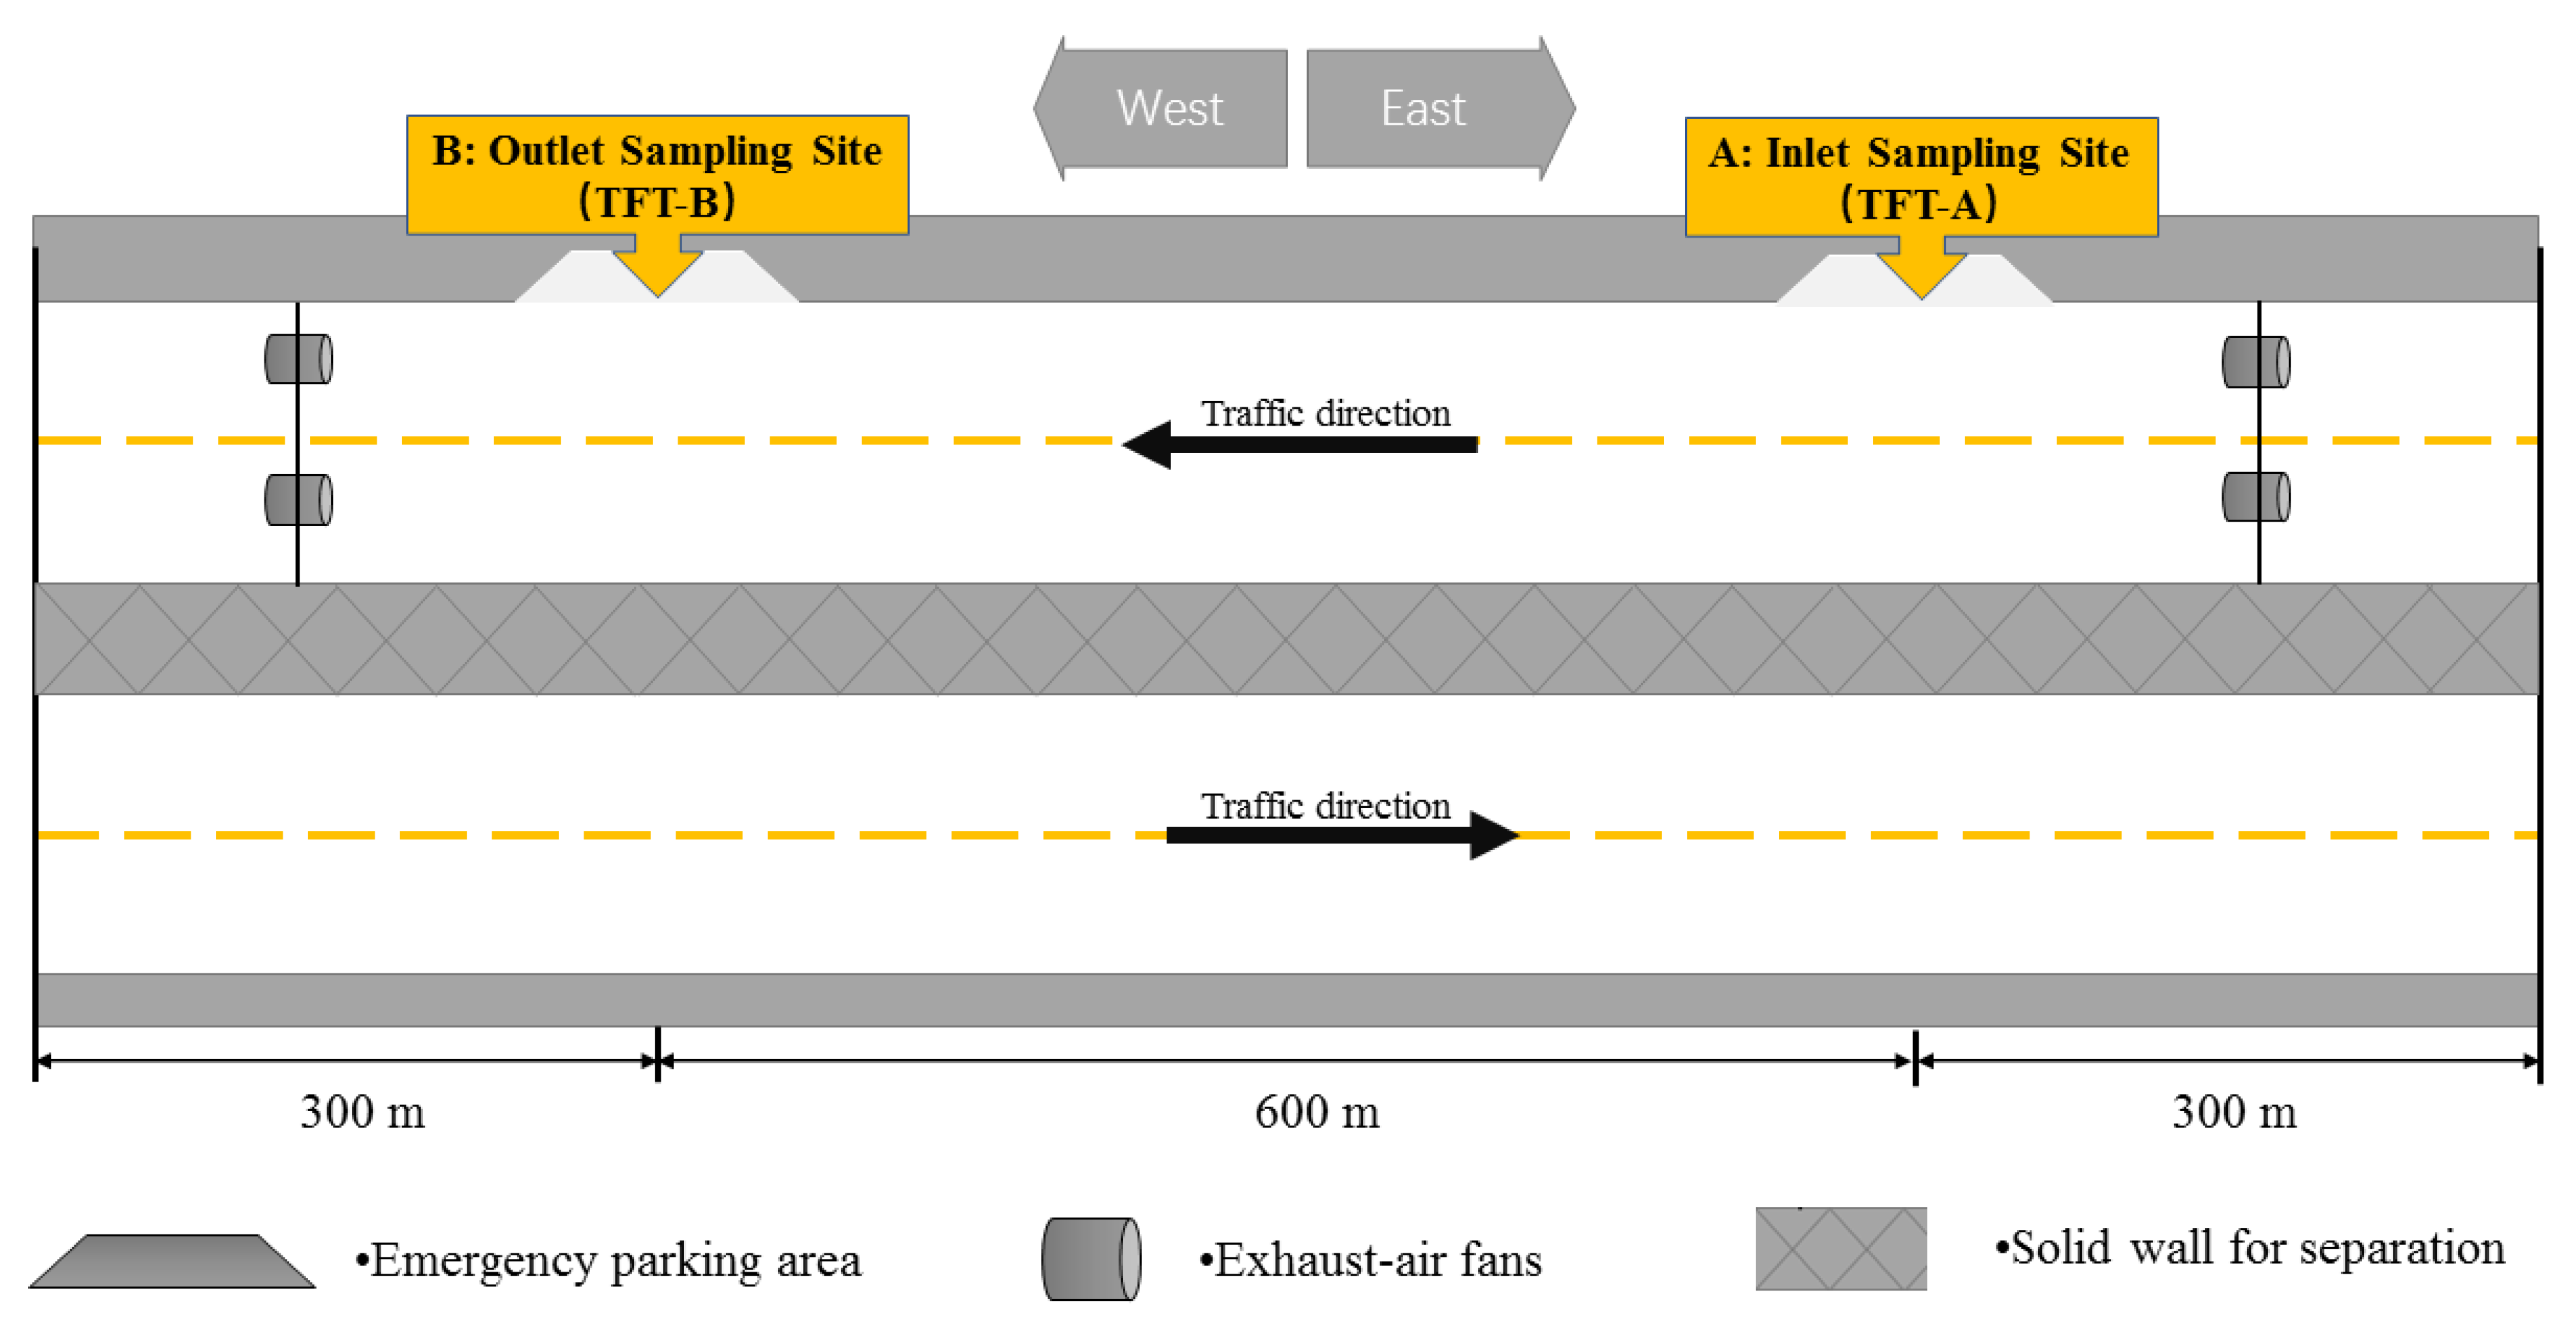
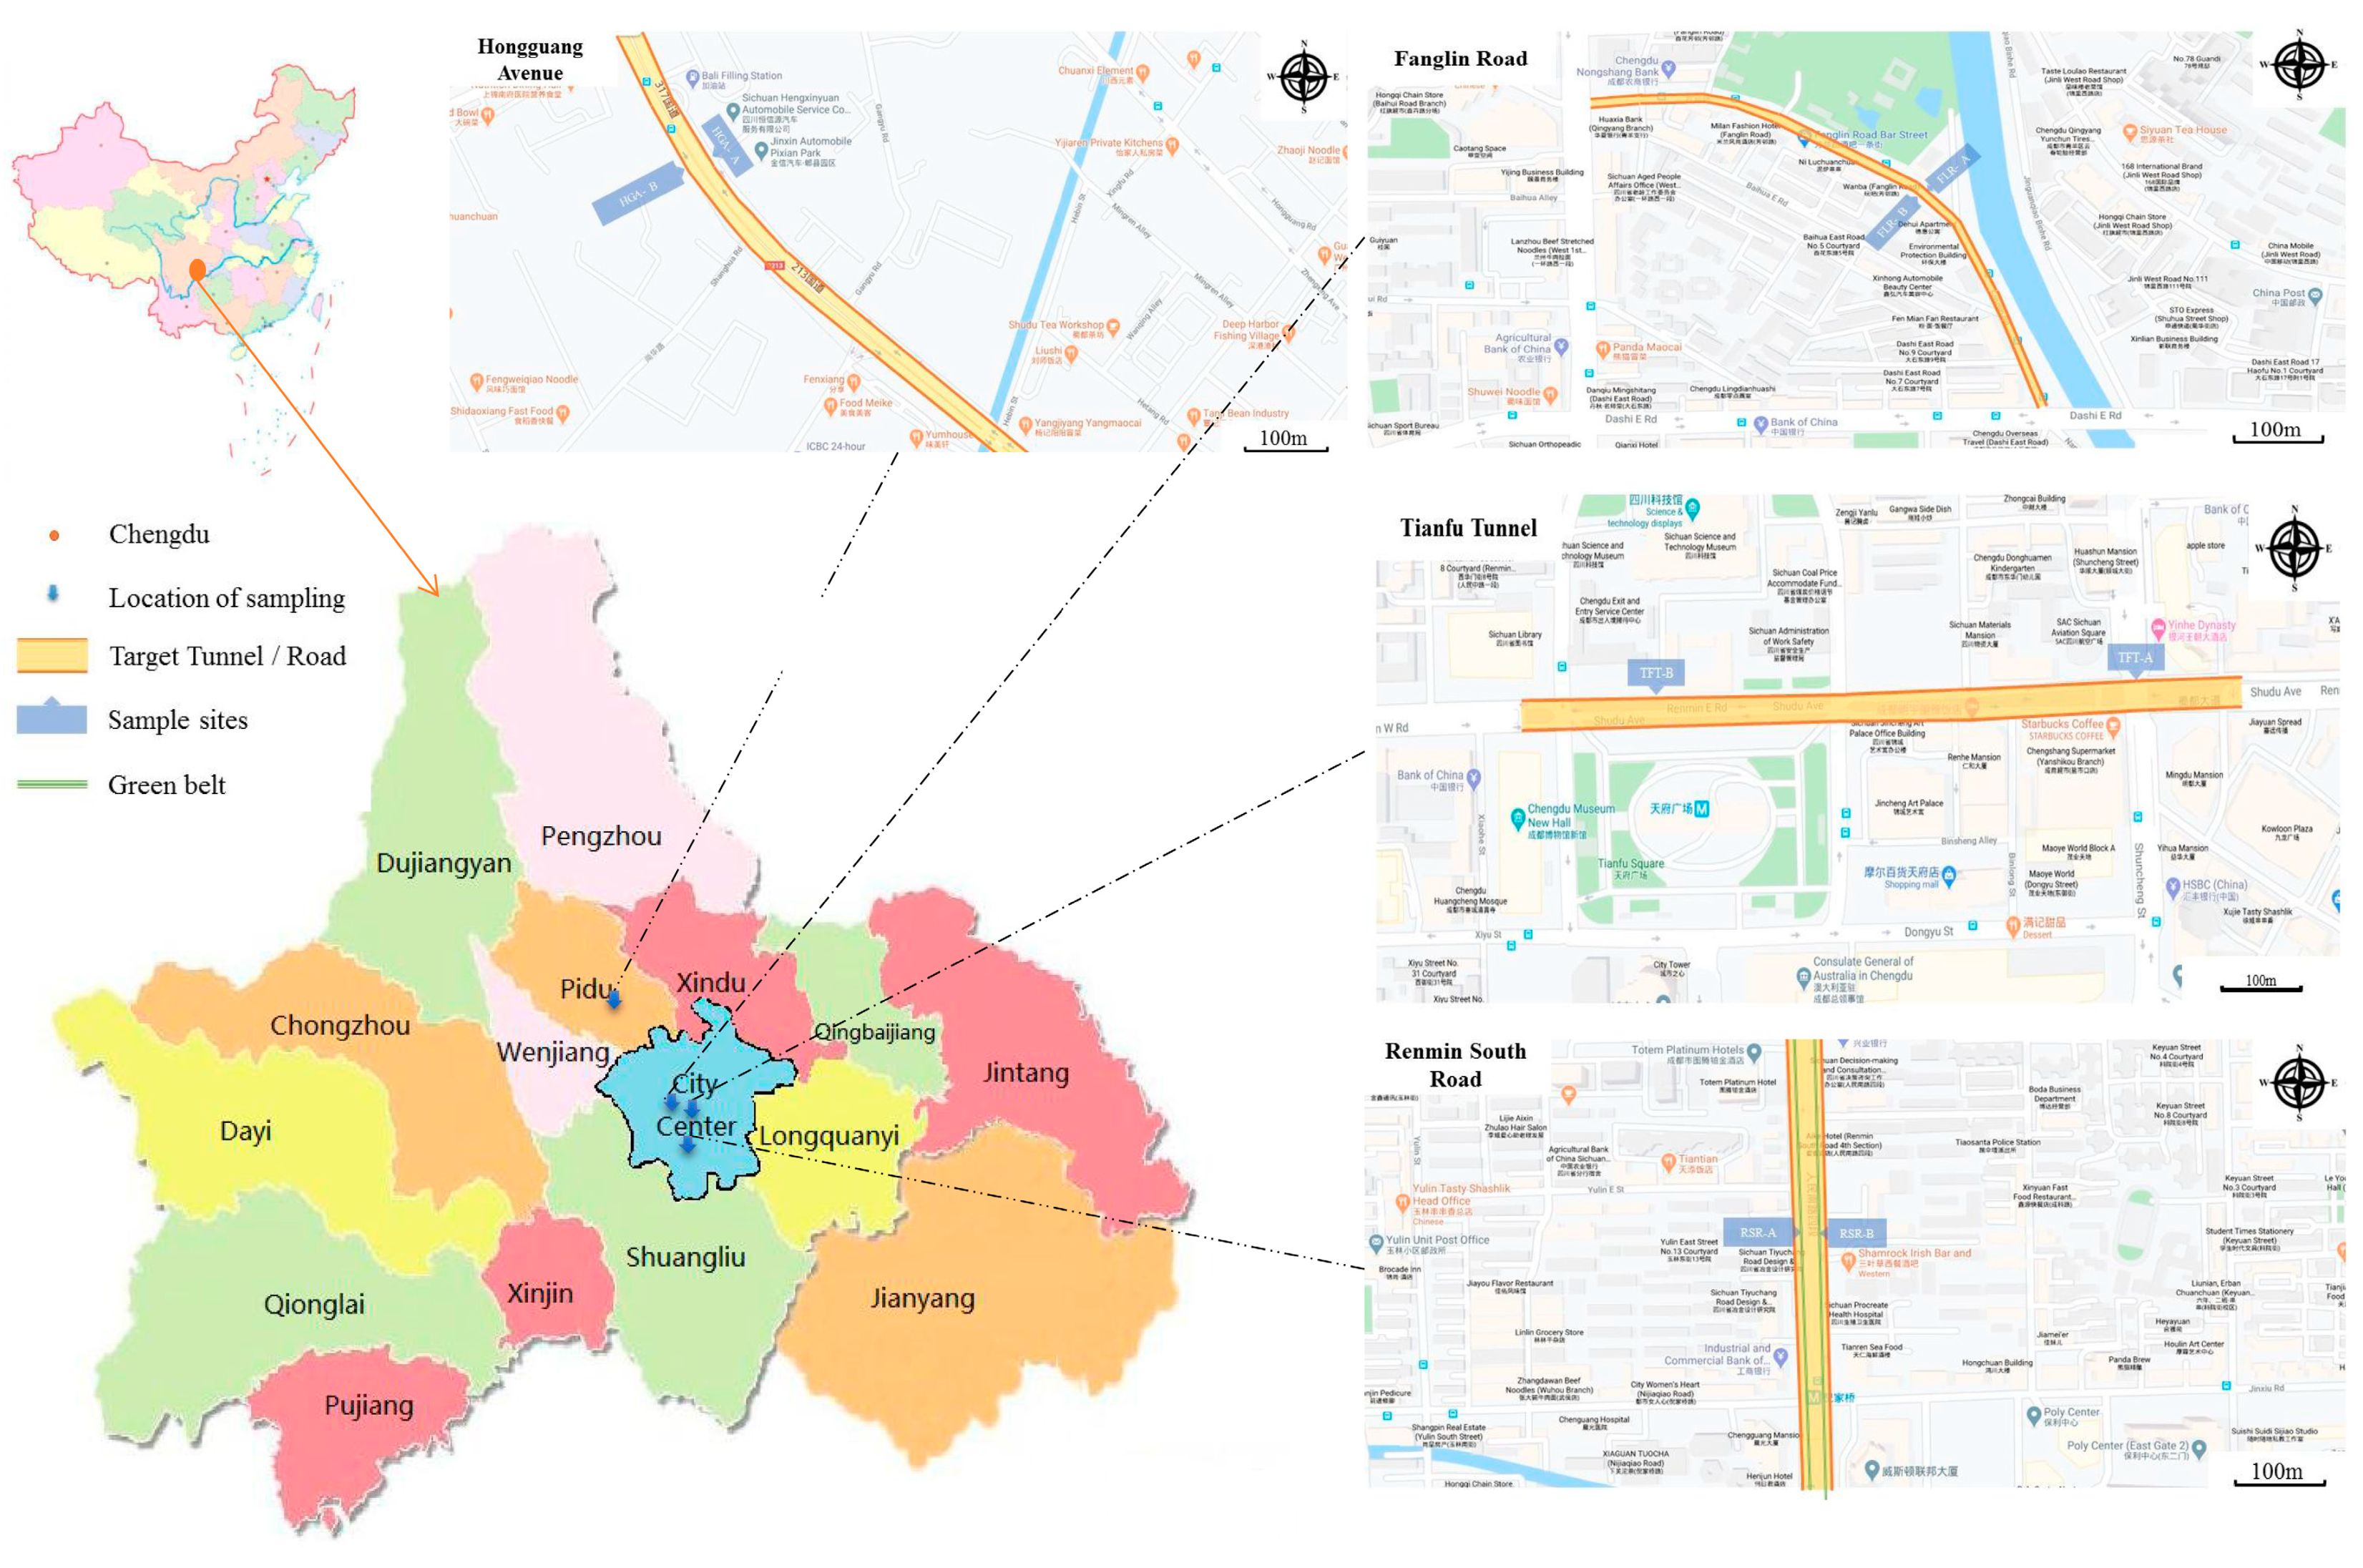
2.1. Sampling Sites
2.2. Sampling and Analysis
2.3. Emission Factor Calculations
2.4. Photochemical Reactivity of Vehicle Exhaust Emissions
3. Results and Discussion
3.1. Traffic Pattern and Concentration of VOCs at the Tianfu Tunnel
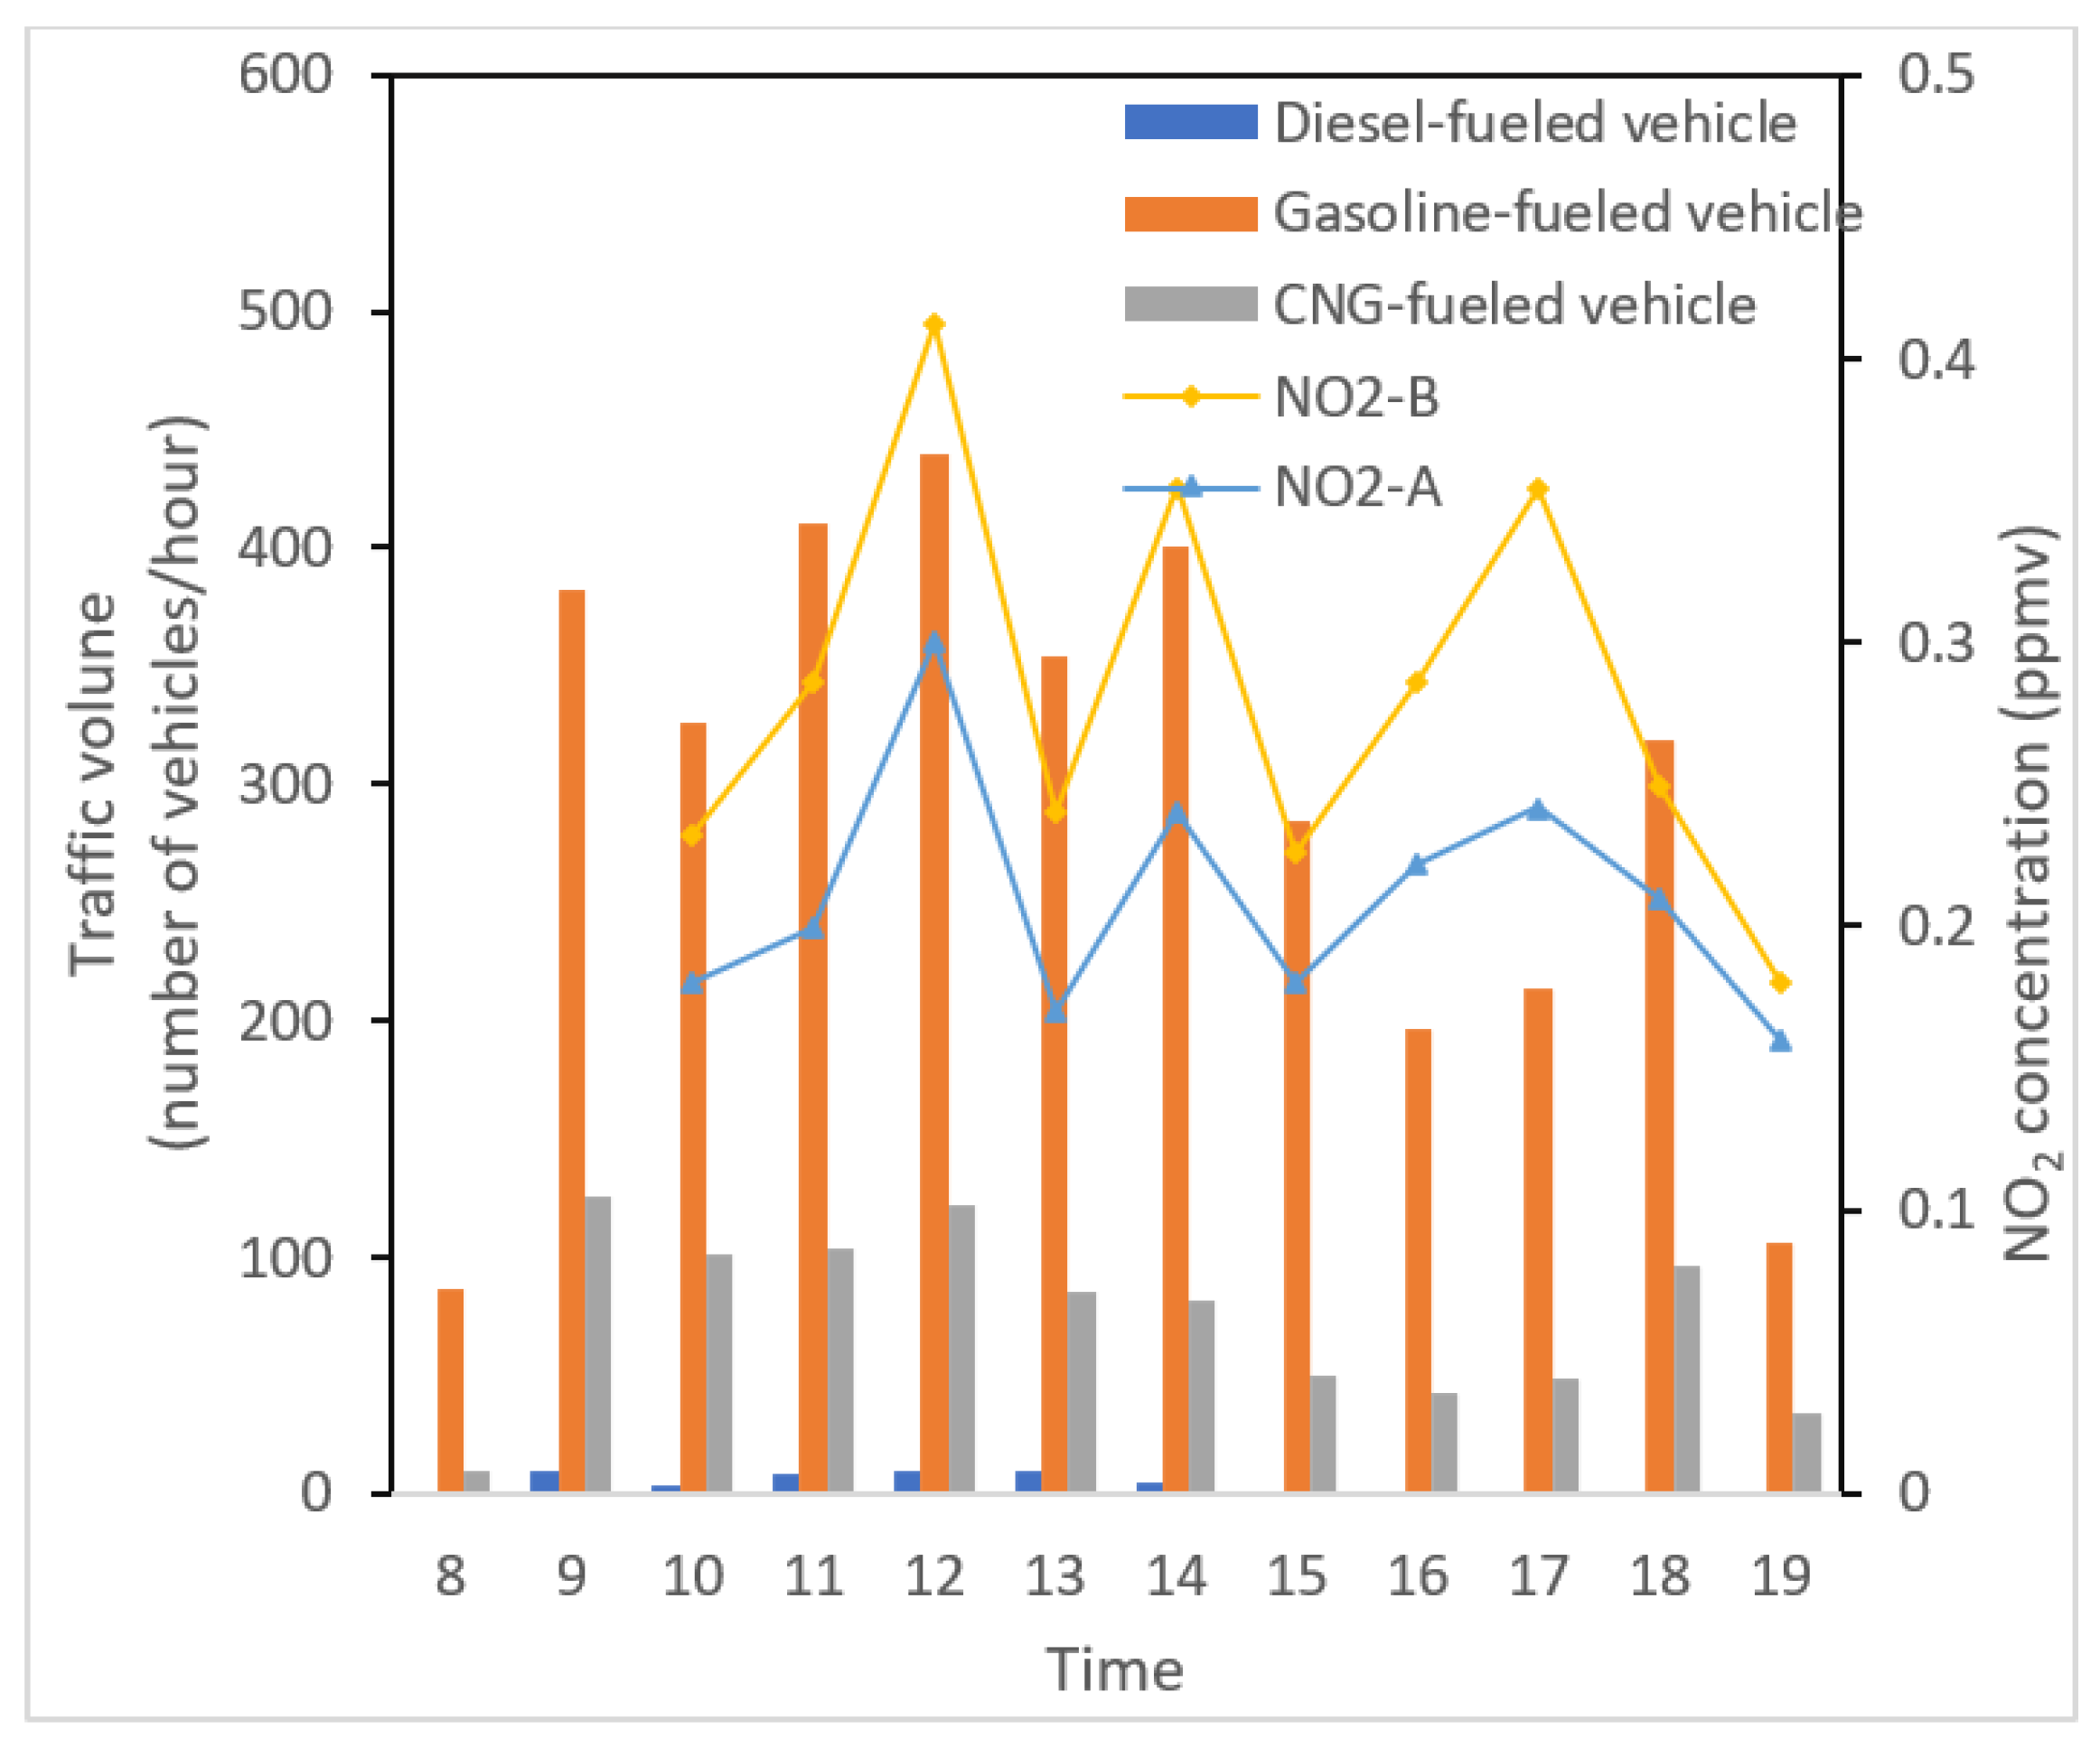
3.1.1. Characteristics of the Traffic Pattern and NO2 Concentration
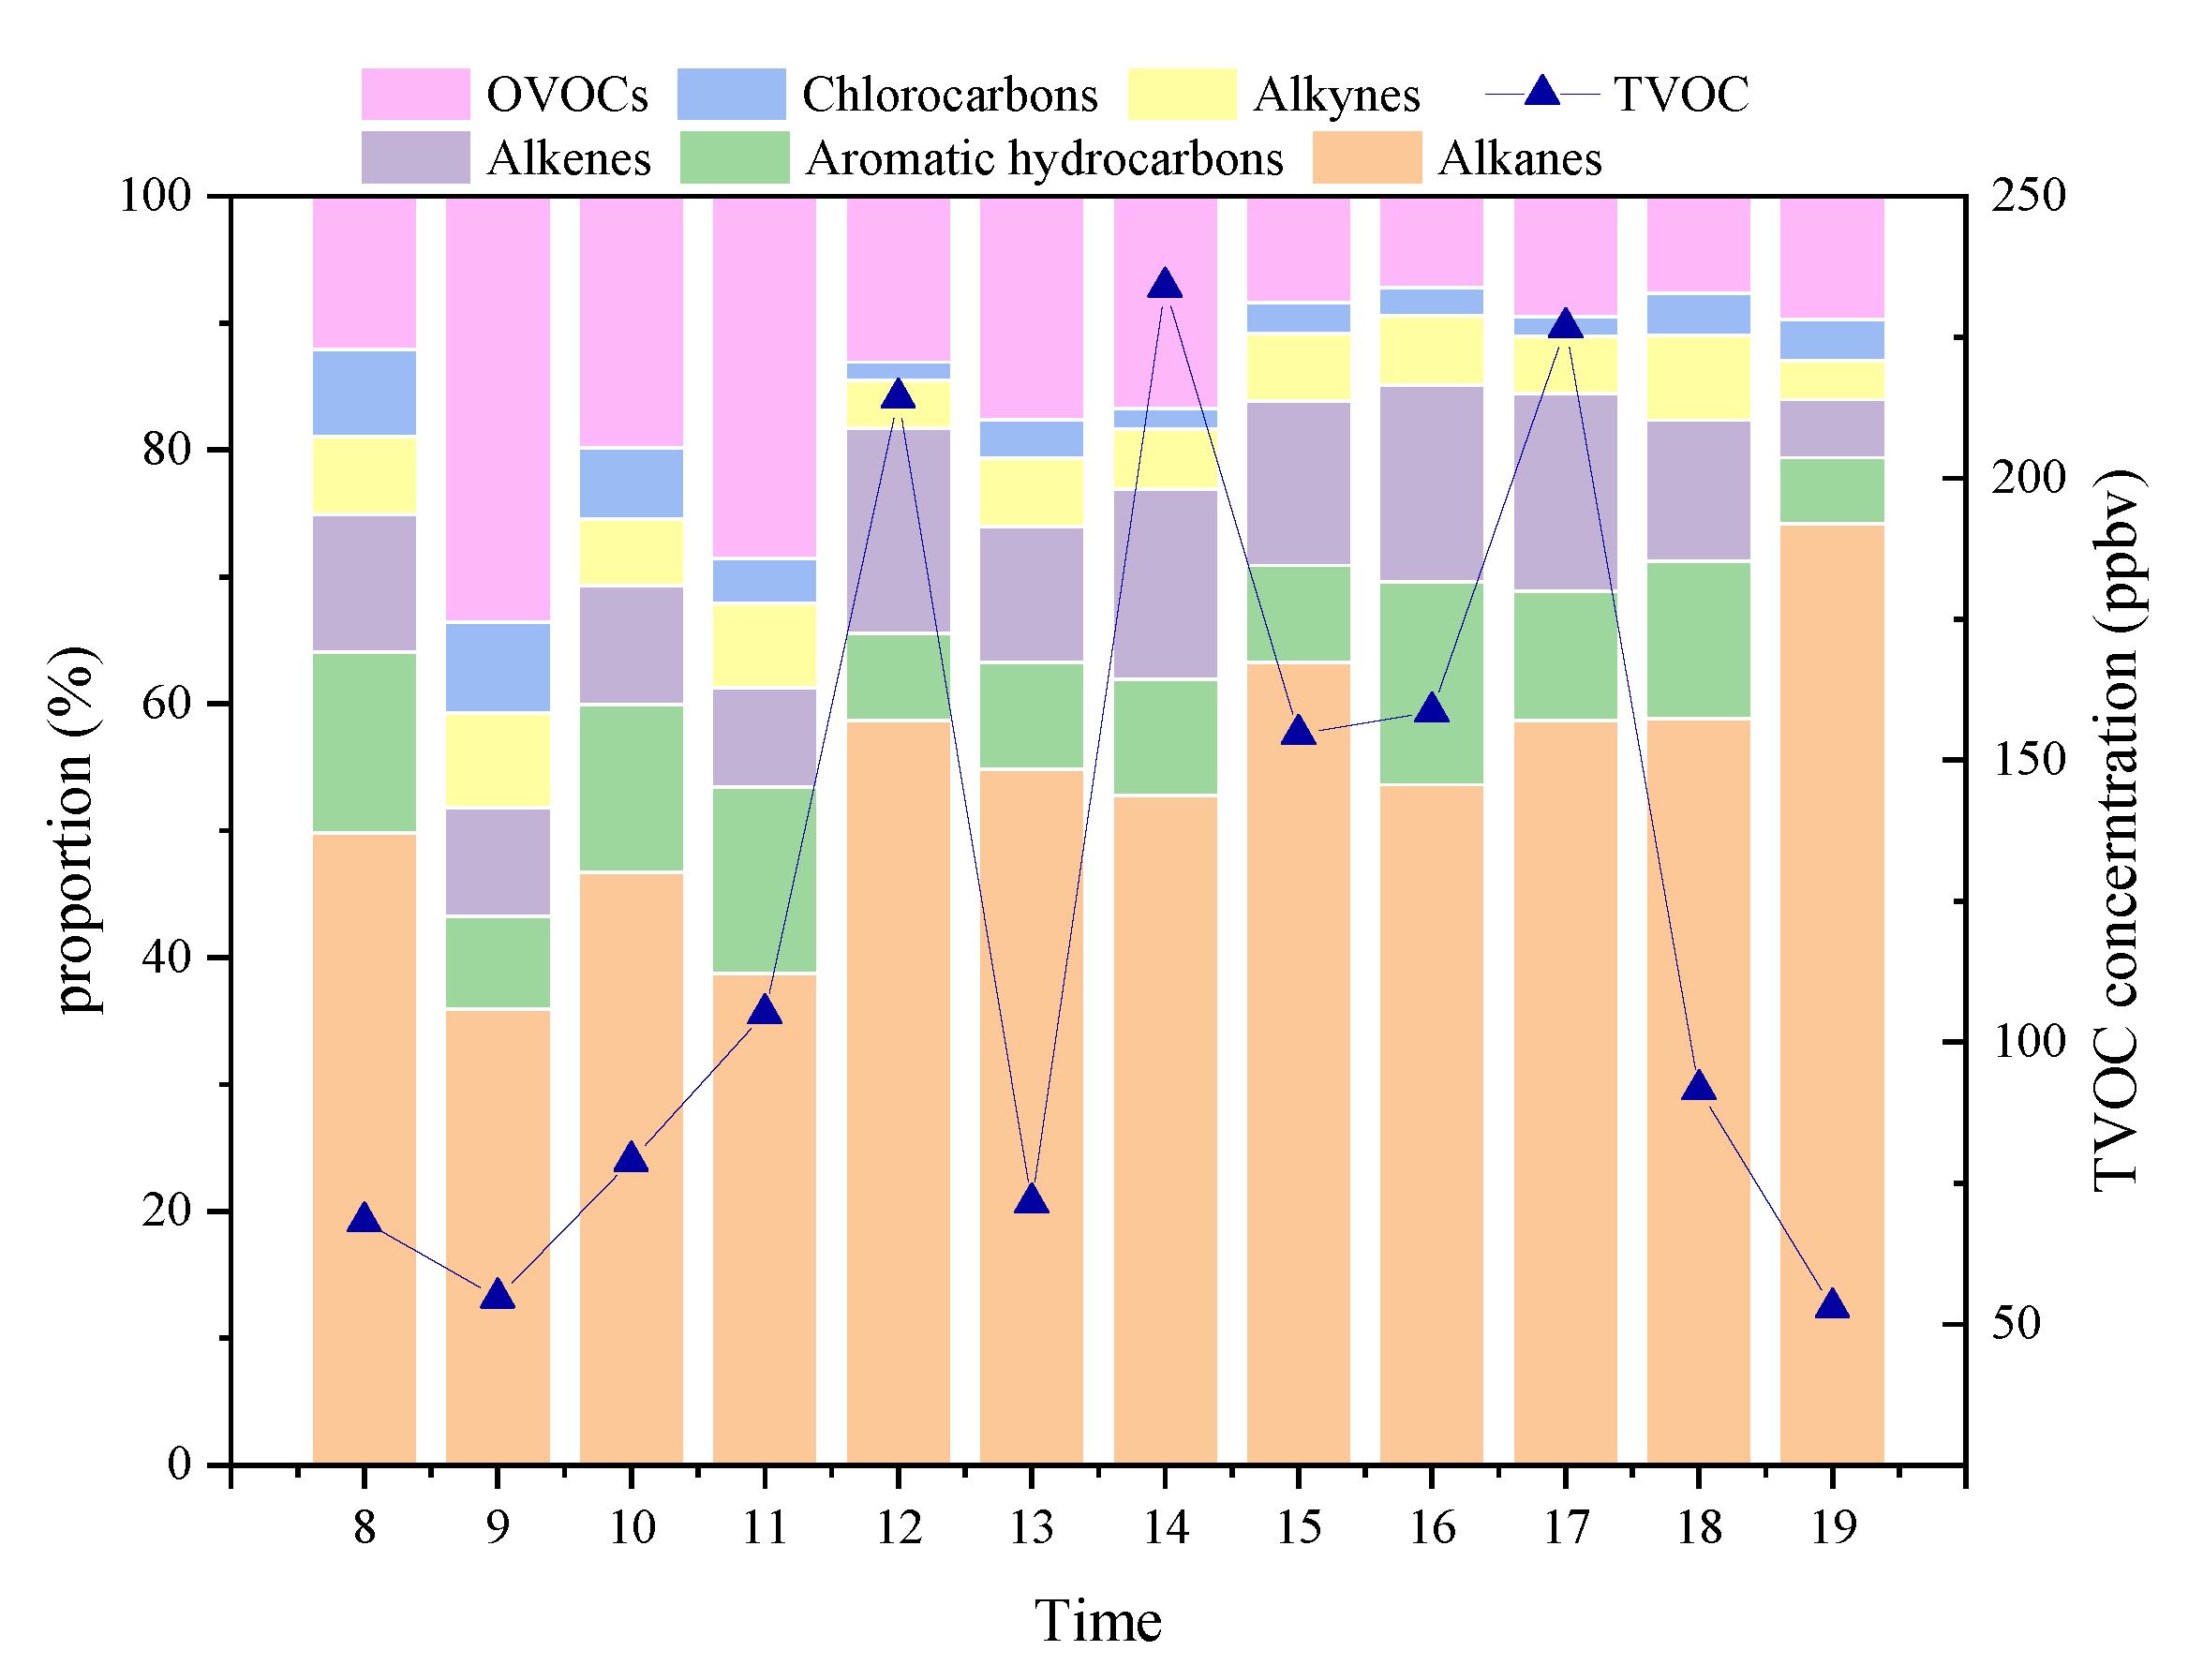
3.1.2. Concentration of VOCs
3.2. Emission Profile and Factors of VOCs at the Tianfu Tunnel
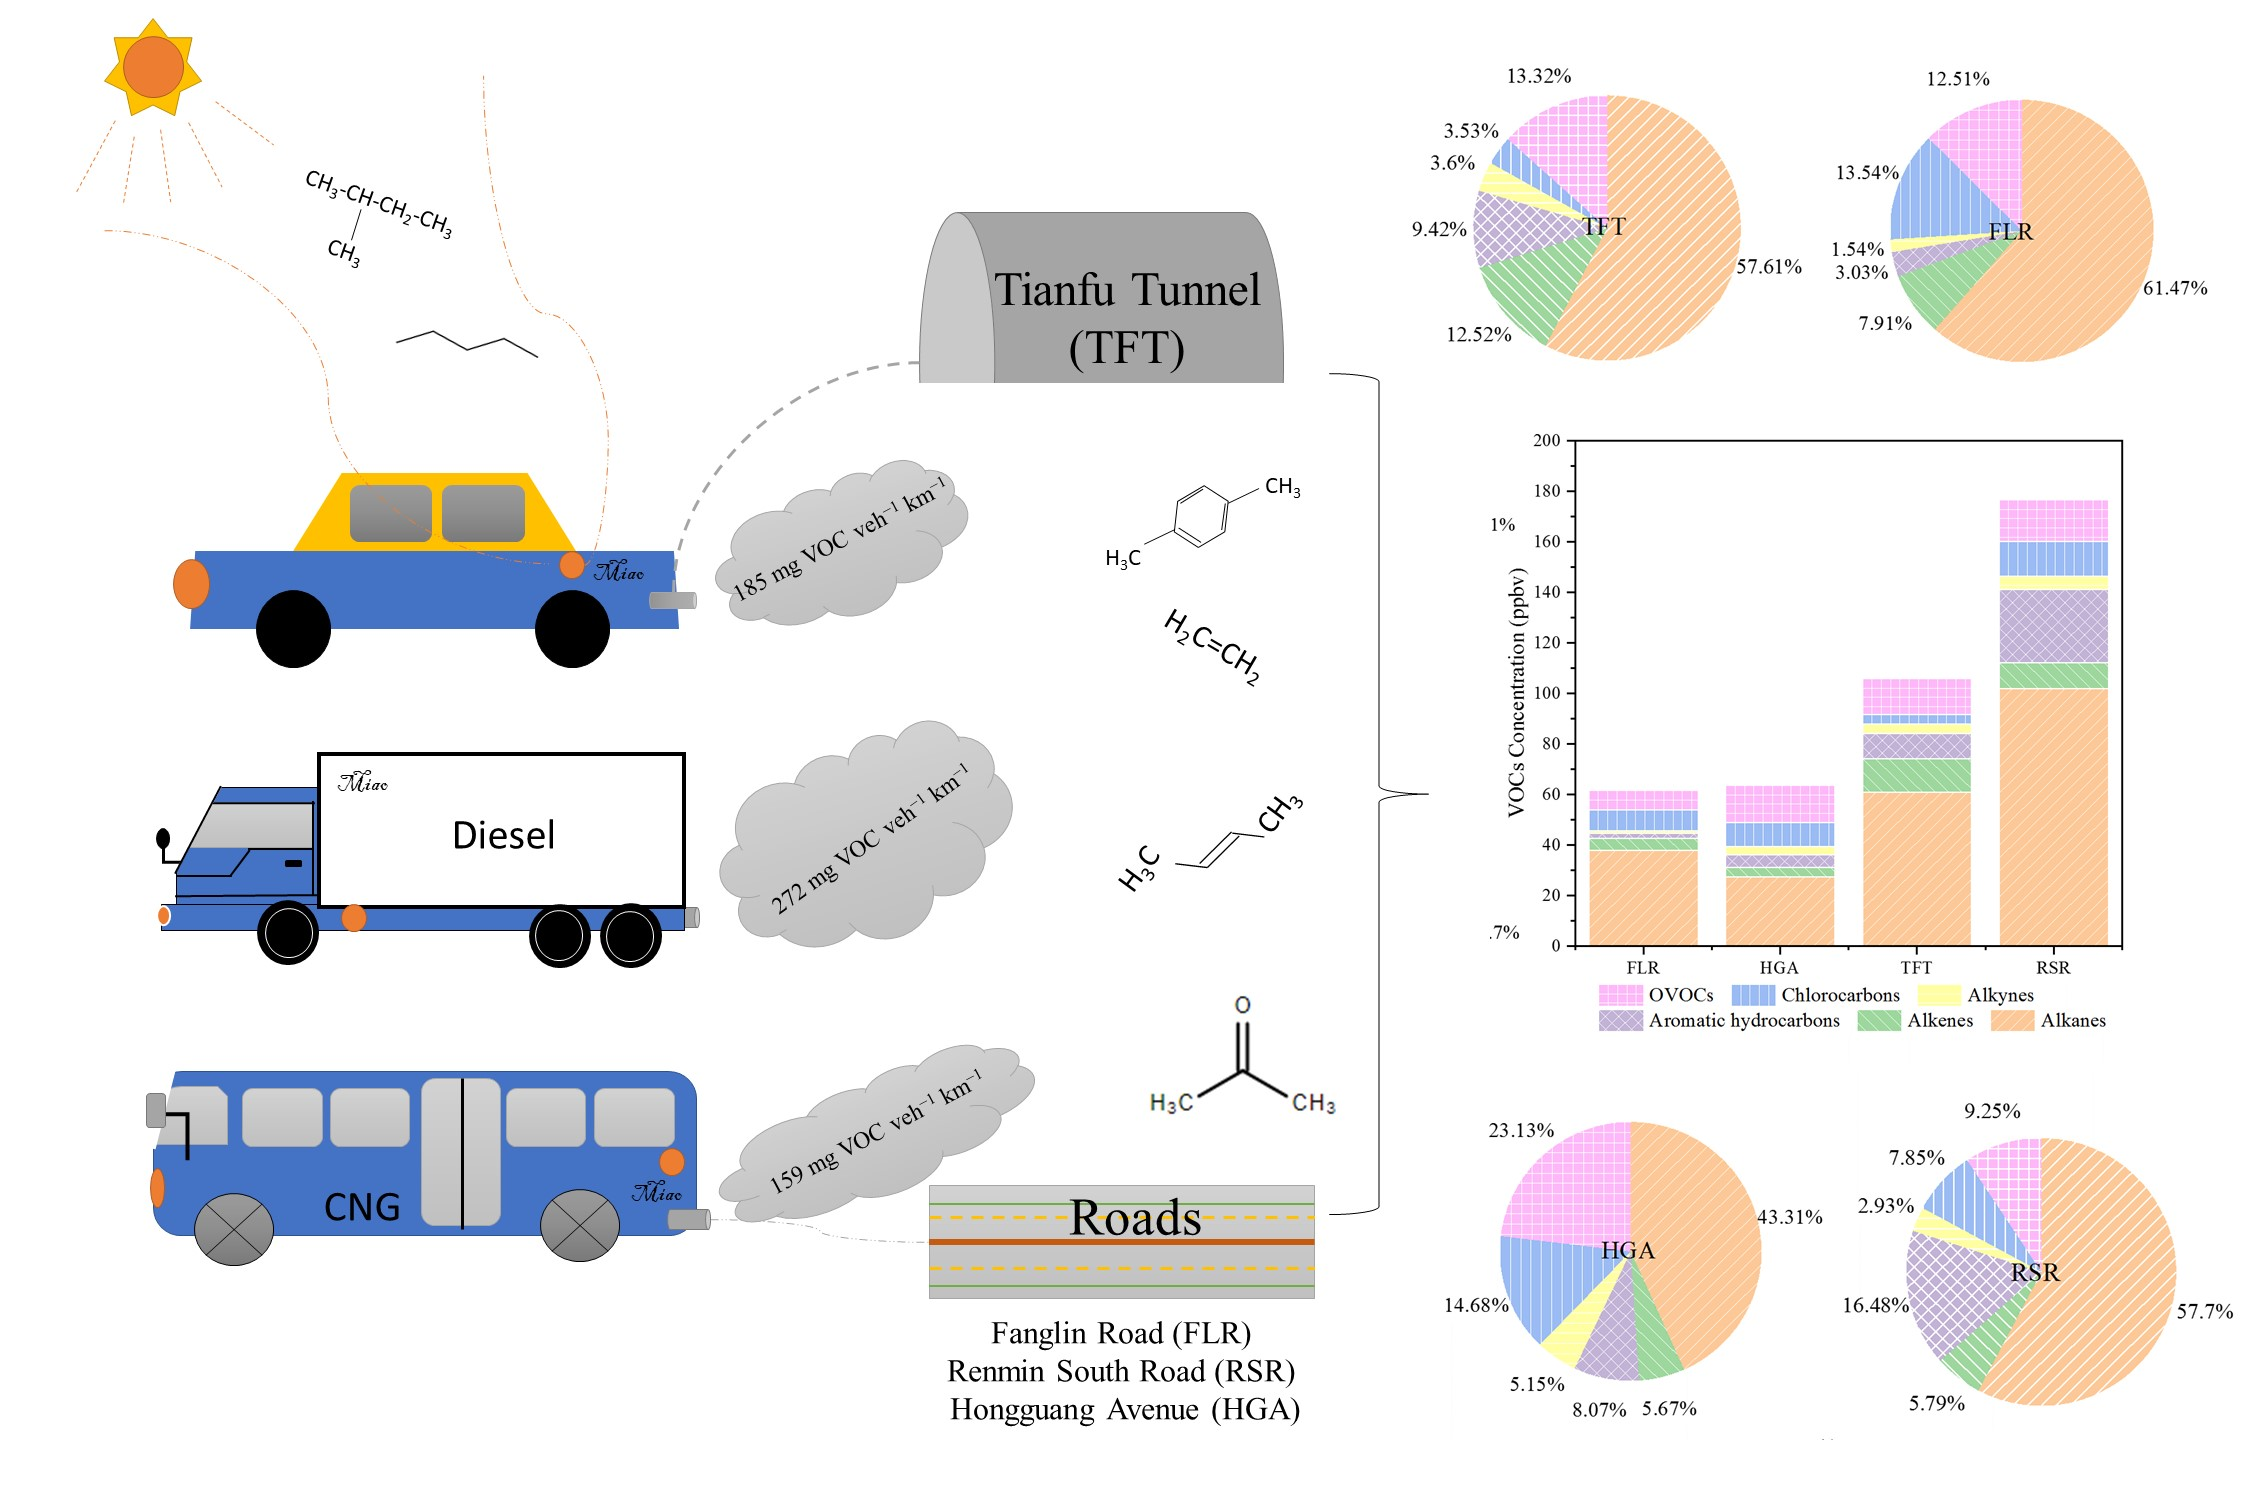
3.2.1. General Emission Factors and Emission Factors by Fuel Type
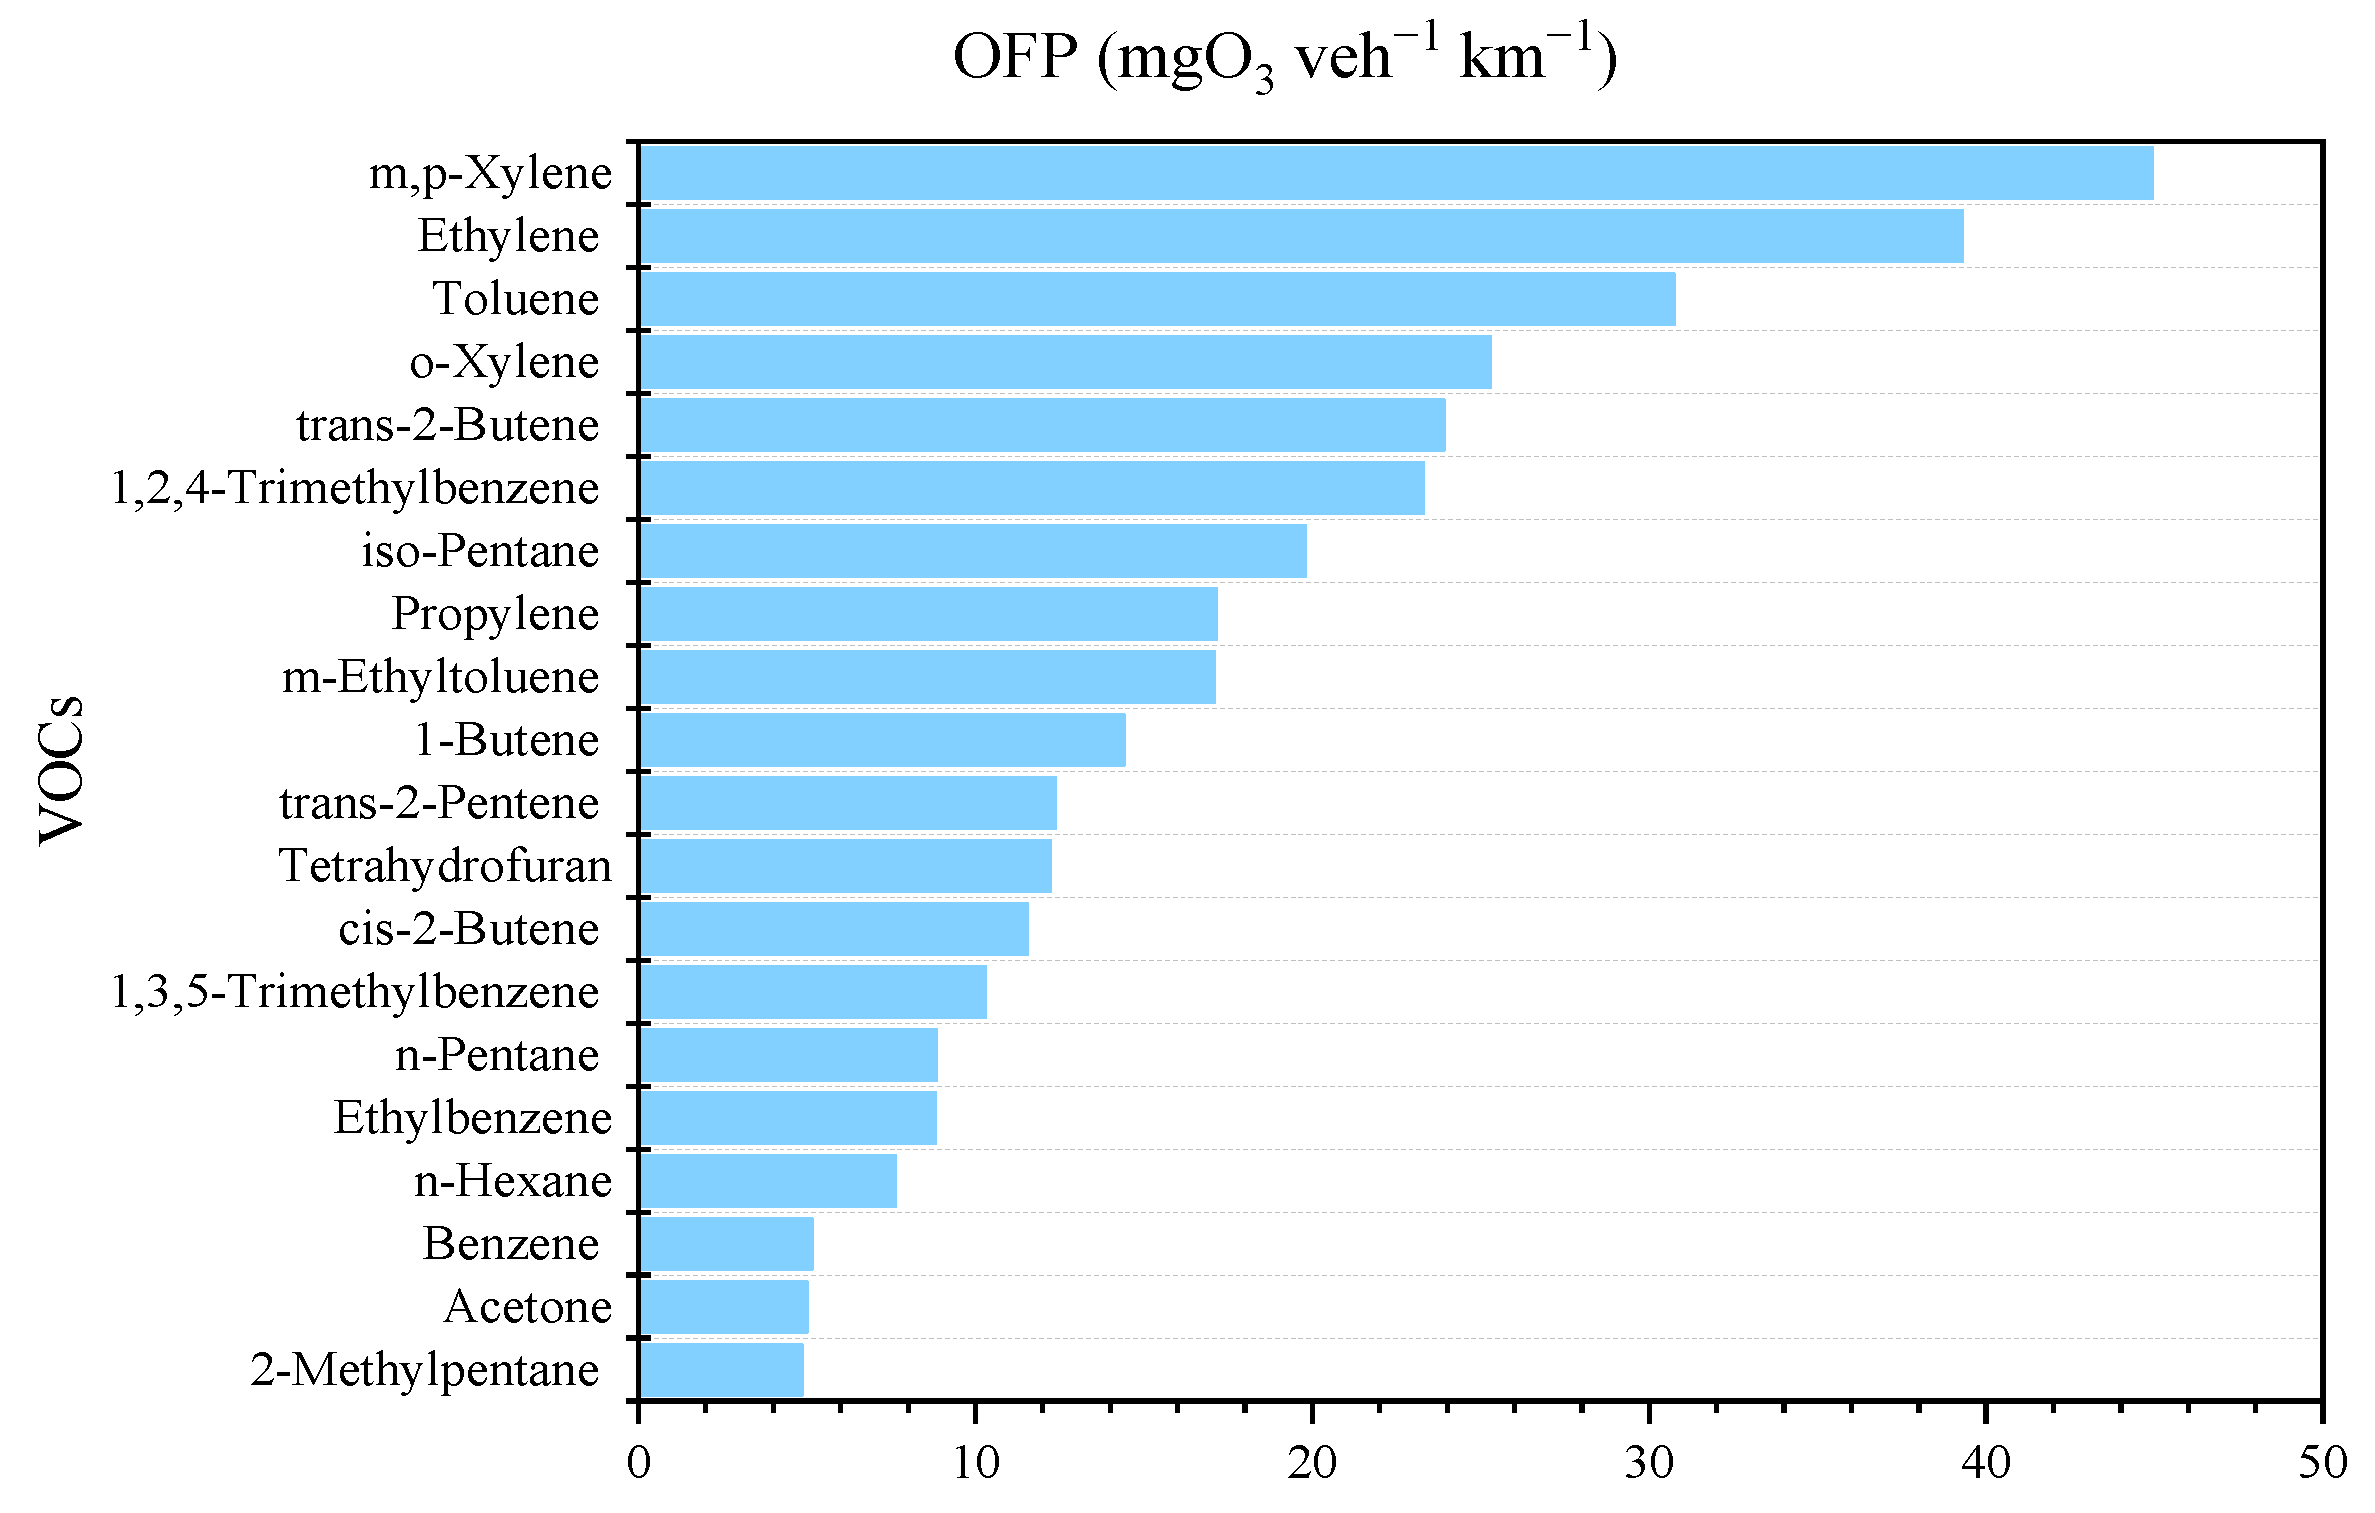
3.2.2. Photochemical Activity
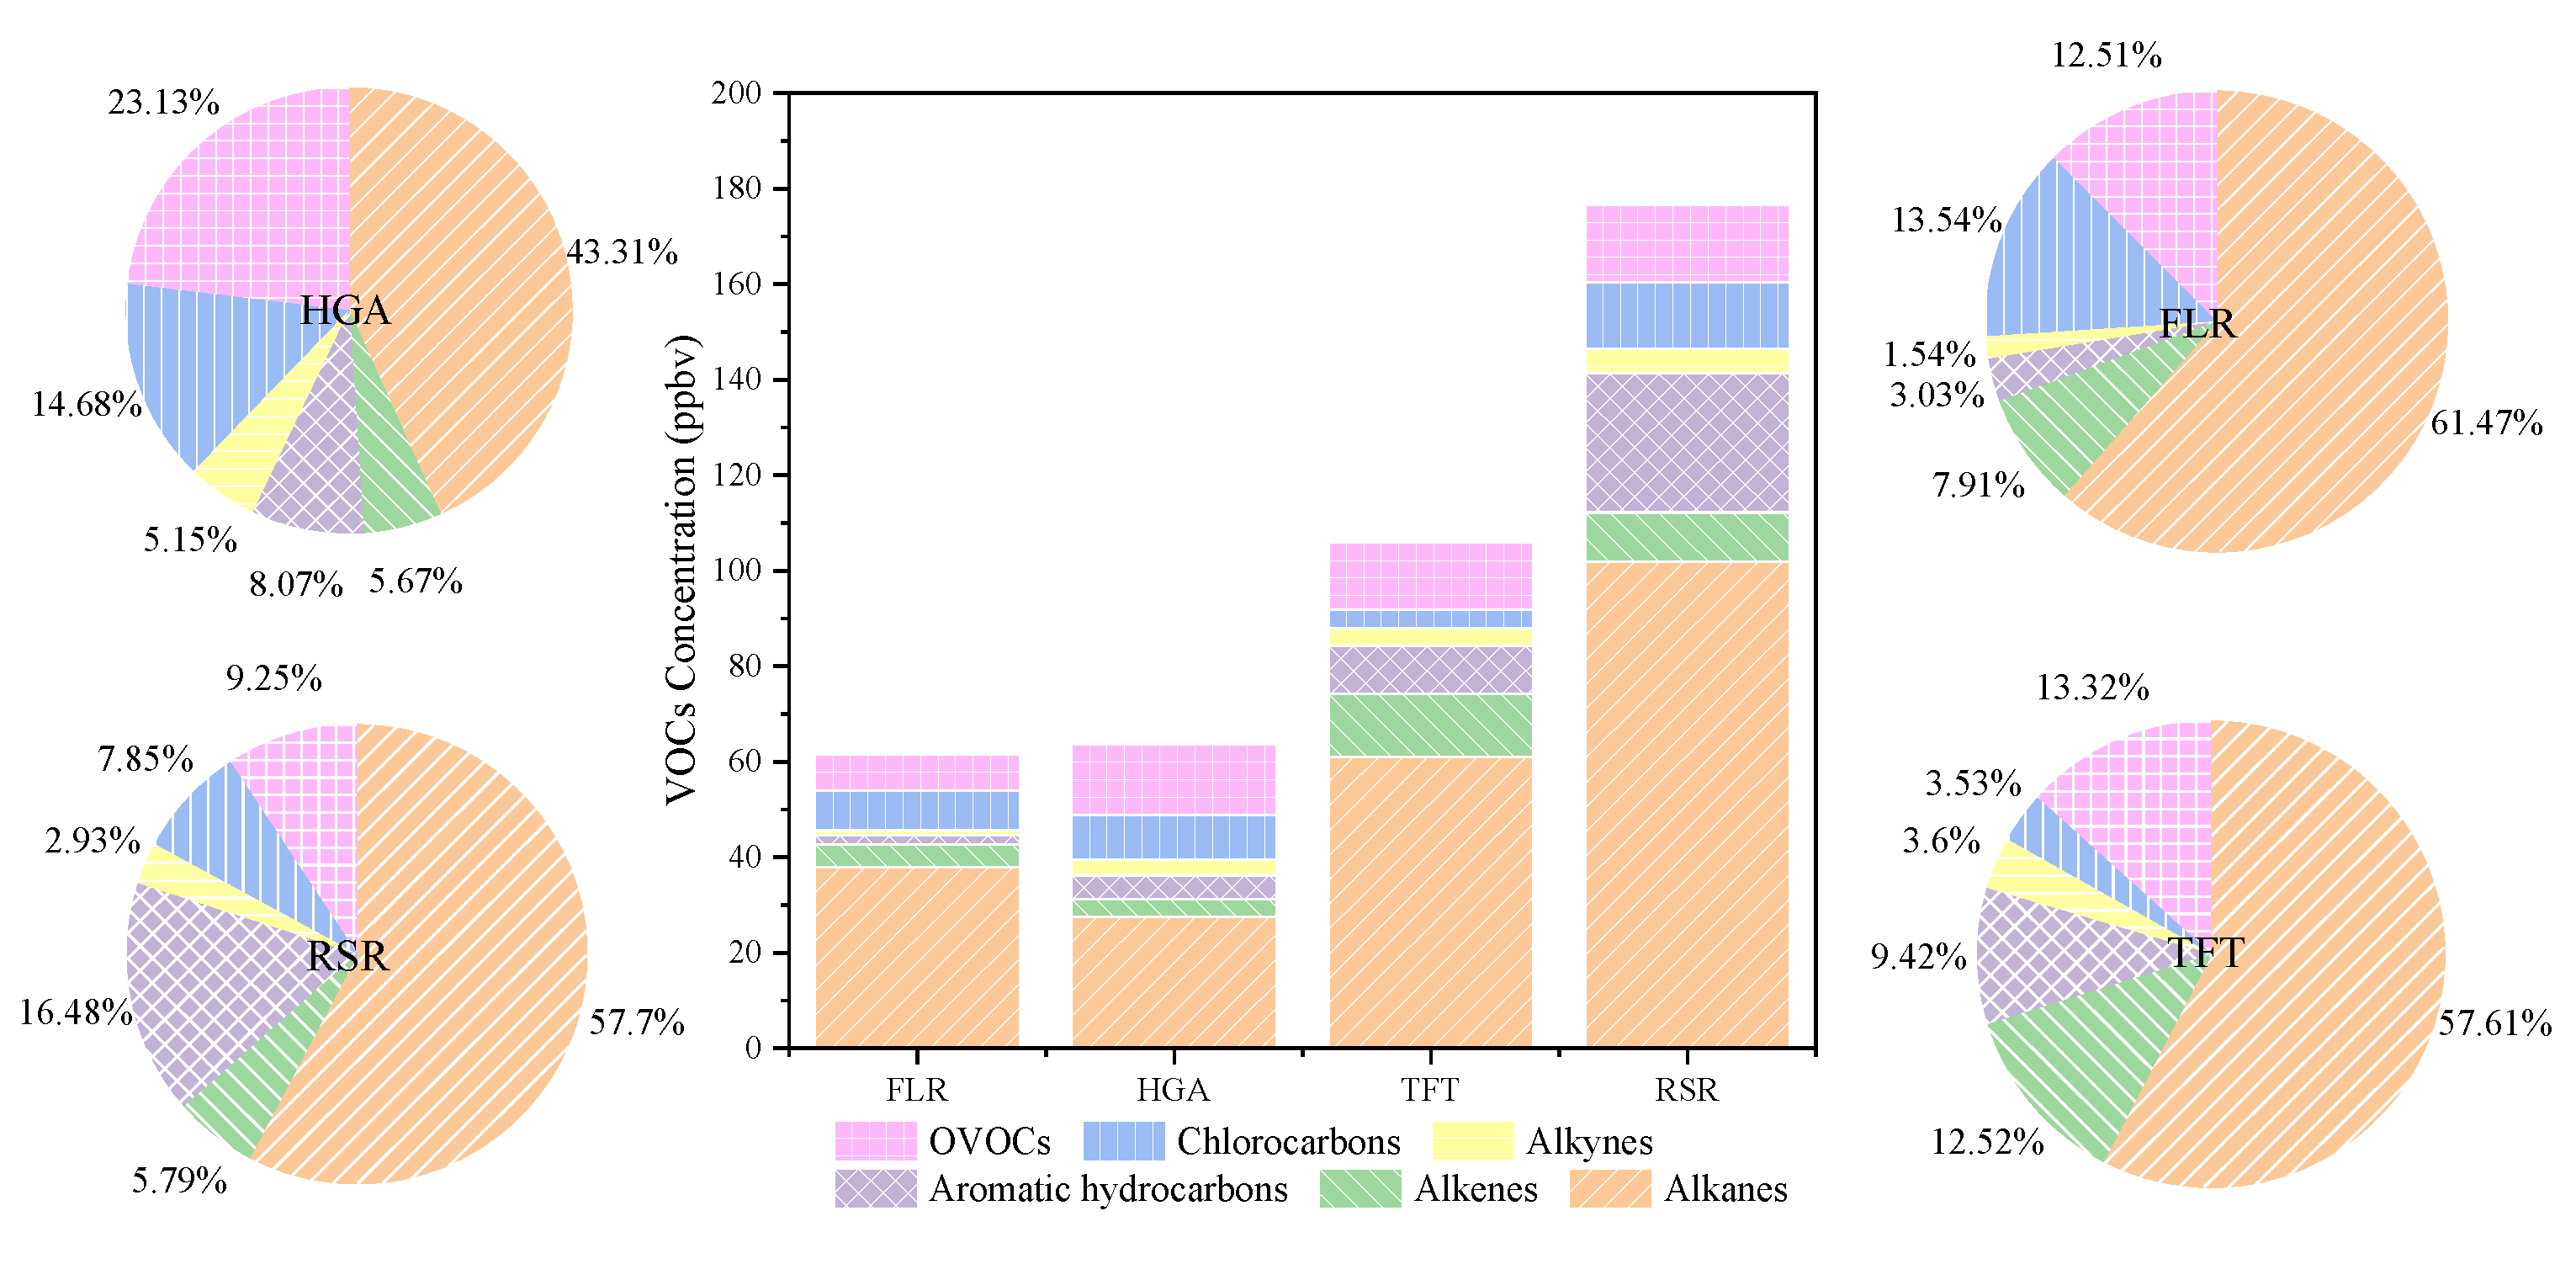
3.3. Characteristics of Road Environment VOCs
4. Conclusions
Supplementary Materials
Author Contributions
Funding
Institutional Review Board Statement
Informed Consent Statement
Data Availability Statement
Acknowledgments
Conflicts of Interest
References
- Rohde, R.A.; Muller, R.A. Air Pollution in China: Mapping of Concentrations and Sources. PLoS ONE 2015, 10, e0135749. [Google Scholar] [CrossRef]
- He, K.; Hong Huo, A.; Zhang, Q. Urban Air Pollution in China: Current Status, Characteristics, and Progress. Annu. Rev. Energy Environ. 2011, 27, 397–431. [Google Scholar] [CrossRef]
- Chan, C.K.; Yao, X. Air Pollution in Megacities in China. Atmos. Environ. 2008, 42, 1–42. [Google Scholar] [CrossRef]
- Feng, Y.; Ning, M.; Lei, Y.; Sun, Y.; Liu, W.; Wang, J. Defending blue sky in China: Effectiveness of the “Air Pollution Prevention and Control Action Plan” on air quality improvements from 2013 to 2017. J. Environ. Manag. 2019, 252, 109603. [Google Scholar] [CrossRef]
- Wang, Y.; Guo, H.; Lyu, X.; Zhang, L.; Zeren, Y.; Zou, S.; Ling, Z. Photochemical evolution of continental air masses and their influence on ozone formation over the South China Sea. Sci. Total Environ. 2019, 673, 424–434. [Google Scholar] [CrossRef] [PubMed]
- Zhang, X.; Xue, Z.; Li, H.; Yan, L.; Yang, Y.; Wang, Y.; Duan, J.; Li, L.; Chai, F.; Cheng, M.; et al. Ambient volatile organic compounds pollution in China. J. Environ. Sci. 2017, 55, 69–75. [Google Scholar] [CrossRef]
- Wu, R.; Li, J.; Hao, Y.; Li, Y.; Zeng, L.; Xie, S. Evolution process and sources of ambient volatile organic compounds during a severe haze event in Beijing, China. Sci. Total Environ. 2016, 560–561, 62–72. [Google Scholar] [CrossRef] [PubMed]
- Watson, J.G.; Chow, J.C.; Fujita, E.M. Review of volatile organic compound source apportionment by chemical mass balance. Atmos. Environ. 2001, 35, 1567–1584. [Google Scholar] [CrossRef]
- Atkinson, R.; Arey, J. Atmospheric Degradation of Volatile Organic Compounds. Chem. Rev. 2003, 103, 4605. [Google Scholar] [CrossRef] [PubMed]
- Mo, Z.; Shao, M.; Lu, S.; Niu, H.; Zhou, M.; Sun, J. Characterization of non-methane hydrocarbons and their sources in an industrialized coastal city, Yangtze River Delta, China. Sci. Total Environ. 2017, 593–594, 641. [Google Scholar] [CrossRef]
- Duan, J.; Tan, J.; Yang, L.; Wu, S.; Hao, J. Concentration, sources and ozone formation potential of volatile organic compounds (VOCs) during ozone episode in Beijing. Atmos. Res. 2008, 88, 25–35. [Google Scholar] [CrossRef]
- Song, M.; Tan, Q.; Feng, M.; Qu, Y.; Liu, X.; An, J.; Zhang, Y. Source Apportionment and Secondary Transformation of Atmospheric Nonmethane Hydrocarbons in Chengdu, Southwest China. J. Geophys. Res. Atmos. 2018, 123, 9741–9763. [Google Scholar] [CrossRef]
- Charron, A.; Polo-Rehn, L.; Besombes, J.-L.; Golly, B.; Jaffrezo, J.-L. Identification and quantification of particulate tracers of exhaust and non-exhaust vehicle emissions. Atmos. Chem. Phys. 2019, 19, 5187–5207. [Google Scholar] [CrossRef] [Green Version]
- Hao, Y.; Gao, C.; Deng, S.; Yuan, M.; Song, W.; Lu, Z.; Qiu, Z. Chemical characterisation of PM2.5 emitted from motor vehicles powered by diesel, gasoline, natural gas and methanol fuel. Sci. Total Environ. 2019, 674, 128–139. [Google Scholar] [CrossRef] [PubMed]
- Zardini, A.A.; Platt, S.M.; Clairotte, M.; El Haddad, I.; Temime-Roussel, B.; Marchand, N.; JežEk, I.; Drinovec, L.; Močnik, G.A.; Slowik, J.G. Effects of alkylate fuel on exhaust emissions and secondary aerosol formation of a 2-stroke and a 4-stroke scooter. Atmos. Environ. 2014, 94, 307–315. [Google Scholar] [CrossRef]
- Li, K.; Chen, L.; Han, K.; Lv, B.; Bao, K.; Wu, X.; Gao, X.; Cen, K. Smog chamber study on aging of combustion soot in isoprene/SO2/NOx system: Changes of mass, size, effective density, morphology and mixing state. Atmos. Res. 2017, 184, 139–148. [Google Scholar] [CrossRef]
- Colberg, C.; Tona, B.; Stahel, W.; Meier, M.; Staehelin, J. Comparison of a road traffic emission model (HBEFA) with emissions derived from measurements in the Gubrist road tunnel, Switzerland. Atmos. Environ. 2005, 39, 4703–4714. [Google Scholar] [CrossRef]
- Hung-Lung, C.; Ching-Shyung, H.; Chen, S.Y.; Wu, M.C.; Ma, S.Y.; Huang, Y.S. Emission factors and characteristics of criteria pollutants and volatile organic compounds (VOCs) in a freeway tunnel study. Sci. Total Environ. 2007, 381, 200–211. [Google Scholar] [CrossRef] [PubMed]
- Ho, K.F.; Ho, S.S.H.; Cheng, Y.; Lee, S.C.; Yu, J.Z. Real-world emission factors of fifteen carbonyl compounds measured in a Hong Kong tunnel. Atmos. Environ. 2007, 41, 1747–1758. [Google Scholar] [CrossRef]
- Pierson, W.R.; Gertler, A.W.; Robinson, N.F.; Sagebiel, J.C.; Zielinska, B.; Bishop, G.A.; Stedman, D.H.; Zweidinger, R.B.; Ray, W.D. Real-world automotive emissions—Summary of studies in the Fort McHenry and Tuscarora mountain tunnels. Atmos. Environ. 1996, 30, 2233–2256. [Google Scholar] [CrossRef]
- Ban-Weiss, G.A.; McLaughlin, J.P.; Harley, R.A.; Kean, A.J.; Grosjean, E.; Grosjean, D. Carbonyl and nitrogen dioxide emissions from gasoline- and diesel-powered motor vehicles. Environ. Sci. Technol. 2008, 42, 3944. [Google Scholar] [CrossRef]
- Johnson, K.C.; Durbin, T.D.; Cocker, D.R., III; Miller, W.J.; Bishnu, D.K.; Maldonado, H.; Moynahan, N.; Ensfield, C.; Laroo, C.A. On-road comparison of a portable emission measurement system with a mobile reference laboratory for a heavy-duty diesel vehicle. Atmos. Environ. 2009, 43, 2877–2883. [Google Scholar] [CrossRef]
- Liu, T.; Wang, X.; Wang, B.; Ding, X.; Deng, W.; Lü, S.; Zhang, Y. Emission factor of ammonia (NH3) from on-road vehicles in China: Tunnel tests in urban Guangzhou. Environ. Res. Lett. 2014, 9, 064027. [Google Scholar] [CrossRef]
- Xiao, F.; Wang, S.; Zhao, B.; Jia, X.; Hao, J. Emission inventory of primary pollutants and chemical speciation in 2010 for the Yangtze River Delta region, China. Atmos. Environ. 2013, 70, 39–50. [Google Scholar]
- Lang, J.; Cheng, S.; Wei, W.; Zhou, Y.; Wei, X.; Chen, D. A study on the trends of vehicular emissions in the Beijing–Tianjin–Hebei (BTH) region, China. Atmos. Environ. 2012, 62, 605–614. [Google Scholar] [CrossRef]
- Souhu. Chengdu Ranks the Second in Terms of Vehicle Ownership in China (In Chinese). Available online: https://www.sohu.com/a/218260672_400718 (accessed on 29 May 2020).
- Tan, Z.; Lu, K.; Jiang, M.; Su, R.; Dong, H.; Zeng, L.; Xie, S.; Tan, Q.; Zhang, Y. Exploring ozone pollution in Chengdu, southwestern China: A case study from radical chemistry to O3-VOC-NOx sensitivity. Sci. Total Environ. 2018, 636, 775–786. [Google Scholar] [CrossRef]
- U.S. Environmental Protection Agency. USEPA Method TO-15 Volatile Organic Compounds. In Compendium of Methods for the Determination of Toxic Organic Compounds in Ambient Air; U.S. Environmental Protection Agency: Washington, DC, USA, 1999; Volume EPA/625/R-96/010b. [Google Scholar]
- Ministry of Environmental Protection. Ambient air-Determination of volatile organic compounds-Collected by specially prepared canisters and analyzed by gas chromatography/mass spectrometry. In National Environmental Protection Standard of The People’s Republic Of China; Ministry of Environmental Protection: Beijing, China, 2015; Volume HJ 759-2015. [Google Scholar]
- Ministry of Environmental Protection. Air Quality-Determination of Aniline-N-(1-Naphthyl) Ethylene Diamine Dihydrochloride Spectrophotometric Method; Ministry of Environmental Protection: Beijing, China, 1995; Volume GB/T 15502-1995.
- Zhang, Q.; Wu, L.; Fang, X.; Liu, M.; Mao, H. Emission factors of volatile organic compounds (VOCs) based on the detailed vehicle classification in a tunnel study. Sci. Total Environ. 2017, 624, 878. [Google Scholar] [CrossRef]
- Chengdu Public Security Bureau. Notice on the Management of Urban Road License for Freight Cars in 2017. Available online: http://gk.chengdu.gov.cn/govInfoPub/detail.action?id=84998&tn=6 (accessed on 29 May 2020).
- Carter, W.P.L. Development of Ozone Reactivity Scales for Volatile Organic Compounds. J. Air Waste Manag. Assoc. 1994, 44, 881–899. [Google Scholar] [CrossRef] [Green Version]
- Carter, W.P.L.; Seinfeld, J.H. Winter ozone formation and VOC incremental reactivities in the Upper Green River Basin of Wyoming. Atmos. Environ. 2012, 50, 255–266. [Google Scholar] [CrossRef]
- Liu, Y.; Shao, M.; Fu, L.; Lu, S.; Zeng, L.; Tang, D. Source profiles of volatile organic compounds (VOCs) measured in China: Part I. Atmos. Environ. 2008, 42, 6247–6260. [Google Scholar] [CrossRef]
- Mo, Z.; Shao, M.; Lu, S. Compilation of a source profile database for hydrocarbon and OVOC emissions in China. Atmos. Environ. 2016, 143, 209–217. [Google Scholar] [CrossRef]
- Kirchstetter, T.W.; Singer, B.C.; Harley, R.A.; Kendall, G.R.; Chan, W. Impact of oxygenated gasoline use on motor vehicle emissions. Environ. Sci. Technol. 1996, 30, 661–670. [Google Scholar] [CrossRef]
- Ho, K.F.; Ho, S.S.H.; Lee, S.C.; Cheng, Y.; Chow, J.C.; Watson, J.G.; Louie, P.K.K.; Tian, L. Emissions of gas- and particle-phase polycyclic aromatic hydrocarbons (PAHs) in the Shing Mun Tunnel, Hong Kong. Atmos. Environ. 2009, 43, 6343–6351. [Google Scholar] [CrossRef]
- Cui, L.; Wang, X.L.; Ho, K.F.; Gao, Y.; Liu, C.; Ho, S.S.H.; Li, H.W.; Lee, S.C.; Wang, X.M.; Jiang, B.Q.; et al. Decrease of VOC emissions from vehicular emissions in Hong Kong from 2003 to 2015: Results from a tunnel study. Atmos. Environ. 2018, 177, 64–74. [Google Scholar] [CrossRef]
- Zhang, Y.; Yang, W.; Simpson, I.; Huang, X.; Yu, J.; Huang, Z.; Wang, Z.; Zhang, Z.; Liu, D.; Huang, Z.; et al. Decadal changes in emissions of volatile organic compounds (VOCs) from on-road vehicles with intensified automobile pollution control: Case study in a busy urban tunnel in south China. Environ. Pollut. 2018, 233, 806–819. [Google Scholar] [CrossRef] [PubMed] [Green Version]
- Dai, P.; Ge, Y.; Lin, Y.; Su, S.; Liang, B. Investigation on characteristics of exhaust and evaporative emissions from passenger cars fueled with gasoline/methanol blends. Fuel 2013, 113, 10–16. [Google Scholar] [CrossRef]
- Nelson, P.F.; Quigley, S.M. The m,p-xylenes:ethylbenzene ratio. A technique for estimating hydrocarbon age in ambient atmospheres. Atmos. Environ. 1983, 17, 659–662. [Google Scholar] [CrossRef]
- Shiu, C.J.; Liu, S.C.; Chang, C.C.; Chen, J.P.; Chou, C.C.K.; Lin, C.Y.; Young, C.Y. Photochemical production of ozone and control strategy for Southern Taiwan. Atmos. Environ. 2007, 41, 9324–9340. [Google Scholar] [CrossRef]
- Wang, P.; Zhao, W. Assessment of ambient volatile organic compounds (VOCs) near major roads in urban Nanjing, China. Atmos. Res. 2008, 89, 289–297. [Google Scholar] [CrossRef]


| Date | Time | Sampling Sites | Frequency | NO. of VOC Samples | NO. of NO2 Samples |
|---|---|---|---|---|---|
| 18 July | 8:00–20:00 | FLR | 2 h/sample | 12 | 6 |
| 21 July | 8:00–20:00 | RSR | 1 h/sample | 24 | 23 |
| 3 August | 8:00–20:00 | HGA | 2 h/sample | 12 | 23 |
| 15 August | 8:00–20:00 | TFT | 1 h/sample | 24 | 20 |
| VOCs | Concentration (ppbv) | Emission Factor (mg veh−1 km−1) | ||
|---|---|---|---|---|
| A | B | B–A | ||
| Alkanes | ||||
| Ethane | 18.75 ± 8.46 | 29.80 ± 15.58 | 14.04 ± 9.86 | 22.85 ± 12.79 |
| Propane | 3.79 ± 3.58 | 3.51 ± 1.66 | 0.75 ± 1.03 | 1.67 ± 2.33 |
| iso-Butane | 6.18 ± 17.07 | 1.70 ± 1.60 | 0.44 ± 0.52 | 1.41 ± 2.02 |
| n-Butane | 6.83 ± 12.19 | 4.54 ± 3.49 | 1.18 ± 1.44 | 3.14 ± 2.75 |
| Cyclopentane | 0.08 ± 0.27 | 0.24 ± 0.43 | 0.16 ± 0.37 | 0.28 ± 0.58 |
| n-Pentane | 2.49 ± 2.44 | 5.07 ± 4.34 | 2.17 ± 2.93 | 10.11 ± 7.26 |
| iso-Pentane | 6.90 ± 6.40 | 13.42 ± 7.20 | 4.71 ± 5.65 | 18.25 ± 8.35 |
| Cyclohexane | 0.30 ± 0.47 | 0.22 ± 0.53 | 0.10 ± 0.31 | 0.45 ± 1.10 |
| Methylcyclopentane | 0.41 ± 0.66 | 1.04 ± 1.22 | 0.70 ± 0.83 | 2.41 ± 2.52 |
| n-Hexane | 1.73 ± 0.88 | 2.94 ± 1.59 | 0.96 ± 0.93 | 8.17 ± 4.71 |
| 2-Methylpentane | 1.36 ± 1.42 | 2.18 ± 2.08 | 0.92 ± 1.15 | 3.52 ± 3.47 |
| 3-Methylpentane | 0.68 ± 0.84 | 1.19 ± 1.40 | 0.67 ± 0.83 | 2.31 ± 2.49 |
| Methylcyclohexane | 0.17 ± 0.40 | 0.50 ± 0.64 | 0.41 ± 0.58 | 1.30 ± 1.56 |
| n-Heptane | 0.14 ± 0.32 | 0.52 ± 0.69 | 0.45 ± 0.66 | 1.45 ± 1.74 |
| 2-Methylhexane | 0.21 ± 0.39 | 0.52 ± 0.69 | 0.37 ± 0.58 | 1.14 ± 1.43 |
| 3-Methylhexane | 0.16 ± 0.38 | 0.59 ± 0.78 | 0.50 ± 0.75 | 1.55 ± 1.91 |
| 2-Methylheptane | 0.04 ± 0.14 | 0.06 ± 0.21 | 0.02 ± 0.27 | 0.13 ± 0.43 |
| 3-Methylheptane | 0.10 ± 0.35 | 0.19 ± 0.44 | 0.09 ± 0.59 | 0.51 ± 1.11 |
| Undecane | 0.54 ± 1.28 | 0.07 ± 0.23 | 0.07 ± 0.23 | 0.20 ± 0.63 |
| Alkenes | ||||
| Ethylene | 6.82 ± 4.40 | 10.07 ± 6.42 | 3.54 ± 4.01 | 4.77 ± 3.43 |
| Propylene | 1.71 ± 0.93 | 2.43 ± 1.57 | 0.88 ± 1.07 | 1.60 ± 1.45 |
| 1,3-Butadiene | 0.14 ± 0.33 | 0.48 ± 0.61 | 0.41 ± 0.60 | 0.71 ± 0.91 |
| 1-Butene | 0.08 ± 0.28 | 0.55 ± 0.82 | 0.55 ± 0.82 | 1.62 ± 3.11 |
| trans-2-Butene | 0.50 ± 1.19 | 1.08 ± 1.41 | 0.77 ± 0.95 | 1.72 ± 1.73 |
| cis-2-Butene | 0.14 ± 0.50 | 0.58 ± 0.79 | 0.44 ± 0.58 | 0.88 ± 1.06 |
| Isoprene | 0.17 ± 0.33 | 0.23 ± 0.42 | 0.05 ± 0.61 | 0.40 ± 0.67 |
| trans-2-Pentene | 0.16 ± 0.57 | 0.71 ± 0.94 | 0.55 ± 0.77 | 1.28 ± 1.53 |
| cis-2-Pentene | 0.06 ± 0.22 | 0.22 ± 0.40 | 0.15 ± 0.32 | 0.33 ± 0.57 |
| Aromatic hydrocarbons | ||||
| Benzene | 2.60 ± 2.08 | 4.56 ± 3.48 | 1.98 ± 2.24 | 7.53 ± 3.43 |
| Toluene | 2.97 ± 3.01 | 3.95 ± 2.55 | 1.23 ± 2.18 | 8.37 ± 7.28 |
| Styrene | 0.07 ± 0.25 | 0.07 ± 0.23 | 0.07 ± 0.23 | 0.58 ± 1.84 |
| Ethylbenzene | 0.62 ± 0.54 | 1.28 ± 1.13 | 0.71 ± 0.85 | 3.16 ± 2.58 |
| m,p-Xylene | 1.41 ± 0.97 | 2.24 ± 1.37 | 0.69 ± 1.33 | 5.03 ± 6.74 |
| o-Xylene | 0.76 ± 0.58 | 1.49 ± 1.39 | 0.87 ± 1.11 | 3.61 ± 3.29 |
| 1,3,5-Trimethylbenzene | 0.01 ± 0.10 | 0.27 ± 0.51 | 0.27 ± 0.51 | 0.95 ± 1.60 |
| 1,2,4-Trimethylbenzene | 0.18 ± 0.47 | 0.46 ± 0.69 | 0.31 ± 0.60 | 2.86 ± 5.09 |
| m-Ethyltoluene | 0.18 ± 0.44 | 0.67 ± 0.99 | 0.61 ± 0.86 | 2.63 ± 3.24 |
| o-Ethyltoluene | 0.01 ± 0.13 | 0.15 ± 0.34 | 0.15 ± 0.34 | 0.42 ± 0.91 |
| Alkynes | ||||
| Acetylene | 3.95 ± 2.54 | 6.40 ± 2.82 | 2.55 ± 2.55 | 4.40 ± 4.67 |
| Chlorocarbons | ||||
| Chloromethane | 1.24 ± 0.87 | 0.94 ± 0.41 | 0.10 ± 0.28 | 0.59 ± 1.52 |
| Dichloromethane | 1.81 ± 1.26 | 1.72 ± 0.39 | 0.29 ± 0.61 | 2.77 ± 5.68 |
| 1,2-Dichloroethane | 0.69 ± 0.73 | 0.73 ± 0.52 | 0.17 ± 0.30 | 1.33 ± 2.54 |
| Dichlorodifluoromethane | 0.24 ± 0.35 | 0.13 ± 0.30 | 0.07 ± 0.23 | 0.15 ± 0.48 |
| trans-1,2-Dichloroethylene | 0.03 ± 0.11 | 0.06 ± 0.21 | 0.06 ± 0.21 | 0.27 ± 0.85 |
| OVOCs | ||||
| Acetone | 2.98 ± 1.75 | 6.70 ± 3.12 | 4.06 ± 2.43 | 15.31 ± 10.98 |
| 2-Hexanone | 0.01 ± 0.12 | 0.25 ± 0.46 | 0.25 ± 0.46 | 1.40 ± 3.00 |
| Tetrahydrofuran | 0.02 ± 0.11 | 0.38 ± 1.11 | 0.38 ± 1.11 | 3.10 ± 8.52 |
| Methyl tert-butyl ether | 2.37 ± 2.74 | 4.06 ± 3.90 | 1.69 ± 2.07 | 6.94 ± 4.13 |
| Ethyl acetate | 1.00 ± 1.51 | 0.91 ± 0.89 | 0.35 ± 0.53 | 3.50 ± 5.59 |
| Carbon disulfide | 1.91 ± 3.18 | 2.42 ± 3.73 | 0.59 ± 1.21 | 5.93 ± 11.76 |
| P/IB | M,P/EB | T/B | |
|---|---|---|---|
| Chengdu Roadsides: FLR (This study) | 2.14 | 1.86 | 1.84 |
| Chengdu Roadsides: HGA (This study) | 1.68 | 2.17 | 3.48 |
| Chengdu Roadsides: RSR (This study) | 2.04 | 1.41 | 5.37 |
| Chengdu Tunnel: TFT (This study) | 1.81 | 2.93 | 1.68 |
| Nanjing Tunnel [31] | 5.21 | 2.39 | 1.83 |
| Nanjing Roadsides [44] | / | 1.17 | 3.09 |
| Hong Kong Tunnel: 2015 [39] | 1.05 | 2.44 | 5.59 |
| HongKong Tunnel: 2003 [39] | 1.41 | 2.79 | 2.27 |
Publisher’s Note: MDPI stays neutral with regard to jurisdictional claims in published maps and institutional affiliations. |
© 2021 by the authors. Licensee MDPI, Basel, Switzerland. This article is an open access article distributed under the terms and conditions of the Creative Commons Attribution (CC BY) license (https://creativecommons.org/licenses/by/4.0/).
Share and Cite
Feng, M.; Hu, X.; Zhou, L.; Zhang, T.; Zhang, X.; Tan, Q.; Zhou, Z.; Deng, Y.; Song, D.; Huang, C. Real-World Vehicle Volatile Organic Compound Emissions and Their Source Profile in Chengdu Based on a Roadside and Tunnel Study. Atmosphere 2021, 12, 861. https://doi.org/10.3390/atmos12070861
Feng M, Hu X, Zhou L, Zhang T, Zhang X, Tan Q, Zhou Z, Deng Y, Song D, Huang C. Real-World Vehicle Volatile Organic Compound Emissions and Their Source Profile in Chengdu Based on a Roadside and Tunnel Study. Atmosphere. 2021; 12(7):861. https://doi.org/10.3390/atmos12070861
Chicago/Turabian StyleFeng, Miao, Xiang Hu, Li Zhou, Tianyue Zhang, Xiao Zhang, Qinwen Tan, Zihang Zhou, Ye Deng, Danlin Song, and Chengmin Huang. 2021. "Real-World Vehicle Volatile Organic Compound Emissions and Their Source Profile in Chengdu Based on a Roadside and Tunnel Study" Atmosphere 12, no. 7: 861. https://doi.org/10.3390/atmos12070861
APA StyleFeng, M., Hu, X., Zhou, L., Zhang, T., Zhang, X., Tan, Q., Zhou, Z., Deng, Y., Song, D., & Huang, C. (2021). Real-World Vehicle Volatile Organic Compound Emissions and Their Source Profile in Chengdu Based on a Roadside and Tunnel Study. Atmosphere, 12(7), 861. https://doi.org/10.3390/atmos12070861