Article

Development of a Negligible Zero-Drift NDIR Analyzer for Measuring NH3 Emitted from an Urban Household Solid Waste Incinerator

Department of Civil and Environmental Engineering, Konkuk University, 120 Neungdong-ro, Gwangjin-Gu, Seoul 05029, Korea
*
Author to whom correspondence should be addressed.
Atmosphere 2021, 12(7), 858; https://doi.org/10.3390/atmos12070858
Submission received: 25 May 2021 / Revised: 25 June 2021 / Accepted: 28 June 2021 / Published: 30 June 2021
(This article belongs to the Section Air Quality)

Abstract

:
An analyzer for measuring NH3 emitted from a combustion process has been developed based on a simple non-dispersive infrared (NDIR) technique because of its cost-effective benefit. The weakness of the NDIR analyzer due to interference and zero-drift has been overcome. A least-interfering bandpass filter (BPF) was found and manufactured to compensate for the interfering effects of gases emitted from a combustion process (e.g., CO, NOx, SO2, CO2, H2O, HCl, formaldehyde, acetaldehyde and toluene). It was found that there was no significant interference in the least-interfering BPF with respect to gases of concern. Measurement errors by the analyzer were less than 2.5% in a range of 1 to 10 ppmv of NH3 compared to a standard method when the compound was measured in complicated mixing gases. For the zero-drift, using BPFs with identical center wavelength with respect to different incident infrared intensity was found to help minimize the zero-drift of the NDIR analyzer. As a result, the analyzer could cut approximately 19% of zero-drift caused by the aging effect of both IR source and detector. It suggests that the analyzer could be applied for measuring NH3 emitted from combustion processes with good accuracy and reproducibility.

1. Introduction

Ammonia (NH3, CAS number 7664-41-7) is a colorless gas with a pungent smell [1]. NH3 has adverse effects on human health. Eye and skin irritation, burns, and frostbites are common symptoms when exposed to low concentrations of NH3 [2]. NH3 exposure also causes coughing, wheezing, and shortness of breath [2]. Inhalation of over 10,000 ppm of NH3 can cause death [2]. In the atmosphere, NH3 is one of the main precursors of ground-level ozone and secondary PM2.5 [3,4,5,6,7,8,9]. The primary emission source of NH3 is agricultural activities contributing over 80% of the total global emissions, followed by combustion processes at 20% [10]. Therefore, the continuous monitoring of NH3 emitted from combustion processes is a pivotal issue to control the emission of NH3, especially from industrial and traffic emission sources. The measurement of air pollutants is useful for emission inventories. Governments can find significant sources of air pollutants from the emission inventory for environmental policy action [11]. Furthermore, the emission inventory is also an input for mathematical models used to predict the formation of secondary air pollutants in the atmosphere [3,4,5,6,7,8,9]. Hence, the accuracy of measurement data is an important issue.
NH3 emitted from the combustion in industrial and traffic sources is predominantly from selective catalytic reduction (SCR) and selective non-catalytic reduction (SNCR) processes used to treat nitrogen oxides [12]. The excess concentration of NH3 can be up to 20 ppmv because the addition of NH3 in excess of the NO amount is required in the stoichiometric equation [12,13]. In the Republic of Korea, NH3 emissions from combustion were generally 0–8 ppmv in 2008 [14]. Therefore, an accurate analyzer is needed to measure these low levels of NH3 continuously.
Chemiluminescence, UV absorption spectroscopy, IR absorption spectroscopy, ion mobility spectroscopy, and electrochemical approaches are major technologies for measuring NH3 in a gas stream [15]. Some popular commercial NH3 analyzers are shown in Table 1.
As shown in Table 1, among NH3 measurement techniques, non-dispersive infrared (NDIR) analyzers are used less compared to other approaches, although an NDIR analyzer is simpler and cheaper compared to others [16]. Moreover, in situ or hot-type extractive NDIR analyzers are widely used over cold-type NDIR analyzers, which consume less energy and introduce less contamination due to their high operating temperatures. Accordingly, the development of an extractive cold-type NDIR is necessary.
A typical NDIR analyzer consists of a gas chamber coupled with a set of mirrors to produce a long optical pathlength, an infrared (IR) source coupled with a beam chopper, and a detector coupled with a bandpass filter (BPF). The main disadvantages of an NDIR analyzer are interference and zero-drift [17,18,19,20]. To reduce the interference effect, a least-interfering BPF has recently been developed, which can compensate for the effect of interference with lower costs and less complicated structure [16]. Zero-drift is a change in the analyzer’s signal, which leads to a shift in the whole calibration curve of the analyzer [21]. The age of the IR source and detector strongly affects the zero-drift of NDIR analyzers. The contamination of optical elements such as mirrors and windows can also cause zero-drift [21]. In the early days, to overcome the zero-drift issue, a reference chamber, which is a gas chamber comprising an inert gas such as nitrogen, was used to reduce the zero-drift caused by the IR source and detector [22]. To contain a sample gas, another gas chamber was used which is called a measurement chamber. Each chamber was coupled with a detector. An analyzer signal was defined as a fraction of detector signal from the reference chamber (so called R) to that from the measurement chamber (so called M). Because one IR source was used for both chambers and analyzer signals were calculated based on the fraction R/M, the zero-drift of the analyzer due to IR source aging was compensated [22]. However, this method cannot overcome the zero-drift issue caused by the contamination of optical elements because the reference chamber cannot be exposed to real dirty samples such as the measurement chamber. Using two detectors can also cause zero-drift due to their different ages. Besides, using two chambers also leads to an increase in the dimensions of the analyzer. On the other hand, a reference channel method was developed to overcome the problems introduced by reference chambers and is widely used [21,22]. A reference BPF, which has a wavelength and bandwidth out of the IR absorption of most of the gas pollutants, was used instead of the reference chamber. A measurement BPF, which has a center wavelength (CWL) associated with a target gas, has been applied. The reference and measurement BPFs were attached on a rotation wheel. The identical IR source and detector were attached on a single gas chamber which contained a sample gas [21,22]. IR radiation from the IR source will penetrate the reference BPF and measurement BPF, then enter the gas chamber to contact the sample gas, and finally reach the detector. The detector signal with respect to the IR radiation from the reference BPF is called a reference channel (i.e., R) and that from the measurement BPF is called a measurement channel (i.e., M). The fraction R/M was also defined as an analyzer signal [21,22]. Although this method could solve some disadvantages of the reference chamber method such as using two detectors, bulky and different contamination of optical elements, it still held a limitation. Using a reference BPF such as 3.95 µm BPF, which is a different wavelength from that of a measurement BPF (e.g., SO2 BPF at 7.3 µm), can also cause zero-drift [21]. An example of this issue is presented in Figure 1. As shown in Figure 1, BPF1 and BPF2 are representative for the reference and measurement BPFs, respectively. The radiance of BPF1 (R) is much higher than that of BPF2 (M) (circle points) at 900 K (i.e., R/M > 1). The radiance of BPF1 is almost equivalent to that of BPF2 (triangle points) at 700 K (i.e., R/M ~ 1), but the radiance of BPF1 is much lower than that of BPF2 (rectangular points) at 500 K (i.e., R/M < 1). Thus, because the fraction R/M will be changed with respect to various temperatures of the IR source (i.e., IR source aging), the reference BPF could not reduce the zero-drift caused by the aging effect of both IR source and detector over a long period of time.
Several studies have been conducted for an NDIR sensor rather than an NDIR analyzer to achieve zero-drift-free analysis [21,23,24,25,26]. The Near Zero DriftTM methodology was developed to minimize the zero-drift of an NDIR sensor [21,24,25,26]. In this previous work, the NDIR sensor consisted of two connected reference and measurement gas cells coupled with a single IR source. The term “gas cells” was used instead of gas chambers in order to depict an NDIR sensor comprising a very small volume of gas cell; on the other hand, the NDIR analyzer comprised a big volume of gas chamber. Two identical BPFs, which have the same CWL, were applied to both measurement and reference cells. The length of the measurement cell is twice that of the reference cell. Each gas cell was attached to a detector. A fraction of the detector signal from the reference cell (R) to that from the measurement cell (M) was used as a sensor signal. It was reported that the method could reduce the zero-drift when the IR source was aged by approximately 20% [21,24,25,26]. Although two identical BPFs were used to prevent zero-drift, the drift might occur due to the different aging effects by the two detectors. Hussain et al. (2018) developed a low zero-drift double-beam NDIR sensor consisting of reference and measurement gas cells with the same length. The two cells were connected at an intersection point, and one IR source was employed. At the other end-side of each cell, a thermopile detector was attached, and a detector was coupled with a hollow disk to reduce the IR intensity in the reference cell [23]. The measurement error of the sensor was less than 5% when the temperature varied from 253 to 333 K. These studies tried to overcome the zero-drift caused by the aging of IR source and the contamination of optical elements. However, using two detectors also causes zero-drift due to the different ages of these detectors; therefore, the drift issue has not been completely solved. Furthermore, it is complicated and costly when two gas cells and two detectors were employed. Therefore, these methods are difficult to directly apply to the NDIR analyzer.
In this study, a low zero-drift NDIR analyzer has been developed to continuously measure NH3 emitted from combustion processes. A least-interfering BPF, gas chamber’s coating materials, and a zero-drift reduction method were investigated, and an urban household solid waste incinerator with an SCR was used as a case study.

2. Materials and Methods

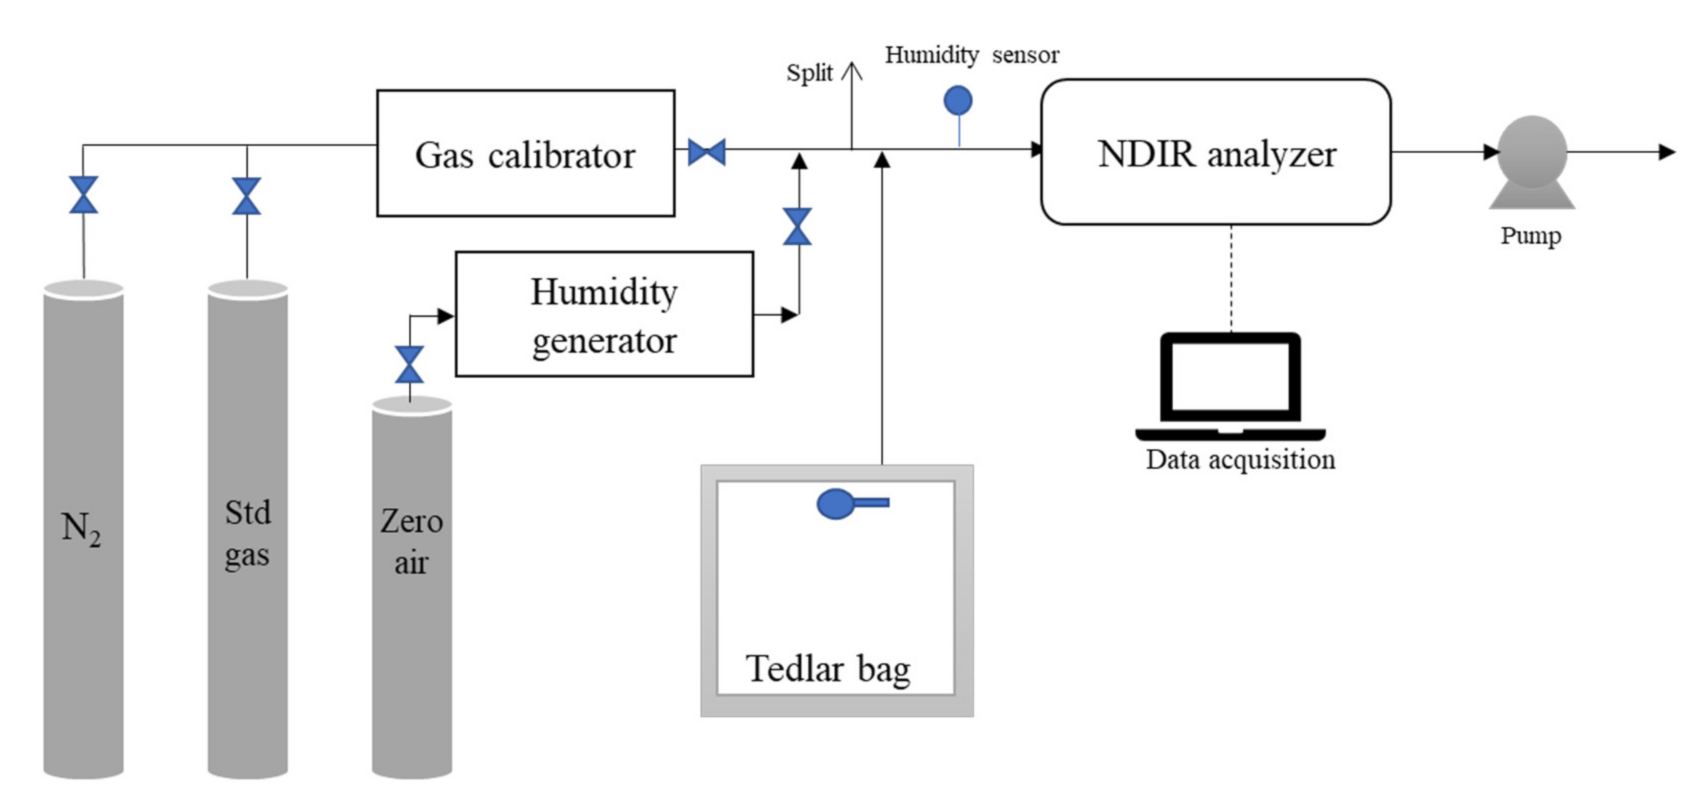
2.1. Experimental Materials and Apparatus

NH3 (1.21, 5.02, 10.2, 19.6, 50.3 ppmv), HCl (1.21, 5.02, 10.2, 19.6, 50.3, 5000 ppmv), CO (10, 50, 100, 180, 500, 2000 ppmv), NO (10, 50, 100, 180, 500, 2000 ppmv), NO2 (10, 50, 100, 180, 500, 2000 ppmv), SO2 (10, 50, 100, 180, 500, 2000 ppmv), CO2 (1.2, 6.04, 10.08, 12.64, 22.5, 50 ppmv), formaldehyde (95 ppmv), acetaldehyde (1%) and toluene (205 ppmv) standard gases acquired from Rigas Co., Ltd., Daejeon, Korea were used to make various concentrations. A calibrator (Sonimix 2106-10, LNI Swissgas S.A., Versoix, Switzerland) was used to dilute the above standard gases with N2 gas (99.999%, DongA Co., Ltd., Gyeonggi, Korea) to produce various concentrations. Zero air was continuously introduced into two impingers containing water at 25 °C ± 2 °C to generate a humidity sample. Humidity was measured by a humidity sensor (645, Testo SE & Co. KgaA, Lenzkirch, Germany).

2.2. Experimental Procedure

A solution for the interference issue is presented in Section 2.2.1. That for the zero-drift issue is addressed in Section 2.2.3. In addition, we found that the material of the gas chamber affected a response time of the NH3 analyzer. An investigation on the material for the gas chamber was also conducted and is introduced in Section 2.2.2.

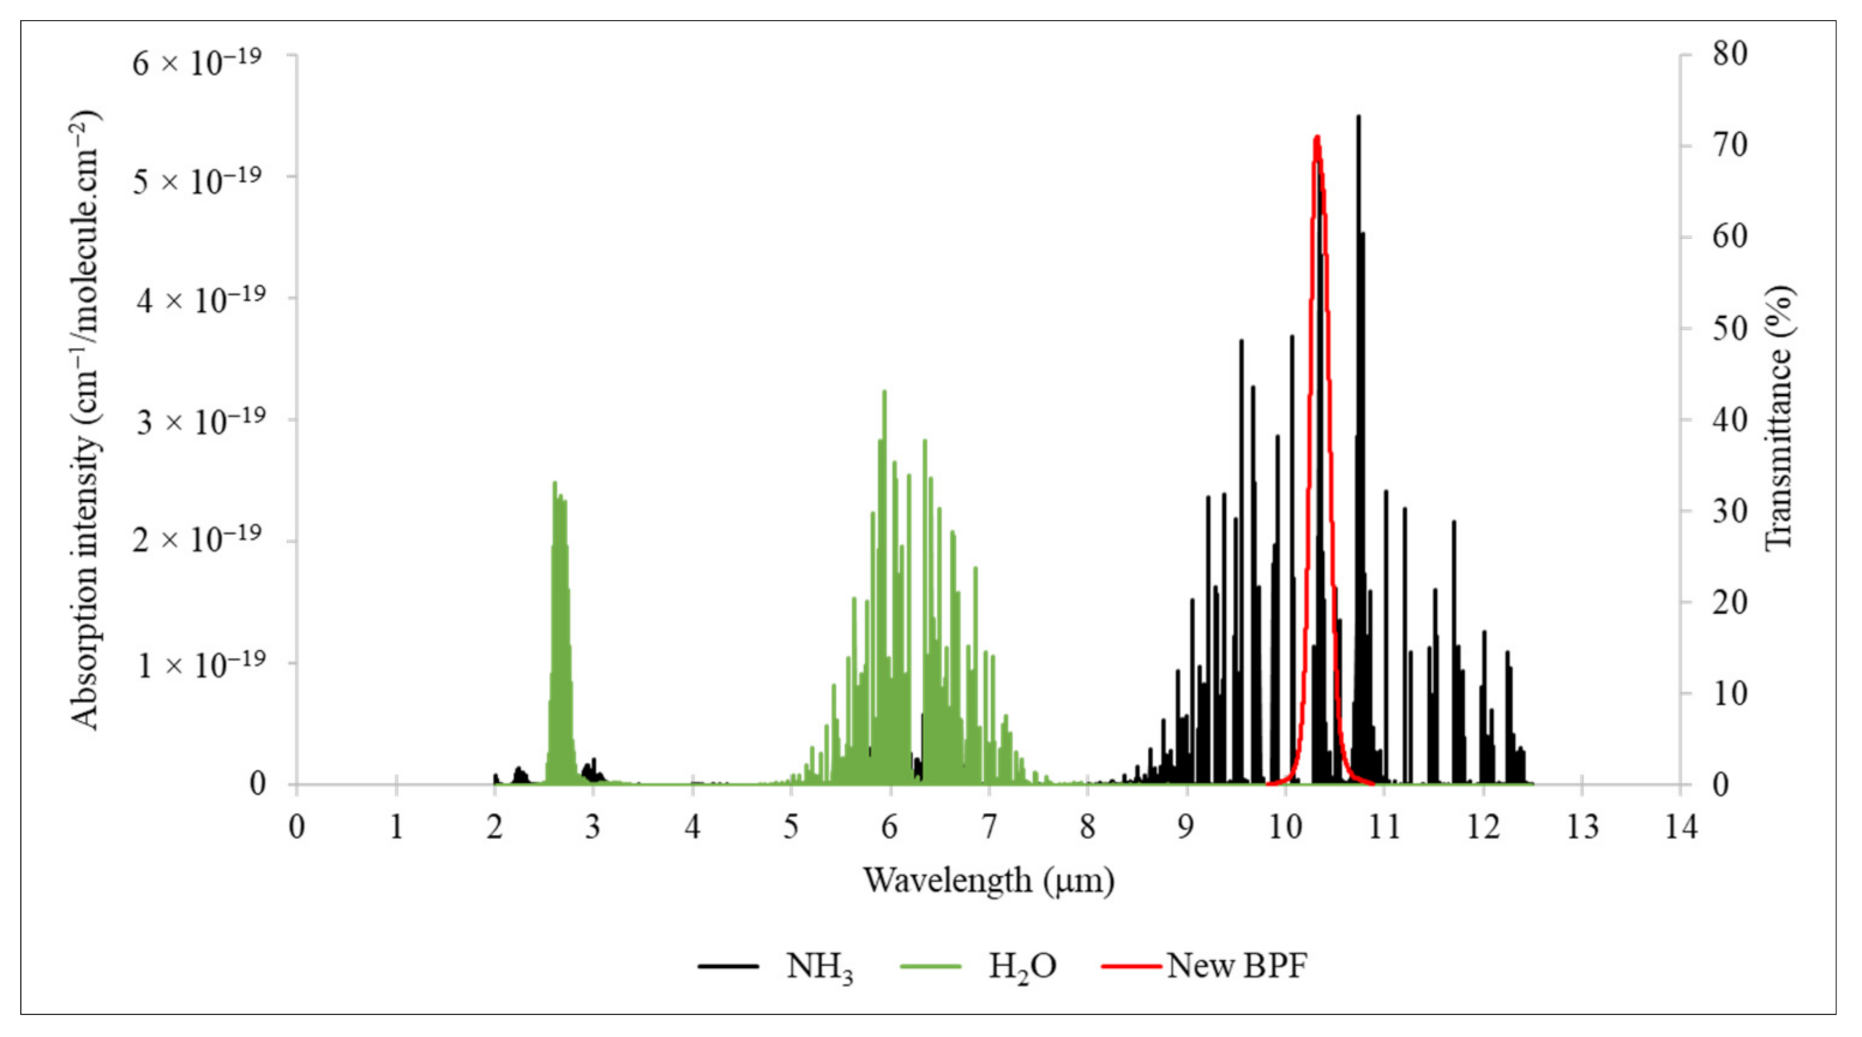
2.2.1. Development of a Least-Interfering BPF for NH3 NDIR

IR absorption spectra were adapted from the HITRAN database [27]. Since an urban household solid waste incinerator was used as a case study, the composition of flue gas emissions included NO, NO2, CO, CO2, SO2, HCl, NH3, H2O, and volatile organic compounds (VOCs) [14,28,29]. Formaldehyde, acetaldehyde, and toluene were used as representative VOCs in this study due to their high concentration among organic gases emitted from urban household solid waste incinerators [29]. The least-interfering wavelength and bandwidth were found based on a method published in our previous studies [30,31]. A feasible BPF for NH3 NDIR was made based on this result. The feasible BPF was made by a two-cavity filter method with Germanium substrate and SiO coating material. An NDIR analyzer was made with an optical path length of 10 m. The airflow rate was 1 L/min. The gas chamber temperature was maintained at 45 °C. A 20 W silicone-based IR source (IR-Si253, Hawkeye Technologies Inc., Milford, CT, USA) was used to produce IR radiation. A pyroelectric detector (LME-335-60, InfraTec GmbH, Dresden, Germany) was used as a detector. The feasible BPF was attached to the analyzer to investigate interference caused by other gases. The feasible BPF for NH3 was defined as a measurement channel. A reference BPF with 3.95 μm of CWL and 90 nm of half band width (Seoul Precision Optics Co., Ltd., Seoul, Korea) was applied for a reference channel. An experimental set-up is presented in Figure 2.
Single gases at various concentrations were introduced into the analyzer to check their individual effects. Each standard gas was introduced into the analyzer for 10 min. The first 5 min of data, until equilibrium was reached, was omitted, and the average signal values for the last 5 min were used. The log (R/M) (i.e., analyzer signal) was calculated where R is the signal from the reference channel and M the signal from the measurement channel. The experiment was repeated 7 times. The Statgraphics Centurion XV software (15.2.05; Statpoint Technologies Inc., Warrenton, VA, USA) was used to analyze the data.

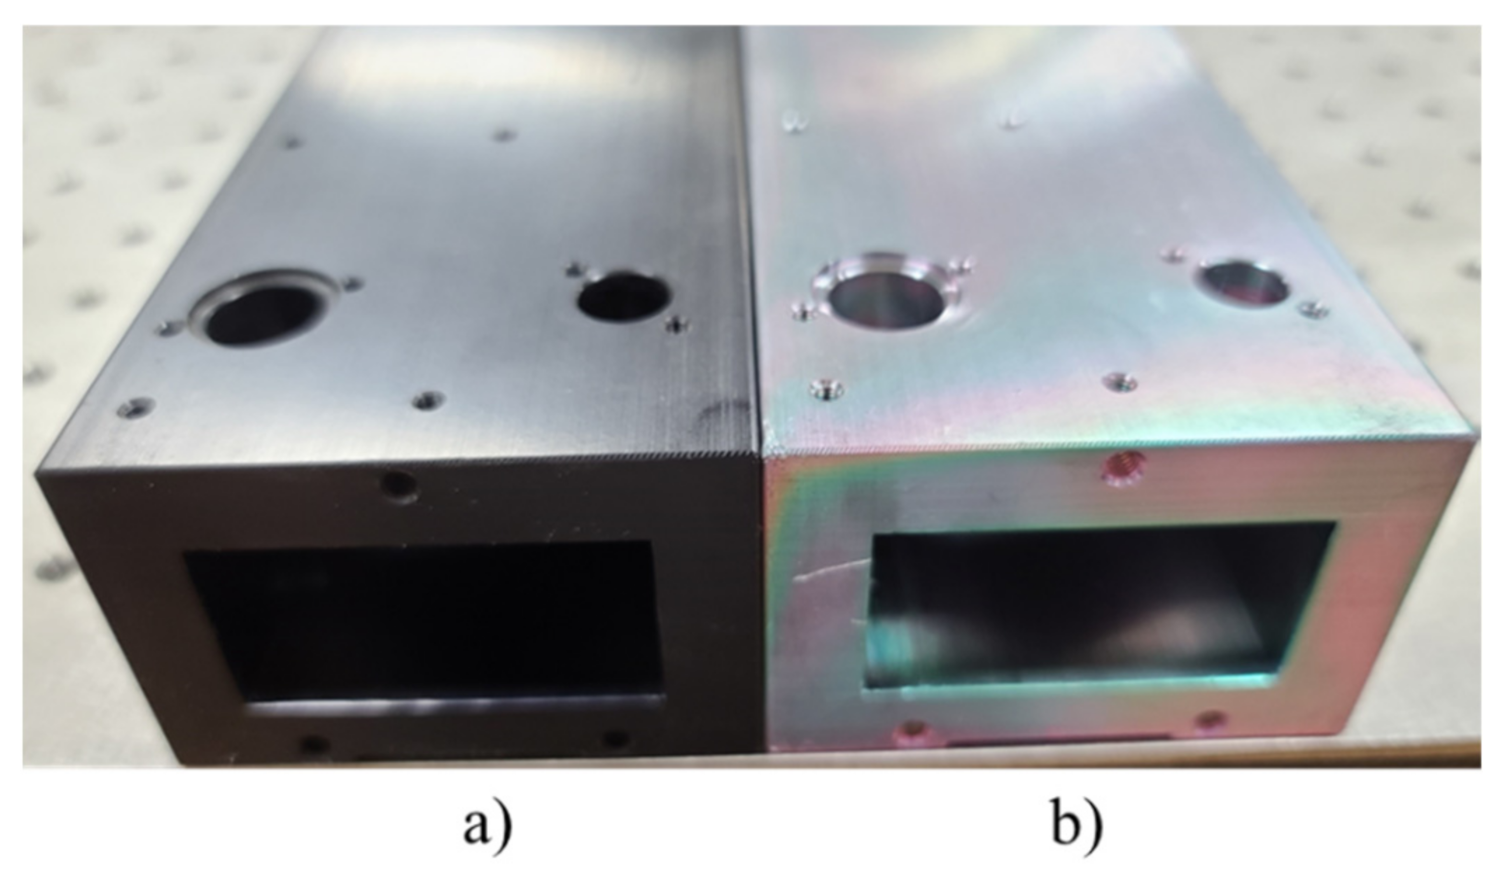
2.2.2. Investigating Coating Materials for the Gas Chamber of the NH3 NDIR Analyzer

Unlike other gases, while conducting experiments with NH3, we found that an aluminum-anodized chamber could adsorb NH3, leading to an increase in response time. To overcome this problem, an inert material was used to coat the inside of the gas chamber. Teflon does not react with NH3 [32,33]; however, it is too difficult to coat Teflon inside a one-body gas chamber with a long and narrow space. SUS316 also does not react with most of the chemical compounds. However, it was found to adsorb a significant amount of NH3 [34]. Silcotek® material (SN2000_SP12, Silcotek Cooperation, Bellefonte, PA, USA) also did not react with NH3 and was chosen as a coating material of the gas chamber. A comparison between the aluminum-anodized chamber (Figure 3a) and the aluminum-Silcotek® coated chamber (Figure 3b) was conducted. At the same temperature and flow rate, response times of the analyzer at 80 ppmv of standard gas between the different chambers were determined. A slow response time would indicate that the gas chamber adsorbed more NH3; a longer time is spent to reach 80 ppmv. The experimental set-up was similar in Section 2.1. The experiment was repeated 3 times.

2.2.3. Development of an Alternative Method to Reduce Zero-Drift of the NH3 NDIR Analyzer

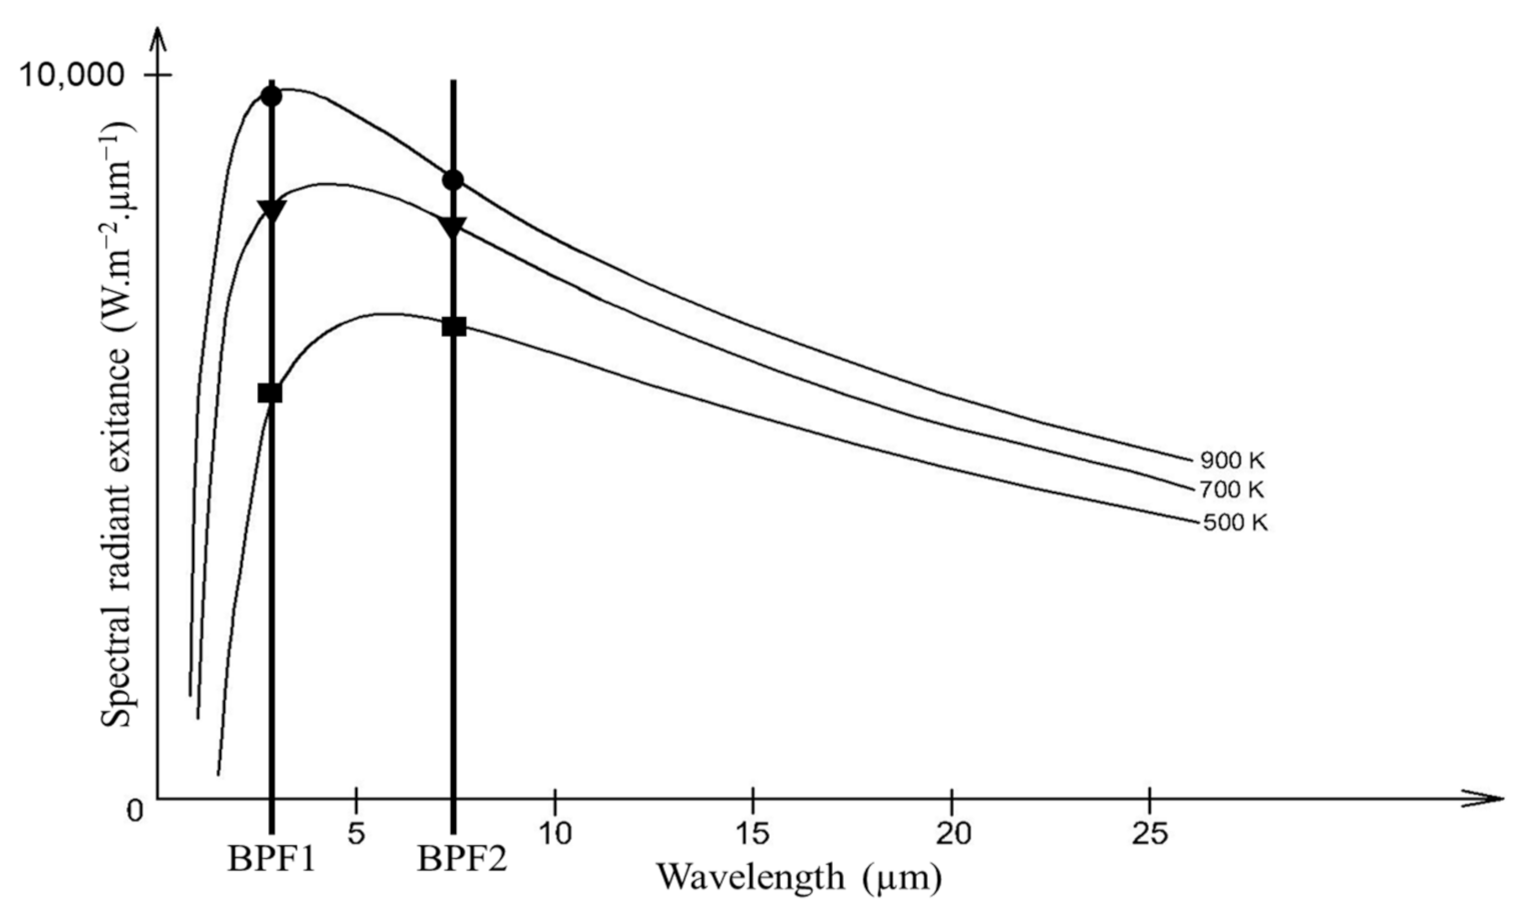
Investigating the Optimal Beam Reducer

Generally, the aging of an IR source or a detector causes the zero-drift of an NDIR analyzer if two different BPFs are employed. Consequently, the application of identical BPFs for the reference and measurement channels is necessary, where identical BPFs have the same CWL and half band width (HBW). However, using the identical BPFs bring about the same ratio of gas absorbances for the reference and measurement channels. Based on Beer–Lambert’s law, the IR absorption pattern of a compound is influenced by the initial IR intensity. Hence, to apply the same BPF for the reference and measurement channels, previous researchers varied the initial IR intensities using two gas cells [21,23,24,25,26]. These methods are suitable for a sensor but unsuitable for an analyzer due to its bulky size and complicated structure. It was found that the ability of a detector to detect a gas was proportional to the active area of the detector [35,36]. Therefore, instead of using two gas chambers, changing the initial IR intensity is a potential method. A cylinder (so-called a beam reducer) with a 12 mm diameter and a thickness of 2 mm and a hole at the center was used to vary the IR intensity. A beam reducer coupled with a BPF was attached to a chopper wheel. The optimal inner diameter of the beam reducer was investigated. The inner diameters of the beam reducer were varied at 20%, 30%, 40%, 50%, 60%, 70%, 80%, and 90% of the entire BPF active area.
Various concentrations of NH3 were introduced into the analyzer, and calibration curves were made using different beam reducers. Each standard gas was also introduced into the analyzer for 10 min, using only the average signal values for the last 5 min. Log (M1/M2) was referred to as the analyzer signal where M1 is a signal from a BPF without a beam reducer (i.e., measurement channel) and M2 is a signal from a BPF with a beam reducer (i.e., reference channel). The experiment was repeated 7 times. The experimental set-up was similar to that in Section 2.1. The Statgraphics Centurion XV software (15.2.05; Statpoint Technologies Inc., Warrenton, VA, USA) was also used to analyze the data. An optimal beam reducer would show a good calibration curve in terms of the coefficient of determination.

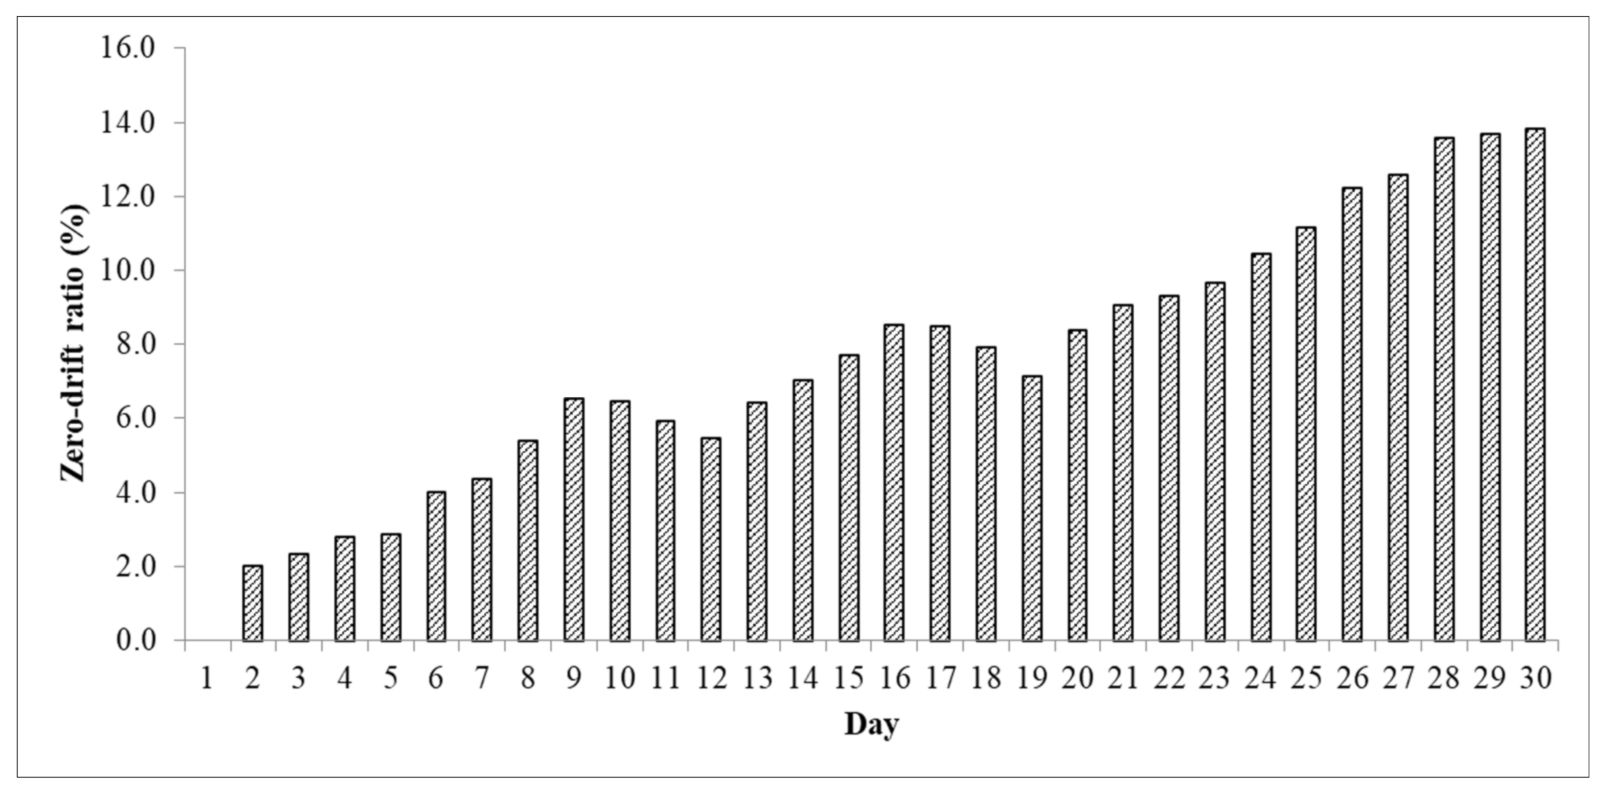
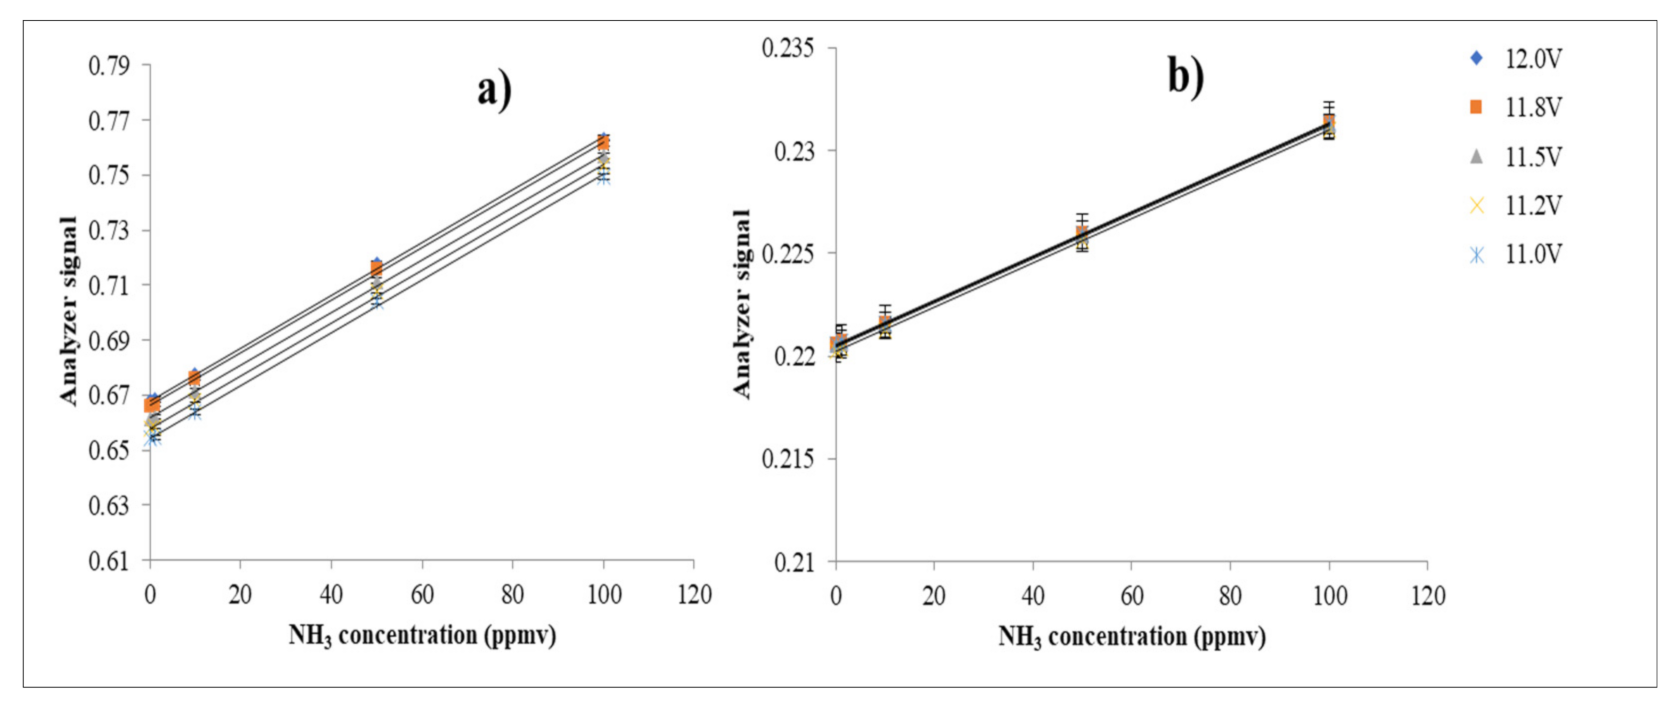
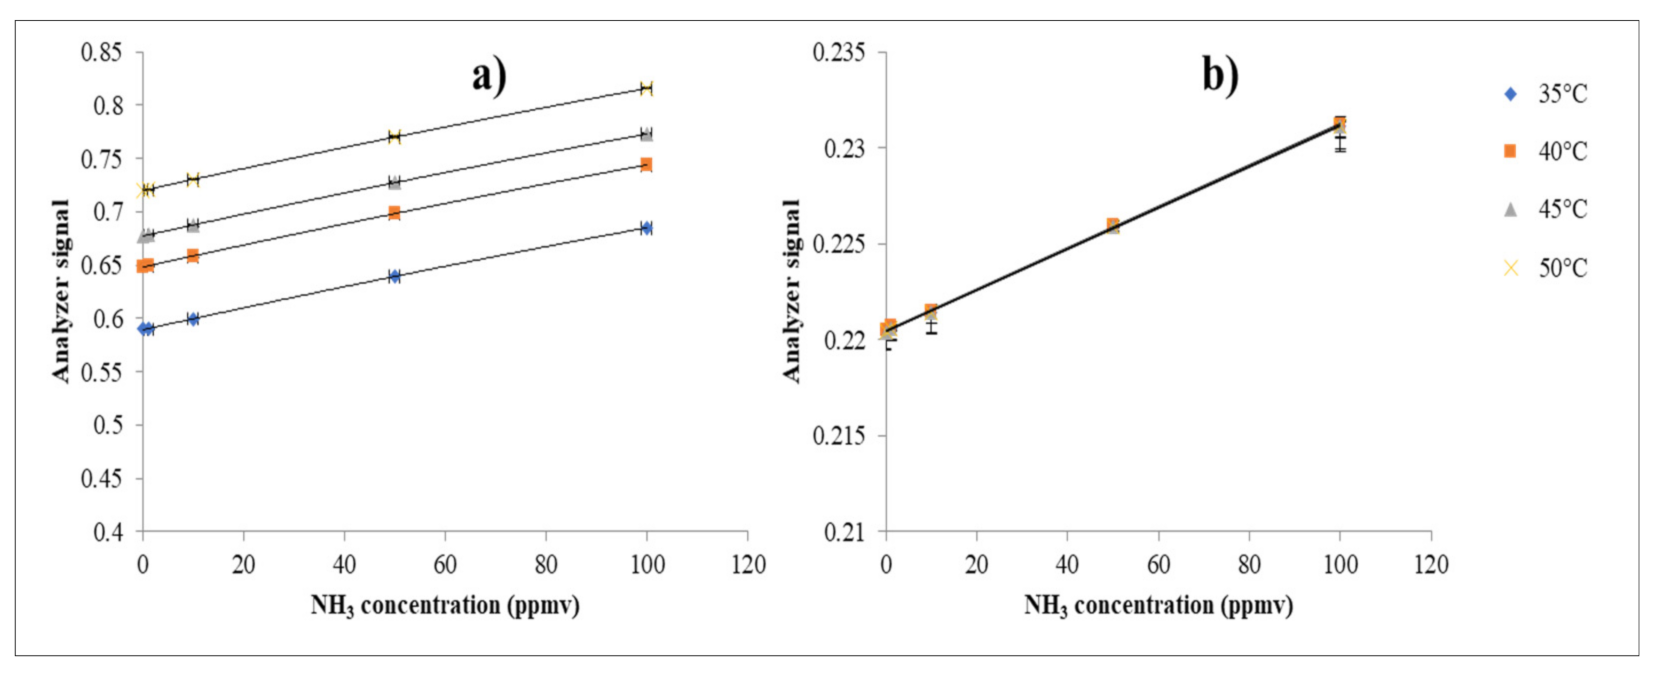
Effect of IR Source and Detector Aging on Analyzer Zero-Drift

After finding the optimal beam reducer, a comparison study in the zero-drift of the analyzer for the aging effect of an IR source and a detector between the feasible reference method (i.e., using identical BPFs and beam reducers) and the typical reference method (i.e., using reference BPF at 3.95 μm) was carried out. In general, the lifetime of an IR source is shorter than that of a detector. For example, the lifetime of the IR source used in this study was noted as 6 months by its manufacturer; however, the lifetime of the detector was reported as 48 months by its manufacturer. Thus, their aging time is also different. It was found that the aging of the IR source caused significant zero-drift after one month operation in this current study. In contrast, a pyroelectric detector was found to change only by 1% through aging for approximately 5 months [37]. The aging of IR sources and detectors generally influences on analyzer signals [21,23]. Therefore, aging effects were simulated in this study. For an IR source, its spectral characteristics depend on the temperature of the IR source. The aging causes the change of its temperature [21]. Moreover, the IR source’s temperature is affected by its voltage. Therefore, the aging effect of the IR source was simulated by variations of its voltages.
In terms of the pyroelectric detector, its detectivity is evaluated by Equation (1) [38]. Since the detectivity depends on the temperature of the detector, the performance of the detector is influenced by its temperature [38]. Hence, aging effects of the detector were simulated by varying its temperature.
D t h * = ε 2 A 4 k T d 2 G t h
where D t h * is the detectivity of the detector, Td is the average temperature of the detector, Gth is thermal conductance, ε is the emissivity of detector, A is the receiving area of the detector and k is the Boltzmann constant.
The temperature of an IR source depends on the power supply [21,24,25,26]. Hence, the voltage of a power source was varied to investigate the effect of the IR source’s age. Voltages of the IR source and the temperature of the detector were varied to investigate variations of the detector signal. IR source voltage varied among 11, 11.2, 11.5, 11.8, and 12 V, and detector temperature were 35, 40, 45, and 50 °C. Various concentrations of NH3 were used to investigate detector signals. The experimental setup was similar to that in Section 2.1. The experiment was also repeated 7 times. The Statgraphics Centurion XV software (15.2.05; Statpoint Technologies Inc., Warrenton, VA, USA) was also used to analyze the data.
Finally, nine gas mixtures based on the emission pattern of an urban household solid waste incinerator in Seoul, Republic of Korea were used to determine the analyzer’s performance. The concentrations of mixtures are shown in Table 2. Since the NH3 slip varied from 1.4 to 14 ppmv when an SCR was applied to treat NOx [13], the NH3 concentrations chosen were 1, 5, and 10 ppmv. We used data of continuous emission monitoring systems in the Republic of Korea named as CleanSYS for solid waste incinerators [39] in order to select concentrations of interference gases. It was found that HCl concentrations ranged from 0 to 13.5 ppmv [39]. Therefore, HCl concentrations in the mixtures were 1, 5, and 10 ppmv. The emission standard of NOx (NO + NO2) was 50 ppmv [40]. Its concentration from the CleanSYS varied from 0 to 69 ppmv [39]. It was assumed that the NO concentration is approximately 90% of that of NOx. Thus, the NO and NO2 concentrations were 1, 20, 45 ppmv and 1, 2.5, 5 ppmv, respectively. Although the SO2 concentrations emitted from an incineration plant were less than 10 ppmv [39], the national emission standard for SO2 was less than 50 ppmv [40]. Accordingly, 1, 25, and 50 ppmv SO2 concentrations were generated. Because CO emissions varied from 0 to 50 ppmv [39], 1, 25, and 50 ppmv CO concentrations were selected. Since a water pretreatment device was generally applied to remove water vapor in the flue gas before entering the analyzer [41], H2O concentrations for H2O (vapor) contained in the flue gas were assumed at 10%, 20%, and 50% of relative humidity (RH). CO2 concentrations were varied from 10% to 20% [42,43]. Formaldehyde, acetaldehyde, and toluene concentrations ranged from 0.1 to 1 ppmv [14]. Each mixture was prepared in a 25 L Tedlar bag (232-25, SKC Inc., Eighty Four, PA, USA). The experimental set-up is shown in Figure 2. NH3 concentrations were determined using the Indophenol method [44]. The experiment was also repeated 7 times.
The relative percent difference (RPD) of NH3 concentration observed by the NDIR analyzer and the Indophenol method was calculated using Equation (2).
R P D = C N D I R C I P C I P × 100 %
where CNDIR is an average NH3 concentration obtained from the NDIR analyzer (ppmv), CIP is an average NH3 concentration obtained from the Indophenol method (ppmv). CIP was selected as a reference value because the Indophenol method is standard.

3. Results and Discussion

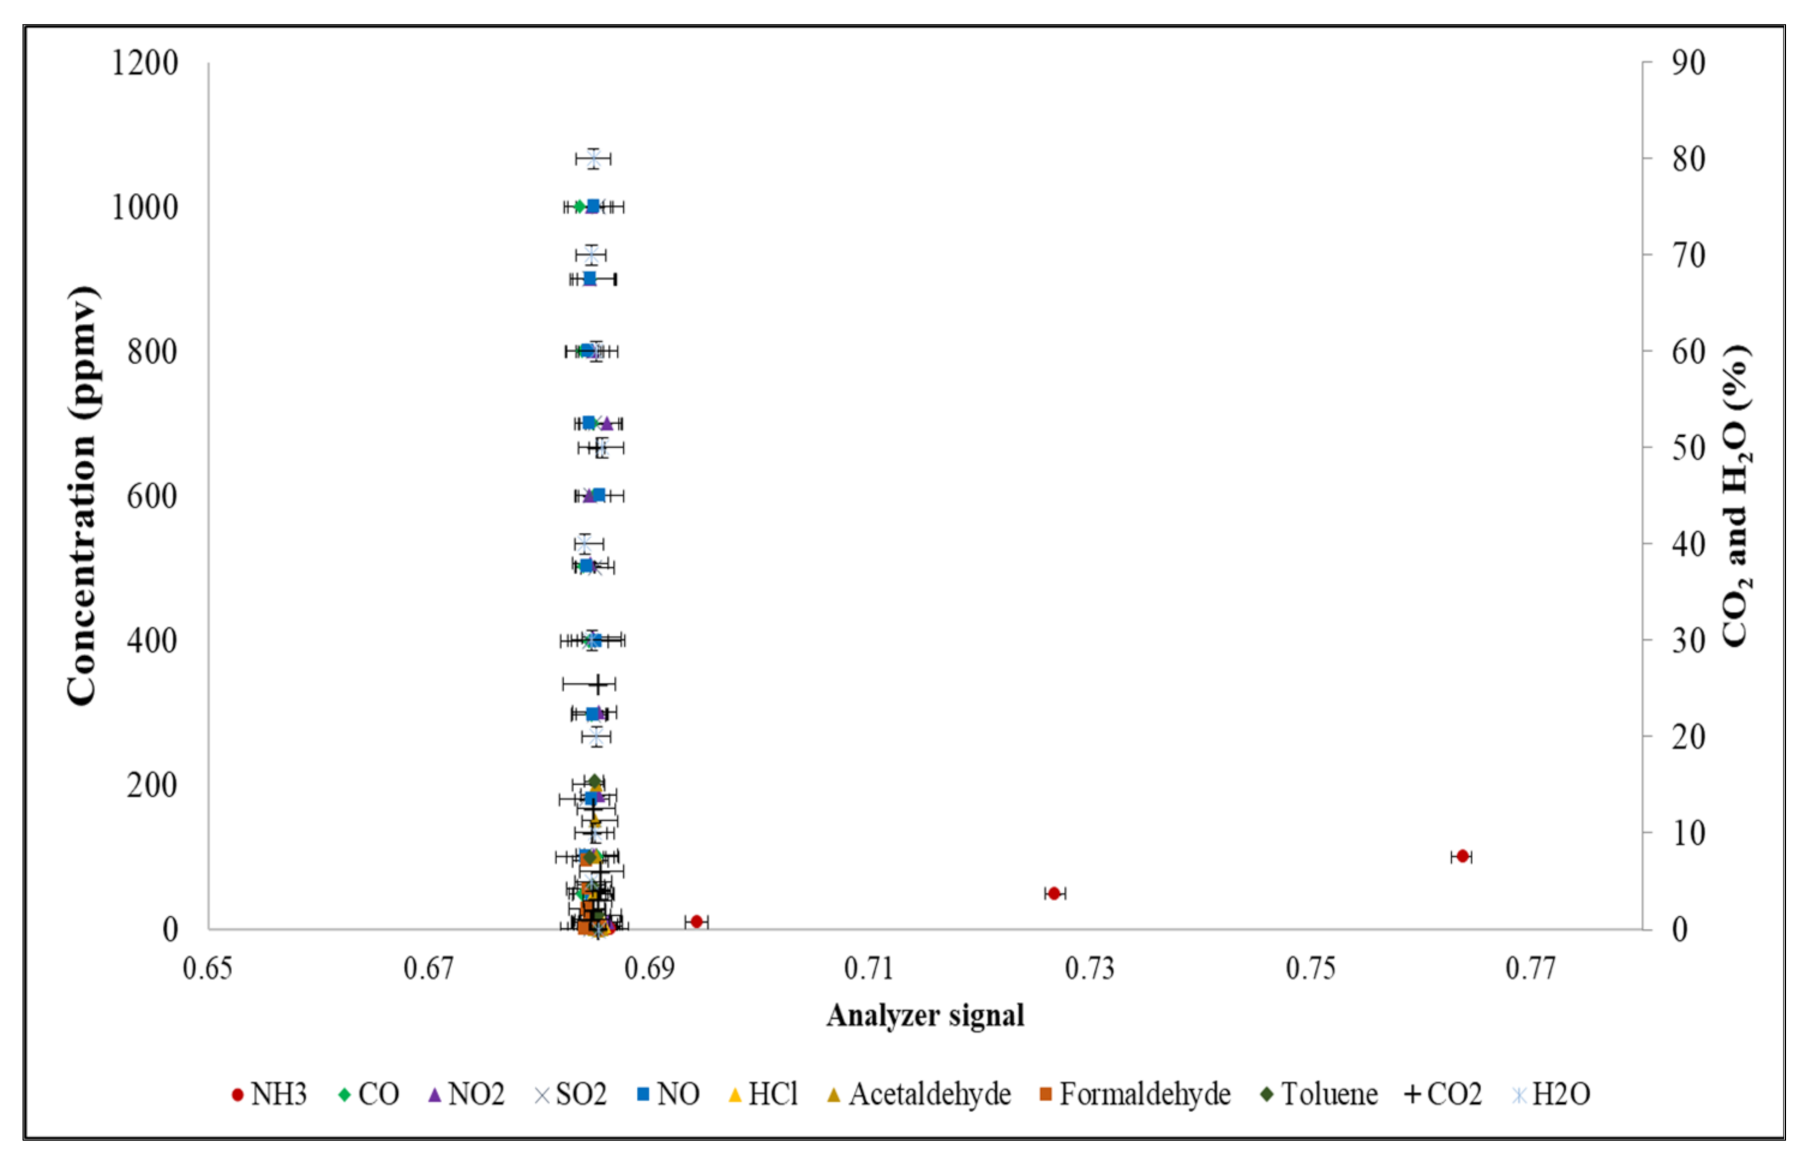
3.1. Development of a Least-Interfering BPF for NH3 NDIR

Three least-interfering bands were found for NH3, including 9.61–9.70 μm, 9.92–9.93 μm, and 10.29–10.49 μm. The band 10.29–10.49 μm was used to make a feasible NH3 BPF because other bands were too narrow to make the BPF in light of current technology level and manufacturing cost. For the feasible BPF, the CWL at 10.39 μm was selected as the middle of the least-interfering band. Its full bandwidth (FBW) was 200 nm. The BPF was made by a two-cavity filter method with Germanium substrate and SiO coating material. When the BPF was made, its CWL, FBW, HBW, and transmittance were 10.39 μm, 1068 nm, 190 nm, and 71%, respectively. A comparison of the feasible BPF with a previous BPF for NH3 is presented in Table 3, showing the CWL of the feasible BPF differed from the previous one. Since the H2O spectra ranged from 2 μm to 8 μm (Figure 4), using NH3 CWL within this band range might introduce positive bias to the analyzer. IR intensity by CWL at 9.7 μm was weaker than that at 10.39 μm and 10.6 μm, which resulted in a reduction in analyzer sensitivity. According to the HITRAN database, H2O had the lowest interference in the range of 10.29–10.49 μm. Therefore, 10.39 μm was the optimal choice for the NH3 NDIR analyzer.
Interfering effects of other gases emitted from an urban household solid waste incinerator were investigated (Figure 5). The experiment was repeated seven times with a relative standard deviation (RSD) < 0.5%. An ANOVA test was conducted to compare the analyzer’s response to interference gases with 95% confidence. The mean of analyzer signals at the blank condition (i.e., 0 ppmv) was respectively compared to the mean of analyzer signals, for different gases, at various concentrations. The results showed p-values for CO, NO2, SO2, NO, HCl, acetaldehyde, formaldehyde, toluene, CO2, and H2O were 0.1925, 0.3392, 0.6073, 0.5858, 0.6107, 0.9357, 0.3943, 0.4061, 0.9018, and 0.5088, respectively. This indicated that there was no statistically significant difference between mean analyzer signals at the blank condition and those at various concentrations of different gases. Consequently, the gases concerned did not cause interference in the NDIR analyzer coupled with the feasible BPF, although their concentrations were much higher than their real ones.

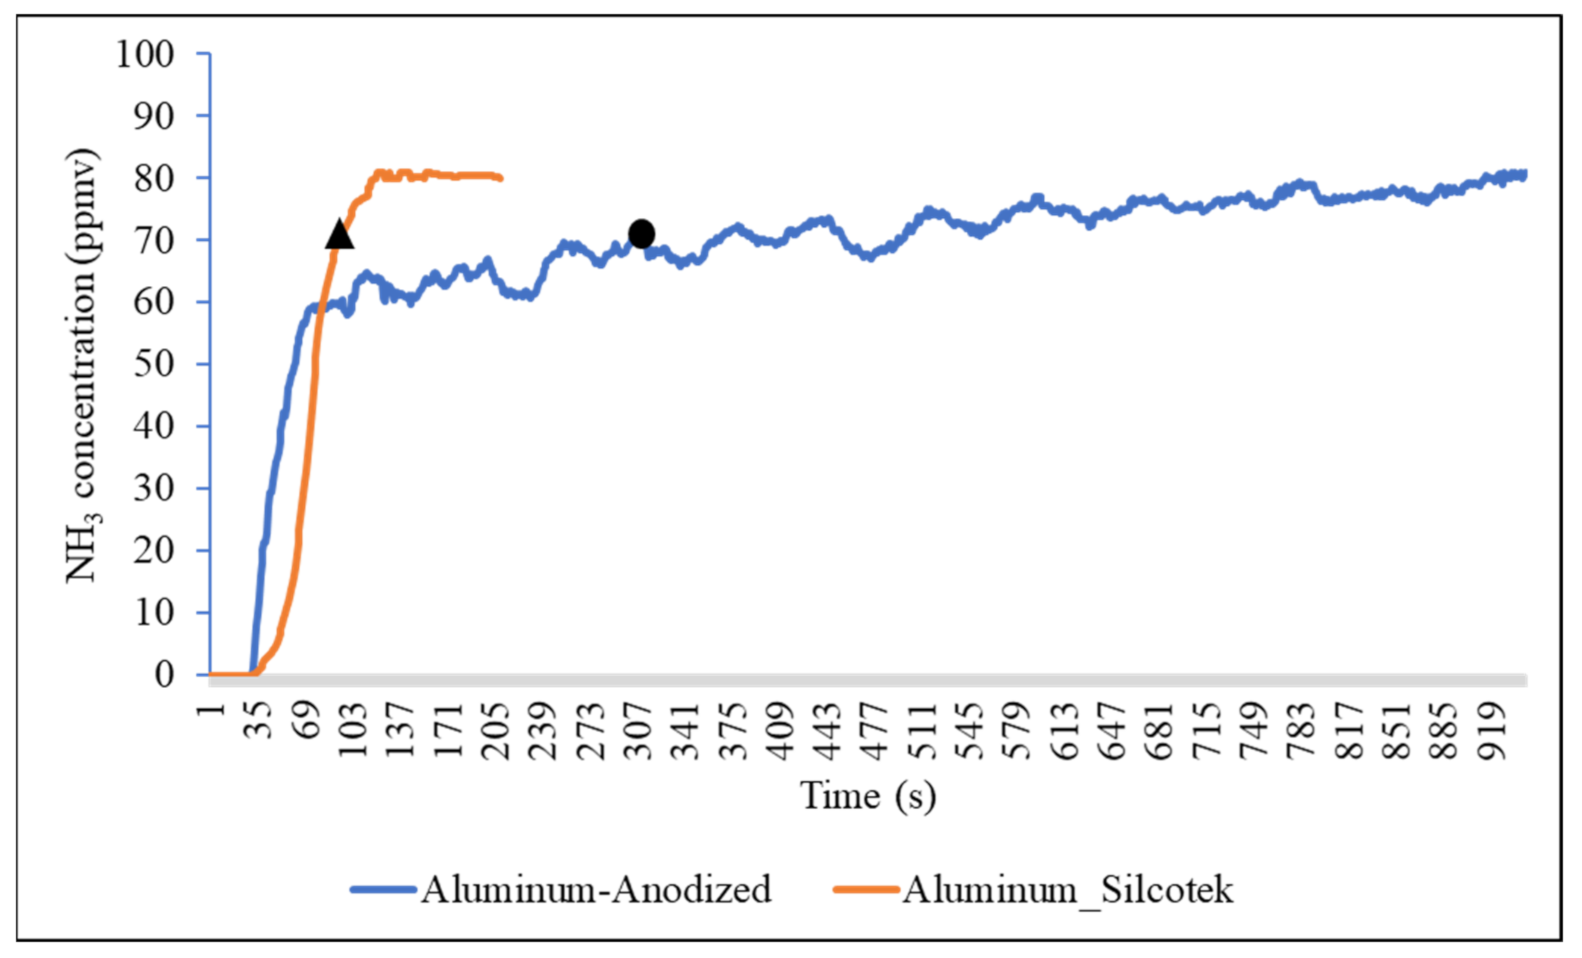
3.2. Investigating Coating Materials for the NH3 NDIR Analyzer Gas Chamber

The most optimal coating material was investigated through response times of the analyzer to 80 ppmv of NH3. Response times of the NH3 analyzer to a certain concentration (i.e., 80 ppmv) were evaluated (Table 4). An example of the analyzer’s response associated with a different coating material is presented in Figure 6.
As shown in Table 4, the analyzer coupled with the aluminum-Silcotek®-coated chamber showed a much faster response time than the aluminum-anodized chamber, and the reproducibility of the analyzer coupled with the anodized chamber was also worse. A consistent pattern was shown before and after the 90% of 80 ppmv point (i.e., black triangle) in terms of the aluminum-Silcotek® coated chamber (Figure 6). In contrast, high variability was found before and after the 90% of 80 ppmv point (i.e., black circle) using the aluminum-anodized chamber, indicating that NH3 was lost in the gas chamber. Therefore, the aluminum-Silcotek®-coated chamber is recommended for the NH3 NDIR analyzer. It suggests that the material of the gas chamber for an NH3 analyzer should be studied more extensively in the future.

3.3. Development of an Alternative Method to Reduce Zero-Drift in the NH3 NDIR Analyzer

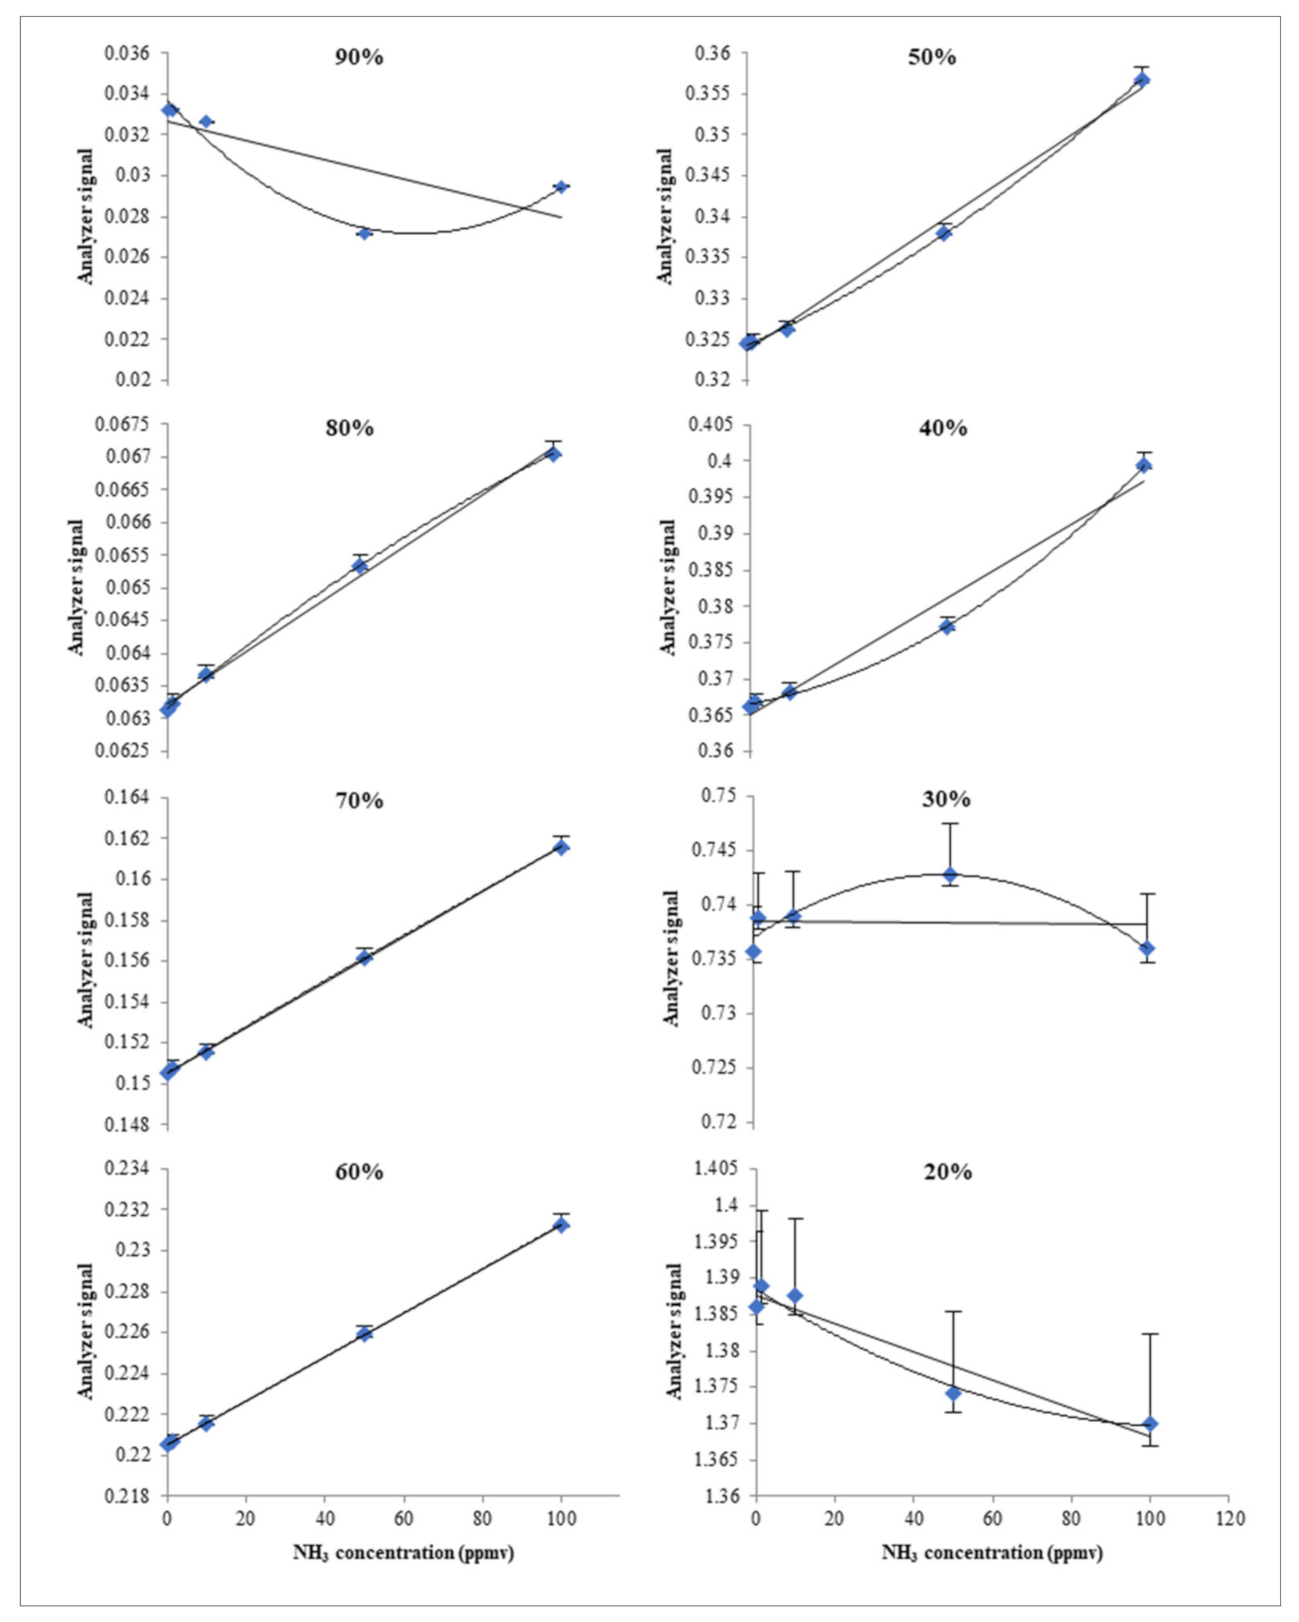
3.3.1. Investigating an Optimal Beam Reducer

An optimal beam reducer was investigated based on the response of the analyzer regarding to various NH3 concentrations. The inner diameters of the beam reducers were varied from 20% to 90% of the entire BPF area. Then, calibration curves, which presented the relationship between NH3 concentrations and analyzer signals, were observed with respect to different beam reducers. The experiment was repeated 7 times with an RSD < 0.5%. Calibration curves are depicted in Figure 7 and calibration functions with their coefficient of determinations (r2) are shown in Table 5. Since gas concentrations and analyzer signals can have a linear or nonlinear relationship [20,48,49,50], both variables were investigated. The optimal beam reducer had a linear calibration curve between NH3 concentrations and analyzer signals.
As presented in Figure 7, calibration curves revealed straight lines when beam reducers with their inner diameters from 60% to 70% of the entire BPF were applied for the reference channel. In addition, as shown in Table 5, calibration functions of NH3 concentrations and analyzer signals had high coefficient of determinations (i.e., r2 > 0.99) for linear functions as well as for quadratic functions (i.e., r2 > 0.999) when the inner diameters of beam reducers were from 50% to 80% of the entire BPF area. Conversely, coefficient of determinations associated with 20%, 30% and 90% of the entire BPF were low, especially they were <0.92 in terms of linear functions. In the case of 40%, although r2 of the quadratic function was higher than 0.999, that of the linear function was only 0.9704. Consequently, beam reducers with their inner diameters as 20%, 30%, 40% and 90% of the entire BPF could not be applied because their application will lead to high measurement errors. Since the beam reducer cut down most of the incident IR beam intensity in the case of 20% to 40%, the detector showed low sensitivity for the variation of the NH3 concentrations. Moreover, the high errors of analyzer signals (Figure 7) indicated that the analyzer’s noise increased due to weak IR radiation. Therefore, these areas of the beam reducer cannot be used for the reference channel. For the beam reducer at 90%, because the IR absorption patterns between the measurement channel and the reference channel were similar, the analyzer signal was not linearly correlated to the NH3 concentration. In general, a BPF coupled with beam reducers with 50% to 80% of the entire BPF area was found to reveal a good performance like a reference channel, and the beam reducer 60% was selected in this study. These reduction ratios of the BPF area showed the decrease of 30% to 60% IR radiation from the IR source. However, because identical BPFs were used for two channels and the analyzer signal was calculated using the fraction of detector signals between two channels, the reference channel and measurement channel terminology were used only as a relative concept. A reference gas cell produced 50% of IR radiation in a previous study [21]. Another study reported that an 80% reduction of detector active area coupled with a gas cell could be used as a reference cell [23]. However, it is difficult to compare these results with the current study because an NDIR sensor has different characteristics to an NDIR analyzer. The result can only suggest that it also possible to use identical BPFs for reference and measurement channels of an NDIR analyzer.

3.3.2. Effect of IR Source and Detector Aging on Zero-Drift of the Analyzer

To find the effectivity of the feasible zero-drift reduction method, aging effects of IR source and detector were simulated. A comparison between the typical reference method (i.e., using reference BPF at 3.95 μm) and the feasible method (i.e., using identical BPFs coupled with a beam reducer) was also carried out. The pattern of zero-drift with respect to aging effects of the IR source is presented in Figure 8, and that with respect to aging effects of the detector is shown in Figure 9.
As shown in Figure 8, the calibration curve of the analyzer coupled with the typical reference method shifted significantly with changing IR source powers. In contrast, there was negligible change using the feasible method. ANOVA tests were conducted to compare mean values of analyzer signals at the same NH3 concentration and different IR source powers with 95% confidence. It was found that p-values for the typical and the feasible reference methods were <0.05 and >0.11, respectively. Thus, there was no significant difference among mean analyzer signals at the same NH3 concentration and different IR source powers with respect to the feasible method. These results confirmed, from the drift pattern depicted in Figure 8, that zero-drift was negligible when the feasible method was used, which was similar to using a shorter reference gas cell for an NDIR sensor in previous studies [21,24,25,26]. When the IR source power decreased from 4.7 V to 4.2 V, the detector signal at the measurement cell was reduced by 13.7% in previous studies; however, the sensor signal was the same due to the sensor coupled with a reference cell with an identical BPF [21,24,25,26].
Similar to an aging IR source, zero-drift was shown to be significant in an NDIR analyzer coupled with the typical reference method (Figure 9a) in terms of an aging detector. For the ANOVA tests, p-values related to the typical reference method were <0.05, while those to the feasible method were >0.62, suggesting that the zero-drift of the analyzer diminished while using the feasible method with regards to detector aging.
Zero air was continuously introduced to an NDIR analyzer coupled with the typical reference channel for one month to figure out the zero-drift caused by the aging of the IR source (Figure 10). It was found that zero-drift caused by IR source aging for one month was approximately 14%. In addition, through the experiment on IR and detector aging, it was found that the feasible method could cut zero-drift by up to 19%. Therefore, the NDIR analyzer may not need to be calibrated for at least one month. However, more extensive experiments under real-world conditions should be carried out to investigate other long-term effects.
The operation of the analyzer was investigated using mixture gases simulated by emission compositions from an urban household solid waste incinerator (Table 6).
As shown in Table 6, the accuracy of the NDIR analyzer was comparable to the Indophenol method (RPD < 2.5%). In addition, the NDIR analyzer also showed good precision (RSD < 5%). Although the full scale of the analyzer was 100 ppmv, it could measure NH3 at 1 ppmv, indicating that the sensitivity of the analyzer was improved.

3.4. Limitations of the Analyzer

Although the NH3 NDIR analyzer showed a good performance through a lab-scale test, it still had several limitations. The analyzer revealed a lower precision (i.e., RSD up to approximately 5%) and accuracy (i.e., RPD up to approximately 2.5%) at 1 ppmv of NH3 than that at 5 ppmv and 10 ppmv of NH3. It indicated that the analyzer may not operate well when the NH3 concentrations are less than 5 ppmv. It also suggests that the current analyzer cannot be applied for measuring NH3 at ppbv level. To overcome this limitation, a longer optical pathlength can be used to improve the sensitivity of the analyzer. On the other hand, the response time of the analyzer was approximately one minute. Although this value is acceptable, the response of the analyzer is still lower than that of commercial products. Thus, a higher flow rate may be applied to improve the response time. In terms of zero-drift, the individual aging effect of an IR source or a detector was investigated. Hence, an integrated aging effect of both IR source and detector should be taken into account in future works. Finally, the performance of the analyzer was investigated by using certain composition and concentration of gaseous compounds in a laboratory. The analyzer should be comprehensively evaluated in real fields with respect to various operating conditions.

4. Conclusions

An NH3 NDIR analyzer has been developed with negligible zero-drift and high accuracy. To compensate for interference effects and thus to improve the accuracy of the analyzer, a least-interfering BPF was made based on information in the HITRAN database of CO, NO, NO2, SO2, CO2, H2O, formaldehyde, acetaldehyde and toluene. Since these compounds are the main gases emitted from the combustion process in coal-fired power plants and solid waste incinerators, the feasible BPF was shown to perform well in our case study. For zero-drift, a feasible reference method in which an identical BPF was applied in the reference and measurement channels was developed to minimize zero-drift caused by the aging effect of both IR source and detector and the contamination of optical elements in the NDIR analyzer. A feasible BPF at 10.39 μm was found to show negligible interference effect of gases concerned in this study.
Additionally, beam reducers with 50% to 80% of the entire BPF area were optimal, and it was found that those coupled with the BPF reduced the zero-drift caused by the aging of the IR source and the detector by 19%. The NDIR analyzer also performed well for measuring mixing gases in comparison to the Indophenol method. It was found that using the current NH3 NDIR analyzer could theoretically extend the calibration duration up to at least one month, which would help in reducing operation costs by saving standard gases.
In this study, the zero-drift effect was determined in a laboratory condition. Moreover, aging effects of IR sources and detectors were simulated instead of testing real aging for a long time. Hence, more studies should be implemented in real-world scenarios to investigate the real aging of IR sources and detectors as well as the effect of operation conditions on the NDIR analyzer. On the other hand, the response time and the sensitivity of the analyzer should be improved. This study was conducted with some representative gases emitted from an urban household solid waste incinerator. Thus, effects of other emission characteristics, such as chemical factories, power plants, and cement factories should be investigated in future works.

Author Contributions

J.-C.K. and T.-V.D. conceptualized the work; J.-H.L., H.-N.G., I.-Y.K., S.-W.L. and I.-Y.C. performed the experiments; T.-V.D. and B.-G.P. wrote the original draft; J.-C.K. performed reviewing and editing. All authors have read and agreed to the published version of the manuscript.

Funding

This research received no external funding.

Data Availability Statement

The data presented in this study are available on request from the corresponding author. The data are not publicly available due to confidential policy of our project.

Acknowledgments

This paper was supported by Konkuk University Researcher Fund in 2019.

Conflicts of Interest

The authors declare no conflict of interest.

References

  1. US National Library of Medicine PubChem. Available online: https://pubchem.ncbi.nlm.nih.gov/ (accessed on 20 May 2021).
  2. Pohanish, R.P. Sittig’s Handbook of Toxic and Hazardous Chemicals and Carcinogens. Available online: https://www.elsevier.com/books/sittigs-handbook-of-toxic-and-hazardous-chemicals-and-carcinogens/pohanish/978-1-4377-7869-4 (accessed on 20 May 2021).
  3. Ezimand, K.; Kakroodi, A.A. Prediction and spatio—Temporal analysis of ozone concentration in a metropolitan area. Ecol. Indic. 2019, 103, 589–598. [Google Scholar] [CrossRef]
  4. Guo, H.; Chen, K.; Wang, P.; Hu, J.; Ying, Q.; Gao, A.; Zhang, H. Simulation of summer ozone and its sensitivity to emission changes in China. Atmos. Pollut. Res. 2019, 10, 1543–1552. [Google Scholar] [CrossRef]
  5. Han, Y.-J.; Kim, H.-W.; Cho, S.-H.; Kim, P.-R.; Kim, W.-J. Metallic elements in PM2.5 in different functional areas of Korea: Concentrations and source identification. Atmos. Res. 2015, 153, 416–428. [Google Scholar] [CrossRef]
  6. Jeon, W.-B.; Lee, S.-H.; Lee, H.; Park, C.; Kim, D.-H.; Park, S.-Y. A study on high ozone formation mechanism associated with change of NOx/VOCs ratio at a rural area in the Korean Peninsula. Atmos. Environ. 2014, 89, 10–21. [Google Scholar] [CrossRef]
  7. Kim, B.-U.; Kim, O.; Kim, H.C.; Kim, S. Influence of fossil-fuel power plant emissions on the surface fine particulate matter in the Seoul Capital Area, South Korea. J. Air Waste Manag. Assoc. 2016, 66, 863–873. [Google Scholar] [CrossRef] [Green Version]
  8. Mao, X.; Shen, T.; Feng, X. Prediction of hourly ground-level PM2.5 concentrations 3 days in advance using neural networks with satellite data in eastern China. Atmos. Pollut. Res. 2017, 8, 1005–1015. [Google Scholar] [CrossRef]
  9. Zhong, Z.; Zheng, J.; Zhu, M.; Huang, Z.; Zhang, Z.; Jia, G.; Wang, X.; Bian, Y.; Wang, Y.; Li, N. Recent developments of anthropogenic air pollutant emission inventories in Guangdong province, China. Sci. Total Environ. 2018, 627, 1080–1092. [Google Scholar] [CrossRef]
  10. Behera, S.N.; Sharma, M.; Aneja, V.P.; Balasubramanian, R. Ammonia in the atmosphere: A review on emission sources, atmospheric chemistry and deposition on terrestrial bodies. Environ. Sci. Pollut. Res. 2013, 20, 8092–8131. [Google Scholar] [CrossRef]
  11. US EPA. Managing Air Quality—Emissions Inventories. Available online: https://www.epa.gov/air-quality-management-process/managing-air-quality-emissions-inventories (accessed on 20 May 2021).
  12. US EPA. Control and Pollution Prevention Options for Ammonia Emissions. Available online: https://www.osti.gov/biblio/104094-control-pollution-prevention-options-ammonia-emissions (accessed on 20 May 2021).
  13. IPCC. Good Practice Guidance and Uncertainty Management in National Greenhouse Gas. Inventories. Available online: https://www.ipcc-nggip.iges.or.jp/public/gp/english/ (accessed on 20 May 2021).
  14. Korea NIER. Integrated Pollution Prevention and Control. Reference Document on the Best Available Techniques for Municipal Waste Incineration. Available online: https://ecolibrary.me.go.kr/nier/#/search/detail/5254427 (accessed on 4 February 2019).
  15. US EPA. Development of Ammonia CEMS Performance Specifications. Available online: https://www.epa.gov/sites/production/files/2020-08/documents/04-nh3_cems.pdf (accessed on 20 May 2021).
  16. Worthington, B. 60 Years of Continuous Improvement in NDIR Gas Analyzers. In Proceedings of the 50th Annual ISA Analysis Division Symposium—50 Years of Analytical Solutions, Houston, TX, USA, 10–14 April 2005; pp. 95–107. [Google Scholar]
  17. Asadov, H.H.; Mirzabalayev, I.M.; Aliyev, D.Z.; Agayev, J.A.; Azimova, S.R.; Nabiyev, N.A.; Abdullayeva, S.N. Synthesis of corrected multi-wavelength spectrometers for atmospheric trace gases. Chin. Opt. Lett. 2009, 7, 361–363. [Google Scholar] [CrossRef]
  18. Liu, C.; Beirle, S.; Butler, T.; Liu, J.; Hoor, P.; Jöckel, P.; Pozzer, A.; Frankenberg, C.; Lawrence, M.G.; Lelieveld, J.; et al. Application of SCIAMACHY and MOPITT CO total column measurements to evaluate model results over biomass burning regions and Eastern China. Atmos. Chem. Phys. 2011, 11, 6083–6114. [Google Scholar] [CrossRef] [Green Version]
  19. Scholz, L.; Perez, A.O.; Knobelspies, S.; Wöllenstein, J.; Palzer, S. MID-IR Led-Based, Photoacoustic CO2sensor. In Proceedings of the Procedia Engineering, Chennai, India, 7–10 September 2015. [Google Scholar]
  20. Sun, Y.W.; Liu, C.; Chan, K.L.; Xie, P.H.; Liu, W.Q.; Zeng, Y.; Wang, S.M.; Huang, S.H.; Chen, J.; Wang, Y.P.; et al. Stack emission monitoring using non-dispersive infrared spectroscopy with an optimized nonlinear absorption cross interference correction algorithm. Atmos. Meas. Tech. 2013, 6, 1993–2005. [Google Scholar] [CrossRef] [Green Version]
  21. Wong, J.Y.; Schell, M. Zero drift NDIR gas sensors. Sens. Rev. 2011. [Google Scholar] [CrossRef]
  22. Dinh, T.-V.; Choi, I.-Y.; Son, Y.-S.; Kim, J.-C. A review on non-dispersive infrared gas sensors: Improvement of sensor detection limit and interference correction. Sens. Actuators B Chem. 2016, 231, 529–538. [Google Scholar] [CrossRef]
  23. Hussain, H.; Kim, J.; Yi, S. Characteristics and Temperature Compensation of Non-Dispersive Infrared (NDIR) Alcohol Gas Sensors According to Incident Light Intensity. Sensors 2018, 18, 2911. [Google Scholar] [CrossRef] [Green Version]
  24. Wong, J.Y. Intrinsically Safe Improved Sensitivity NDIR Gas Sensor in a Can. U.S. Patent 8,158,946, 17 April 2012. [Google Scholar]
  25. Wong, J.Y. Super-Miniaturized NDIR Gas Sensor. U.S. Patent 8,097,856, 17 January 2012. [Google Scholar]
  26. Wong, J.Y. Differential Temperature Source NDIR Gas Sensing Methodology. U.S. Patent 8,866,085, 21 October 2014. [Google Scholar]
  27. HITRAN. High.-Resolution Transmission Molecular Absorption Database. Available online: https://hitran.org/ (accessed on 1 December 2017).
  28. Hwang, K.-L.; Choi, S.-M.; Kim, M.-K.; Heo, J.-B.; Zoh, K.-D. Emission of greenhouse gases from waste incineration in Korea. J. Environ. Manag. 2017, 196, 710–718. [Google Scholar] [CrossRef]
  29. Maitre, A. Municipal waste incinerators: Air and biological monitoring of workers for exposure to particles, metals, and organic compounds. Occup. Environ. Med. 2003, 60, 563–569. [Google Scholar] [CrossRef] [Green Version]
  30. Dinh, T.-V.; Kim, D.-J.; Ahn, J.-W.; Choi, I.-Y.; Lee, J.-Y.; Son, Y.-S.; Kim, J.-C. A Potential Approach to Compensate the Gas Interference for the Analysis of NO by a Non-dispersive Infrared Technique. Anal. Chem. 2020, 92, 12152–12159. [Google Scholar] [CrossRef]
  31. Dinh, T.-V.; Ahn, J.-W.; Choi, I.-Y.; Kim, J.-C. A Novel Bandpass Filter for the Analysis of Carbon Monoxide Using a Non-Dispersive Infrared Technique. Atmosphere 2018, 9, 495. [Google Scholar] [CrossRef] [Green Version]
  32. Zhu, Z.; Xin, H.; Li, H.; Dong, H. Assessment of Tubing Type on Ammonia Gas Adsorption. Appl. Eng. Agric. 2012, 28, 265–269. [Google Scholar] [CrossRef]
  33. Shah, S.B.; Westerman, P.W.; Arogo, J. Measuring Ammonia Concentrations and Emissions from Agricultural Land and Liquid Surfaces: A Review. J. Air Waste Manag. Assoc. 2006, 56, 945–960. [Google Scholar] [CrossRef] [Green Version]
  34. Vaittinen, O.; Metsälä, M.; Persijn, S.; Vainio, M.; Halonen, L. Adsorption of ammonia on treated stainless steel and polymer surfaces. Appl. Phys. B 2014, 115, 185–196. [Google Scholar] [CrossRef]
  35. Jones, R.C. Performance of Detectors for Visible and Infrared Radiation. Adv. Electron. Electron. Phys. 1953, 5, 1–96. [Google Scholar] [CrossRef]
  36. Gonz´alez, F.J. Noise measurements on optical detectors. Rev. Mex. FI´SICA 2006, 52, 550–554. [Google Scholar]
  37. Lang, S.B.; Shaw, S.A.; Rice, L.H.; Timmerhaus, K.D. Pyroelectric Thermometer for Use at Low Temperatures. Rev. Sci. Instrum. 1969, 40, 274–284. [Google Scholar] [CrossRef]
  38. Rogalski, A. Infrared Detectors, 2nd ed.; CRC Press Taylor & Francis Group: Boca Raton, FL, USA, 2011; ISBN 978-1-4200-7671-4. [Google Scholar]
  39. Korea Environment Corporation Cleansys Data. Available online: https://cleansys.or.kr/index.do (accessed on 1 December 2020).
  40. Korea MOE. National Emission Standard for an Incineration Plant. Available online: https://www.law.go.kr/LSW/lsBylInfoPLinkR.do?lsiSeq=206530&lsNm=%EB%8C%80%EA%B8%B0%ED%99%98%EA%B2%BD%EB%B3%B4%EC%A0%84%EB%B2%95+%EC%8B%9C%ED%96%89%EA%B7%9C%EC%B9%99&bylNo=0008&bylBrNo=00&bylCls=BE&bylEfYd=20190101&bylEfYdYn=Y (accessed on 4 February 2019).
  41. Jahnke, J.A. Continuous Emission Monitoring, 2nd ed.; John Wiley & Sons, Inc.: Hoboken, NJ, USA, 2000; ISBN 0-471-29227-3. [Google Scholar]
  42. Granite, E.J.; King, W.P.; Stanko, D.C.; Pennline, H.W. Implications of mercury interactions with band-gap semiconductor oxides. Main Gr. Chem. 2008, 7, 227–237. [Google Scholar] [CrossRef]
  43. McLarnon, C.R.; Steen, D. Combined SO2, NOx, PM, and Hg Removal from Coal Fired Boilers. In Proceedings of the EPRI-DOE-EPA Combined Utility Air Pollutant Control Symposium: The Mega Symposium-Particulates and Air Toxics, Washington, DC, USA, 19–22 May 2003. [Google Scholar]
  44. ES 01303.1. Ammonia in Flue Gas.—UV/VIS Spectrometry—Indophenol Method. Available online: https://www.law.go.kr/LSW//flDownload.do?flSeq=92976017 (accessed on 4 February 2019).
  45. Korotcenkov, G. Integrated Analytical Systems. In Handbook of Gas. Sensor Materials; Springer New York: New York, NY, USA, 2013; ISBN 978-1-4614-7164-6. [Google Scholar]
  46. Fonollosa, J.; Solórzano, A.; Jiménez-Soto, J.M.; Oller-Moreno, S.; Marco, S. Gas Sensor Array for Reliable Fire Detection. Procedia Eng. 2016, 168, 444–447. [Google Scholar] [CrossRef]
  47. Xing, Y.; Urasinska-Wojcik, B.; Gardner, J.W. Plasmonic Enhanced CMOS Non-Dispersive Infrared Gas Sensor for Acetone and Ammonia Detection. In Proceedings of the I2MTC 2018—2018 IEEE International Instrumentation and Measurement Technology Conference: Discovering New Horizons in Instrumentation and Measurement, Houston, TX, USA, 14–17 May 2018. [Google Scholar]
  48. Chan, K.L.; Ning, Z.; Westerdahl, D.; Wong, K.C.; Sun, Y.W.; Hartl, A.; Wenig, M.O. Dispersive infrared spectroscopy measurements of atmospheric CO2 using a Fabry-Pérot interferometer sensor. Sci. Total Environ. 2014, 472, 27–35. [Google Scholar] [CrossRef]
  49. Mayrwöger, J.; Reichl, W.; Krutzer, C.; Jakoby, B. Gas monitoring with a Fabry-Perot based bolometer: Cross-sensitivity to water vapor. Procedia Eng. 2010, 5, 1220–1223. [Google Scholar] [CrossRef]
  50. Sun, Y.W.; Zeng, Y.; Liu, W.Q.; Xie, P.H.; Chan, K.L.; Li, X.X.; Wang, S.M.; Huang, S.H. Cross-interference correction and simultaneous multi-gas analysis based on infrared absorption. Chin. Phys. B 2012, 21, 090701. [Google Scholar] [CrossRef]
Figure 1. Relationship among the temperature of an IR source, wavelength, and spectral radiant exitance using Planck’s law adapted from [21].
Atmosphere 12 00858 g001
Figure 2. Experimental set-up for the investigation of the interference effect of the NH3 BPF. NDIR: non-dispersive infrared; Std: standard.
Atmosphere 12 00858 g002
Figure 3. Aluminum-anodized gas chamber (a) and aluminum-Silcotek® coated gas chamber (b) used in this study and captured by Authors.
Atmosphere 12 00858 g003
Figure 4. NH3 and H2O spectra with data from the HITRAN database [27] and those of the feasible BPF.
Atmosphere 12 00858 g004
Figure 5. Relationship between target gases’ concentrations and analyzer signals. (Error bars denote minimum and maximum values.)
Atmosphere 12 00858 g005
Figure 6. Comparison of the analyzer’s response at 80 ppmv of NH3 for different coating materials of the gas chamber.
Atmosphere 12 00858 g006
Figure 7. Relationship between analyzer signal and NH3 concentrations associated with various beam reducers. (Error bars indicate min and max values.)
Atmosphere 12 00858 g007
Figure 8. Aging effects of the IR source through its various powers influencing the zero-drift of calibration curves of the NDIR analyzer coupled with the typical reference method (a) and the feasible method (b).
Atmosphere 12 00858 g008
Figure 9. Aging effects of the detector through its various temperatures influencing the zero-drift of calibration curves of the NDIR analyzer coupled with the typical reference method (a) and the feasible method (b).
Atmosphere 12 00858 g009
Figure 10. Zero-drift of the NDIR analyzer coupled with the typical reference channel for 30 days with respect to IR source aging.
Atmosphere 12 00858 g010
Table 1. Popular commercial NH3 analyzers.
No.ModelCompanyTypeRangeTechnique
1Serinus 44Ecotech Group, Victoria, AustraliaExtractive0–20 ppmChemiluminescence
2NH3 analyzerChromatotec Group, Val-de-Virvée, FranceExtractive0–100 ppmUV spectroscopy
3Orion™ 2110XPThermo Fisher Scientific, Waltham, MA, USAExtractive0–10 ppmAmmonia electrode
4LAS300XDEnvironmental S.A., Paris, FranceIn situ0–500 ppmTDLS
5MIR 9000HEnvironmental S.A., Pari, FranceExtractive-Gas Filters Correlation technology at 180 °C
6ZSSFuji Electric Co., Ltd., Tokyo, JapanIn situ0–15, 5000 ppmNDIR
7MEXA-ONE-QL-NXHoriba Ltd., Kyoto, JapanExtractive0–50, 0–2000 ppmQuantum Cascade Laser Infrared (QCL-IR) Spectroscopy
8Innova 1314iLumaSense Technologies, Inc., Santa Clara, CA, USAExtractive0–300 ppmPhotoacoustic Spectroscopy
Table 2. Various concentrations of mixture gases used for investigating interference effect on NH3 measurement.
MixtureNH3 (ppmv)HCl (ppmv)CO (ppmv)NO (ppmv)NO2 (ppmv)CO2 (%)SO2 (ppmv)Toluene (ppmv)Formaldehyde (ppmv)Acetaldehyde (ppmv)H2O (%RH)
Case 11.01.01.01.01.0101.00.10.10.110
Case 21.05.025202.515250.50.50.520
Case 31.01050455.020501.01.01.050
Case 45.01.01.01.01.0101.00.10.10.110
Case 55.05.025202.515250.50.50.520
Case 65.01050455.020501.01.01.050
Case 7101.01.01.01.0101.00.10.10.110
Case 8105.025202.515250.50.50.520
Case 9101050455.020501.01.01.050
Table 3. Information on NH3 BPF from previous and current studies.
No.Current StudyPrevious Study
CWL (μm)HBW (nm)CWL (μm)HBW (nm)
110.391902.25 [45]-
23.03 [45]-
35.70 [45]-
49.7 [46]-
510.6 [47]180
Table 4. Response time of the analyzer from blank to span for different gas chamber coating materials.
No.Aluminum-Anodized ChamberAluminum-Silcotek® Coated Chamber
136968.0
240166.0
342063.0
Mean (second)39766.0
SD (second)25.82.52
RSD (%)6.503.83
Note: SD: standard deviation; RSD: relative standard deviation.
Table 5. Calibration functions presenting the relationship between NH3 concentrations and NDIR analyzer signals with respect to various inner diameters of beam reducers.
No.Beam ReducerLinear FunctionQuadratic Function
120%y = −0.0002x + 1.3875
r2 = 0.9186
y = 2 × 10−6x2 − 0.0003x + 1.3885
r2 = 0.9572
230%y = −3 × 10⁻⁶x + 0.7385
r2 = 0.0026
y = −3 × 10−6x2 + 0.0002x + 0.737
r2 = 0.8763
340%y = 0.0003x + 0.3652
r2 = 0.9704
y = 2 × 10−6x2 + 0.0001x + 0.3666
r2 = 0.9997
450%y = 0.0003x + 0.3236
r2 = 0.9932
y = 1 × 10−6x2 + 0.0002x + 0.3243
r2 = 0.9998
560%y = 0.0001x + 0.2205
r2 = 1
y = 1 × 10−8x2 + 0.0001x + 0.2205
r2 = 1
670%y = 0.0001x + 0.1505
r2 = 0.9997
y = −4 × 10−8x2 + 0.0001x + 0.1505
r2 = 0.9998
780%y = 4 × 10⁻⁵x + 0.0632
r2 = 0.9963
y = −9 × 10−8x2 + 5 × 10⁻⁵x + 0.0632
r2 = 0.9998
890%y = −5 × 10⁻⁵x + 0.0327
r2 = 0.5555
y = 2 × 10−6x2 − 0.0002x + 0.0337
r2 = 0.9652
Note: x is representative for NH3 concentration and y is analyzer signal.
Table 6. Comparison between the NH3 NDIR analyzer and the Indophenol method in the measurement of mixture gases.
MixtureNDIR AnalyzerIndophenol MethodRPD (%)
Min (ppmv)Max (ppmv)Mean (ppmv)RSD (%)Min (ppmv)Max (ppmv)Mean (ppmv)RSD (%)
Case 10.951.091.004.970.980.990.980.591.84
Case 20.941.091.004.920.981.021.002.090.19
Case 30.971.000.991.150.991.021.011.712.40
Case 44.925.044.950.824.955.055.001.001.00
Case 54.925.044.961.094.955.004.970.580.11
Case 64.925.044.961.124.955.004.980.580.47
Case 79.9110.19.960.699.9510.110.00.500.39
Case 89.9210.09.940.289.9510.09.970.290.30
Case 99.8610.19.940.829.919.959.940.230.06
Note: Min: minimum concentrations of NH3 in seven repeated times; Max: maximum concentrations of NH3 in seven repeated times; Mean: average concentrations of NH3 in seven repeated times; RSD: relative standard deviation of seven repeated times; RPD: relative percent difference in NH3 concentration obtained using the NDIR analyzer and the Indophenol method.
Publisher’s Note: MDPI stays neutral with regard to jurisdictional claims in published maps and institutional affiliations.

