Abstract
In this study, we validated the consistency of the GRUAN RS92 and RS41 datasets, versions EDT.1 and GDP.2, in the upper troposphere and lower stratosphere (200–20 hPa), through dual launch campaigns at the GRUAN site and using the radio occultation (RO) product and the ERA5 reanalysis from ECMWF as standards for double difference comparison. Separate comparisons with the references were also performed in order to trace the origin of the bias between the two instruments. Then, the performance of the GRUAN raw temperature correction algorithm was evaluated, from the aspects of day–night, the solar zenith angle, and the pressure level, for GDP.2 version products. The results show that RS92.EDT.1 has a warm bias of 0.355 K, compared to RS41.EDT.1, at 20 hPa, during daytime. This bias was found to mainly originate from RS92.EDT.1, based on the separate comparison with RO or ECMWF ERA5 data. RS92.GDP.2 is consistent with RS41.GDP.2, but a separate comparison indicated that the two original GDP.2 products have a ~1 K warm bias at 20 hPa during daytime, compared with RO or ECMWF ERA5 data. The GRUAN correction method can reduce the warm bias up to 0.5 K at 20 hPa during daytime. As a result, this GRUAN correction method is efficient, and it is dependent on the solar zenith angle and pressure level.
1. Introduction
The Vaisala RS92 radiosonde measures vertical profiles of pressure, temperature, and humidity from the ground to the balloon burst altitude limit at approximately 35 km. The sensors of the assembled Vaisala RS92 radiosonde are calibrated in Vaisala’s CAL4 calibration facility, in which the errors in the temperature and humidity measurements due to solar radiation, time-lag of the relative humidity sensor, and sensor recalibration during the pre-flight ground check are reduced [1,2]; however, most of these correction algorithms are proprietary and are not disclosed to the user.
The Global Climate Observing System (GCOS) Reference Upper Air Network (GRUAN) data processing for the Vaisala RS92 radiosonde was developed to meet the criteria for reference measurements. These criteria specify the collection of metadata, the use of well-documented correction algorithms, and estimates of the measurement uncertainty [3,4]. An important and new aspect of GRUAN processing is that the uncertainty estimates are vertically resolved [2]. Due to radiosonde’s important capabilities and characteristics—global distribution, consistently acquiring data from worldwide stations, and having a free distribution data policy—knowing the correction method accuracy is critical to many applications.
The RS92 has gradually been replaced by the Vaisala RS41, starting in late 2013. Vaisala RS41 introduces an improved level of in-situ observation accuracy and quality. The sensor technologies and state-of-the-art design and manufacturing methodologies of the RS41 combined with its extreme ease-of-use ensure reliable and highly accurate atmospheric observations [5]. To clarify the differences between the RS41 and RS92 radiosondes, comparisons have already been carried out in different ways [6,7,8,9,10]. The consistency between the RS41 and RS92 radiosonde measurements from GRUAN, however, has not yet been examined by a third party, nor has a comparison been made between the RS41 and RS92 radiosondes after using the GRUAN raw temperature correction method. Therefore, the purposes of this study were to evaluate the EDT.1 (manufacturer—Vaisala—data product, or standard processed data [11]) and GDP.2 (GRUAN data product version 2, GDP-ALPHA.2 for RS41 and GDP-BETA.2 for RS92) versions, in terms of the temperature consistency between the RS41 and RS92 radiosonde measurements from GRUAN and the performance of the GRUAN correction method. A direct comparison method was carried out in order to evaluate the consistency between RS41 and RS92 instruments, as well as to determine the origin of the consistency difference. The radio occultation (RO) data set from University Corporation for Atmospheric Research (UCAR) and the ERA5 reanalysis from the European Centre for Medium-Range Weather Forecasts (ECMWF) were used as a standard to estimate the accuracy of the two radiosonde instruments, while the performance of the GRUAN correction method was estimated independently, also through the use of the RO and ECMWF ERA5 data.
The datasets used in this work are described in Section 2. Section 3 describes the methodology. Section 4 presents the RS41 and RS92 direct comparison results and double difference results for ETD.1 and GDP.2 versions. Section 5 analyzes the performance of the GRUAN correction factor and Section 6 provides the discussion and a summary of the study.
2. Dataset Overview
2.1. GRUAN Radiosonde Datasets
The GRUAN Vaisala radiosonde products were acquired from the GRUAN website (ftp://data.gruan.info/, accessed on 29 June 2021), including RS41 and RS92 radiosonde instruments. In the fall of 2013, the Vaisala RS41 (fourth generation) radiosonde was introduced as a replacement for the RS92-SGP radiosonde, with improvements in measurement accuracy for profiles of atmospheric temperature, humidity, and pressure [9]. Note that the RS92 measured pressure as standard, RS41 is available in versions with and without a pressure sensor (SGP/SG); some GRUAN sites use one, some use the other. The GRUAN radiosonde products are stored in NetCDF files. The two data versions studied in this work were obtained from the GRUAN website, namely, the EDT.1 Vaisala data product and the GDP.2 GRUAN data product.
The most significant source of uncertainty for daytime measurements from a radiosonde is solar radiation. Therefore, Vaisala has paid a lot of attention to radiation correction. For the EDT Vaisala data products, no new corrections were applied, i.e., radiation corrections were applied using the method used in the previous version, after the new sounding system DigiCORA version was established. For the Vaisala RS92 instrument, all RS92 ascents were processed using the Vaisala DigiCORA sounding system MW31, which is a sounding receiving station for meteorological and defence applications, software version 3.64.1. This included the solar radiation corrections, as applied to both the temperature and humidity measurements in the WMO comparison of high-quality radiosonde systems, Yangjiang, China, 2010 [12]. The typical solar radiation correction is 0.7 °C at an altitude of 10 hPa [13]. On the other hand, when developing the Vaisala Radiosonde RS41, special attention was paid primarily to minimizing the solar radiation uncertainty and secondarily to characterizing and modeling the effects of radiation on temperature measurement. All RS41 ascents were processed using the Vaisala DigiCORA sounding system MW41 software version 2.0, including solar radiation corrections specific to the RS41 [12]. As a result, the applied radiation correction was solar zenith angle (SZA) and pressure level-dependent, and the typical solar radiation correction ranged from 0.05 °C to 1.16 °C. The radiation correction look-up table can be found in [14] Table 2.3. Another important factor in achieving improved measurement accuracy with the RS41 is the new sensor boom design, which significantly reduces the measurement noise originating from solar radiation.
The EDT.1 data that were used for research do not reference metadata, but only the data in the sounding data file [15]. The GRUAN data product, which was published as RS92/41-GDP, uses algorithms involving both metadata and sounding data, in order to correct for systematic errors in radiosonde measurements of pressure, temperature, humidity, and wind, as well as for assessing how the uncertainties related to these error sources are derived [4].
As mentioned above, during the day, the radiosonde sensor boom is heated by solar radiation, resulting in temperature biases. The net heating of the temperature sensor depends on the amount of radiation absorbed and the cooling of the air flowing around the sensor through thermal radiation and ventilation. Due to the large amount of data collected by the GRUAN network, the processing uses the general assumptions of Luers (1990) [16], regarding information on cloud configuration and surface albedo. The GRUAN correction model derives a vertically resolved error estimate for each individual probe’s temperature data, which is subtracted from the measured temperature profile to give the corrected ambient temperature. In the current version of processing, the correction applied in practice is the average of the GRUAN and Vaisala corrections. The GRUAN correction only corrects for the daytime radiation error, as GRUAN experiments do not yield information on radiative coupling with a cold background, which causes night-time cooling. For the correction of the night-time cooling error of the temperature sensor, Vaisala correction is applied [3]. The correction algorithms that are applied in the GRUAN RS92 processing have been extensively described by Dirksen et al. [2].
Table 1 shows the date, number of profiles, number of stations, parameters used in this work, and the pressure levels of each GRUAN data set. Both RS92-GPD.2 and RS41-GDP.2 contained temperature and temperature correction parameters. It can be seen that the number of profiles in GRUAN datasets (RS92.EDT.1, RS41.EDT.1, RS92.GDP.2, and RS41.GDP.2) were comparable.

Table 1.
The characteristics of GPS RO and GRUAN radiosonde measurements.
Figure 1 shows the station map of RS92 EDT.1. The 10 sites in this paper includes BEL (Beltsville, MD, USA), LAU (Lauder, New Zealand), LIN (Lindenberg, Germany), NYA (Ny-Ålesund, Svalbard), PAY (Payerne, Switzerland), REU (Reunion, France), SGP (Lamont, OK, USA), SOD (Sodankylä, Finland), TAT (Tateno, Japan), and TMS (San Diego, CA, USA). It can also be seen that the GRUAN stations and the dual launches are rather dominated by northern mid-latitude sites.
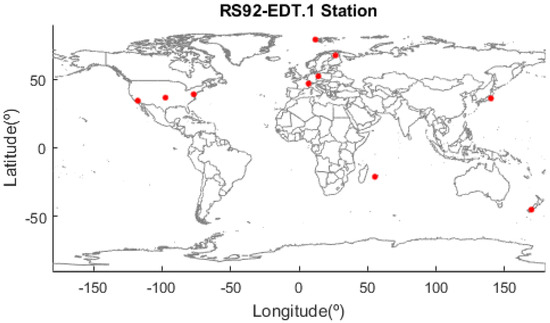
Figure 1.
The station map of RS92 EDT.1.
2.2. Radio Occultation Datasets
The measurements obtained from the Global Positioning System (GPS) radio occultation limb-sounding technique are free of geography-dependent biases [17,18]. RO observation has the advantages of near-global coverage, all-weather capability, high vertical resolution (ranging from ~60 m near the surface to ~1.5 km at 40 km), high accuracy, long-term stability, and self-calibration [18,19,20,21,22,23]. The precision of RO temperature is ~0.1 K within 4–500 hPa [24] or within 20–200 hPa [25], while the precision of the trend of RO-derived temperature data is within ±0.06 K/5 year [25]. Given these characteristics, RO-derived atmospheric temperature profiles were used to independently evaluate radiosonde observations.
The Constellation Observing System for Meteorology, Ionosphere, and Climate (COSMIC) launched on 14 April 2006 on an inclined, non-sun-synchronous orbit with 100 min orbit period. Its inclination angle is 72°, and it consists of six identical microsatellites. COSMIC provides approximately 1500–2500 GPS RO soundings every 24 h, uniformly distributed around the globe. The precision of COSMIC-derived temperature profiles is estimated to be better than 0.05 K from 8 km to 30 km [20,26]. COSMIC provides a unique opportunity for validating radiosonde temperature measurements, both in the upper troposphere and lower stratosphere.
The first Metop satellite (MetOp-A) was launched in 2006, with the other two (MetOp-B/-C) following at five-year intervals. Global Navigation Satellite System—GNSS—Receiver for Atmospheric Sounding (GRAS) instruments are onboard MetOp series satellites.
Schreiner et al. [27] compared reprocessed COSMIC and Metop-A/GRAS bending angles and temperatures produced at the COSMIC Data Analysis and Archive Center (CDAAC). The mean layer temperature difference between 200 hPa and 10 hPa was within 0.05 K, where the mean temperature difference at 20 hPa was equal to 0.03 K. These results demonstrate the consistency of COSMIC and Metop-A/GRAS temperatures. Therefore, the combined RO datasets of COSMIC and Metop-A/-B/-C were used as a standard, in order to independently evaluate the radiosonde observations considered in this study.
The COSMIC and MetOp temperature profiles used in this study were obtained from the UCAR CDAAC (http://cdaac-www.cosmic.ucar.edu/cdaac/products.html, accessed on 29 June 2021).
2.3. ECMWF ERA5
The temperature from the ECMWF ERA5 is another independent data source, which was used in this work to evaluate the temperature biases with two types of radiosonde data from GRUAN. ERA5 is the fifth-generation ECMWF reanalysis for the global climate and weather for the past 4–7 decades [28]. ERA5 is produced using 4D-Var data assimilation in CY41R2 of ECMWF’s Integrated Forecast System (IFS), with 137 hybrid sigma/pressure (model) vertical levels, with the top level at 0.01 hPa. The atmospheric data used in this work were interpolated to 37 pressure levels by ECMWF. ERA5 provides hourly estimates for a large number of atmospheric, ocean-wave, and land-surface quantities with 0.25° × 0.25° horizontal resolution. ECMWF ERA5, here, represents consistent estimates of atmospheric variables among satellite sounders and in-situ observations, through a series of adaptive bias correction and quality control procedures [29]. Despite this, the reanalysis can contain some residual temperature biases, especially in the stratosphere.
3. Methodology
We first present a direct comparison of the differences between the two types of radiosonde versions (EDT.1 and GDP.2) of RS92 and RS41 instruments from GRUAN, for dual launches suspended from the same balloon at some GRUAN stations [30]. This is the most direct and rigorous comparison of the two radiosondes, as both radiosondes were sampled under the same air conditions; however, this comparison is a relative difference comparison, as no standard was provided. Then, the RS92 and RS41 radiosonde instrument datasets were compared to RO and ECMWF ERA5 data, separately, in order to evaluate their accuracy independently. In addition, the double differences between the two types of radiosondes, considering RO and ERA5 datasets, was calculated to confirm the results from the dual launch direct comparison. The temperature biases at different solar zenith angles (SZAs) and different pressure levels were estimated as well in order to evaluate the efficiency and the dependencies of the GRUAN correction method. This section describes the methodology used to conduct the study. Most of the processing steps are straightforward and require minimal description.
3.1. Mandatory Pressure Level
In a neutral atmosphere, the RO refractivity is related to the temperature, water vapor pressure, and pressure, according to Smith and Weintraub [31]. Neglecting the water vapor in the upper troposphere and stratosphere, “dry temperature” can be retrieved. In addition, as the radio occultation bending angle decreases exponentially with decreasing air density, the temperature uncertainty reportedly increases quickly above ~25 km (or pressures lower than ~25 hPa) [7,32,33,34] and it has been found that RO soundings have the highest accuracy from ~8 km to 25 km. Therefore, we restricted the quantitative comparison between radiosondes and other data sources between 200 and 20 hPa [17,35].
The datasets used in this work had different vertical resolutions, as can be seen in Table 1: the COSMIC and MetOp-A/-B/-C wetPrf, i.e., wet products, data have 400 vertical levels, the GRUAN reported data values at 1 s intervals reaching more than 2000 vertical levels, while the ECMWF ERA5 was interpolated to 37 pressure levels. To minimize the impact of different vertical resolutions, RO and ECMWF temperature profiles and the GRUAN temperature and temperature correction factors were all linearly interpolated (in the logarithmic pressure coordinate) to seven mandatory vertical pressure levels (200, 150, 100, 70, 50, 30, and 20 hPa) in the upper troposphere and lower stratosphere in order to quantify the temperature biases for RS41 and RS92 and to evaluate the GRUAN correction method.
3.2. Collocation Pair Extraction
To account for the possible temporal and spatial mismatches between the RO and GRUAN radiosonde data, the RO data within 3 h and 250 km of the GRUAN radiosonde data were collected as collocated pairs for different radiosonde instrument types [36].
As for ERA5 and GRUAN radiosonde collocation pairs, the radiosonde profiles were treated as vertical and instantaneous and we obtained the corresponding ERA5 temperature profile by linear interpolating ERA5 data to the time and location of GRUAN radiosonde data based on the assumption that ERA5 uncertainties were relatively constant/homogenous.
3.3. Temperature Difference Calculation
After the report time, latitude, longitude, and temperature were extracted and interpolated into the mandatory pressure levels, the GRUAN GDP.2 temperature before GRUAN correction (hereafter referred to as GDP.2 original temperature) for a collocation pair at a mandatory pressure level can be calculated using the following equation:
where is the GRUAN-corrected temperature at a pressure level for RS92 and RS41 GDP.2 products (hereafter referred to as GDP.2-corrected temperature), is the GRUAN correction factor for GDP.2 products at a mandatory pressure level , and is the index for all the matched pairs. Both and are provided in the GRUAN GDP.2 product files.
Then, the average temperature differences between GRUAN radiosonde products, through dual launch between RS41 and RS92 at a pressure level , were computed using the following equations:
where are the temperatures of EDT.1 products for RS41 and RS92; and are the original and corrected temperatures, respectively, of GDP.2 products for RS41 and RS92; and and are the temperature biases for EDT.1 and original and corrected GDP.2 products in the dual launch, respectively.
The average temperature differences between the GRUAN radiosonde measurements and reference data (i.e., RO and ECMWF) at the same pressure level, , were computed using the equations:
where is the reference temperature from RO and ECMWF profiles; and and are the temperature biases for EDT.1 and original and corrected GDP.2 products, respectively, using the reference data sources (i.e., RO and ECMWF).
Consequently, the temperature difference between EDT.1 and GDP.2 original and corrected GRUAN products could be calculated using the double difference through the RO and ECMWF profiles. In addition, the 1-sigma standard deviation of the mean temperature difference was calculated in order to quantitatively estimate the associated uncertainty and the dispersion of a data set, relative to its mean.
4. Comparison Results and Analysis between GRUAN RS41 and RS92
4.1. Direct Comparison between GRUAN RS41 and RS92 Using Dual Launch Data
For the purpose of the RS92–RS41 transition and performance comparison between the two instruments, GRUAN sites performed dual launch campaigns, in which RS41 and RS92 instruments were launched simultaneously. To quantify a possible residual radiation impact on Vaisala RS92 and RS41 measurements in the lower stratosphere, which may vary with the solar zenith angle (SZA), the mean temperature differences from 200 to 20 hPa for daytime and night-time were compared separately. The result for all SZAs was also computed, using simple averages of all collocation pairs, to understand the overall consistency between two instruments.
4.1.1. Analysis of Difference between RS41.EDT.1 and RS92.EDT.1
To consider a possible SZA dependence of temperature bias due to residual radiation error for Vaisala instruments, both daytime (SZA < 80°) and night-time (SZA > 100°) temperature differences were calculated. Figure 2a–c shows temperature differences between RS41.EDT.1 and RS92.EDT.1 at the 200–20 hPa pressure levels for all-day, daytime only, and night-time only, respectively. The red curves in each panel are the temperature differences at different pressure levels, the red dashed curves are the associated standard deviation, and the blue curves are the sample numbers for each mandatory pressure level. The corresponding results are listed in Table 2.
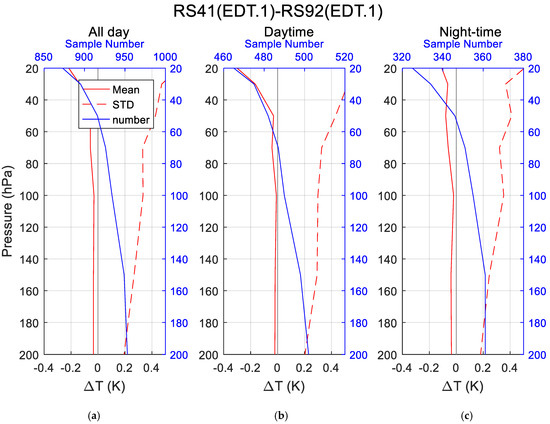
Figure 2.
Comparisons of temperature between RS41.EDT.1 and RS92.EDT.1 for all-day (a), daytime only (b), and nighttime only (c). The dark lines are the reference lines. The red solid and dashed lines are the mean and standard deviation of the EDT.1 temperature difference, respectively, while the blue lines are the sample numbers.
Table 2.
Mean and 1-sigma standard deviation of temperature differences (K) between RS41.EDT.1 and RS92.EDT.1 at 7 mandatory pressure levels for all-day, daytime, and night-time.
It can be seen from Figure 2 that in the GRUAN Vaisala data product (EDT.1) comparison, the biases at most pressure levels were less than 0.1 K (except for the 20 and 30 hPa levels), and RS92.EDT.1 was consistently warmer than RS41.EDT.1 for all SZAs and all pressure levels, increasing with altitude in general. The temperature bias increased quickly when the pressure was above 50 hPa. Quantitatively, the maximum reached 0.217 K, 0.300 K, and 0.107 K for all-day, daytime, and night-time, respectively, at 20 hPa.
Compared with night-time, the differences during daytime at pressure levels above 50 hPa showed larger differences, where the maximum difference reached ~0.3 K at 20 hPa, which indicated residual solar radiation error between two instruments, consistent with a previous study comparing the Vaisala RS41 and RS92 [6,7,37]. Therefore, the Vaisala data products had a ~0.2 K different performance at pressure levels higher than 50 hPa, which may have been due to the differences in the Vaisala radiation correction look-up table, or to the differences in instrumental designs, as the solar radiation heating impact on RS41 and RS92 is different, especially for the 30 and 20 hPa levels, as was mentioned in Section 2.1.
4.1.2. Analysis of Difference between RS41.GDP.2 and RS92.GDP.2
As mentioned above, GRUAN has produced a latest data set version for both RS92 and RS41, which is called GDP.2. Unlike the EDT.1 version which does not reference metadata but only the data in the sounding data file, for GDP.2, both metadata and sounding data have been processed, using a GRUAN-provided software tool, and corrected for systematic errors in radiosonde measurements. In this section, the consistency of the GDP.2 version temperature (original) between RS92 and RS41 is assessed for the dual launch, as well as evaluating the GRUAN-corrected temperature.
Figure 3a–c shows the original and corrected temperature comparison results between RS41.GDP.2 and RS92.GDP.2 for the seven mandatory levels in the range of 200–20 hPa for all-day, daytime only, and night-time only, respectively. Table 3 lists the statistical results of RS41.GDP.2 and RS92.GDP.2. Most notably, there was no obvious temperature difference between RS41.GDP.2 and RS92.GDP.2 at different SZAs. Generally, the GRUAN original and corrected temperature differences were no larger than 0.06 K for different SZAs, and there was no pressure- or SZA-dependence, indicating that the GRUAN GDP.2 temperature products agreed with each other very well, with or without GRUAN correction, consistent with previous research [37]. Compared with the Vaisala-processed data product (EDT.1), the difference between GRUAN data products was smaller, especially at pressure levels above 50 hPa, indicating that the RS92 and RS41 GRUAN-processed datasets were more consistent than Vaisala-processed data products. In addition, the GRUAN-corrected data product showed a < 0.01 K difference from the GRUAN GDP.2 original data product at night and a < 0.03 K difference during the daytime, indicating that the GRUAN correction method almost did not change the difference between RS41 and RS92 during daytime or night-time. As both RS92.GDP.2 and RS41.GDP.2 were corrected using the same GRUAN correction algorithm, it is not a surprise that, for most pressure levels, the differences after correction were not improved compared to the results before correction, shown in Table 3. This also means that the GRUAN correction method did not affect the consistency between RS41.GDP.2 and RS91.GDP.2.
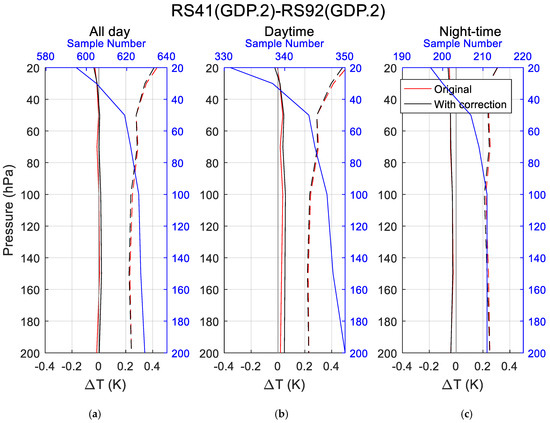
Figure 3.
Comparisons of temperature between RS92.GDP.2 and RS41.GDP.2 for all-day (a), daytime only (b), and night-time only (c). The dark lines are the reference lines. The red solid and dashed lines are the mean and standard deviation of the GDP.2 original temperature difference, respectively; the black solid and dashed lines are the mean and standard deviation of the GDP.2-corrected temperature difference, respectively, and the blue lines are the sample numbers.
Table 3.
Mean and standard deviation of temperature differences (K) between RS92.GDP.2 and RS41.GDP.2 at seven mandatory pressure levels for all-day, daytime, and night-time, before and after correction.
The dual launch comparison results show that the relative temperature biases between GRUAN RS41 and RS92 reached 0.3 K and 0.06 K for the EDT.1 and GPS.2 datasets, respectively. To understand the absolute accuracy of RS41 and RS92, as well as where the relative bias originated from and the performance of the correction algorithm, an independent validation method was proposed, as detailed in the following two sections, to evaluate the absolute temperature bias of RS41 and RS92 separately, using temperature profiles extracted from RO data and ECMWF. In addition, the temperature biases of RS41 and RS92 were evaluated through the RO and ECMWF data using double difference. The performance of the GRUAN correction method was also evaluated.
4.2. Comparison between RS41.EDT.1 and RS92.EDT.1 Using Double Difference
4.2.1. Comparison between RS41.EDT.1 and RS92.EDT.1 through RO
RO data from 2014 to 2020 were used as one of the standards, in order to independently evaluate the absolute accuracy of RS41 and RS92 separately and the consistency of RS41 and RS92 using the double difference method. Collocation pair extraction criteria of a time difference within 3 h and a distance difference within 250 km were used. This sub-section focuses on the EDT.1 comparison between RS41 and RS92.
Figure 4a,b shows the temperature accuracies of RS92.EDT.1 and RS41.EDT.1, respectively, compared to RO for all-day, daytime only, and night-time only at the seven mandatory levels in the range of 200–20 hPa. Table 4 lists the corresponding results.
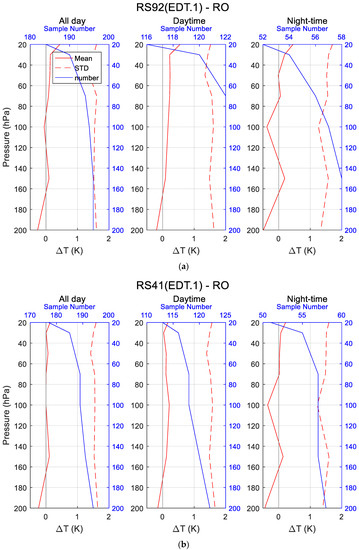
Figure 4.
Comparisons of temperature between RS92.EDT.1 (a) and RS41.EDT.1 (b) vs. RO.
Table 4.
Mean and standard deviation of temperature biases between EDT.1 and RO at seven mandatory pressure levels for all-day, daytime, and night-time.
Generally, the patterns of the temperature difference profile for and were similar, where both RS92.EDT.1 and RS41.EDT.1 showed an overall warm bias, compared with RO, in general. Both and had the largest differences at 20 hPa, which reached 0.62 K and 0.27 K during daytime, respectively. Another notable feature was the zigzag of the difference curves during night-time, most likely due to the inadequate number of samples.
From Table 4, compared with RO, RS92.EDT.1 showed a warm bias that reached 0.62 K. In addition, SZA-dependence can be noticed, consistent with previous research [38,39]. As for the RS41.EDT.1-RO comparison, a warm bias can also be noticed, which was no larger than 0.27 K for all SZAs. Therefore, the dual launch bias between RS92.EDT.1 and RS41.EDT.1 in Section 4.1.1 was found to have mainly originated from RS92.EDT.1, especially for pressure levels above 100 hPa, using RO as the standard.
4.2.2. Comparison between RS92.EDT.1 and RS41.EDT.1 through ECMWF
ECMWF ERA5 data from 2014 to 2020 were used as another standard in order to independently evaluate the absolute accuracies of RS41 and RS92 separately, as well as the consistency of RS41 and RS92 using the double difference method.
Similar to the comparison results with RO, the patterns (not shown) of the temperature difference profile for and were comparable, where both RS92.EDT.1 and RS41.EDT.1 had an overall warm bias, compared to ECMWF, in general. The largest differences of and reached 0.446 K and 0.204 K during daytime, respectively. SZA-dependence can also be noticed for RS92.EDT.1 and RS41.EDT.1 at almost all pressure levels (except at 200 hPa for RS92.EDT.1 and at 100 and 200 hPa for RS41.EDT.1) in the all-day situation. In addition, comparison of the ECMWF ERA5 and RS92.EDT.1 product showed larger differences than that for the RS41.EDT.1 product, in general. The double differences are discussed in the following sub-section.
4.2.3. Double Differences between RS92.EDT.1 and RS41.EDT.1
We evaluated the RS92.EDT.1 and RS41.EDT.1 products through RO and ECMWF separately. From the results, we can safely say that, in general, RS92.EDT.1 showed an overall larger bias than RS41.EDT.1. To confirm the difference between RS92.EDT.1 and RS41.EDT.1, as evaluated in Section 4.1.1 using the dual launch data, the temperature consistency between RS41.EDT.1 and RS92.EDT.1 was estimated using vertical temperature biases between the two radiosonde datasets, RO, and ECMWF (i.e., double differences).
To show the individual differences between the two EDT.1 products and RO and ECMWF more visually, and to visually show the differences between the two EDT.1 products through double difference, first, the results of are plotted in Figure 5 for all-day, daytime, and night-time periods. The corresponding results are listed in Table 4. Note that, as a ~1 K standard deviation would widen the coordinate interval of the y-axis making it difficult to distinguish the difference between the mean biases, only the bias means are plotted in Figure 5.
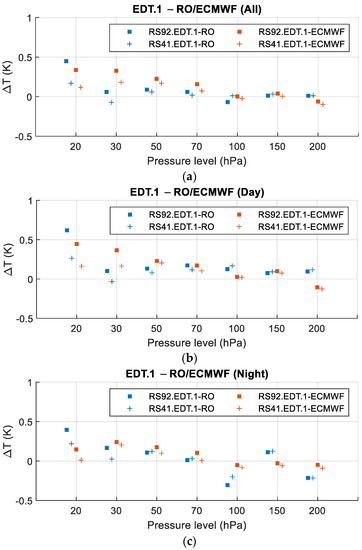
Figure 5.
Results of for all-day (a), daytime (b), and night-time (c). The blue and red squares indicate and , respectively, while the blue and red crosses indicate and , respectively.
From the perspective of RO and ECMWF, it can be seen that the overall and daytime differences between and were pressure level-dependent: the differences were larger than 0.1 K for the pressure levels above 70 hPa, while the differences were comparable for the pressures level lower than 70 hPa. For the night-time comparison, the differences between were mixed, one possible reason for this is the lower sample number of EDT.1 and RO collocation pairs at night. Despite the uneven comparison results during night-time, the comparison results between the EDT.1 products and the two references (i.e., RO and ECMWF) were generally consistent.
On the other hand, from the perspective of the two EDT.1 products, it can be seen that, compared to , was larger for all-day, daytime, and night-time at almost all pressure levels, indicating that the RS92.EDT.1 product had a 0.1–0.2 K warm bias at pressure levels above 70 hPa. This also confirms that the bias between the RS92.EDT.1 and RS41.EDT.1 products, as stated in Section 4.1.1, mainly originated from the RS92.EDT.1 product.
The double differences between the two EDT.1 products through RO and ECMWF were then evaluated. Figure 6 shows the difference between RS92.EDT.1 and RS41.EDT.1 products using the GRUAN dual launch, through double difference using RO and ECMWF, for all-day (upper), daytime (middle), and night-time (lower). Table 5 lists the corresponding results. Note that the dual launch difference results came from Section 4.1.1. Table 2 is also plotted in Figure 6, for Ease of Comparison.
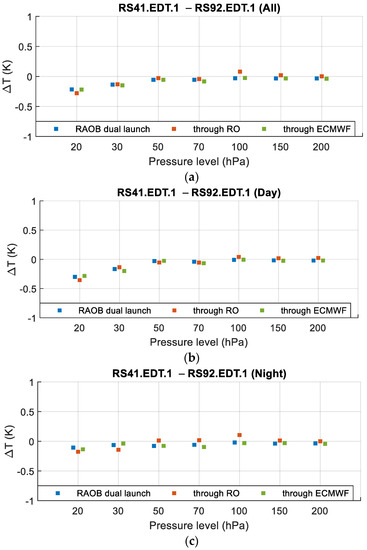
Figure 6.
Double differences between RS92.EDT.1 and RS41.EDT.1 products using GRUAN dual launch, and double difference through RO and ECMWF for all-day (a), daytime (b), and night-time (c). Blue, red, and green indicate the dual launch difference and double differences through RO and ECMWF, respectively.
Table 5.
Mean temperature differences (K) between RS41.EDT.1 and RS92.EDT.1 using dual launch and double difference through RO or ECMWF at the seven mandatory pressure levels.
From Figure 6 and Table 5, it can be seen that, generally, the determined from the dual launch and double difference through RO and ECMWF were consistent. The differences between obtained in these three ways were no larger than 0.136 K—that is, the difference between through RO and through ECMWF during night-time at 100 hPa—indicating that these three ways could efficiently estimate the temperature difference between RS41 and RS92 products.
Secondly, the largest temperature differences between RS92.EDT.1 and RS41.EDT.1 obtained in these three ways all occurred at 20 hPa during the daytime (i.e., −0.300, 0.355, and −0.283 K using dual launch, RO, and ECMWF, respectively), and it can be seen that there was a larger bias during daytime than that during night-time at pressure levels above 50 hPa, indicating that the solar radiation error correction look-up tables (LUTs) for RS41 and RS92 products provided by Vaisala corrected the two products at different levels. Given the separate comparison results between EDT.1 and RO or ECMWF, there was a larger residual solar radiation error in the RS92 product.
Therefore, considering the separate comparison results with RO and ECMWF, RS92.EDT.1 showed an absolute warmer bias than RS41.EDT.1 for most pressure levels. The dual launch and double difference through RO and ECMWF methods confirmed that the RS92.EDT.1 and RS41.EDT.1 had temperature bias mainly in the daytime, indicating that the Vaisala LUT does not fully correct the RS92.EDT.1 for daytime solar radiation error.
4.3. Comparison between RS92.GDP.2 and RS41.GDP.2 Using Double Difference
4.3.1. Comparison between RS92.GDP.2 and RS41.GDP.2 through RO
In the same way as for the EDT.1 version data, the accuracy of the GRUAN GDP.2 version data were separately validated with RO data. The same collocation pair extraction criteria between radiosonde and RO data were used. Figure 7a,b show the absolute temperature biases between RS92.GDP.2 and RS41.GDP.2, respectively, and RO for all-time, daytime only, and night-time only. Table 6 lists the corresponding results.
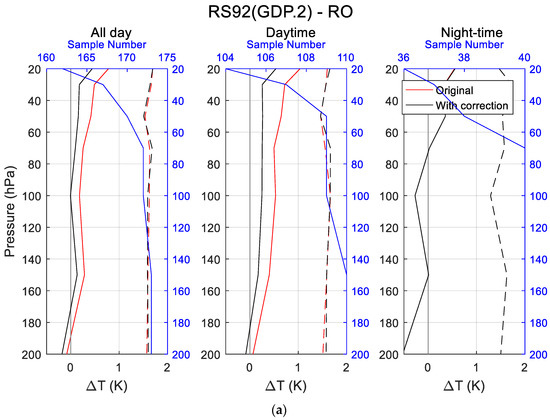
Figure 7.
Comparisons of temperature between RS92.GDP.2 (a) and RS41.GDP.2 (b) vs. RO.
Table 6.
Mean and standard deviation of absolute temperature biases between GDP.2 and RO at the seven mandatory pressure levels for all-day, daytime, and night-time, before and after correction.
Generally, the patterns of the original and corrected temperature difference profiles for and were similar, where both RS92.GDP.2 and RS41.GDP.2 showed an overall warm bias, compared with RO, in general. Both and had the largest difference at 20 hPa, reaching 1.108 K and 1.117 K, respectively, for the original GDP.2 products during daytime, and 0.624 K and 0.602 K, respectively, for the GRUAN-corrected GDP.2 products during daytime. Another notable phenomenon was the zigzag of the difference curves during night-time, most likely due to the lower number of samples.
For the separate comparison of GDP.2 products with RO, the absolute temperature biases of for daytime, before and after correction, constantly showed a warm bias—from ~0.31 K to 1.11 K and ~0.15 K to ~0.65 K, respectively—with pressure decreasing. The absolute temperature biases of for daytime, before and after correction, constantly showed a warm bias—~0.30 K to 1.12 K and ~0.21 K to ~0.60 K, respectively—with pressure decreasing, indicating that the solar radiation effect was significant and affected the accuracy of the radiosonde instrument obviously. The smaller night-time bias confirmed this phenomenon.
Compared with the comparison results of the , the showed significantly smaller biases during daytime and showed no obvious correction during night-time, which confirmed that the GRUAN correction method has no correction for the GDP.2 products during night-time and also indicates that the GRUAN correction method can efficiently correct the solar radiation error, at some levels.
4.3.2. Comparison between RS92.GDP.2 and RS41.GDP.2 through ECMWF
Similar to the comparison results with RO, generally, the patterns (not shown) of the original and corrected temperature difference profiles for and were similar, where both RS92.GDP.2 and RS41.GDP.2 had an overall warm bias, compared with ECMWF, in general. Both and had the largest difference at 20 hPa during daytime, which reached 1.057 K and 1.061 K, respectively, for the original GDP.2 products, and reached 0.526 K and 0.507 K, respectively, for the GRUAN-corrected GDP.2 products. Note that, in the ECMWF comparison, the zigzag of the difference curves during night-time was not noticeable, most likely due to the higher number of samples.
For the separate comparison of GDP.2 products with ECMWF, the absolute temperature biases of for daytime before and after correction shows the solar radiation effect was significant and obviously affected the accuracy of the radiosonde instrument. The smaller night-time bias confirmed this phenomenon.
Similar to the comparison results with RO, compared with comparison results of , the was reduced significantly during daytime, and showed no obvious correction during night-time, which confirmed that the GRUAN correction method has no correction for the GDP.2 products during night-time, and also indicates that the GRUAN correction method can efficiently correct the solar radiation error, at some levels.
4.3.3. Double Differences between RS92.GDP.2 and RS41.GDP.2
We evaluated the RS92.GDP.2 and RS41.GDP.2 products through RO and ECMWF separately, and similar comparison results were noticed. To confirm the difference between RS92.GDP.2 and RS41.GDP.2, as evaluated using the dual launch data in Section 4.1.2, the temperature consistency between RS41.GDP.2 and RS92.GDP.2 was estimated using temperature biases between the two radiosonde datasets, RO and ECMWF, through double difference.
Firstly, the results of and are plotted in Figure 8 for all-day, daytime, and night-time. The corresponding results are listed in Table 6. Note that, as a ~1 K standard deviation would widen the coordinate interval of the y-axis, making it difficult to distinguish the difference between the mean biases, only the bias means are plotted in Figure 8.
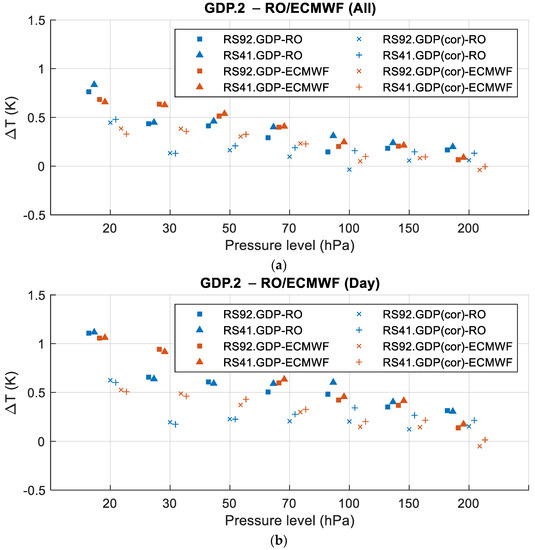
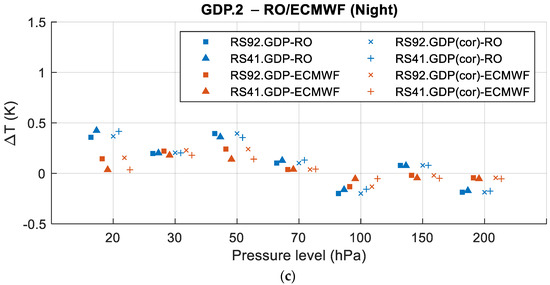
Figure 8.
Results of for all-day (a), daytime (b), and night-time (c). The blue and red squares indicate and respectively, and the blue and red ‘×’ indicate and , respectively. The blue and red triangles indicate and , respectively, and the blue and red crosses indicate and , respectively.
From the perspective of RO and ECMWF, it can be seen that the daytime differences between and were pressure level-dependent: the differences were more than 0.2 K for the pressure levels above 70 hPa, while the differences were comparable for the pressure levels lower than 70 hPa. In the night-time comparison, the differences between and were more consistent. The comparison results between the GDP.2 products and the two references (i.e., RO and ECMWF) were consistent in general.
Secondly, from the perspective of the two GDP.2 products, it can be seen that the and results were comparable for all-day, daytime, and night-time at almost all the pressure levels, indicating that there was no obvious difference between the GRUAN-processed RS92.GDP.2 and RS41.GDP.2 products in the range of 200–20 hPa.
Thirdly, from the perspective of the original and GRUAN-corrected products, it was confirmed that the GRUAN correction method corrected the solar radiation error effectively during daytime and had no obvious correction during night-time.
Then, the double differences between the two GDP.2 products through RO and ECMWF were evaluated. Since the values are so close to zero, the relevant figure and table are not shown in the paper. Considering the separate comparison results with RO and ECMWF, both RS92.GDP.2 and RS41.GDP.2 showed absolute warm biases for most pressure levels, and the GRUAN correction method could correct the solar radiation error during daytime efficiently. The results also indicate that there was no SZA dependence for the temperature differences between RS92.GDP.2 and RS41.GDP.2 obtained in these three ways and these three ways can be used to efficiently estimate the temperature difference between the RS41 and RS92 products.
5. GRUAN Correction Factor Evaluation
In the previous section, it was found that the solar radiation error of the two instrument types of Vaisala data product were corrected at different levels when using the manufacturer’s LUTs. The GRUAN data products, on the other hand, were corrected for each individual temperature profile and showed good agreement with each other. To understand how the GRUAN correction method corrects the radiosonde data, the GRUAN correction factor dependencies are evaluated in this section.
5.1. SZA-Dependency Correction Factor for GRUAN Products
To quantify the efficiency of the GRUAN correction method and its SZA dependence, which was noticed in Section 4.3, the temperature biases between GDP.2 and RO (Figure 9) and ECMWF (Figure 10) for all mandatory levels in 15° SZA bins, before and after using the GRUAN correction method, were binned using all the GDP.2 reference pairs from 2014 to 2020. The error bar stands for the standard with regard to pair number, and the blue line is the pair number for SZA bins. Note that the GDP.2 and RO pair numbers at night were small, due to the limited number of collocation pairs between radiosonde and RO datasets; as such, they show a relatively large error bars. Given that the number of GDP.2 and ECMWF pairs was larger than the number of GDP.2 and RO samples, the GDP.2 and ECMWF error bar was smaller than that of GDP.2 and RO.
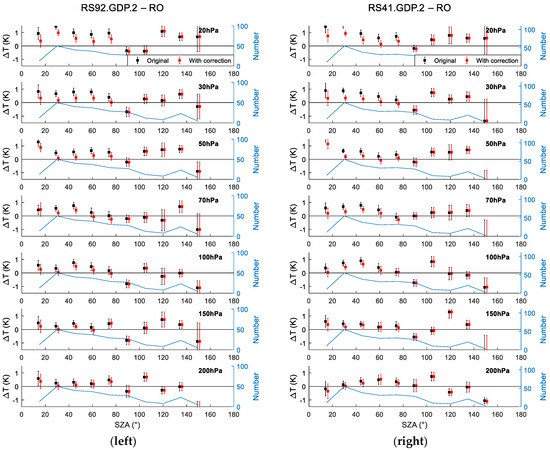
Figure 9.
Temperature biases of RS92.GDP.2 (left)/ R41.GDP.2 (right)-RO pairs before and after correction at seven mandatory levels, with SZA varying from 0° to 180°. The red and black error bars are the temperature differences between RS92.GDP.2 and R41.GDP.2, respectively, and RO. The blue lines are the corresponding sample numbers at each pressure level and the black lines are the reference lines.
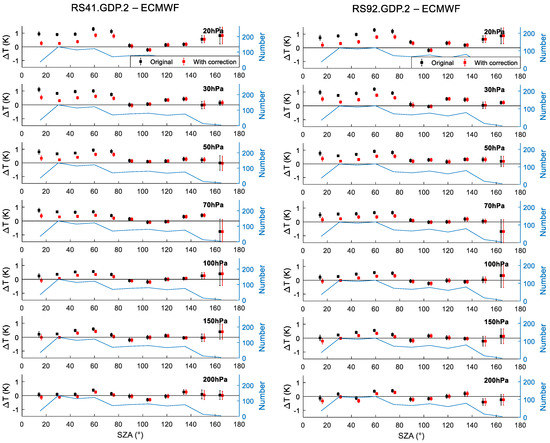
Figure 10.
Temperature biases of RS92.GDP.2 (left)/ R41.GDP.2 (right)-RO pairs before and after correction at seven mandatory levels, with SZA varying from 0° to 180°. The red and black error bars are the temperature differences between RS92.GDP.2 and R41.GDP.2, respectively, and ECMWF. The blue lines are the corresponding sample numbers at each pressure level and the black lines are the reference lines.
It can be seen that, for both GDP.2 and RO and ECMWF comparison, there was almost no difference between and at night (SZA > 100°). Here, indicates RO or ECMWF. The temperature biases for daytime showed significant decreases and were closer to the zero line in the figures after correction, especially for the pressure levels above 70 hPa. This means that the GRUAN correction method is SZA-dependent, and so are the daytime temperature biases before correction. The mitigated daytime SZA dependence after correction indicates that the GRUAN correction method efficiently corrected errors due to SZA variation and solar radiation. This result also verifies that the GRUAN temperature processing can also correct the daytime radiation error and removes spikes due to patches of warm air coming off the sensor housing and the balloon [2].
5.2. Pressure Level-Dependence Correction Factor for GRUAN Products
In addition, to consider the possible pressure level dependence of the temperature correction factor for GRUAN processing, which can be noticed in Figure 7, Figure 9 and Figure 10, the relationships between the GRUAN correction factor and pressure levels are plotted in Figure 11a,b for RS92.GDP.2 and RS41.GDP.2, respectively. The error bar stands for the standard error with respect to the data number. For the GRUAN correction factors of both products, the purple (SZA between 90 and 120°), green (SZA between 120 and 150°), and light blue (SZA between 150–180°) lines confirm that there was almost no correction during night-time. Meanwhile, there was an obvious tendency of increase in temperature correction factor with a decrease in pressure level during daytime. It can be seen that the absolute correction levels for RS92.GDP.2 and RS41.GDP.2 reached ~0.6 K and ~0.7 K, respectively, at 20 hPa, which confirms that the GRUAN correction method can correct the solar radiation error. One thing that can be noticed is that the correction levels for RS41 and RS92 were slightly different, which confirms the results from double differences between RS92.GDP.2 and RS41.GDP.2: the GRUAN correction method corrects slightly more of the warm bias of RS41 during the daytime, compared to RS92. One possible explanation for the larger (but still small) difference at higher pressure levels is an increased solar heating impact from direct solar radiation, which is accounted for in the GRUAN measurements and correction algorithms.
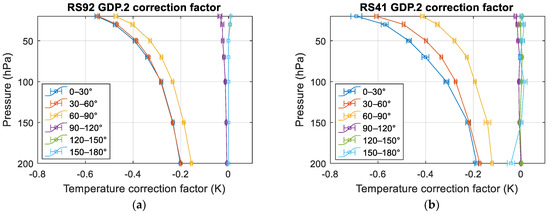
Figure 11.
Relationship between GRUAN correction factor for RS92.GDP.2 (a) and RS41.GDP.2 (b) and pressure levels.
6. Discussion and Conclusions
In this study, the accuracies of upper troposphere and lower stratosphere (200–20 hPa) temperature observations of two GRUAN Vaisala RS92 data set versions (EDT.1 and GDP.2) versus two RS41 data set versions (EDT.1 and GDP.2) were evaluated. This was accomplished in two different ways, including direct comparison through dual launch campaigns, and using RO and ECMWF ERA5 data temperature products as a reference to conduct a double difference comparison. To investigate the origin of the temperature biases between RS41 and RS92 the RO and ERA5 data were used as standards to evaluate the two types of radiosonde instruments separately. Given that the GRUAN provides its own correction method for GDP datasets, the performance of this correction method was also evaluated, through comparison, and its dependences were finally examined. We reached the following conclusions:
First, after comparing the two Vaisala products (i.e., RS41.EDT.1 and RS92.EDT.1) with RO and ERA5, it was found that RS92.EDT.1 mainly had a larger warm bias (reaching 0.619 K), compared to RS41.EDT.1 (0.264 K), during daytime. As for the comparison of RS41.EDT.1 and RS92.EDT.1, the results of the dual launch and double difference methods consistently showed a warm bias of > 0.1 K during daytime at pressures above 50 hPa for RS92.EDT.1 compared to RS41.EDT.1, and no obvious bias during night-time, possibly due to the different designs and specifications of the two instruments and to the different manufacturer (Vaisala) correction levels for the two instrument products.
Second, on one hand, the two original GRUAN-processed products (RS41.GDP.2 and RS92.GDP.2) showed a similar warm bias during daytime (reaching >1 K) compared with RO and ERA5, indicating that the original GRUAN-processed products contained solar radiation errors. In the comparison of the original GDP.2 products, the results of the dual launch and double difference methods consistently showed that there was no obvious bias (<0.05 K) at all pressure levels between RS41.GDP.2 and RS92.GDP.2. On the other hand, after the GRUAN correction method was applied, the two corrected GRUAN-processed products still showed a similar warm bias (<0.53 K) during daytime, but the bias was less than that in the original GDP.2 separation comparison (reaching >1 K), compared with RO and ERA5, thus indicating that the GRUAN correction method efficiently corrected the solar radiation error (to ~0.5 K). For the comparison of the corrected GDP.2, the results of the dual launch and double difference methods consistently showed that there was no obvious bias (<0.06 K) at all pressure levels between RS41.GDP.2 and RS92.GDP.2. One thing that can be noted is that the GRUAN correction method corrected slightly more of the warm bias of RS41 (~0.1 K at higher pressure levels) during daytime, compared to that of RS92.
Third, the performance and dependences of the GRUAN correction algorithm were evaluated. The results showed that the algorithm corrected the daytime radiation error and removed spikes due to patches of warm air coming off the sensor housing and the balloon efficiently. This algorithm is SZA-dependent: it corrects for the daytime solar radiation error but not for the night-time temperature. The larger the SZA, the greater the correction. It is also pressure-dependent: the higher the pressure, the greater the correction. Finally, this algorithm is also instrument type-dependent: it corrected the RS92 and RS41 by ~0.2–0.5 K and ~0.2–0.7 K, respectively, during the daytime.
Author Contributions
Conceptualization, X.J., X.S. and B.Z.; data curation, X.J. and T.-C.L.; formal analysis, X.J. and T.-C.L.; funding acquisition, X.S. and B.Z.; investigation, X.J. and X.S.; methodology, X.J.; project administration, X.S.; resources, X.S.; software, X.J.; supervision, X.S.; validation, X.J. and T.-C.L.; visualization, X.J.; writing—original draft, X.J.; writing—review and editing, X.J., X.S. and B.Z. All authors have read and agreed to the published version of the manuscript.
Funding
This research was funded by NOAA grant (Cooperative Institute for Satellite Earth System Studies-CISESS) at the University of Maryland/ESSIC, grant number NA19NES4320002”.
Institutional Review Board Statement
Not applicable.
Informed Consent Statement
Not applicable.
Data Availability Statement
This data can be found: ftp://data.gruan.info/ (accessed on 29 June 2021). https://cds.climate.copernicus.eu/cdsapp#!/dataset/reanalysis-era5-pressure-levels?tab=form (accessed on 29 June 2021). http://cdaac-www.cosmic.ucar.edu/cdaac/products.html (accessed on 29 June 2021).
Conflicts of Interest
The authors declare no conflict of interest.
References
- Vaisala. CAL4 Calibration Machine Traceability and Uncertainty; Technical Document DOC210645; Vaisala: Vantaa, Finland, 2002. [Google Scholar]
- Dirksen, R.J.; Sommer, M.; Immler, F.J.; Hurst, D.F.; Kivi, R.; Vömel, H. Reference quality upper-air measurements: GRUAN data processing for the Vaisala RS92 radiosonde. Atmos. Meas. Tech. 2014, 7, 4463–4490. [Google Scholar] [CrossRef]
- Immler, F.J.; Dykema, J.; Gardiner, T.; Whiteman, D.N.; Thorne, P.W.; Vömel, H. Reference Quality Upper-Air Measurements: Guidance for developing GRUAN data products. Atmos. Meas. Tech. 2010, 3, 1217–1231. [Google Scholar] [CrossRef]
- Sommer, M.; Dirksen, R.; Rohden, C.V. Brief Description of the Rs92 Gruan Data Product (Rs92-Gdp); GRUAN Lead Centre: Lindenberg, Germany, 2016. [Google Scholar]
- Jauhiainen, H.; Lentonen, J.; Survo, P.; Lehtinen, R.; Pietari, T. The implications of Vaisala’s new radiosonde RS41 on improved in-situ observations for meteorological applications. In Proceedings of the AMS Annual Meeting, Atlanta, GA, USA, 2–6 February 2014. [Google Scholar]
- Kawai, Y.; Katsumata, M.; Oshima, K.; Hori, M.E.; Inoue, J. Comparison of Vaisala radiosondes RS41 and RS92 launched over the oceans from the Arctic to the tropics. Atmos. Meas. Tech. 2017, 10, 2485–2498. [Google Scholar] [CrossRef]
- Sun, B.; Reale, T.; Schroeder, S.; Pettey, M.; Smith, R. On the Accuracy of Vaisala RS41 versus RS92 Upper-Air Temperature Observations. J. Atmos. Ocean. Technol. 2019, 36, 635–653. [Google Scholar] [CrossRef]
- Jauhiainen, H.; Survo, P.; Lehtinen, R.; Lentonen, J. Radiosonde RS41 and RS92 key differences and comparison test results in different locations and climates. In Proceedings of the TECO-2014, WMO Technical Conference on Meteorological and Environmental Instruments and Methods of Observations, Saint Petersburg, Russia, 7–9 July 2014. [Google Scholar]
- Jensen, M.P.; Holdridge, D.J.; Survo, P.; Lehtinen, R.; Baxter, S.; Toto, T.; Johnson, K.L. Comparison of Vaisala radiosondes RS41 and RS92 at the ARM Southern Great Plains site. Atmos. Meas. Tech. 2016, 9, 3115–3129. [Google Scholar] [CrossRef]
- Ingleby, B. An Assessment of Different Radiosonde Types 2015/2016; European Centre for Medium Range Weather Forecasts: Reading, UK, 2017. [Google Scholar]
- Miloshevich, L.M.; Vömel, H.; Whiteman, D.N.; Leblanc, T. Accuracy assessment and correction of Vaisala RS92 radiosonde water vapor measurements. J. Geophys. Res. Space Phys. 2009, 114. [Google Scholar] [CrossRef]
- Edwards, D.; Anderson, G.; Oakley, T.; Gault, P. Met Office Intercomparison of Vaisala RS92 and RS41 Radiosondes. Technical Reports. UKMO. 2008. Available online: https://www.readkong.com/page/met-office-intercomparison-of-vaisala-rs92-and-rs41-5817991 (accessed on 29 July 2020).
- Vaisala. Vaisala Radiosonde RS92 Performance in the WMO Intercomparison of High Quality Radiosonde Systems. Vaisala White Paper May 2013; Vaisala: Vantaa, Finland, 2013. [Google Scholar]
- Vaisala. Vaisala Radiosonde RS41 Measurement Performance. Vaisala White Paper; Vaisala: Vantaa, Finland, 2013. [Google Scholar]
- GRUAN Communication Platform. Available online: https://gruan.wordpress.com/2011/05/26/software-version-missing-as-meta-data/ (accessed on 15 June 2021).
- Luers, J.K. Estimating the Temperature Error of the Radiosonde Rod Thermistor under Different Environments. J. Atmos. Ocean. Technol. 1990, 7, 882–895. [Google Scholar] [CrossRef]
- Kuo, Y.-H.; Wee, T.-K.; Sokolovskiy, S.; Rocken, C.; Schreiner, W.; Hunt, D.; Anthes, R. Inversion and Error Estimation of GPS Radio Occultation Data. J. Meteorol. Soc. Jpn. 2004, 82, 507–531. [Google Scholar] [CrossRef]
- Ho, S.-P.; Goldberg, M.; Kuo, Y.-H.; Zou, C.-Z.; Shiau, W. Calibration of Temperature in the Lower Stratosphere from Microwave Measurements Using COSMIC Radio Occultation Data: Preliminary Results. Terr. Atmos. Ocean. Sci. 2009, 20, 87. [Google Scholar] [CrossRef]
- Yunck, T.P.; Liu, C.-H.; Ware, R. A History of GPS Sounding. TAO 1999, 11, 1–20. [Google Scholar] [CrossRef]
- Steiner, A.K.; Kirchengast, G.; Ladreiter, H.P. Inversion, error analysis, and validation of GPS/MET occultation data. In Annales Geophysicae; Springer: Berlin, Germany, 1998; Volume 17, pp. 122–138. [Google Scholar]
- Hajj, G.A.; Lee, L.C.; Pi, X.; Romans, L.J.; Schreiner, W.S.; Straus, P.R.; Wang, C. COSMIC GPS Ionospheric Sensing and Space Weather. Terr. Atmos. Ocean. Sci. 2000, 11, 235. [Google Scholar] [CrossRef]
- Kursinski, E.R.; Hajj, G.A.; Bertiger, W.I.; Leroy, S.S.; Meehan, T.K.; Romans, L.J.; Schofield, J.T.; Nagatani, R.N. Initial results of radio occultation observations of Earth’s atmosphere using the Global Positioning System. Science 1996, 271, 1107–1110. [Google Scholar] [CrossRef]
- Wang, B.R.; Liu, X.Y.; Wang, J.K. Assessment of COSMIC radio occultation retrieval product using global radiosonde data. Atmos. Meas. Tech. 2013, 6, 1073–1083. [Google Scholar] [CrossRef]
- Anthes, R.A.; Bernhardt, P.A.; Chen, Y.; Cucurull, L.; Dymond, K.F.; Ector, D.; Healy, S.B.; Ho, S.P.; Hunt, D.C.; Kuo, Y.H.; et al. The COSMIC/FORMOSAT-3 mission: Early results. Bull. Am. Meteorol. Soc. 2008, 89, 313–334. [Google Scholar] [CrossRef]
- Ho, S.-P.; Hunt, D.; Steiner, A.; Mannucci, A.J.; Kirchengast, G.; Gleisner, H.; Heise, S.; Von Engeln, A.; Marquardt, C.; Sokolovskiy, S.; et al. Reproducibility of GPS radio occultation data for climate monitoring: Profile-to-profile inter-comparison of CHAMP climate records 2002 to 2008 from six data centers. J. Geophys. Res. Space Phys. 2012, 117. [Google Scholar] [CrossRef]
- Ho, S.-P.; Zhou, X.; Kuo, Y.-H.; Hunt, D.; Wang, J.-H. Global Evaluation of Radiosonde Water Vapor Systematic Biases using GPS Radio Occultation from COSMIC and ECMWF Analysis. Remote Sens. 2010, 2, 1320–1330. [Google Scholar] [CrossRef]
- Schreiner, W.; Sokolovskiy, S.; Hunt, D.; Rocken, C.; Kuo, Y.H. Analysis of GPS radio occultation data from the FORMOSAT-3/COSMIC and Metop/GRAS missions at CDAAC. Atmos. Meas. Tech. 2011, 4, 2255–2272. [Google Scholar] [CrossRef]
- Hersbach, H.; Bell, B.; Berrisford, P.; Hirahara, S.; Horányi, A.; Muñoz-Sabater, J.; Thépaut, J.N. The ERA5 global reanalysis. Q. J. R. Meteorol. Soc. 2020, 146, 1999–2049. [Google Scholar] [CrossRef]
- Auligné, T.; McNally, A.P.; Dee, D. Adaptive bias correction for satellite data in a numerical weather prediction system. Q. J. R. Meteorol. Soc. 2007, 133, 631–642. [Google Scholar] [CrossRef]
- Dirksen, R.J.; Bodeker, G.E.; Thorne, P.W.; Merlone, A.; Reale, T.; Wang, J.; Hurst, D.F.; Demoz, B.B.; Gardiner, T.D.; Ingleby, B.; et al. Managing the transition from Vaisala RS92 to RS41 radiosondes within the Global Climate Observing System Reference Upper-Air Network (GRUAN): A progress report. Geosci. Instrum. Methods Data Syst. 2020, 9, 337–355. [Google Scholar] [CrossRef]
- Smith, E.K.; Weintraub, S. The constants in the equation for atmospheric refractive index at radio frequencies. Proc. IRE 1953, 41, 1035–1037. [Google Scholar] [CrossRef]
- Kursinski, E.R.; Hajj, G.A.; Schofield, J.T.; Linfield, R.P.; Hardy, K.R. Observing Earth’s atmosphere with radio occultation measurements using the Global Positioning System. J. Geophys. Res. Atmos. 1997, 102, 23429–23465. [Google Scholar] [CrossRef]
- Hajj, G.A.; Ao, C.O.; Iijima, B.A.; Kuang, D.; Kursinski, E.R.; Mannucci, A.J.; Meehan, T.K.; Romans, L.J.; de La Torre Juarez, M.; Yunck, T.P. CHAMP and SAC-C atmospheric occultation results and intercomparisons. J. Geophys. Res. Atmos. 2004, 109. [Google Scholar] [CrossRef]
- Steiner, A.K.; Lackner, B.C.; Ladstädter, F.; Scherllin-Pirscher, B.; Foelsche, U.; Kirchengast, G. GPS radio occultation for climate monitoring and change detection. Radio Sci. 2011, 46, 1–17. [Google Scholar] [CrossRef]
- Kuo, Y.-H.; Schreiner, W.S.; Rossiter, D.L.; Wang, J.; Zhang, Y. Comparison of GPS radio occultation soundings with radiosondes. Geophys. Res. Lett. 2005, 32. [Google Scholar] [CrossRef]
- Ho, S.P.; Peng, L.; Vömel, H. Characterization of the long-term radiosonde temperature biases in the upper troposphere and lower stratosphere using COSMIC and Metop-A/GRAS data from 2006 to 2014. Atmos. Chem. Phys. 2017, 17, 4493–4511. [Google Scholar] [CrossRef]
- Dirksen, R. First analysis of RS92-RS41 GDP intercomparisons. In Proceedings of the 12th GRUAN Implementation and Coordination Meeting (ICM-12), Virtual, 16–20 November 2020. [Google Scholar]
- He, W.; Ho, S.-P.; Chen, H.; Zhou, X.; Hunt, D.; Kuo, Y.-H. Assessment of radiosonde temperature measurements in the upper troposphere and lower stratosphere using COSMIC radio occultation data. Geophys. Res. Lett. 2009, 36. [Google Scholar] [CrossRef]
- Sun, B.; Reale, A.; Seidel, D.J.; Hunt, D.C. Comparing radiosonde and COSMIC atmospheric profile data to quantify differences among radiosonde types and the effects of imperfect collocation on comparison statistics. J. Geophys. Res. Atmos. 2010, 115. [Google Scholar] [CrossRef]
Publisher’s Note: MDPI stays neutral with regard to jurisdictional claims in published maps and institutional affiliations. |
© 2021 by the authors. Licensee MDPI, Basel, Switzerland. This article is an open access article distributed under the terms and conditions of the Creative Commons Attribution (CC BY) license (https://creativecommons.org/licenses/by/4.0/).