1. Introduction
The internet of things (IoT) offers substantial promise concerning efforts to integrate sensors and electronic control devices to improve the quality of human life and well-being [
1,
2]. Continued growth of the internet of things (IoT) requires further development and characterization of low-cost and low-power solid state sensing devices to pair with the many wireless communication devices developed and marketed within the past decade. For many years, analytical chemists have worked to incorporate and characterize the performance of light emitting diodes, silicon photodetectors, solid state electrodes, metal-oxide semiconductor devices, capacitive sensors, chemo-resistors, and even cellular phones in their instruments, to lower cost and improve performance [
3,
4,
5,
6,
7,
8,
9,
10,
11,
12,
13]. Despite best efforts, sensor quality has not kept pace with the explosion and commercial availability of wireless communication devices. Reaching the full potential of the IoT will require the rapid advent and implementation of the sensing devices desired by consumers. Such sensors are desired for use in monitoring a wide variety of conditions, ranging from human and animal health, irrigation, air quality, cleanliness, temperature, and weather conditions—and in the home, to monitor the status of interior lighting, door locks, water use, or even which products to purchase from the market.
One area of interest to our laboratory is the development and application of low-cost particulate matter (PM) sensors for portable sensing of personal exposure to PM [
14]. We are not alone in this pursuit, as many other investigators have published similar studies in recent years [
15,
16,
17,
18,
19,
20,
21,
22,
23,
24,
25,
26,
27,
28,
29,
30,
31]. Developing such sensing platforms is crucial for furthering epidemiological studies of the health effects of particulate matter and aerosols on human health. At present, links between exposure to PM and health conditions such as COPD, asthma, pulmonary distress, and even certain mental disorders have been demonstrated [
32]. However, current studies are severely limited by the quality of data quantifying human exposure to PM. Particulate matter within Earth’s atmosphere is exceedingly chemically complex and both spatially and temporally dynamic [
33,
34]. Further refinement of links between PM and human health requires precise estimates of exposure to particulate matter, which can only be achieved by deployment of portable, low-cost, low-power, reliable sensors.
The current generation of low-cost PM sensors meets standards required for cost, robustness, and power consumption, but are often not able to achieve limits of detection lower than 10–15 μg m
−3 dust concentration. This creates a substantial limitation, in that the sensors may only be able to be reliably used in environments where airborne particulate matter is present at high concentrations. In North America, average ambient outdoor PM mass concentrations have been on the decline over the past 30 years from >20 μg m
−3 to (currently) <10 μg m
−3, with urban locations often experiencing the largest improvements in air quality [
35,
36,
37]. The current generation of dust sensors may not be able to reliably track the low levels of ambient PM at the typical levels found in most commercial buildings and residential dwellings, owing to insufficient limits of detection. Because of this, the study of technical improvements to maximize the information gained from such low-cost sensing platforms is therefore both timely and of crucial importance to the field of portable sensing.
In this study, several variables affecting measurement noise for the Sharp GP2Y1010 dust sensor performance were studied—and technical improvements were offered. The Sharp dust sensor is a nephelometric (light-scattering)-based design, sensing in the near infrared. The Sharp sensor is a popular option for massively parallel sensing, given its inexpensive nature (approximately $12 USD) and robust packaging. In the sensor, an infrared-emitting diode and a light detector are arranged on the device’s optical bench at an approximately 120-degree angle. This allows selective collection of the scattered or reflected light from PM in the air. The sensor has a low current consumption (10–20 mA typical) and can be powered with 4.5–7 V DC, which is convenient for direct connection to microprocessor boards—such as the popular Arduino Uno, which provides a 5 V DC power pin. The output signal of the Sharp sensor is an analog voltage pulse, with the pulse height and area proportional to the measured dust density. The manufacturer’s specification for the dust sensor sensitivity is 0.5 V pulse height per 0.1 mg m−3 of PM.
Improvement to signal-to-noise ratio (S/N) of measurements is a central and consistent theme in analytical sciences. The analyst can either increase the signal or reduce noise to improve performance. Noise is often quantified by the standard deviation of blank measurements (blank) or percent relative standard deviation (% R.S.D.). A blank standard of 3 is frequently adopted as the minimum detectable electrical signal from the measurement device. These conventions were used within this manuscript to describe observed noise and ultimately, the limit of detection. Because end-users desire to massively multiplex such portable sensors in high numbers, approaches to achieve technical improvements must be reasonably simple and achieved at low-cost to be considered practical. All enhancements proposed or offered within this manuscript were bound by these limitations.
2. Materials and Methods
Three dust sensors (Sharp GP2Y1010AU, Mouser Electronics, Mansfield, TX, USA) were obtained and used for testing without modification to the device’s circuit. A six-conductor ribbon cable was plugged into the dust sensor board and used to wire the device on a breadboard according to product literature. An Arduino Uno was used to provide Vcc = 5 V DC, trigger the dust sensor transistor, and collect data. The Arduino Uno microprocessor board was connected to a Mac computer via USB connection, and the USB was used to power the apparatus (unless otherwise mentioned below). Various values for the resistor and capacitor comprising the external LED power circuit were used during experimentation (vide infra).
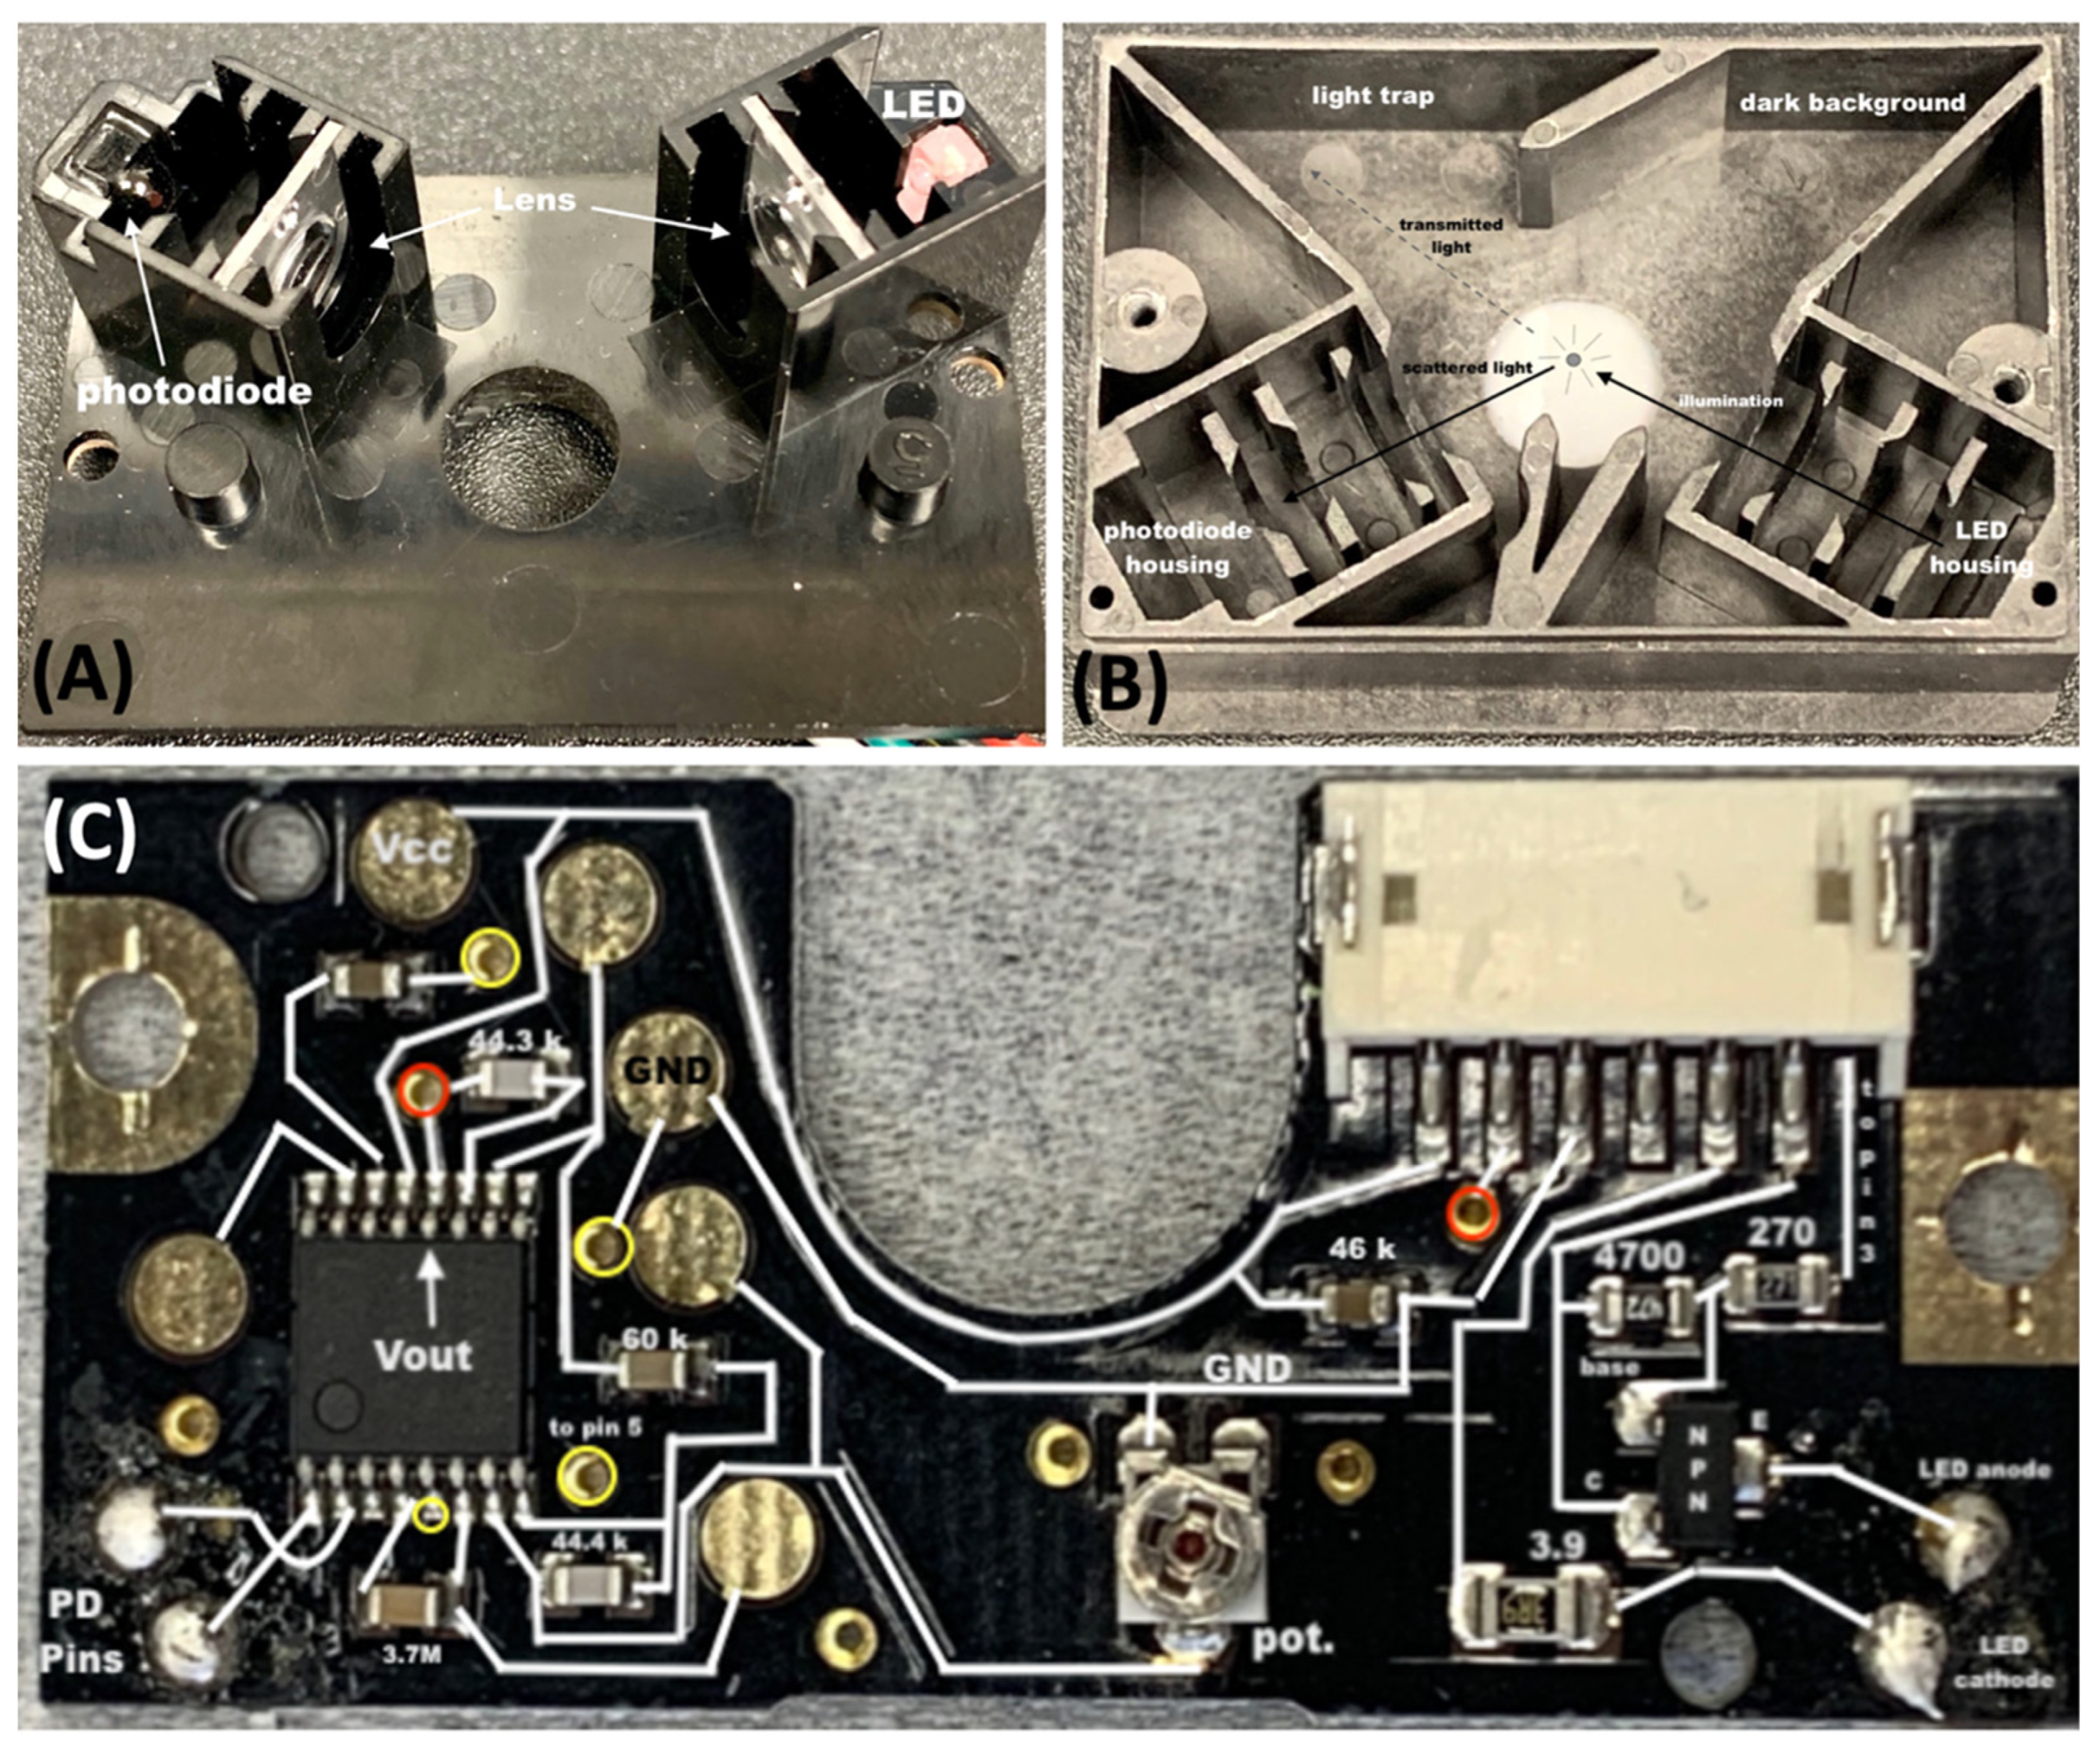
The Sharp dust sensor consists of a metallic shield screwed to a circuit board and plastic light trap/housing. The black plastic housing is designed to serve as a light trap, but it is also doped with a conductive material (likely carbon). This allows the housing to serve as a shield. To better understand device function and provide the community with more information regarding this popular device’s functionality, the device was disassembled and examined closely. While significant information was added to the body of knowledge through this effort, not all device parameters will be reported here due to difficulty in identifying certain device components (particularly the main amplifier IC chip in detection circuit).
The optical bench of the Sharp dust sensor is illustrated in
Figure 1A. It consists of an infrared LED and a light sensor arranged diagonally to one another as mounted in a monolithic plastic mount. The design is very suitable for mass production, and optically sufficient. Two transparent lenses are used to collimate LED light and collect scattered light, respectively. For LED collimation, a plastic, molded, plano-convex lens of diameter 6 mm and focal length approx. 6 mm was noted. This lens is inserted into the black optical housing of the dust sensor such that the lens is at a distance of 1 focal length from the LED source, suggesting that the lens is used for collimating LED light and directing it to the particle detection volume. The focusing lens used to collect scattered light appears to have identical characteristics to the collimating lens, but is placed slightly further from the light detector (7–8 mm noted). In addition, the central axis of the dust detection region lies approx. 1.1 cm from the light collection lens—almost twice the focal length. Ray tracing suggested that this arrangement would allow for directing the light scattered onto the active area of the light detector.
The light detector in the Sharp dust sensor features an opaque (black) plastic hemisphere—presumably to filter optical frequencies. The detector has been called both a phototransistor and photodiode in various online product descriptions. Product literature does not specify. When the light detector was placed in a series circuit with a 10 kΩ resistor and 5 V applied, the light detector was found to act as a diode with approx. 0.5 V drop across terminals. Subsequently, the light detector was indicated as a functional diode with turn-on potential of 0.534 V when tested with a multimeter. In addition, when a multimeter was used to measure voltage across the light detector terminals (photovoltaic mode), a voltage was noted that was proportional to illumination intensity. The results provided evidence that the device was acting as a photodiode, and thus it will be referred to as such.
The circuit board of the Sharp dust sensor is also pictured in
Figure 1C. The upper right of the board features the jack to plug to the ribbon cable for external connections. Pins 1–6 are visible in the photograph. The white lines drawn on the photograph are meant to illustrate electrical connections. The red and yellow circles represent points which are electrically connected through a lower layer of the board (all yellow points connected, all red points separately connected).
The right side of the PC board below the pins is for the LED drive circuit. The collector of the NPN transistor is wired to pin 1 (LED power). The base of that transistor is wired to pin 3 (LED trigger) through a 270 Ω resistor. The transistor emitter is wired to the IR LED anode, with return to the cathode terminal. The circuit is completed through a 3.9 Ω resistor to the ground (pin 2).
The left two-thirds of the circuit board (
Figure 1C) is devoted to the photodiode light detection circuit. This portion of the circuit features a variety of resistors making up feedback loops of a high-gain photodiode amplifier circuit. Only one integrated circuit is present, which is labelled with an identifying code of S 126 716 A2. Unfortunately, a search of the product literature did not allow identification of this device. The IC has 16 pins, with V
out on pin 12, V
cc on pin 13, and ground on pin 5.
Presumably, the IC and associated resistors comprise a transimpedance amplifier, similar in design to the board described in Texas Instruments’ technical literature [
38]. The board features an adjustable potentiometer near the middle bottom of the board, which is factory adjusted to set sensitivity. That sensitivity was not adjusted in this work. Unless otherwise noted, photodiode signals were acquired using an Arduino Uno with 10-bit resolution. The LED was triggered using digital lines of the same Arduino. A simple code (called a sketch) to run the dust sensor using the Arduino is freely available online [
39]. However, during experiments, novel code was also developed, as described below.
3. Results
3.1. Baseline Signal Characterization for Dust Sensors with Clean Air
Establishing a baseline for blank noise is crucial to ascertain whether subsequent testing offers a technical advantage. Thus, baseline noise was evaluated by collecting data for an experiment in which a dust sensor was sealed within a closed container with clean, particle-free air present. To determine whether differences existed between devices, three dust sensors were tested independently by plugging them into an identical power and data acquisition circuit running the basic dust sensor code for acquisition of a single data point at a sampling frequency of 10 Hz. The Arduino returned a 10-bit integer value (full scale 0 to 1023) reporting signal response.
For this experiment, dust sensor #1 yielded an average signal pulse height of 284.04 with a standard deviation of σblank = 8.04 units (recall that these values are digital counts from a 10-bit device and are unitless). Dust sensor #2 yielded an average signal pulse height of 289.75 with a standard deviation of σblank = 7.39 units. Dust sensor #3 yielded an average signal pulse height of 228.7 with a standard deviation of σblank = 6.74 units. As observed, a wide variety of output signals and σblank were observed for the three sensors tested. This suggests that the use of a single calibration equation which relates sensor signal to PM mass concentration (sometimes advocated in the literature) was not a best practice, as the background at zero PM concentration varied significantly among devices.
3.2. Effect of LED Drive Circuit Capacitor
As observed in
Figure 2, the LED drive circuit for the Sharp dust sensor requires a capacitor to be installed for proper operation. The device data sheet suggests 220 μF for capacitance [
40]. This capacitor serves a crucial role for the drive LED as it stores a significant charge and is able to drive the LED with high peak current when the transistor is triggered. Varying the capacitance would be a very simple alteration to make to the LED drive circuit—if it improved performance. To assess the effects of the capacitor, the capacitance was altered from below 100 μF to 3300 μF (using several electrolytic capacitors) while recording signal for a blank. Both the circuit and results are illustrated in
Figure 2 below.
It was found that if the capacitance was 22 μF or below, the LED did not function/trigger properly. If capacitance was 100 μF or below, the LED output brightness was >25% dimmer than what could be achieved at higher capacitances. Capacitances of 470–3300 μF produced the highest indicated LED brightness (values within 5% of each other). Pulse-to-pulse noise was also reduced (as measured by % relative standard deviation). By increasing capacitance from below 100 microfarads to 3300 microfarads, % R.S.D. was reduced from nearly 10% to <3% for single subsequent LED pulses.
Results indicated that capacitance > 500 μF was preferred for the LED drive circuit to both maximize LED brightness and reduce noise. For all subsequent experiments, a 1000 μF capacitor was used in the circuit. Use of a favorable capacitor was thus determined to be a very simple effective means of improving the performance of the Sharp dust sensor.
3.3. Effect of External LED Resistor on Pulse Brightness and Noise
The Sharp dust sensor instructions suggest that a 150 Ω resistor is placed between V
cc and the LED drive pin (pin 1) wired to the collector of the LED control transistor (see
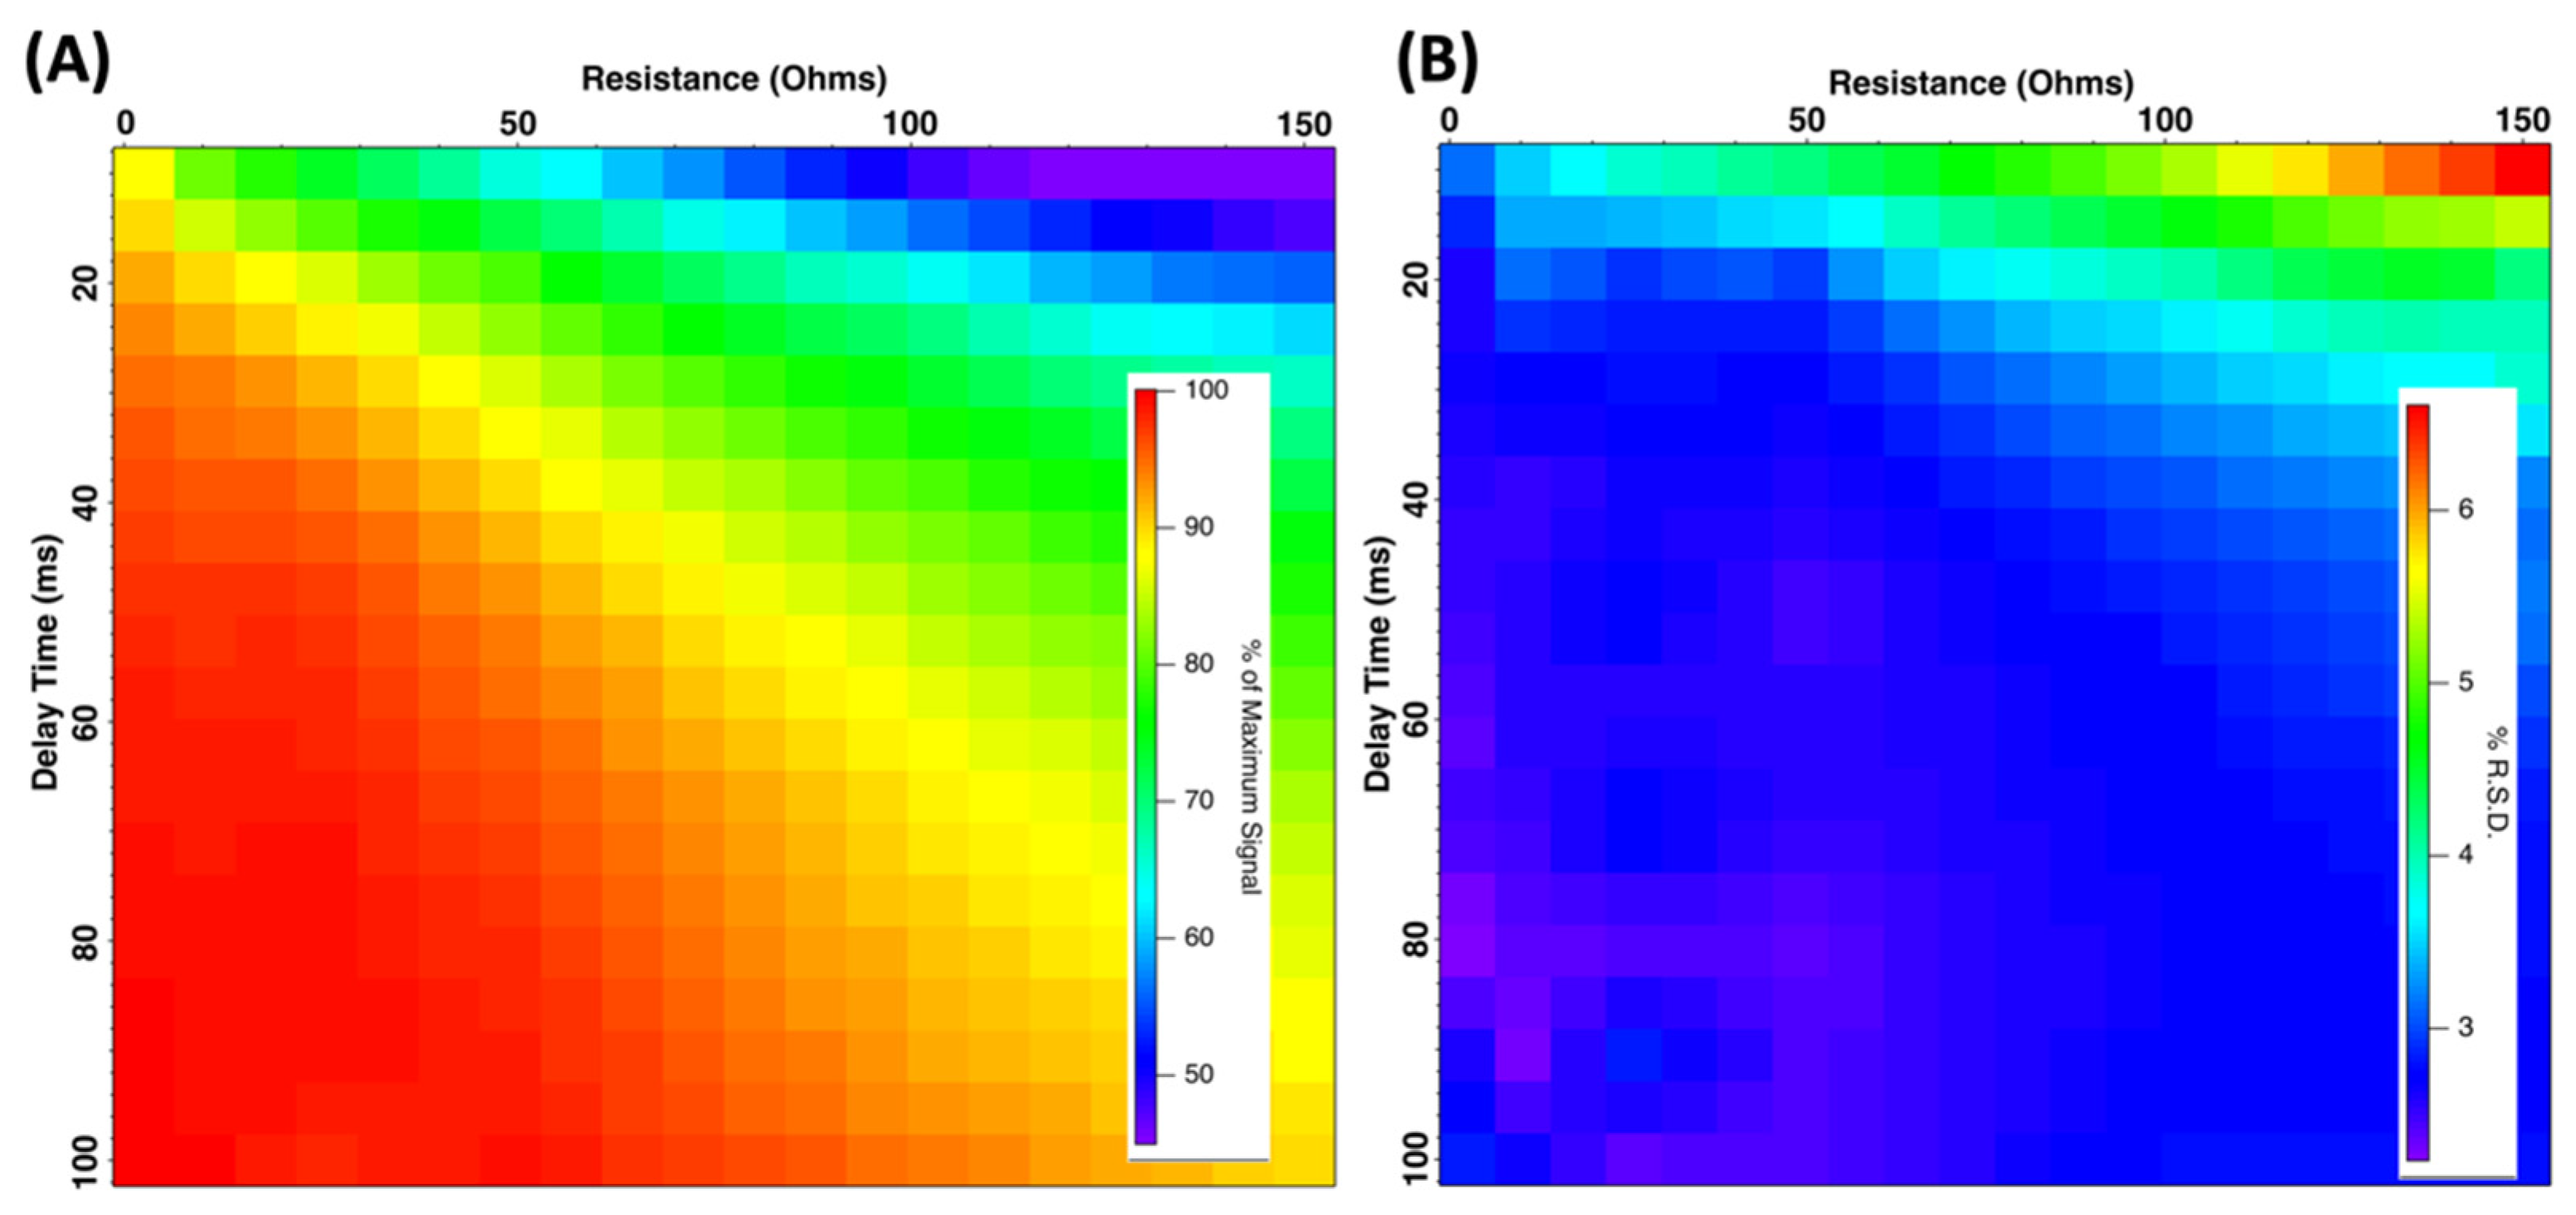
Figure 2A). The value of this resistor can easily be changed by the user and may affect LED brightness and achievable LED pulse frequency. To study the effect of this resistor, the resistance was varied while the average LED signal strength (brightness) was monitored using the Arduino. The software-programmed delay between subsequent pulses was also varied from 10–100 ms during this experiment. The delay time between pulses was required to charge the capacitor, which formed an RC circuit with the external resistor. Thus, smaller values of R may offer the advantage of more rapid charging of the capacitor and higher LED pulse repetition rates.
Figure 3A reports observed LED pulse intensity vs. resistance of the resistor vs. delay time. The LED pulse intensity (brightness) is plotted as percent of maximum value observed. As observed, larger values of R and small delay times were observed to reduce LED pulse intensity to unacceptable levels (<50% of maximum).
In addition, the data from
Figure 3B illustrates that % relative standard deviation (% R.S.D.) values of sequential LED pulses were also >5% when resistance was near 150 Ω and shortest delay times were used. Additionally, LED brightness was highest when R was minimized. In general, larger delay times did lead to higher peak LED intensity. However, when R = 2.5 Ω, LED brightness values > 95% of maximum were obtained while delay time was only 30 ms. In addition, the % R.S.D. of sequential pulses under such conditions remained low enough to be a viable option for use during sensing (approx. 2.7%). This result was of significance, because minimizing the delay time required to charge the capacitor in the RC circuit allowed for a faster pulse repetition rate. In turn, higher pulse repetition rates streamlined signal averaging approaches to reducing limits of detection (vide infra).
3.4. Effect of External Power Supply
On occasion, performance of portable sensors may suffer if the electrical power needs of the sensor devices are not adequately stable. The Arduino-based devices are frequently powered by either USB lines from computers or battery packs. A stand-alone 5V voltage regulator is present on the Arduino board (imax = 500 mA), and this is typically used to power Sharp dust sensors during use. However, I wished to examine whether the use of a separate 5V regulator (model 7805CT) offered any improvements in dust sensor performance.
To assess, the three devices were powered using a stand-alone model 7805CT 5V regulator powered by a separate AC adaptor, independent of the Arduino/USB. Both signal and standard deviation of individual pulses were measured to assess performance compared to the Arduino-based regulator—which was USB powered. On average, the stand-alone regulator offered a very small (1.6%) and statistically insignificant relative standard deviation improvement over the Arduino on-chip regulator at the cost of 1.5% lower average pulse signal intensity. Given these insignificant gains, the premise of improving device performance by powering the dust sensor with a separate power supply was refuted as ineffective.
3.5. Effect of Darkened Measurement Chamber
The Sharp dust sensor features a well-designed light trap to capture and attenuate non-scattered LED light (see
Figure 1). This is required for the unit to sense scattered light as contrast must be developed for sensing to be achieved. While the inherent design is adequate, it was hypothesized that potential improvement would be possible if the background and blank noise could be reduced further by darkening the light trap walls. To test whether this could be easily accomplished at minimal cost, a black paint (BLK 3.0, Stuart Semple) was acquired and used to coat the inner surface of the light trap (2 coats). The paint used is marketed as absorbing ~99% of light in the visible and near-IR spectra. When the dust sensors were tested with a clean-air blank in the optical chamber, the background intensity was indeed reduced substantially. On average, observed LED background signal was reduced approximately 20%, with a relative standard deviation of replicate pulses decreasing by 14% for the three devices tested. Applying light absorbing paint to the inside of the dust sensor’s light trap was an effective way to decrease background signal and observed pulse-to-pulse noise. While applying paint to the light trap may seem labor intensive, it was easily accomplished in only a few minutes. After removing the two retaining screws on the metal shield, the circuit board and optical frame can be slid out of the dust sensor for paint to be applied.
3.6. Effect of Data Acquisition Parameters: Peak Integration Approach
The basic Arduino sketch for acquiring dust sensor data [
39] collects a single data point from the photodiode channel after a software defined delay from the LED trigger. Any noise, jitter, or variability in this single data point will be reflected in analytical signal. Under standard operating conditions, the maximum Arduino Uno (AVR chip) base sampling frequency for the analog input lines is roughly 9000 Hz, which correlates to recording samples approximately 112 microseconds apart. On an oscilloscope, the output photodiode signal from the dust sensor was observed to appear as a tailing Gaussian-shaped pulse roughly 750 microseconds wide. Thus, it should be possible to use the AnalogRead command in the Arduino programming language to acquire multiple data points across a single pulse transient (rather than only one point). Indeed, I was able to observe 5–7 non-zero data points across a single pulse transient by defining multiple variables and using serial AnalogRead commands in the software.
While 5–7 data points may describe the photodiode signal more precisely than only one data point, this sampling frequency is still less than optimal for quantification of the photodiode peak. Therefore, potential methods for increasing the Arduino sampling rate further were investigated. The Arduino user community has previously addressed this issue by offering a simple software patch to increase analog sampling rate [
41]. Use of this software patch allowed a 66.4 kHz sampling rate, with data points being sampled every 15.06 microseconds. This allowed approximately 40 data points to be collected across a single LED pulse.
Because more data can thus be sampled from a single LED pulse, altering data acquisition protocols should be investigated further. The first scheme considered was integration of peak area for quantitation. Mathematically, this was achieved by simply summing data points across the photodiode transient (considered acceptable since Δt between points sampled by the Arduino is constant). Use of peak area is often considered a best practice for quantifying analyte, and users have found that peak areas frequently produce improved quantitation when directly compared to use of peak heights. Improved quantitation may be achieved if the dust sensor signal transient is electronically sampled multiple times rather than simply once. Integration of the peak (summing signals) was easily accomplished in the Arduino code at minimal-to-no processing time cost because the programmed delay between sequential pulses (30–100 ms) was much longer than the time required for the microprocessor to complete the mathematical operation. This delay was also far greater than the time required to sample data and complete all computations. Indeed, if only a 40 μs delay after the LED transistor pulse were used in the code, 45 data points would sample the entire photodiode transient.
For single pulses of the LED with single point sampling, a relative standard deviation of 2.8–3.2% for the three sensors was observed. For the peak integration approach, the three sensors yielded slightly better average % R.S.D. for subsequent peaks of 2.65%. A slight decrease in % R.S.D. was observed, indicating that collection of a single data point from the photodiode trace was not optimal for quantifying the dust sensor signal. However, the improvement in precision was small, indicating that sampling of data into the Arduino may not be the limiting factor affecting noise for the dust sensor. In effect, the variability of photodiode signal from pulse-to-pulse was found to be an authentic phenomenon not created or observed due to undersampling of data. Both the pulse-to-pulse variability of the LED brightness and the detection circuit noise were considered more fully in subsequent sections.
3.7. Effect of LED Drive Current
In the previous section, it was noted that the observed variability in signal was authentic and did not result from undersampling of data. The LED pulse brightness variability and/or the photodiode detector noise are responsible for the pulse-to-pulse variability of the Sharp dust sensor. A common approach to reduce source noise in spectroscopic systems is normalizing observed signal to the source intensity. Clearly, if pulse-to-pulse variability of the LED is large, noise will be high. One approach to monitoring LED brightness is through monitoring the drive current through the device. For the Sharp dust sensor, there was a simple way to monitor LED drive current. A 3.9 Ω current-limiting resistor is wired between the LED cathode and the ground. By measuring the voltage across this resistor on an oscilloscope, LED drive current can be inferred. Since LED drive current is known to scale linearly with LED brightness [
42], this provides a tractable approach to monitoring source brightness and could potentially be used to automate mathematical corrections for source drift if needed. To test this, a jumper wire was soldered to the LED cathode to probe LED current. On the oscilloscope, the drive current exhibited a square wave pattern synched to the transistor pulse signal, as expected. Peak drive currents of 0.68–0.7 amps were noted for the Sharp dust sensor LED.
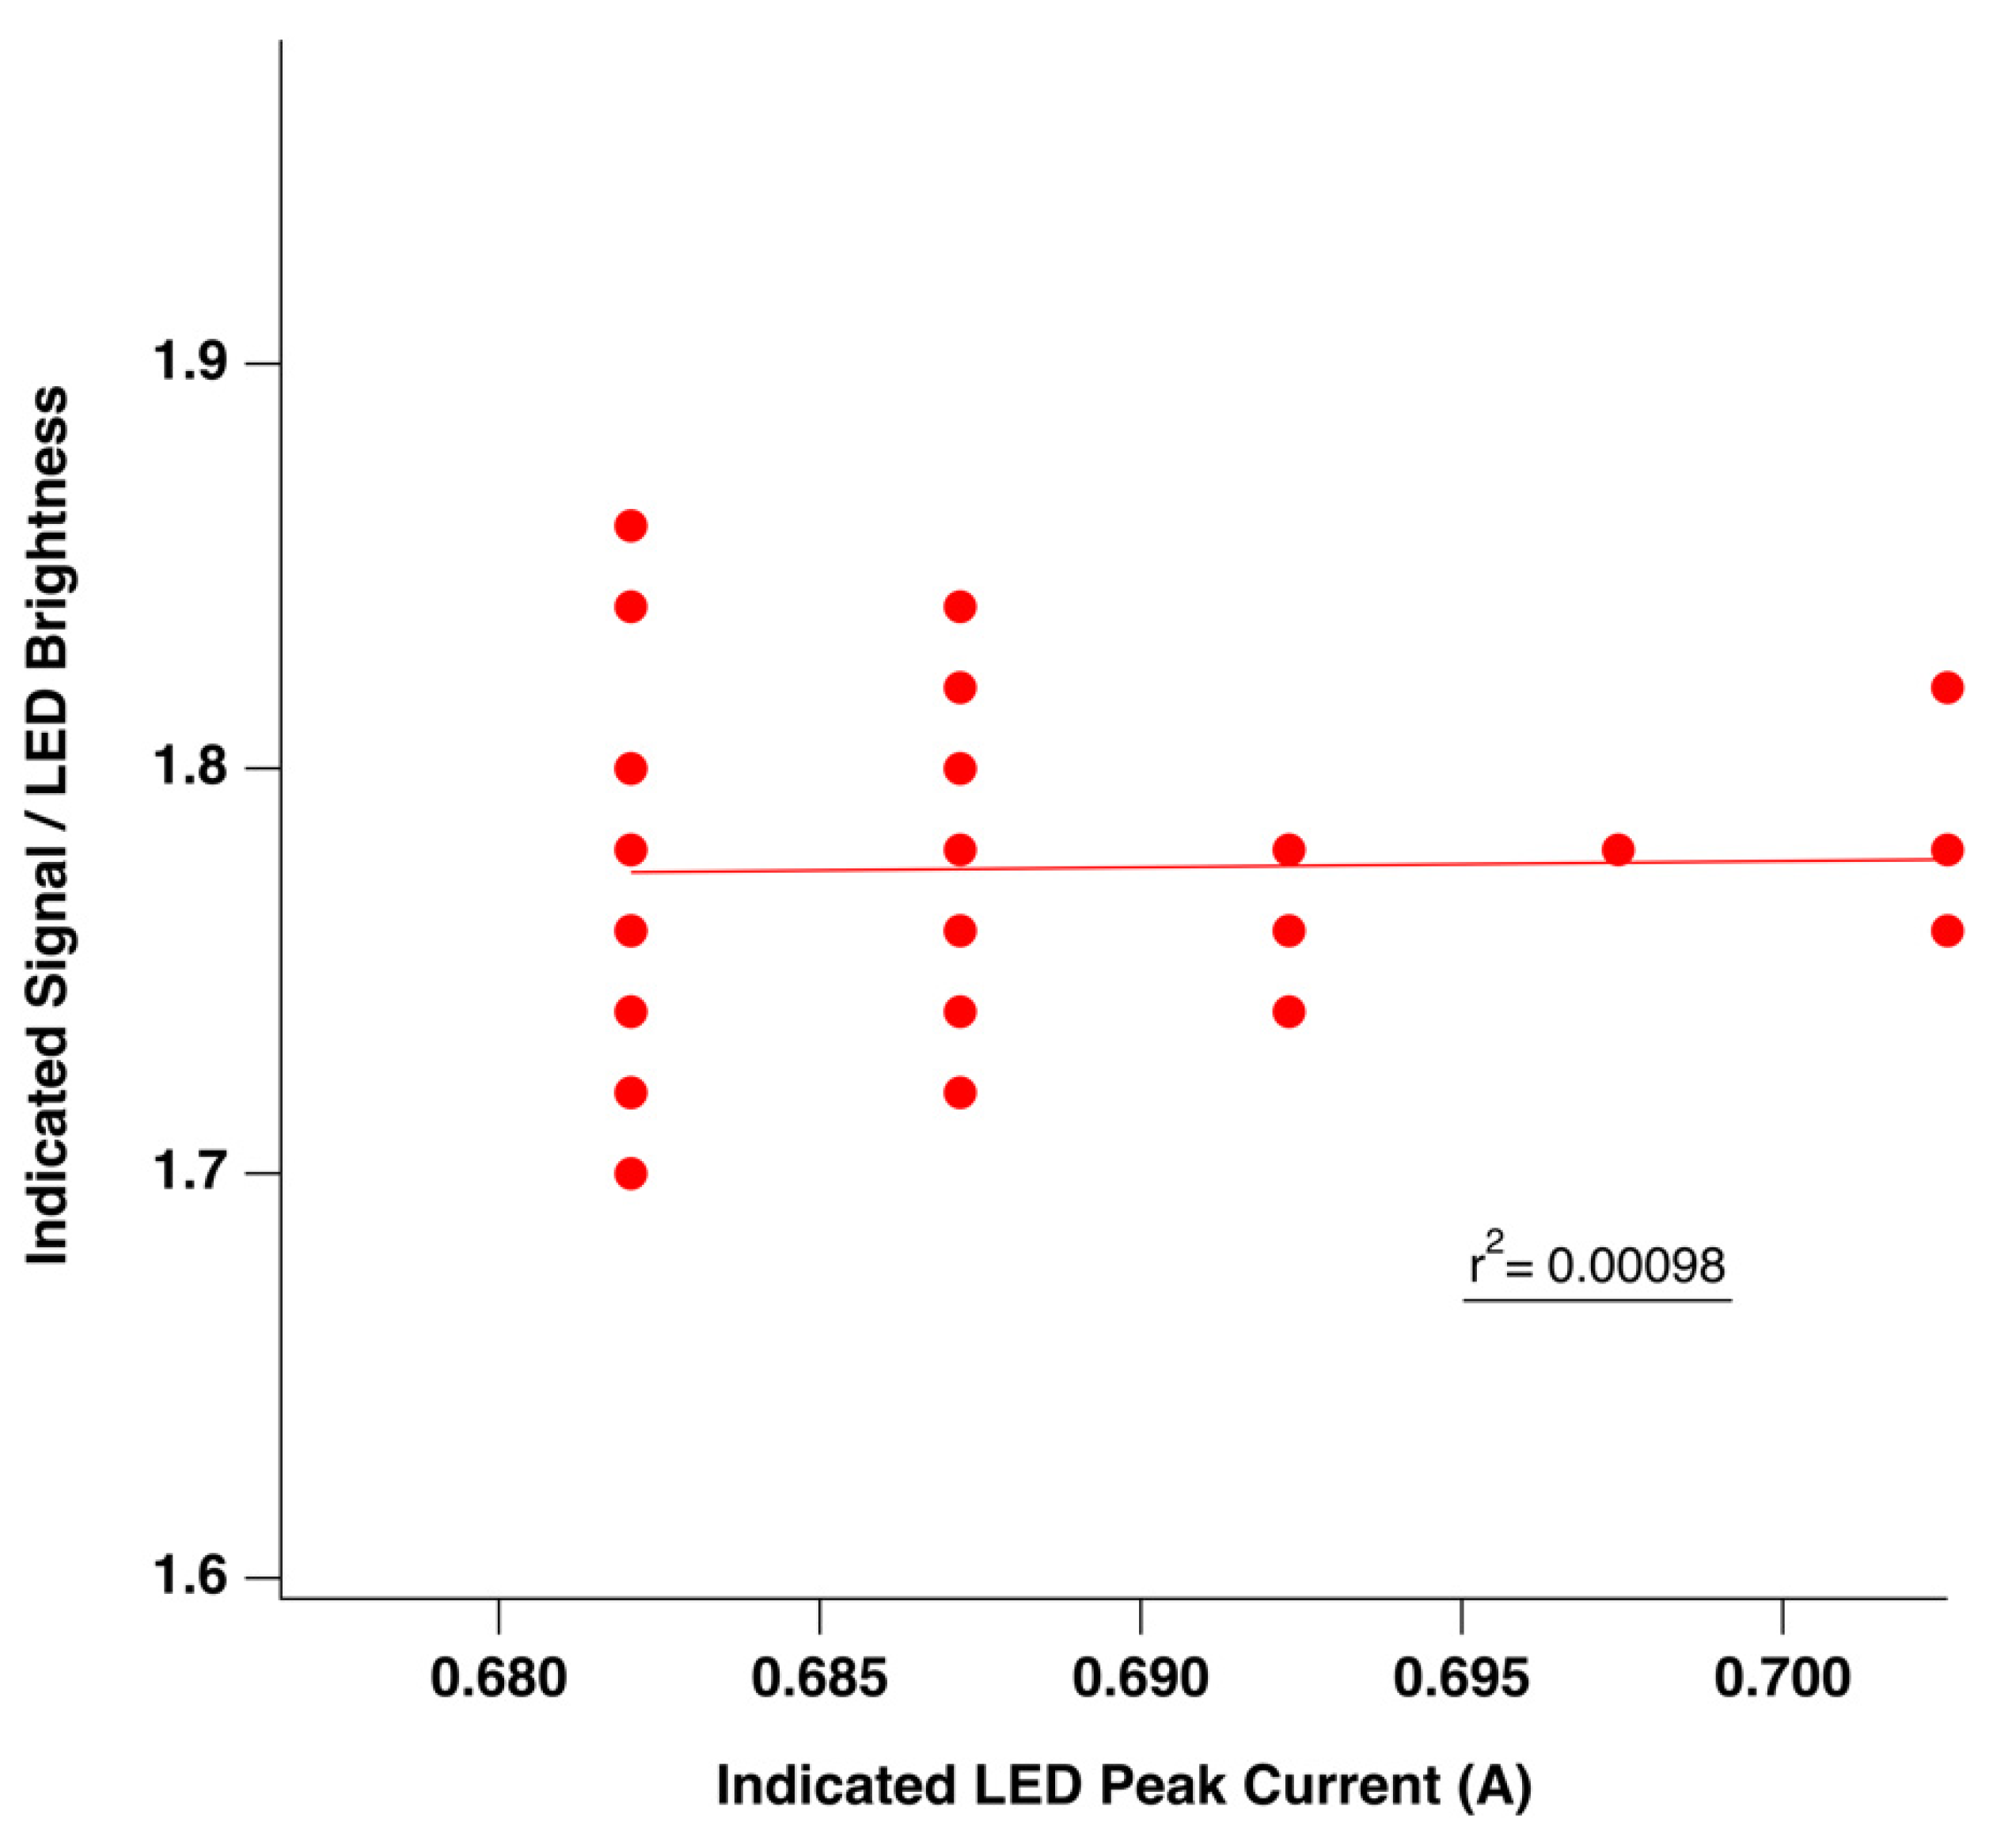
In an effort to better understand and reduce detector noise, the relationship between indicated drive current and LED brightness for a spectroscopic blank was explored. LED brightness was ascertained by the Sharp dust sensor circuit and LED drive current measured on the oscilloscope. Fifty individual traces of LED current and LED brightness were collected synchronously on a two-channel oscilloscope and max signal was measured for both channels. Correlation of the LED current and indicated brightness was attempted with a scatter plot, which yielded an R
2 < 0.001. Results are illustrated in
Figure 4.
This result indicated that the variance of indicated LED brightness cannot be accounted for by considering LED drive current. LED current exhibited excellent pulse-to-pulse reproducibility of ca. < 1%, while LED-indicated brightness exhibited 2–3% R.S.D. In addition, ratioing the LED signal to drive current for correction of source intensity brightness actually yielded poorer pulse-to-pulse relative standard deviation. These results suggest that there was no correlation between LED drive current and LED intensity as indicated by the dust sensor detection circuit.
The square wave profile at the time of the LED drive current and a value of 0.9% pulse-to-pulse R.S.D. for the LED intensity was directly confirmed in a separate experiment using a photodiode inserted into the sensor’s sample hole to directly and independently measure LED intensity. The LED drive current and LED intensity indicated by a separate photodiode (independent of the dust sensor) were very reproducible, with pulse-to-pulse R.S.D. < 1%. These results strongly suggest that the major source of pulse-to-pulse noise or variability in the Sharp dust sensor is introduced within the photodiode detection circuitry. No further attempts to correct signal by monitoring LED brightness or LED current were pursued.
3.8. Effect of Photodiode Circuit Noise and RF Interference
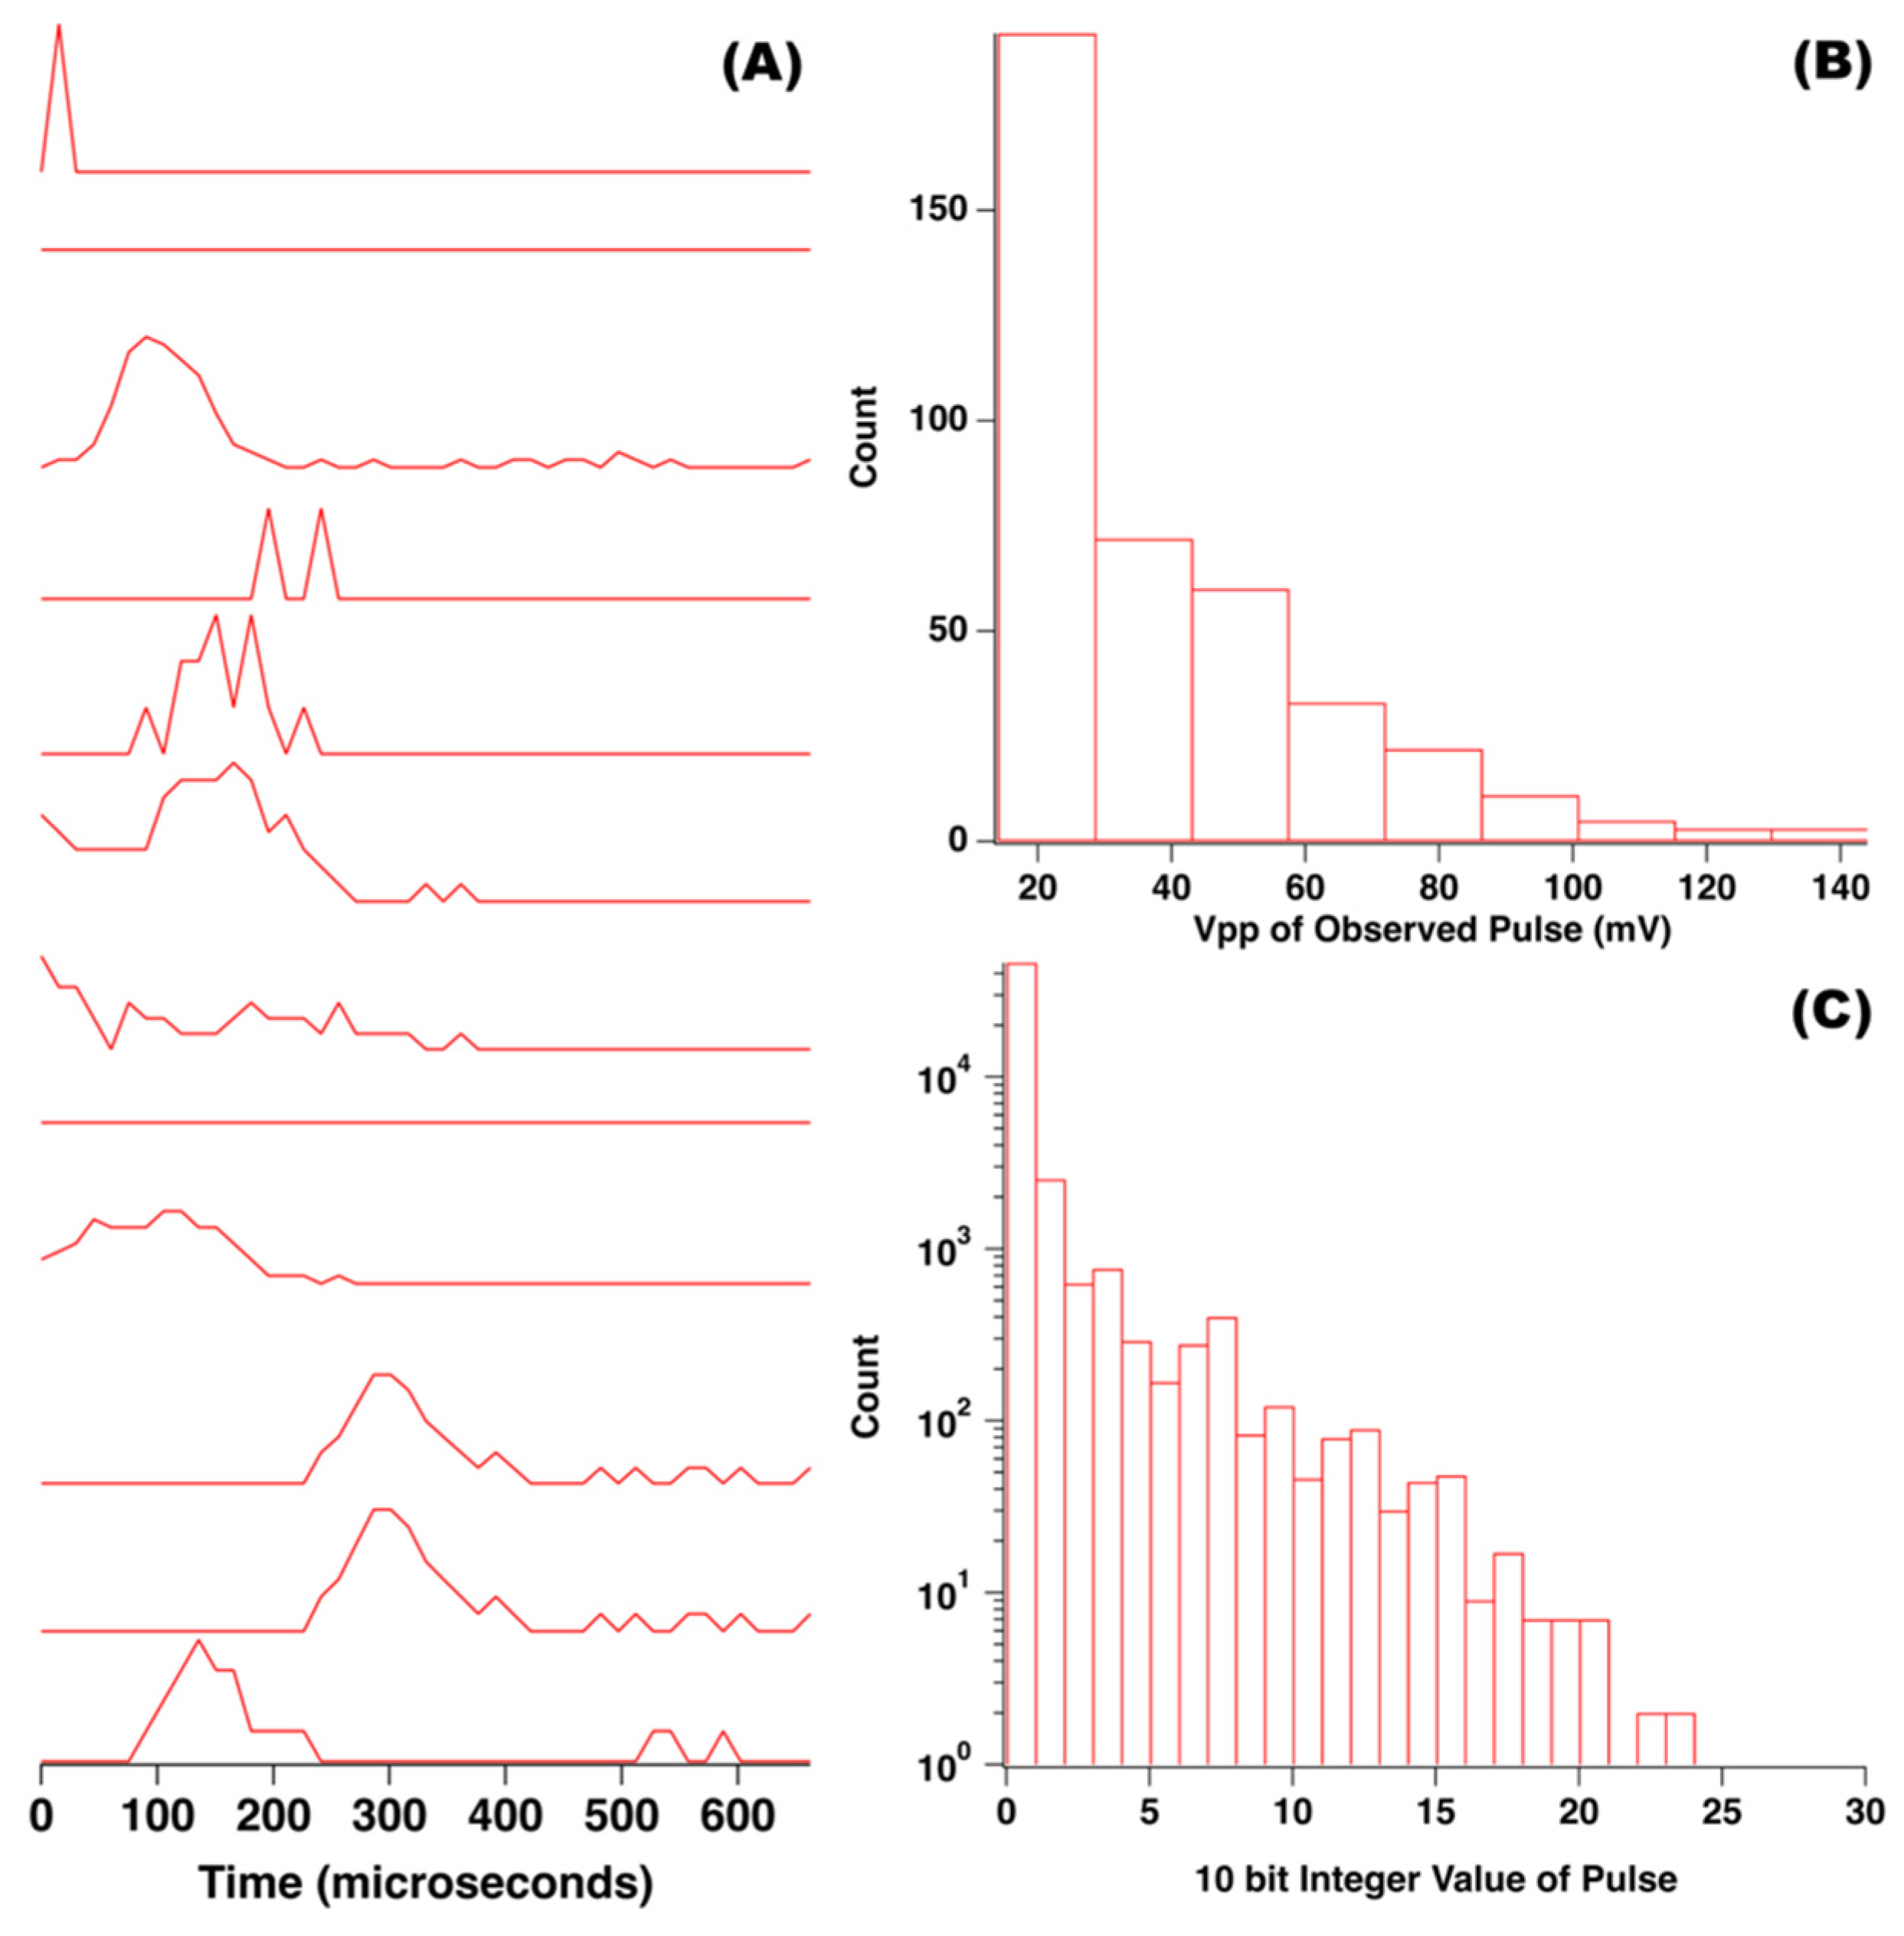
Given that the observed pulse-to-pulse variability seemed to be generated primarily within the photodiode circuitry, more attention was paid to this portion of the dust sensor. When the dust sensor output signal was viewed on an oscilloscope it was noted that, in addition to the signal when the LED was on, pseudorandom pulses appeared in the signal trace, creating noise. To investigate further, the LED was disconnected from its drive/trigger signal so it would never turn on and the detector signal would correspond to a dark signal. As observed in
Figure 5A, the noise pulses were still observed when the LED was dark. Thus, the noise spikes were not related to the dust sensor’s LED.
As observed in
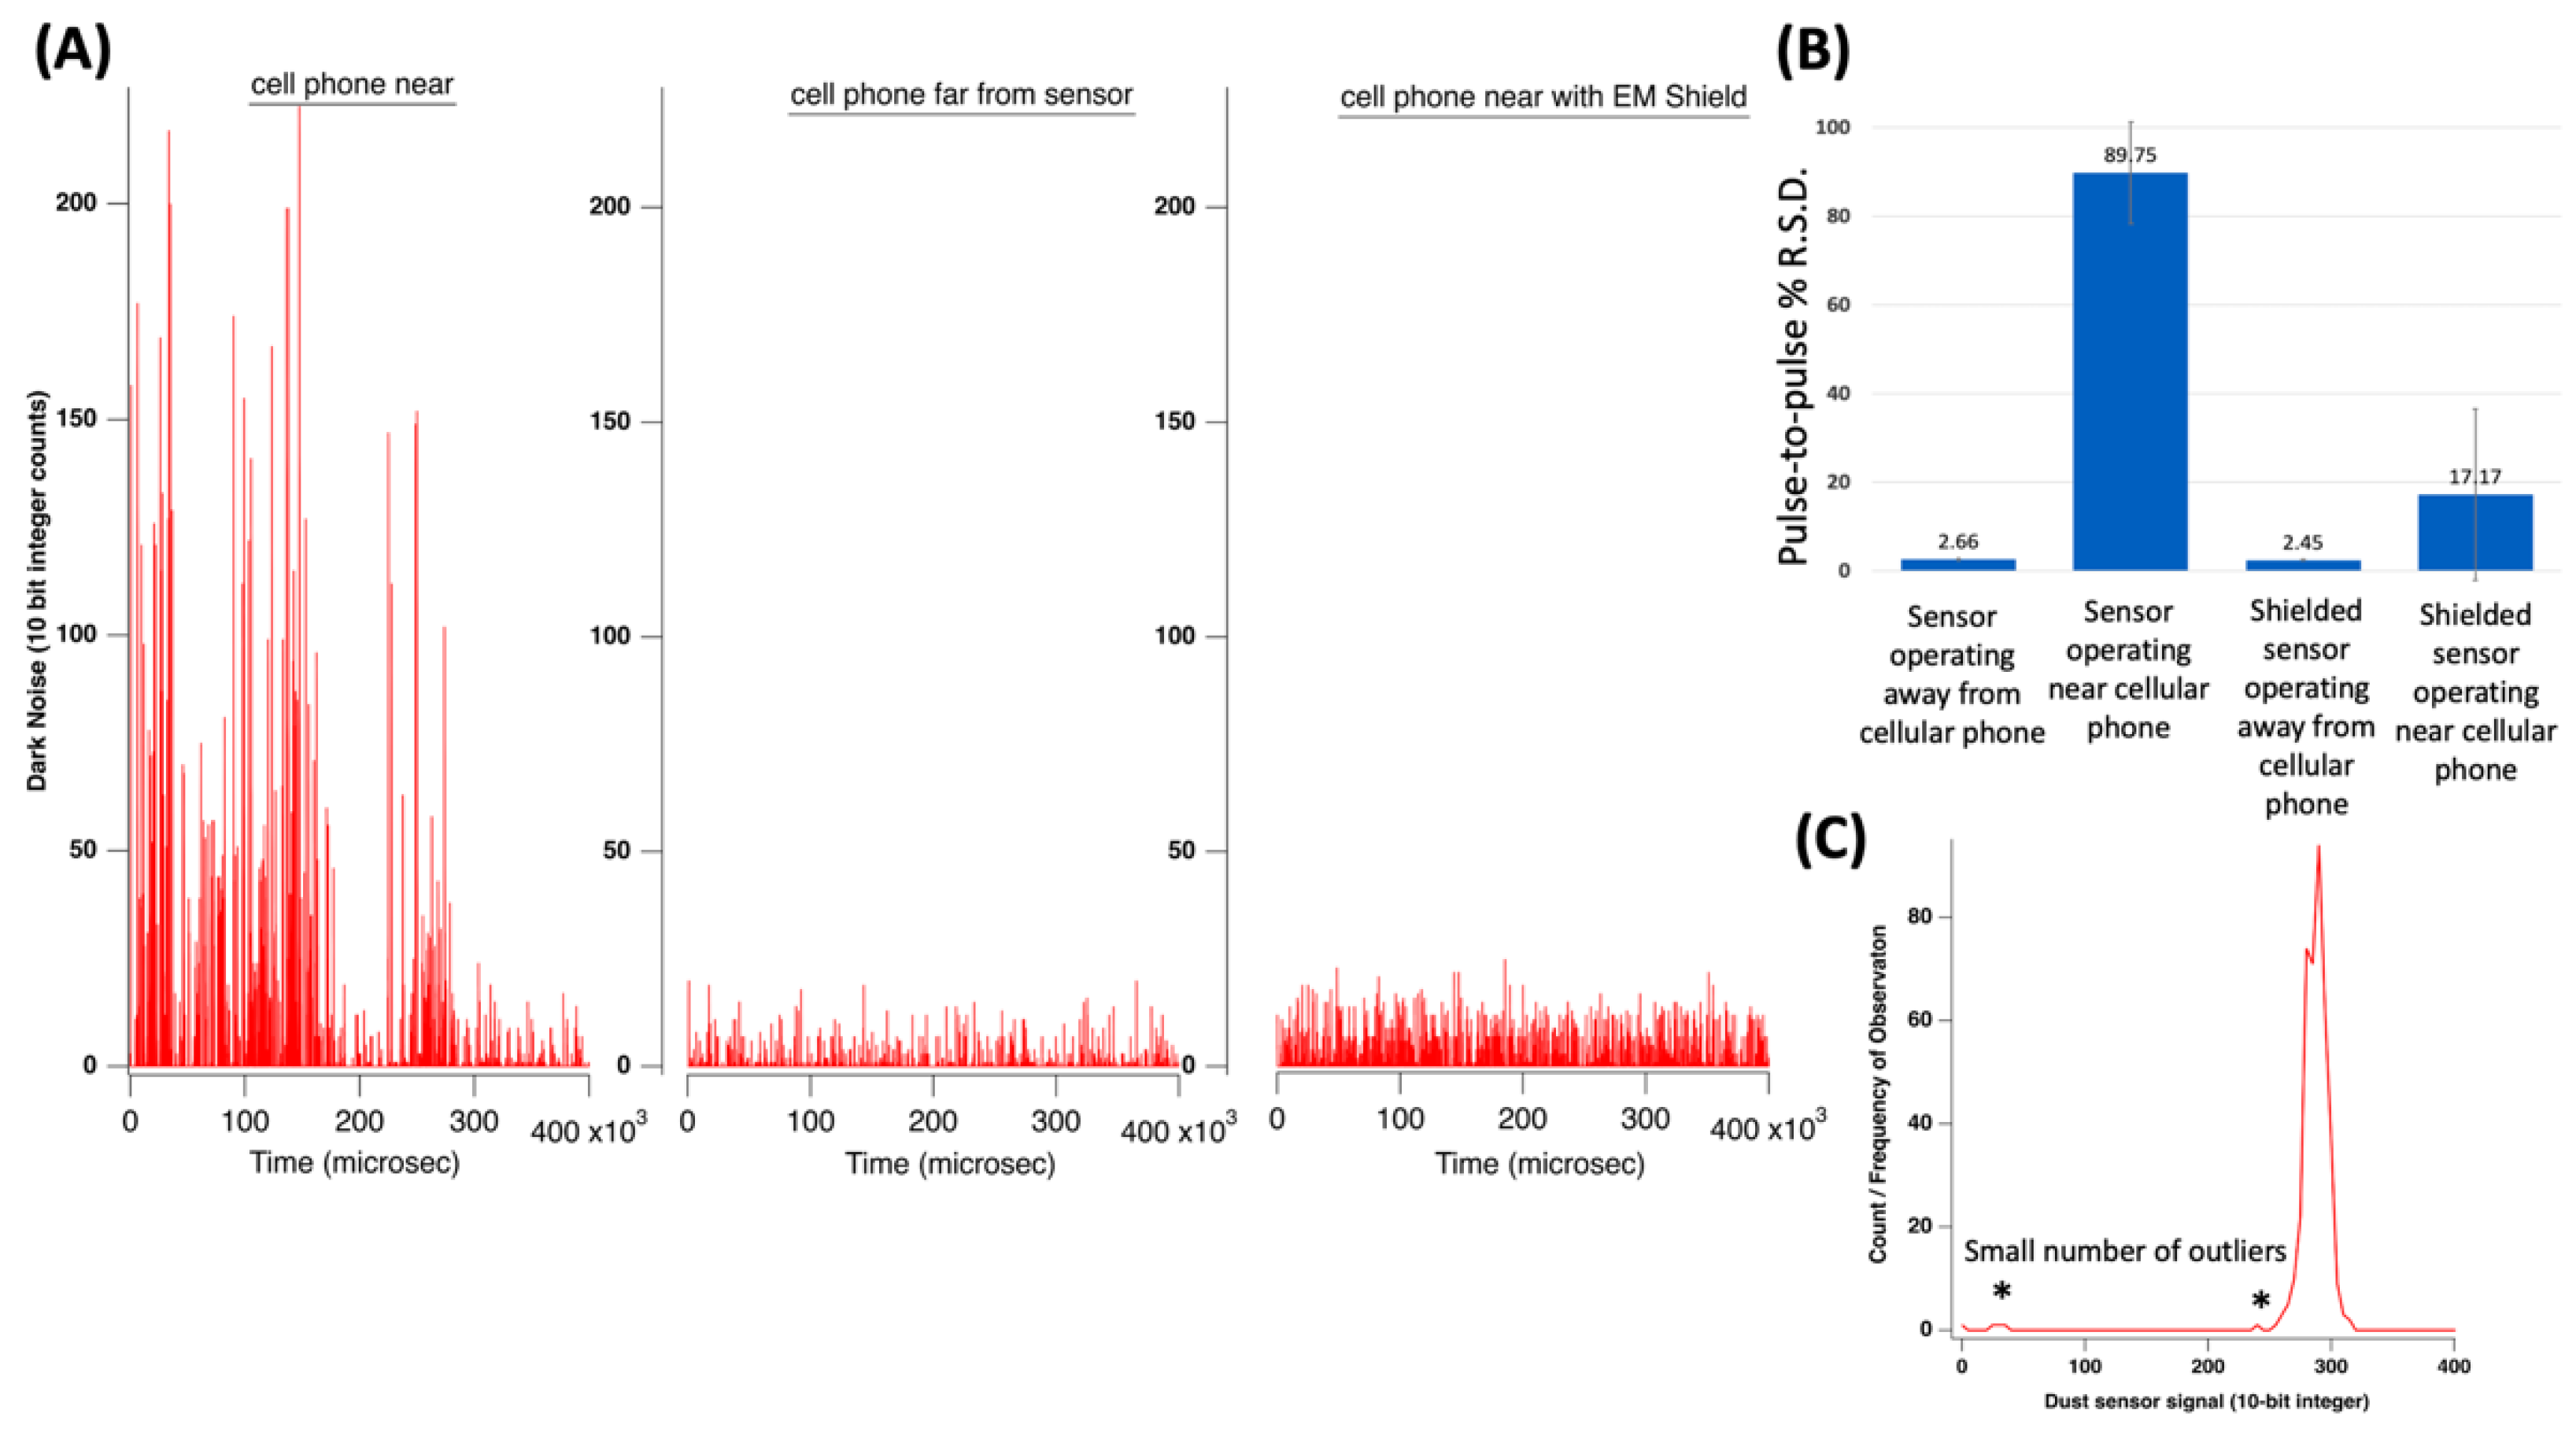
Figure 5A, during some sampling events, no noise spike was encountered and zero signal was recorded (flat horizontal lines). During others, significant departure from zero signal was observed. In theory, if a random noise spike coincides with an LED pulse the dust sensor output may be modelled as the sum of both signals. In turn, this would create noise—which was observed when data was collected. To understand the magnitude of these transient dark signals, 400 peak-to-peak voltages (Vpp) were logged in an oscilloscope and a histogram was created, as seen in
Figure 5B. As observed, most frequent noise spikes observed were very small, typically less than 20 mV in magnitude. However, spikes larger than 100 mV were observed, albeit less frequently.
Figure 5C represents a similar histogram of the noise transients, but these data comprise over 50,000 data points collected with the Arduino and are reported as 10-bit integer values observed rather than a voltage.
During experiments, noise signals were frequently viewed on an oscilloscope. It quickly became obvious that RF interference from cellular telephones and/or other devices were having a dramatic effect on noise for the Sharp dust sensor. To demonstrate, consider data presented in
Figure 6 below.
Figure 6A, in the left-most panel, illustrates detector signal traces (no LED) when an Apple iPhone was open and being actively used for data transmission within a few inches of the Sharp dust sensor.
The middle trace of
Figure 6A illustrates detector signal traces when the cellular phone was at an 8-foot distance and not activated. As observed, an obvious change in noise level was encountered. Despite engineered attempts to shield the circuit using the dust sensor’s metal cover and conductive plastic housing, RF signals still dramatically influenced dust sensor noise. To demonstrate further, the bar graph of
Figure 6B reports % R.S.D. for replicate pulses when the LED was triggered and engaged properly. The % R.S.D. for replicate pulses was 2.66% when the cellular phone was 8 feet from the dust sensor and not actively being used. However, when the cellular phone (actively streaming data) was placed within inches of the open dust sensor and the % R.S.D. of replicate pulses of the LED surged to ~90%. Despite best engineering attempts to shield the photodiode circuit, ambient electromagnetic interference in the photodiode circuit and external circuitry appeared to be the limiting factor to efforts to reduce noise and improve dust sensor performance. Such extreme noise caused by cell phone interference rendered the dust sensor essentially useless when active data transfer occurred in the proximity of sensor.
Improved shielding of the dust sensor, connecting cable, and associated circuitry was then pursued. Aluminum tape (typically used for duct work in buildings) was used to cover the dust sensor, and a braided cable covered the six connecting wires. The electronics were placed within an RF shielding enclosure (Paraben’s StrongHold Bag, US Patent 7,601,921) prior to retesting. The sensor now exhibited % R.S.D. of 2.45% when the cellular phone was 8 feet from the dust sensor and not actively being used. This represented a slight improvement from when the apparatus was not actively shielded by the end user. When the cellular phone was brought close to the dust sensor and was actively being used, the % R.S.D. of sequential LED pulses was 17.17%. While this was much higher than when the cell phone was at a greater distance, it was a significant improvement over pre-shielding levels. When the data for the actively shielded case was considered more carefully, it was noted that, even when the cellular phone was near, most data points were not visibly affected by the cellular signal. However, a small number of data points exhibited large deviation from the norm. This phenomenon is illustrated in
Figure 6C, which shows a histogram of observed data points when the dust sensor was shielded and the active phone was near. While the majority of data points produced signals consistent with a normal distribution near the mean, a minority of points were far from the norm. If these outlying data points were included in a data set they would have a substantial effect on the mean and standard deviation of the data pool. Elimination of such outlying points from a data pool as an initial quality control measure would be a viable tool for improvement of Sharp dust sensor signals (vide infra).
Nonetheless, the results of
Figure 6 clearly indicate that Sharp dust sensor signals can be highly impacted by ambient electromagnetic interference, and efforts to properly shield the sensors, connecting cables, circuitry, and Arduino microprocessor should be undertaken when developing measurement systems. This is particularly important to note since there is high interest in using Sharp dust sensors to make portable measurements and stream data through Bluetooth, WiFi, or cellular technology. Differences in electromagnetic interference at different points in space and time may yield false signals and measurement errors.
3.9. Frequency of Noise Observed in Sharp Dust Sensor Signals
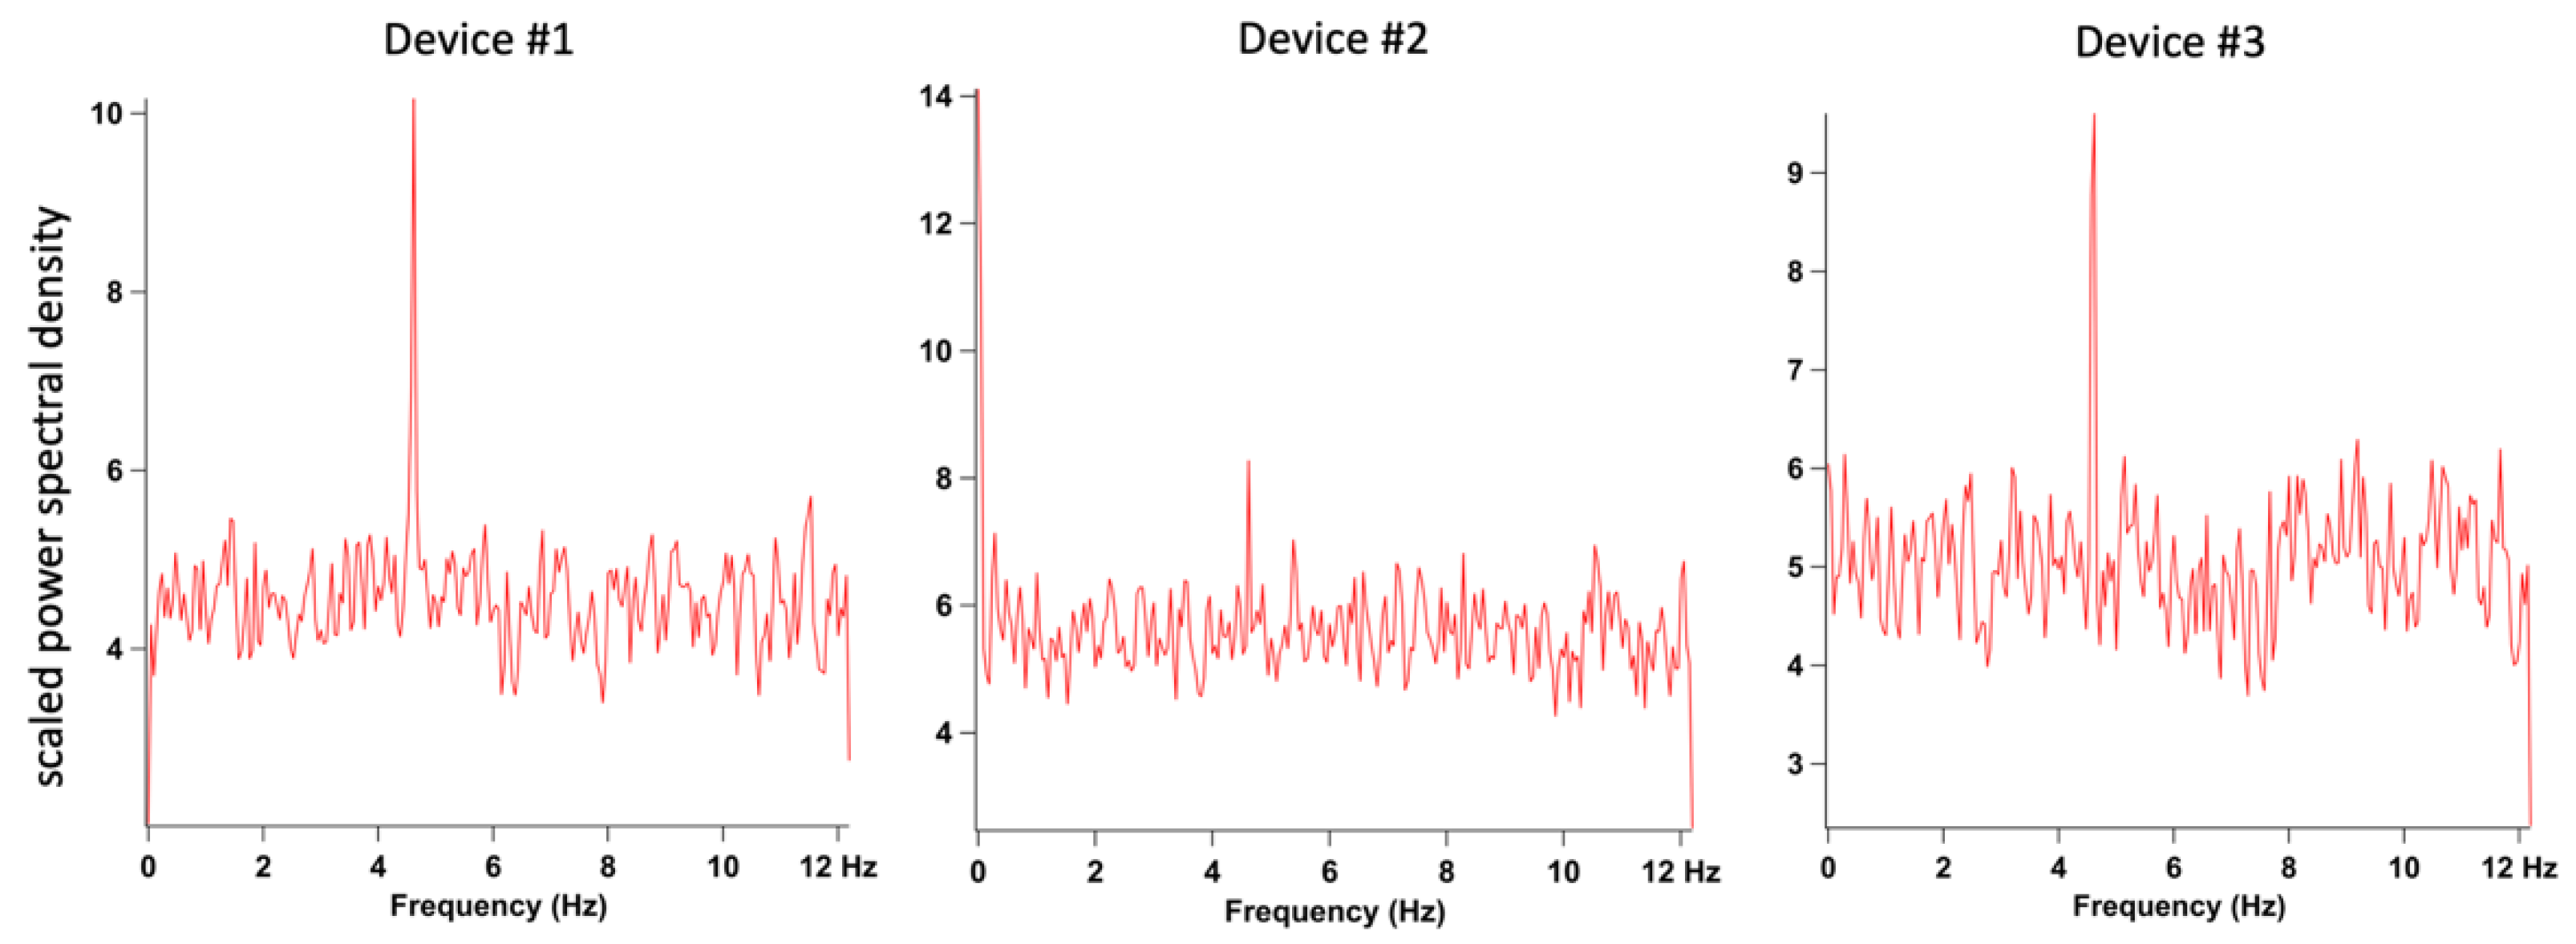
Three separate dust sensors were plugged into an identical shielded power and data acquisition circuit running the dust sensor code for acquisition of a single data point at a sampling frequency of 24.4 Hz. Data were collected for twenty minutes and a noise power spectrum of resultant data was obtained. Results of this analysis are illustrated in
Figure 7 below.
All dust sensors illustrated a minor interference noise present at approximately 4.6 Hz. The origin of this interference noise is not known. Low frequency 1/f noise was only apparent in dust sensor 2, which exhibited a minor drift over time. Indeed, one advantage of LED and photodiode circuits is their inherent stability and resistance toward drift. Other than the noise at 4.6 Hz, the dust sensor noise presented as random and was present at all frequencies rather equally (white noise). This result suggested that signal averaging could be effective at improving S/N for Sharp dust sensors. Indeed, this approach was employed in the next section of the manuscript—with success.
3.10. Effect of Signal Averaging
The results presented in the previous section suggested that signal averaging would lead to reduction of noise and improved limits of detection for Sharp dust sensors. However, inclusion of outlying data in the data stream would introduce an unacceptable systematic error. In recent years, a significant amount of attention has been invested in detection of outlying points within streaming and dynamic data sets [
43,
44,
45]. Rapid and accurate detection of outlying events is crucial in many fields, including detection of fraud, network intrusion, health and safety monitoring, and environmental monitoring. Detection of outliers can be challenging for dynamic data streams which are expected to continuously change values. A sliding time-window based approach [
46] has been advocated previously, in which a sample of recent dynamic data is kept in memory and used as a reference to decide whether subsequent points are outliers. Another approach to eliminate outliers is median filtering. In median filtering, several replicate data are collected and the median is computed. Only the data set median is reported for subsequent data analysis. Median filtering offers the ability to prescreen data points for very high or low values which would impact computation of the mean. An outlier, by its very nature, would not be selected as data set median, and therefore, would be pruned from the data set without further consideration.
With regards to dust sensors, a time-efficient and simple computational approach is desirable. Median filtering can be carried out in Arduino sketches, and example code is available online using what is termed a bubble sort approach. This scheme uses nested loops to order an array of numbers from small to large. Then, the code selects the middle member of the array as the median. In use, an odd number of data points should be accumulated from subsequent LED pulses. After medians are selected, a separate pool (array) of these median values can be collected and averaged using a second program loop. Averaging medians maintains the S/N enhancement allowed by signal averaging while helping to protect against inclusion of spurious data.
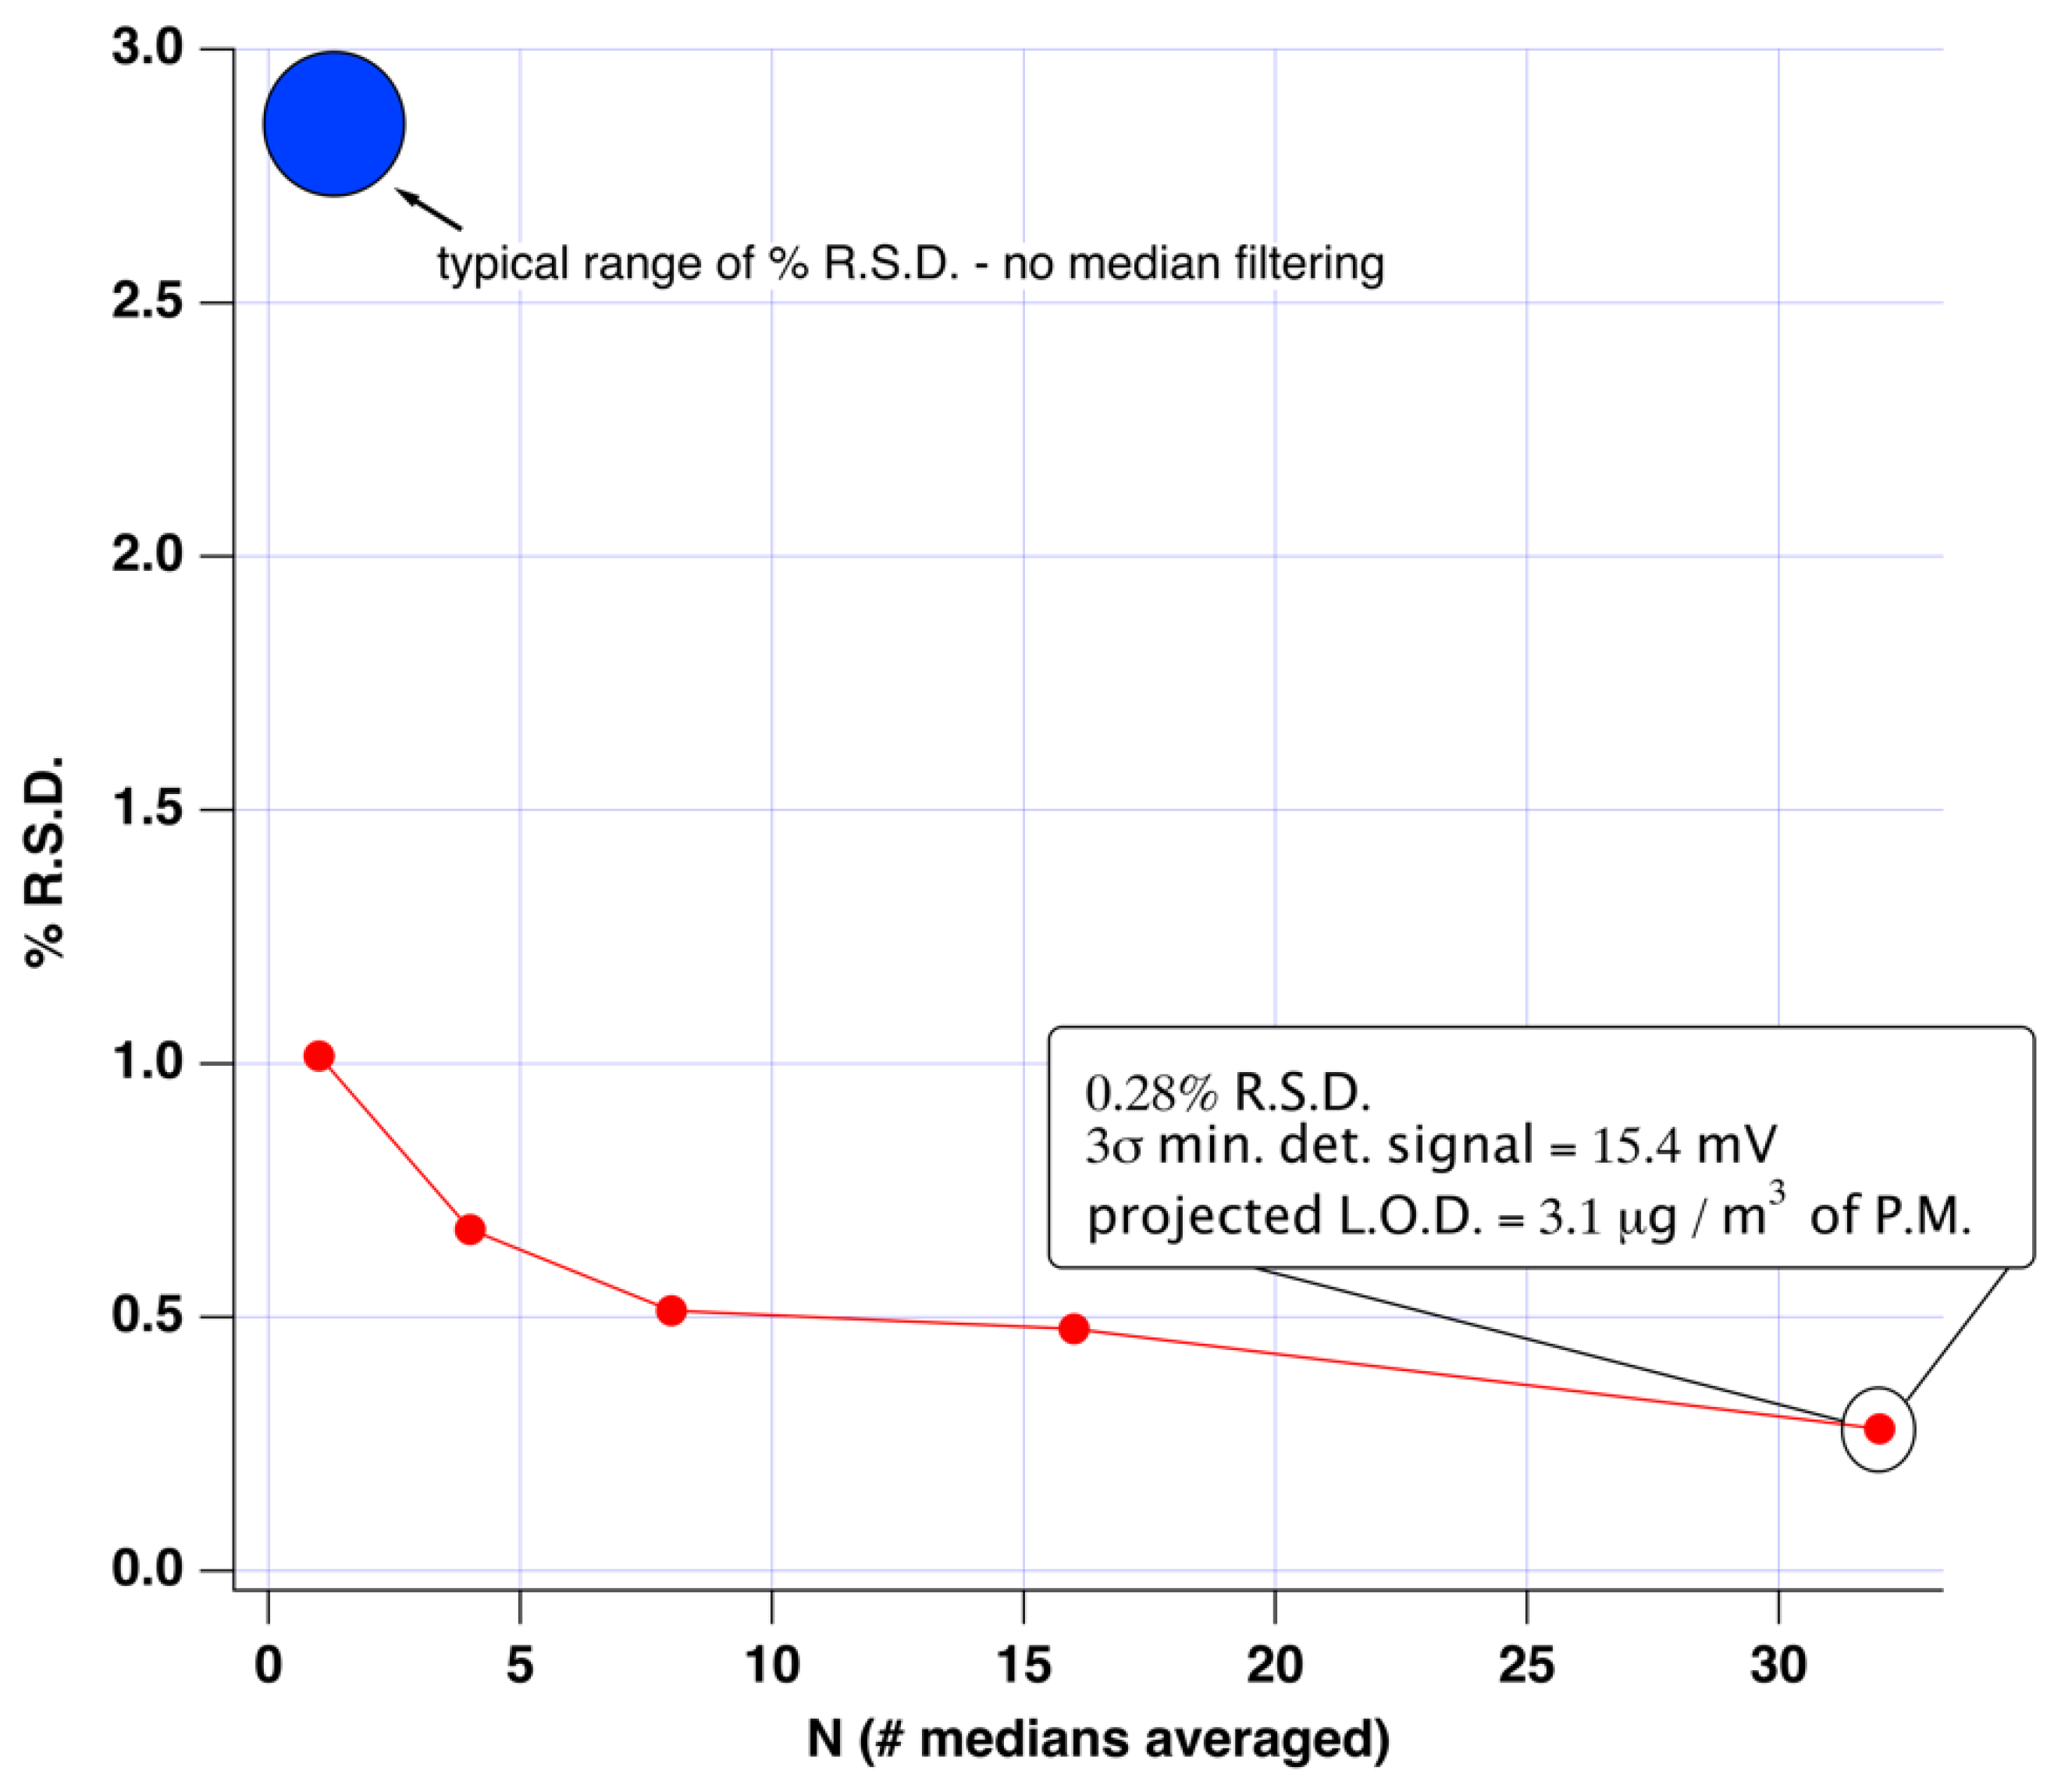
For this work, an Arduino code was employed which sampled 5 LED pulses and selected the median value using the bubble sort approach. The intra-pulse delay time was set at 40 ms to maintain bright LED pulses and minimize pulse-to-pulse variability. A separate loop was used in the software to acquire N medians from 5N LED pulses, and the resulting N medians could then be averaged to improve signal-to-noise ratio (S/N).
Figure 8 illustrates noise reduction achieved when N = 1 thru 32 was explored. It was found that N = 32 required approximately 4 s for data acquisition.
Through averaging a relatively small number of medians, the standard deviation of replicate data points (noise) was reduced substantially. When N = 32 medians were averaged, noise was reduced by an order of magnitude compared to pulse-to-pulse analysis. Of course, this gain required additional measurement time; however, the 4 s time required was deemed adequate for tracking ambient exposure. When N = 32 medians were averaged, the % R.S.D. was reduced to 0.28% and the 3σ
blank minimum detectable electric signal was 15.4 mV. Use of the dust sensor product literature and specified sensitivity of 0.5 V per 100 μg m
−3 [
46] allowed for conversion to a 3σ
blank noise equivalent limit of detection for particulate matter of 3.1 μg m
−3. This improved projected limit of detection should allow for more accurate estimates of human exposure to PM to be acquired when such devices are employed.
4. Conclusions
Sharp dust sensors have become widely employed for IoT-style monitoring of ambient air quality. This work outlined how to improve dust sensor performance by optimizing the resistor and capacitor in the external circuit, darkening the dust sensor’s internal chamber with paint, emphasizing shielding of the dust sensor and circuit, and finally, signal averaging. Optimization of these parameters allowed demonstration of a noise equivalent limit of detection of 3 μg m−3 for detecting PM.
This manuscript also described improved data acquisition (at a higher sampling rate), presented noise power spectra for the dust sensors, and offered a thorough description of the dust sensor’s construction and internal circuit. The results reported herein presented the case that the majority of the noise that limited the dust sensor performance originated in the photodiode detection circuitry and not the LED. The results of this manuscript will empower improved future measurements using the Sharp family of dust sensors and offer improved IoT monitoring.
