
Experimenting with Odour Proficiency Tests Implementation Using Synthetic Bench Loops


Abstract
1. Introduction
2. Materials and Methods
2.1. General
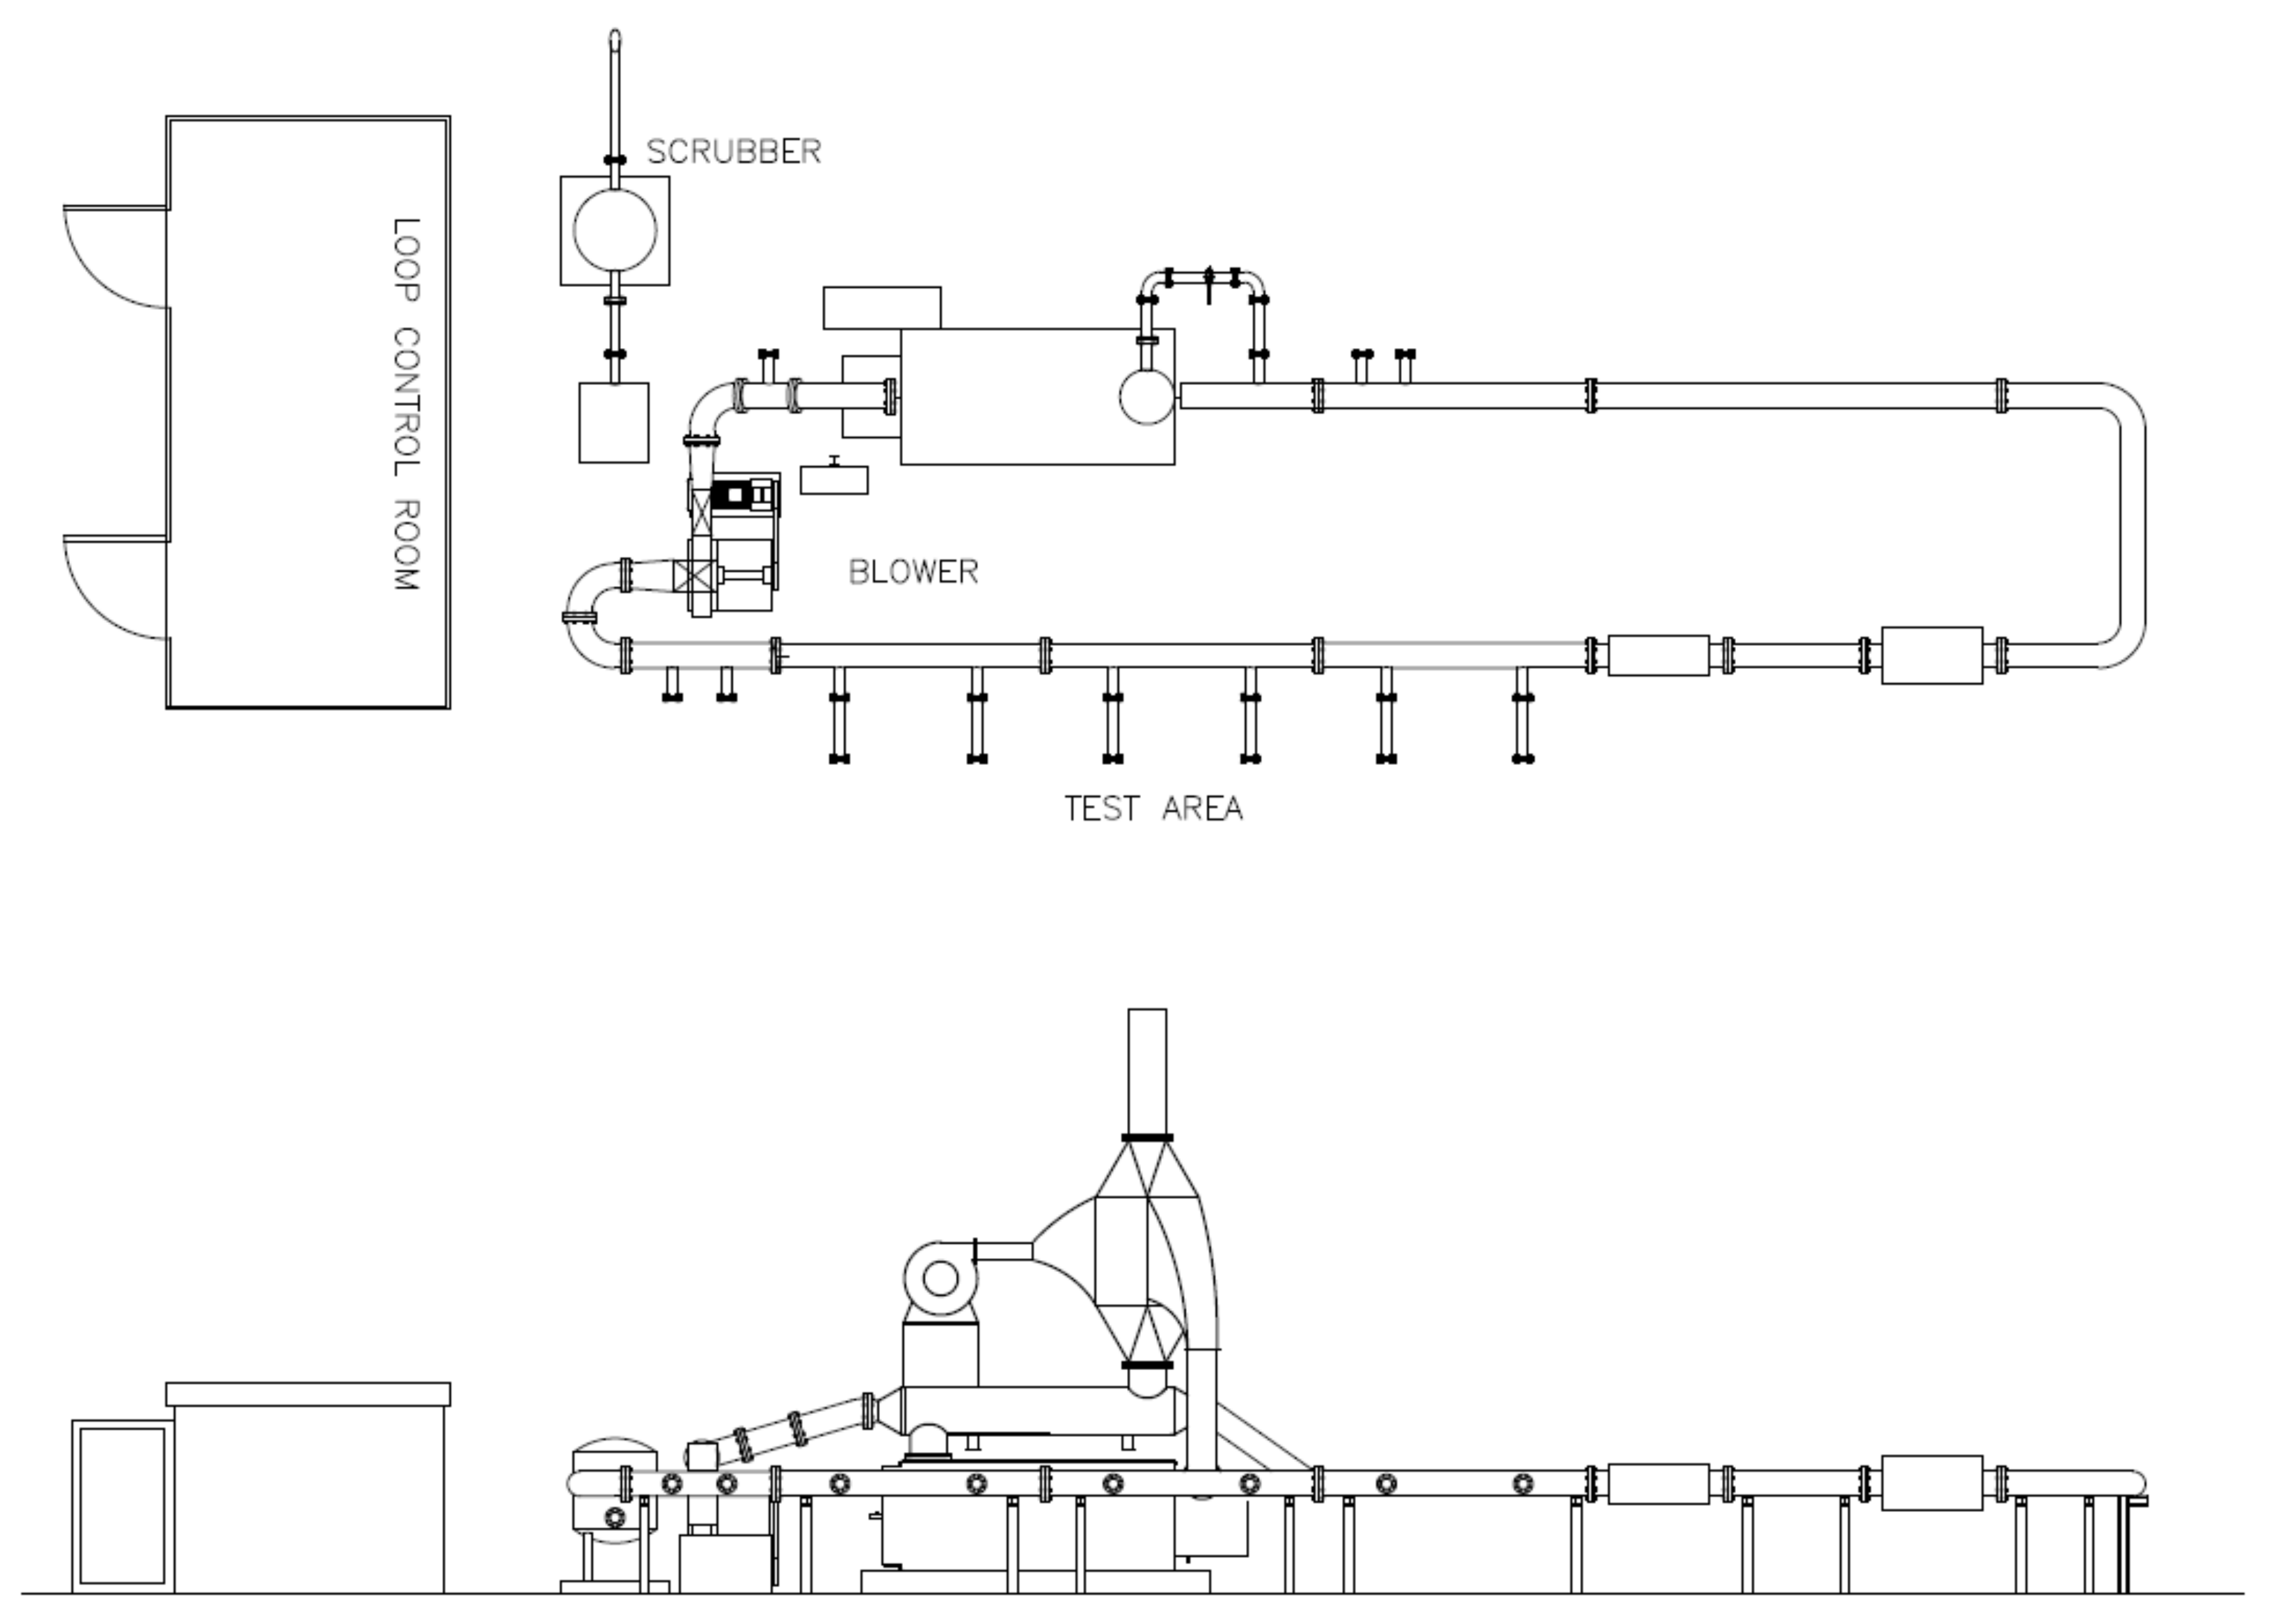
2.2. The Bench Loop
- Total length of the wind gallery tunnel: about 40 m.
- Internal diameter of the tunnel: 273 mm.
- Internal material: AISI 316.
2.3. The Vaporisation System
2.4. Reference Value
2.5. Vaporisation Temperature
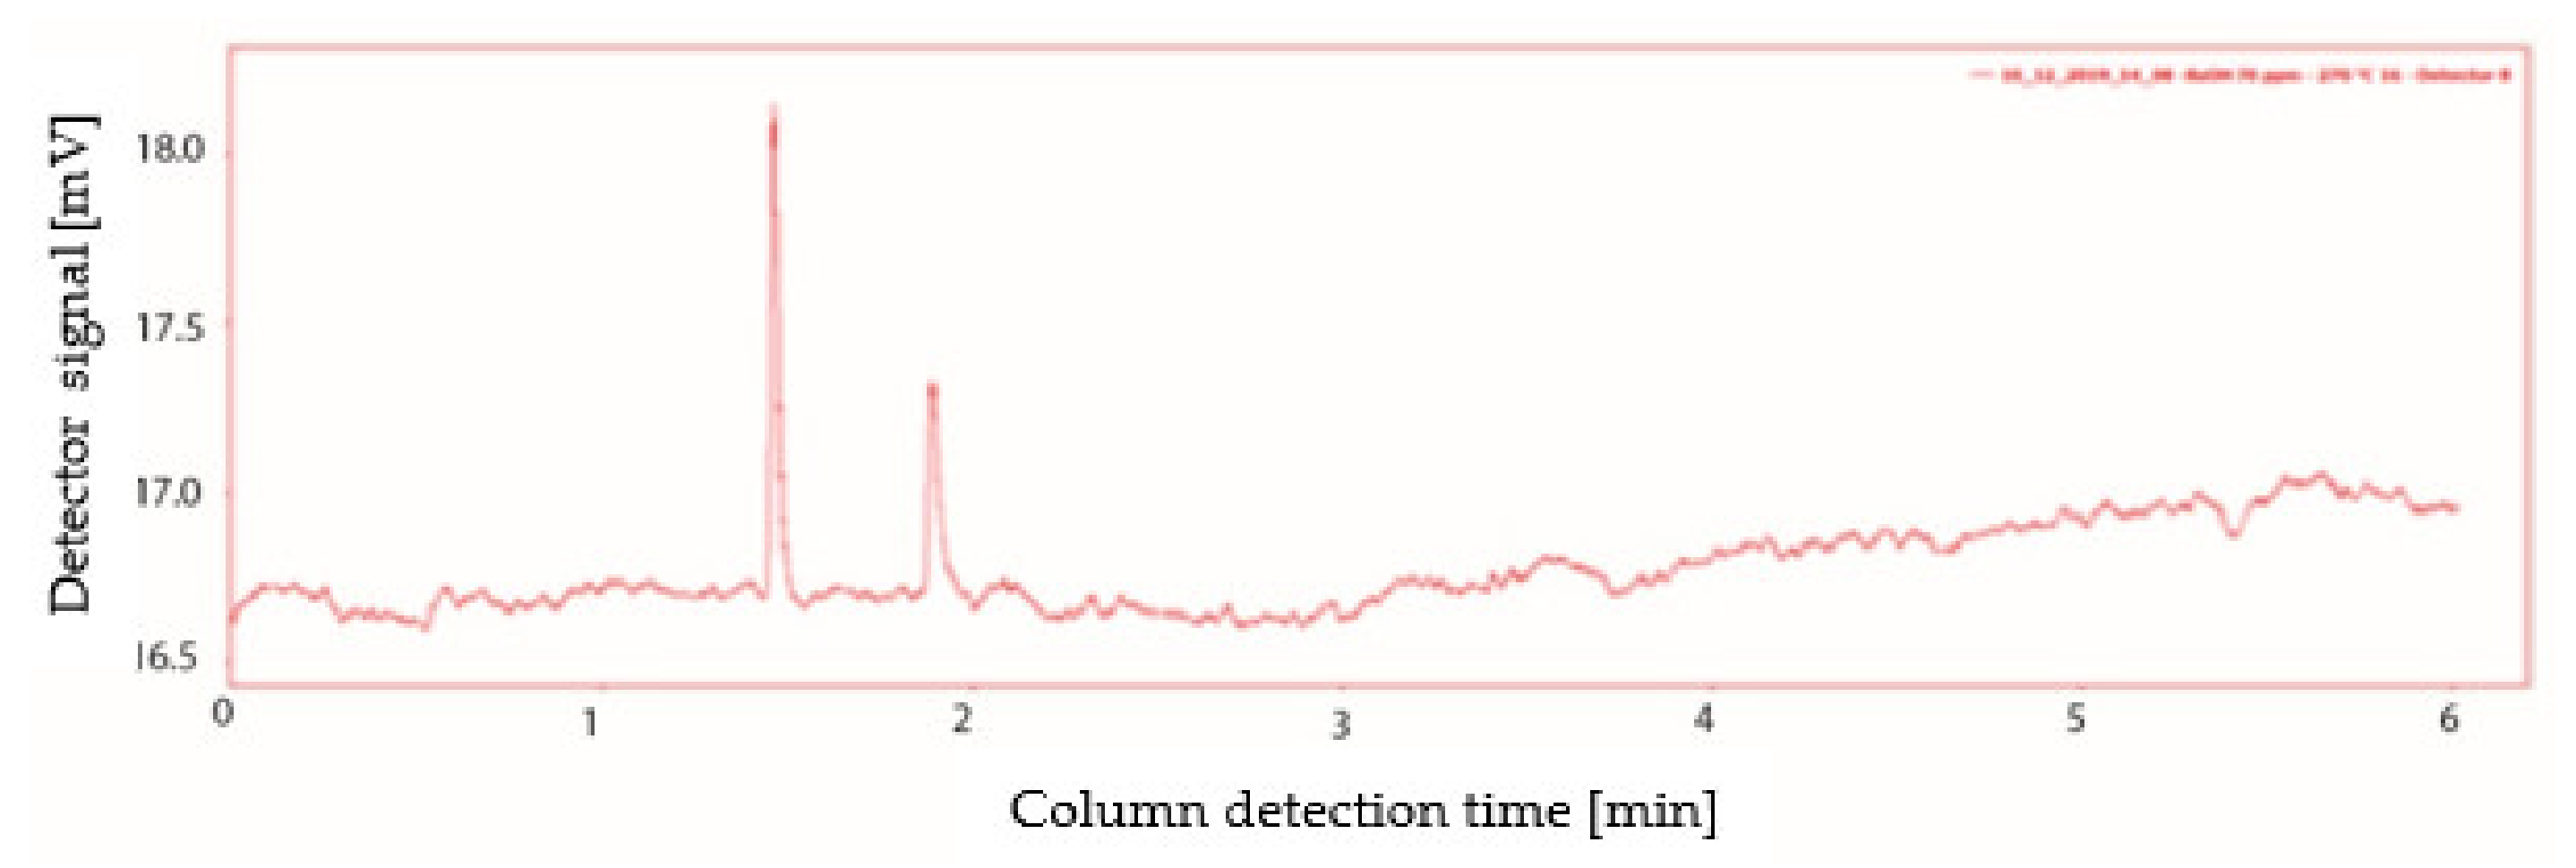
- A peak with the characteristic retention time of n-butanol, 1.89 min, but with a lower peak area than expected;
- A peak with a lower retention time then that characteristic of n-butanol, equal to 1.46 min.
3. Results
3.1. Execution of the Tests
- n-Butanol concentration value, expressed in ppm;
- Odour concentration value, expressed in ouE/m3.
3.2. Measurement Uncertainties
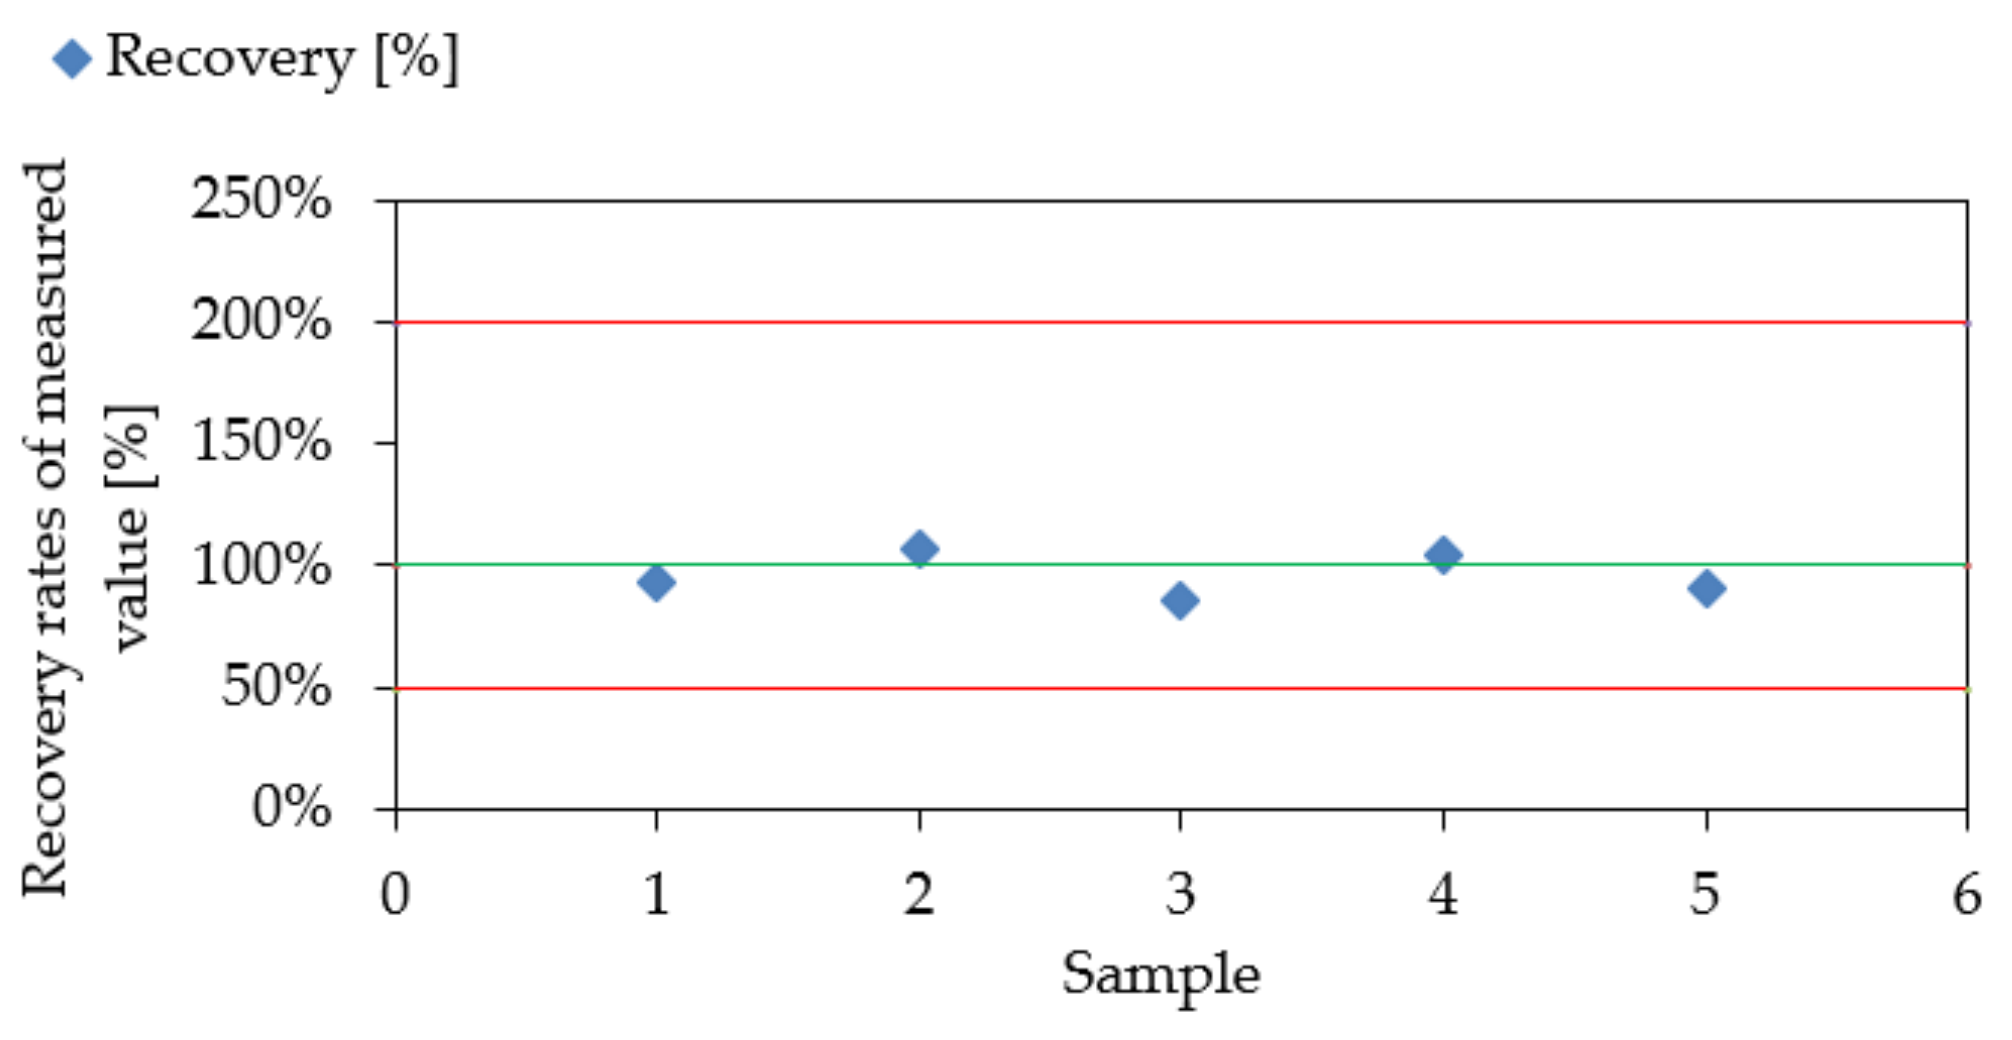
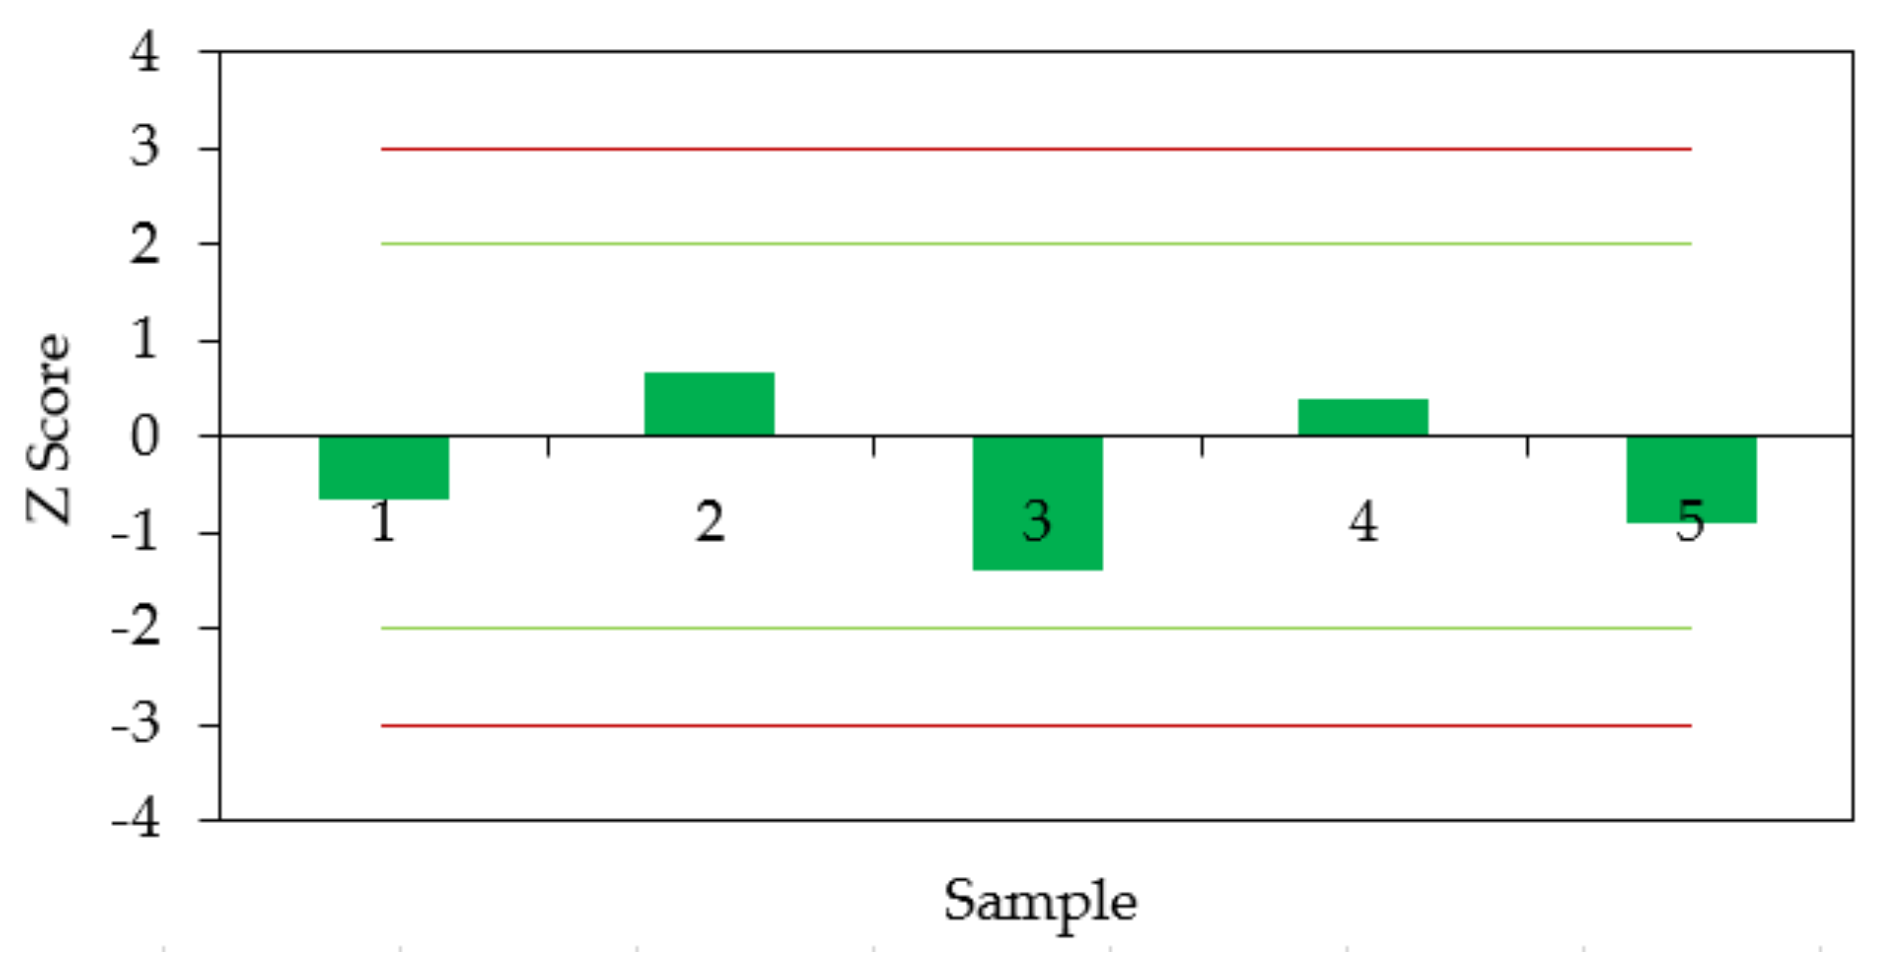
3.3. Experimental Results
4. Conclusions
Author Contributions
Funding
Institutional Review Board Statement
Informed Consent Statement
Data Availability Statement
Conflicts of Interest
References
- CEN. EN13725, Air Quality-Determination of Odour Concentration by Dynamic Olfactometry and Odour Emission Rate from Stationary by Sources; CEN: Brussels, Belgium, 2004. [Google Scholar]
- Freeman, T.; Needham, C.; Schulz, C. CH2M BECA Analysis of Options for Odour Evaluation for Industrial or Trade Processes; Auckland Regional Council CH2M BECA Ltd.: Auckland, New Zealand, 2000. [Google Scholar]
- Gwynne, C.; Philips, L.; Turner, N.; Goldstone, M. Temporal and Spatial Variability of Odours at Wastewater Plants in Western Australia; Water Corporation: Melbourne, Australia, 2001. [Google Scholar]
- Van Harreveld, A.P.; Heeres, P. The validation of the draft European CEN standard for dynamic olfactometry by an interlaboratory comparison on n-butanol. Gefahrst. Reinhalt. Luft 1997, 57, 393–398. [Google Scholar]
- Ramsdale, S.L.; Baillie, C.P. Interlaboratory test program: Odour detection threshold for hydrogen sulphide. J. Clean Air Soc. Aust. N. Z. 1996, 30, 36–37. [Google Scholar]
- Defoer, N.; Van Langenhove, H. Variability and repeatability of olfactometric results of n-butanol, pig odour and synthetic gas mixture. Water Sci. Technol. 2004. [Google Scholar] [CrossRef]
- Clanton, C.J.; Schmidt, D.R.; Nicolai, R.E.; Goodrich, P.R.; Jacobson, L.D.; Janni, K.A.; Weisberg, S.; Buckel, J.A. Dynamic olfactometry variability in determining odor dilutions-to-threshold. Trans. ASAE 1999, 42, 1103–1112. [Google Scholar] [CrossRef]
- Stöckel, S.; Cordes, J.; Stoffels, B.; Wildanger, D. Scents in the stack: Olfactometric proficiency testing with an emission simulation apparatus. Environ. Sci. Pollut. Res. 2018, 25, 24787–24797. [Google Scholar] [CrossRef] [PubMed]
- Cipriano, D.; Fialdini, L. Definition of reference values in synthetic emission monitoring bench loop. Accredit. Qual. Assur. 2018. [Google Scholar] [CrossRef]
- ISO. ISO Guide 35, Reference Materials—Guidance for Characterization and Assessment of Homogeneity and Stability; ISO: Geneva, Switzerland, 2017. [Google Scholar]
- ISO. ISO/IEC 17043, Conformity Assessment-General Requirements for Proficiency Testing; ISO: Geneva, Switzerland, 2010. [Google Scholar]
- Van Harreveld, A.P.; Heeres, P. Quality control and optimization of dynamic olfactometry using n-Butanol as a standard reference odorant. Staub Reinhalt. Luft 1995, 55, 45–50. [Google Scholar]
- JCGM. GUM Guide to the Expression of Uncertainty in Measurement; JCGM: Geneva, Switzerland, 2008. [Google Scholar]
- EURACHEM/CITAC. Measurement Uncertainty Arising from Sampling—A Guide to Method and Approaches, 2nd ed.; EURACHEM: Teddington, Middlesex, UK, 2019. [Google Scholar]
- ISO. ISO 13528 (2015), Statistical Methods for Use in Proficiency Testing by Interlaboratory Comparison; ISO: Geneva, Switzerland, 2015. [Google Scholar]


| Sample | Tvap (°C) | CbuOH Expected (ppm) | CbuOH Measured (1) (ppm) |
|---|---|---|---|
| 1 | 270 | 23.04 | 14.30 |
| 2 | 270 | 38.17 | 5.69 |
| 3 | 270 | 76.03 | 15.22 |
| 4 | 270 | 76.03 | 30.33 |
| 5 | 270 | 78.35 | 37.01 |
| 6 | 270 | 154.29 | 55.61 |
| 7 | 140 | 24.62 | 18.02 |
| 8 | 140 | 74.27 | 74.74 |
| 9 | 140 | 77.99 | 85.52 |
| 10 | 140 | 150.82 | 141.74 |
| Sample | CbuOH Expected (ppm) | CbuOH Measured (ppm) | Cod Expected (ouE/m3) | Cod Measured (ouE/m3) | Confidence Interval |
|---|---|---|---|---|---|
| 1 | 23.23 | 18.66 | 580 | 542 | 262–1084 |
| 2 | 40.67 | 36.81 | 1016 | 1085 | 543–2170 |
| 3 | 56.57 | 56.94 | 1414 | 1218 | 609–2436 |
| 4 | 74.36 | 69.52 | 1859 | 1934 | 495–1934 |
| 5 | 106.92 | 102.24 | 2673 | 2436 | 609–2436 |
Publisher’s Note: MDPI stays neutral with regard to jurisdictional claims in published maps and institutional affiliations. |
© 2021 by the authors. Licensee MDPI, Basel, Switzerland. This article is an open access article distributed under the terms and conditions of the Creative Commons Attribution (CC BY) license (https://creativecommons.org/licenses/by/4.0/).
Share and Cite
Cipriano, D.; Cefalì, A.M.; Allegrini, M. Experimenting with Odour Proficiency Tests Implementation Using Synthetic Bench Loops. Atmosphere 2021, 12, 761. https://doi.org/10.3390/atmos12060761
Cipriano D, Cefalì AM, Allegrini M. Experimenting with Odour Proficiency Tests Implementation Using Synthetic Bench Loops. Atmosphere. 2021; 12(6):761. https://doi.org/10.3390/atmos12060761
Chicago/Turabian StyleCipriano, Domenico, Amedeo M. Cefalì, and Marco Allegrini. 2021. "Experimenting with Odour Proficiency Tests Implementation Using Synthetic Bench Loops" Atmosphere 12, no. 6: 761. https://doi.org/10.3390/atmos12060761
APA StyleCipriano, D., Cefalì, A. M., & Allegrini, M. (2021). Experimenting with Odour Proficiency Tests Implementation Using Synthetic Bench Loops. Atmosphere, 12(6), 761. https://doi.org/10.3390/atmos12060761