Article

On the Relationship between Circulation Patterns, the Southern Annular Mode, and Rainfall Variability in Western Cape

by
Chibuike Chiedozie Ibebuchi
Institute of Geography and Geology, University of Würzburg, Am Hubland, 97074 Würzburg, Germany
Atmosphere 2021, 12(6), 753; https://doi.org/10.3390/atmos12060753
Submission received: 24 May 2021 / Revised: 8 June 2021 / Accepted: 9 June 2021 / Published: 10 June 2021
(This article belongs to the Section Meteorology)

Abstract

:
This study investigates circulation types (CTs) in Africa, south of the equator, that are related to wet and dry conditions in the Western Cape, the statistical relationship between the selected CTs and the Southern Annular Mode (SAM), and changes in the frequency of occurrence of the CTs related to the SAM under the ssp585 scenario. Obliquely rotated principal component analysis applied to sea level pressure (SLP) was used to classify CTs in Africa, south of the equator. Three CTs were found to have a high probability of being associated with wet days in the Western Cape, and four CTs were equally found to have a high probability of being associated with dry days in the Western Cape. Generally, the dry/wet CTs feature the southward/northward track of the mid-latitude cyclone, adjacent to South Africa; anti-cyclonic/cyclonic relative vorticity, and poleward/equatorward track of westerlies, south of South Africa. One of the selected wet CTs was significantly related to variations of the SAM. Years with an above-average SAM index correlated with the below-average frequency of occurrences of the wet CT. The results suggest that through the dynamics of the CT, the SAM might control the rainfall variability of the Western Cape. Under the ssp585 scenario, the analyzed climate models indicated a possible decrease in the frequency of occurrence of the aforementioned wet CT associated with cyclonic activity in the mid-latitudes, and an increase in the frequency of the occurrence of CT associated with enhanced SLP at mid-latitudes.

1. Introduction

The Southern Annular Mode (SAM) is a low-frequency mode of atmospheric variability of the southern hemisphere. The SAM is characterized by a zonally symmetric north–south movement of the westerly belt that encircles Antarctica [1]. Its positive phase features a southward shift of the westerly belt, enhanced mean sea level pressure (SLP) in the mid-latitudes, and lower SLP in the high latitudes; the opposite occurs during its negative phase. According to [2], the existence of the SAM is mostly due to internal atmospheric dynamics. North–south migration of storm tracks in the southern hemisphere, which is related to sea surface temperature (SST) variability [3] and mid-latitude precipitation variability [4], is associated with variations of the SAM [5]. According to [6], variations of the SAM can also influence ocean circulation.
Ref. [7] reported that variability of the SAM on an inter-annual time scale is partly related to the El Niño Southern Oscillation (ENSO) during the austral summer; the negative SAM is related to El Niño and the positive SAM to La Niña. Ref. [8] noted that the positive phase of ENSO, which increases the global mean sea surface temperature, contributes to the negative phase of SAM. According to [9], during austral summer, about 25% of the variance of the SAM is related to ENSO variations. Thus, [10] explained that the SAM index reflects the superposition of both high-latitude and tropically forced variability.
Under global warming, the SAM is projected to undergo a trend towards positive polarity during austral summer, due to an increase in greenhouse gas concentrations and stratospheric ozone depletion [11]. Ref. [12] also reported that since the fifteenth century, the SAM has undergone a progressive shift towards its positive phase, leading to the warming of the Antarctic Peninsula.
The SAM which accounts for about 20–30% of the total monthly SLP variability, south of 20° S [1], is equally associated with cold fronts and storms which move from west to east [13]. Studies have investigated the relationship between variations of the SAM and regional land-based precipitation variability of Australia [4,13] and the western parts of South Africa [14,15]. Ref. [14] found that negative SAM correlates with wet conditions over western South Africa, and vice versa for positive SAM. Some regions in the Western Cape are characterized by the Mediterranean type of climate; therefore, the SAM is expected to influence the patterns of atmospheric circulation that control the rainfall variability of the region. Moreover, the region has experienced years of decreased rainfall [16], and variations of the SAM might further increase the vulnerability of the region, making deeper understanding of the hydroclimate of the region necessary, to enhance the predictability of rainfall in the region.
Using a self-organizing map (SOM), [17] investigated the link between the inter-annual variability of seasonal rainfall over the Cape South Coast of South Africa and circulation types. Compared to hard clustering algorithms (e.g., K-means clustering), the SOM performs relatively better in synoptic classifications because it can generate non-linear classifications [18]. However, given that atmospheric circulation is a continuum, the probability of group membership is an important factor which contributes to the relatively high accuracy of synoptic classifications; this is achieved by (fuzzy) classification schemes (e.g., rotated principal component analysis (PCA)) that enable overlapping of the classified variable [19,20,21]. When applied to a climatic field represented in the T-mode structure (i.e., the variable is time series and the observation is grid points), rotated T-mode PCA has proven to be a useful tool in circulation typing [22,23,24,25]. According to [25], “T-mode PCA proved to be a useful tool for extracting and reproducing the circulation types, quantifying their frequency and showing the dominant weather periods in them”. The added values of this work are (i) the application of a fuzzy clustering scheme at a larger domain to investigate CTs related to wet and dry conditions in the Western Cape and if any of the CTs relates to the SAM; and (ii) the analysis of changes in the annual frequency of occurrence of the CTs related to the SAM using CMIP6 GCMs for the updated ssp585 scenario. Thus, using a circulation typing technique known to reproduce the synoptic situations in a study region, for the separation of wetting and drying signals in the Western Cape, and relating the signals to the SAM, this work strengthens existing studies [16,26,27,28] on addressing the dynamics associated with rainfall changes in the Western Cape under the current climate and under future climate change, using the current ssp585 scenario.

2. Data and Methods

SLP, relative vorticity and wind vector at 850 hPa datasets were obtained from ERA5 reanalysis [29]. The horizontal resolution of the datasets was 0.25° longitude and latitude, and the temporal resolution was daily from 1979 to 2020. A gridded precipitation dataset was obtained from the Climate Prediction Centre (CPC) [30] at a horizontal resolution of 0.5° longitude and latitude. Station data over the Western Cape were obtained from http://www.dwa.gov.za/Hydrology/Verified/hymain.aspx (accessed on 14 April 2021). The temporal resolution of the precipitation datasets was daily from 1979 to 2020. Quality-controlled station data over the Western Cape for the 1979–2020 period are sparsely distributed; therefore, the station data were used to validate daily rainfall estimates from CPC over the Western Cape for the 1979–2020 period. SLP datasets were obtained from two CMIP6 general climate models (GCMs), which were pre-selected due to their capability to simulate the statistical properties of interest of the CTs related to the SAM. The GCMs are MPI-ESM-LR and EC-EARTH3-CC. The SLP datasets were obtained for the historical experiment (1979–2014) and the ssp585 scenario (2050–2100), which is an update of the RCP8.5 scenario and is characterized with emissions high enough to produce the 8.5 W / m 2 level of forcing in 2100.
The spatial extent for circulation typing is 0–50.25° S and 4° E–55.25° E. The inclusion of the tropics is based on the findings of [31], that SST forcing at the tropics during austral summer can impact the SAM by modifying the planetary waves and the mid-latitude jet. Additionally, the adjacent oceans surrounding southern African landmasses act as moisture sources [32]; thus, they were included to the spatial extent that inshore moisture transport is plausible. The selected target region captures the major rain-bearing synoptic systems in the study domain such as the northeast cross-equatorial trade winds, the semi-permanent high-pressure system, the Angola low, the mid-latitude cyclones (during its northward track), the Mozambique Channel trough, etc.
Obliquely rotated PCA [22] was used to classify the CTs in the study region. It was applied to the T-mode matrix of daily z-score standardized SLP dataset from 1979 to 2020. The SLP dataset, according to [33], provides a good representation of synoptic-scale systems and explains the relationship between topography and low-level flow. Additionally, [33] found that between 1000 hPa to 500 hPa, the choice of the level to use in the classification has little influence on the explanation of surface variables. According to [25], “The T-mode analysis can lead to the determination of frequent synoptic situations, improving the basic knowledge essential to weather forecasting, among other things. The application of such a tool to a wide range of processes, ranging from the daily synoptic developments to the monthly or annual mean developments is valuable for an ample set of atmospheric processes, including both daily variability and climate fluctuations and change”. Thus, in addition to the usefulness of this clustering approach to reproduce synoptic situations known a priori in a given domain and quantifying their frequency of occurrence and dominant periods, its applicability in studying climate fluctuations and change makes it a good candidate for the study purpose, because the classification scheme is also applied to GCMs under the historical and future climate change scenario.
The time series were related using the correlation matrix, and singular value decomposition was used to obtain the eigenvalues and the eigenvectors. The eigenvectors localize in time the spatial patterns captured by the scores. The eigenvectors are weighted with the square root of their corresponding eigenvalues, which makes them longer than one unit in length, henceforth referred to as loadings [34]. The number of components to retain is based on the recommendation of [35], on the separation of the eigenvalues and sensitivity analysis. The sensitivity analysis ensures that after components with typically high and separated eigenvalues were retained, the addition of a further component uncovers a new input pattern that has not been delineated by previous vectors [22]. This was assessed by rotating the components iteratively and assessing the goodness of match based on the congruence coefficient between the vectors, and visual inspection of the map patterns [36,37]. The oblique rotation, performed at a power of 2 with Promax, relaxes the orthogonality constraint, and maximizes the number of near-zero loadings so that each retained component clusters unique days with a similar input pattern [23]. To enhance the coherency between the weather patterns clustered under each class, a subjective threshold of ±0.2 [38] was used to further cluster the loading in each retained component to negative high loadings and positive high loadings so that each retained component formed two classes. The mean SLP for the days clustered under each class was the CT. Detailed justifications of all the subjective decisions followed in the classification process and the fuzziness of the approach are explained in detail by [21].
The probability of each CT to bring dry days (daily rainfall amount < 1 mm) or wet days (daily rainfall amount > 1 mm) across each grid in the Western Cape was assessed using Equations (1) and (2).
P d i = d i N i × 100           i = 1 n
P w i = w i N i × 100           i = 1 n
P d i   is the percentage of dry days for a given CT; d i is the total number of dry days for the CT in question; and N i is the total number of days clustered under a given CT. P w i is the percentage of wet days in a given CT, w i is the total number of wet days for the CT in question, and n is the number of CTs classified.
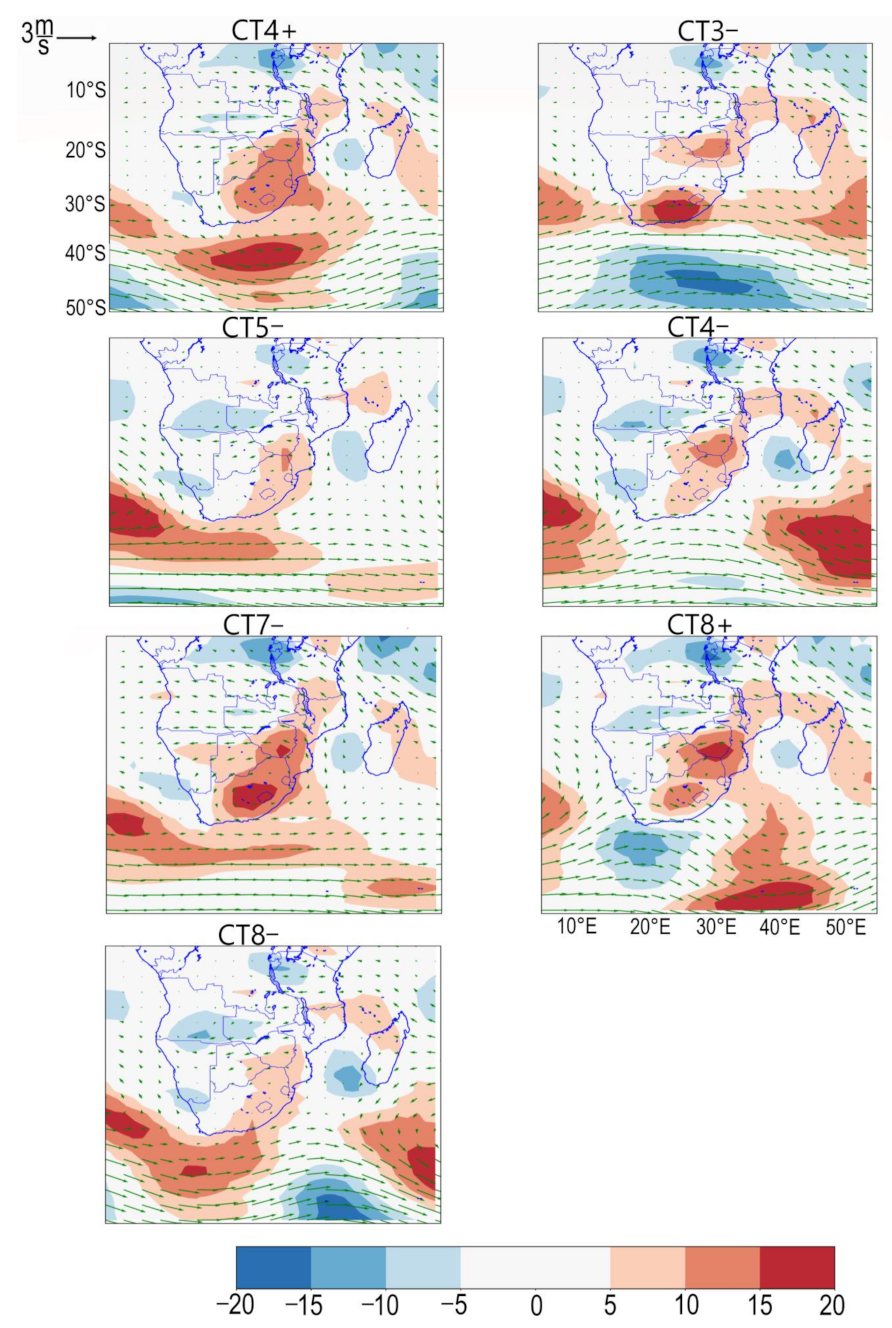
CTs are naturally fuzzy and overlap; therefore, a given CT is not confined to occur at a specific season. However, the seasonality of CTs that are selected to have a high probability of bringing wet days or dry days across the majority of the grid points in the Western Cape was analyzed to uncover whether the CTs tended to be dominant at a specific season(s). The dominant period of a given CT is equally when its signal is most likely to be well expressed due to its persistence for a longer period. Thus, the rainfall anomaly at each grid point for the season when the CT is most expressed was calculated with respect to the climatology of the season. The anomalies were tested for statistical significance using the non-parametric permutation test. Wind vectors and relative vorticity composites at 850 hPa were used to further analyze the operational mechanism of the CTs that related them to wet and dry days in the Western Cape. The 850 hPa height was used, because according to [39], this is the height above the interior plateau that exists over much of southern Africa.
The SAM index was obtained from https://climatedataguide.ucar.edu/climate-data/marshall-southern-annular-mode-sam-index-station-based (accessed on 14 April 2021), for the 1979–2020 period. Correlation analysis was used to relate the time series (loadings) of the CTs with a higher probability to bring dry conditions and wet conditions in the Western Cape, and the SAM index. Statistical significance of the relationship was assessed at a 95% confidence level using the non-parametric Kendall–Tau test. The trend in the annual frequency of occurrence of the CTs related to the SAM was examined under the ssp585 scenario and the statistical significance of the trend was examined using the Mann–Kendall test [40,41] for linear trends.

3. Results

3.1. Seasonal Rainfall Climatology in Western Cape

Figure 1 exemplifies the annual cycle of rainfall as observed from the station data and the counterpart grid from the CPC dataset. For all the stations analyzed, the CPC dataset captured the annual cycle of rainfall in the Western Cape. However, there was better agreement between the rainfall estimates from the two datasets for the austral spring (SON) and austral summer (DJF) months. During austral autumn (MAM) and austral winter (JJA), CPC significantly underestimated rainfall compared to the other seasons. The same pattern of the results presented in Figure 1 was obtained for all the stations analyzed (not shown). Thus, although the CPC dataset captured the annual cycle of rainfall in the Western Cape, it underestimated rainfall from austral autumn to early austral spring (September) relative to the analyzed station data.
From Figure 2, the spatial rainfall average over the western region and the northeastern region of the Western Cape exhibited strong seasonality during austral summer and austral winter. During austral summer, the western regions were drier, especially the northwestern regions. During austral winter, the southwestern regions received the highest rainfall amount, while the northwestern regions received lower levels of rainfall. Generally, during DJF (JJA), rainfall increased from west to east (east to west). During austral autumn, rainfall tended to be relatively widespread, whereas during austral spring a meridional pattern of rainfall can be seen—the northern regions were drier compared to the southern regions.

3.2. Circulation Types in Africa South of the Equator Linked to Wet and Dry Days in the Western Cape

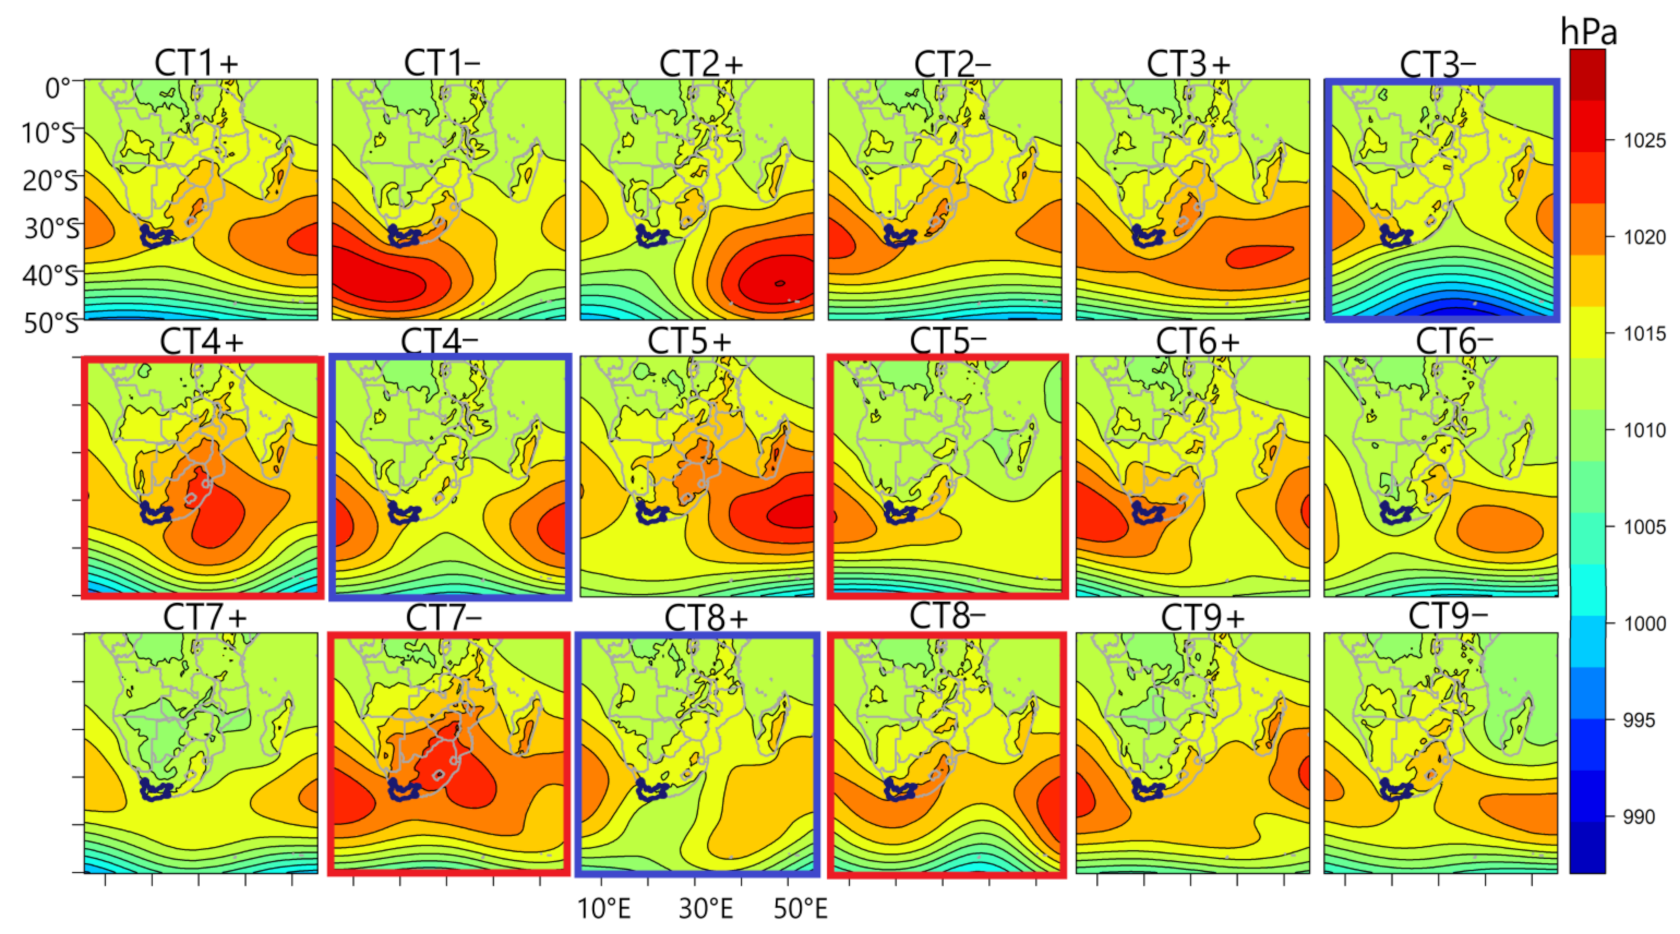
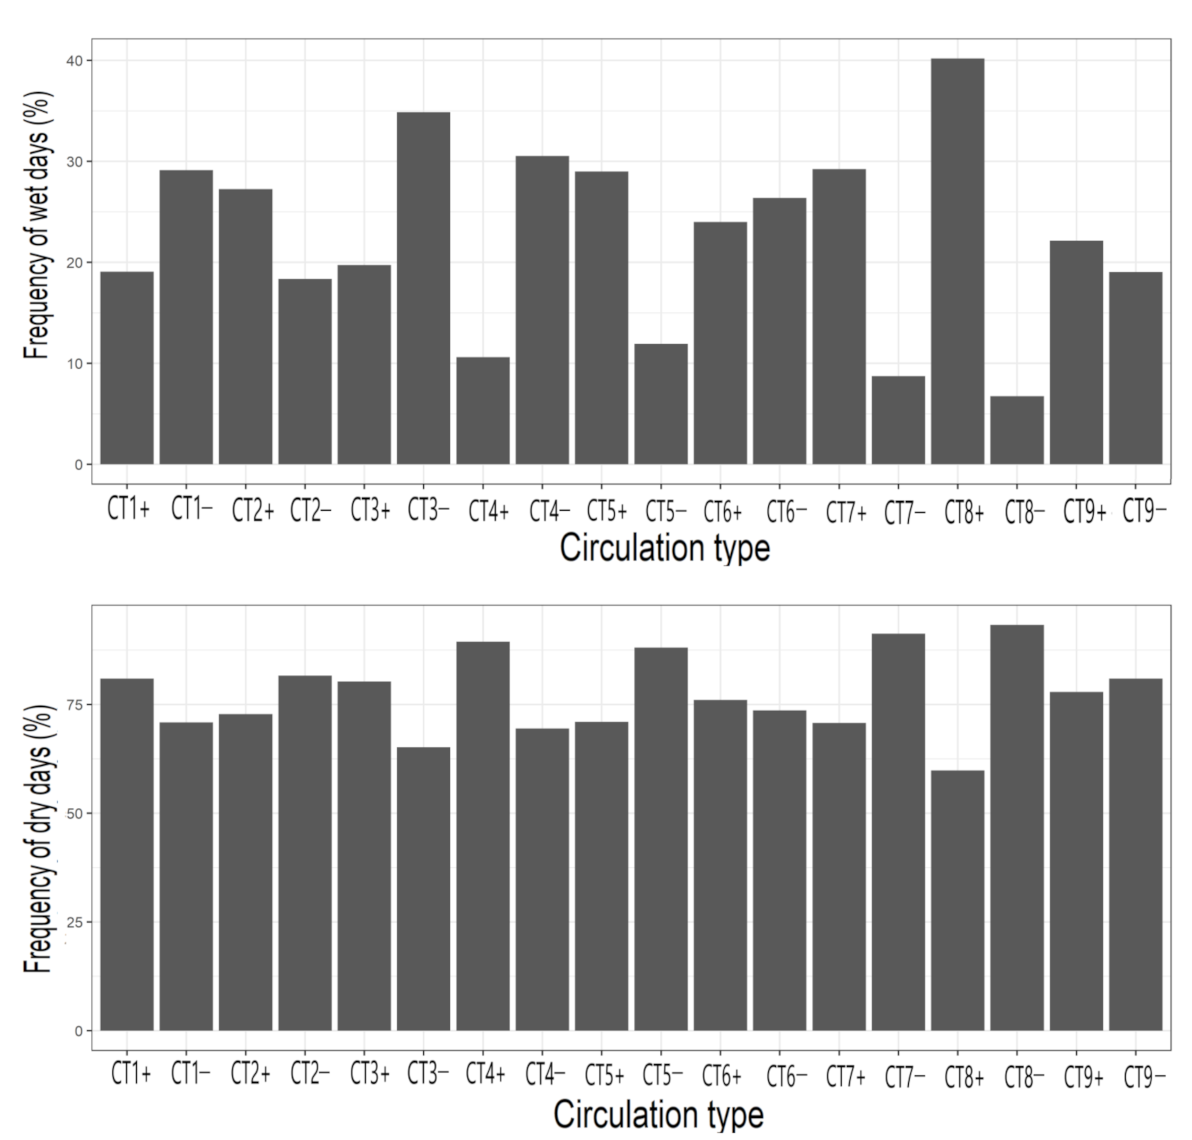
Figure 3 shows the CTs classified by retaining nine optimal components. Each retained component yielded two CTs—clusters of positive loadings and negative loadings above the 0.2 threshold. Each CT revealed a large-scale pattern of atmospheric circulation in Africa, south of the equator. Here, the focus was on CTs that are associated with wet and dry days in the Western Cape, which are marked in Figure 3 by the blue polygons, situated at the southernmost tip of Africa. Figure 4 shows the probability of the CTs to be associated with wet days (top panel) and dry days (bottom panel), as calculated from Equations (1) and (2). Based on the 90% percentile threshold value of the probabilities, and the number of grid points with statistically significant wet/dry rainfall anomalies under the active state of each of the CTs, CT3−, CT4− and CT8+ were selected to have the highest probability of bringing wet conditions to the Western Cape. On the other hand, CT4+, CT5−, CT7− and CT8− were selected to have the highest probability of bringing dry conditions to the Western Cape. The dry (wet) CTs are marked by the red (blue) frames in Figure 3. Figure 3 shows that for the wet CTs, the mid-latitude cyclone tended to track further north towards the south of South Africa, whereas for the dry CTs, the mid-latitude cyclones were blocked by the subtropical high-pressure system.
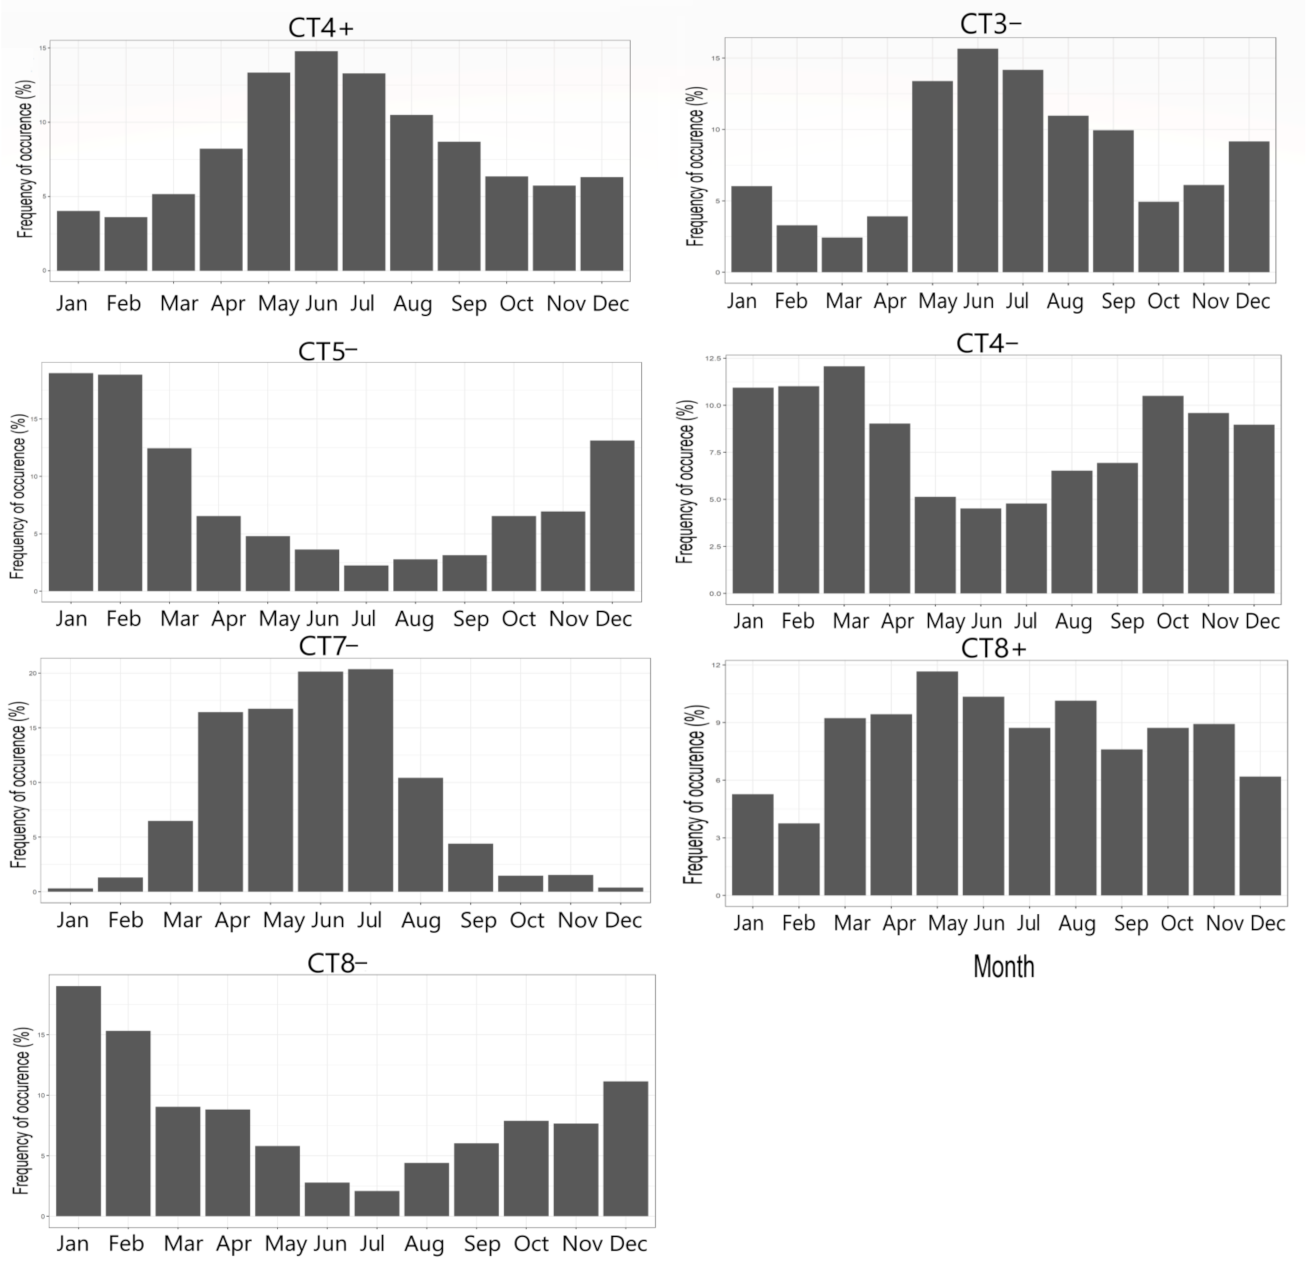
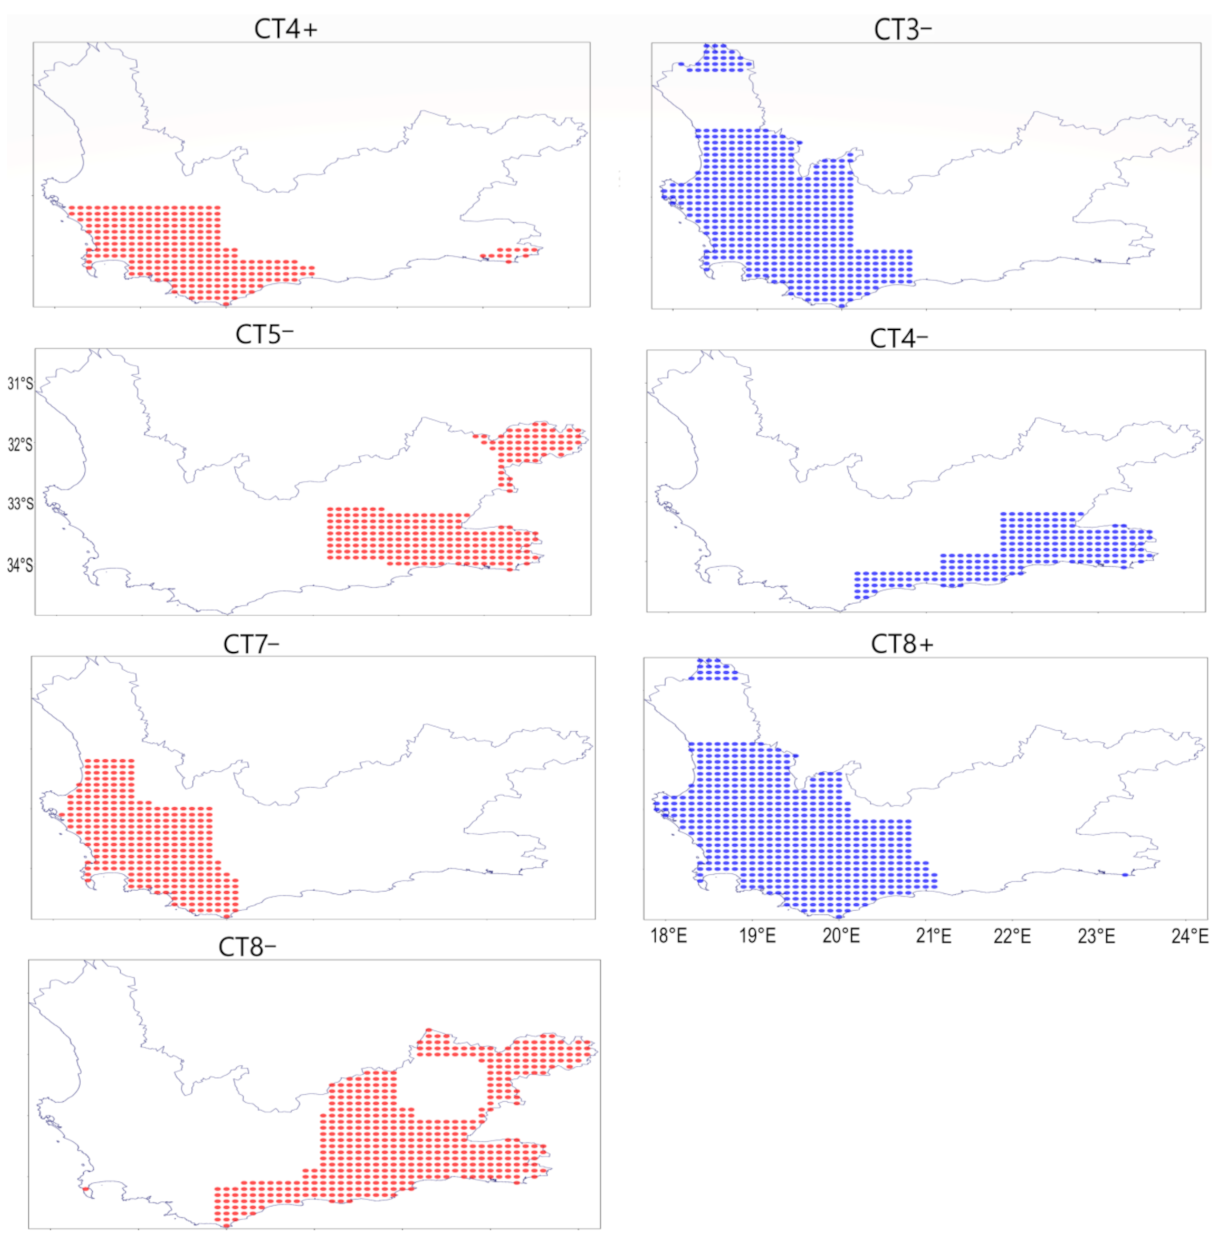
From Figure 5, all the selected CTs except CT8+ tended to exhibit seasonality. For the dry CTs, CT4+, and CT7− tended to prevail during late austral autumn and austral winter. From Figure 3, both CTs featured dominance of the subtropical anticyclone over southern African landmasses (an indication of a stable atmosphere), with the inclusion of the Western Cape. Their circulation features reflect the suppression of moist convection by large-scale subsidence and blocking of the mid-latitude cyclones. In general, they present large-scale circulation features that lead to the suppression of rainfall in the Western Cape during austral winter. Ref. [15] also found that austral winter dryness in the (western) parts of the Western Cape can be linked to subsidence. In Figure 6, the patterns of rainfall anomalies from CT4+ and CT7− are similar—rainfall is significantly suppressed in the southwestern regions. Additionally, from Figure 7, anti-cyclonic vorticity is evident south of South Africa, and over the Greater Agulhas region. Westerlies are equally blocked from progressing northward.
CT5− and CT8− are dominant during austral summer. In both CTs, the western branch of the Mascarene high is weakened, and the South Atlantic anticyclone stretches adjacent to South Africa. A more southward position of the subtropical high during austral summer is common; however, the weakening/strengthening of the Mascarene high can be related to the ENSO signal that can greatly impact precipitation amounts in South Africa. El Niño induces a below-average rainfall amount in South Africa, which could be the result of the atmospheric Rossby waves generated by SST anomalies in the central or eastern Pacific that modulate the regional fluxes of moisture in southern Africa from the southwest Indian Ocean [42]. Type 5 (CT5+/CT5−) was found to be significantly correlated with the Nino 3.4 Index (R = 0.38), in such a way that above-average Nino 3.4 index (El Niño) relates with CT5−, suggesting that during strong El Niño events, the excited Rossby waves that disrupt onshore moisture transport, coupled with the weakening of the western branch of the Mascarene high and the associating fluxes of southeasterlies [32], can lead to below-average austral summer rainfall in parts of the eastern regions of the Western Cape (Figure 6). CT8− shows a deformation (southward push) of the mid-latitude cyclone by the South Atlantic subtropical anticyclone. The rainfall anomaly from both CTs (Figure 6) is similar—parts of the eastern regions are significantly dry; generally, this might be linked to the weakening of easterly winds that advect moisture onto the eastern parts of the Western Cape from the southwest Indian Ocean. Additionally, anti-cyclonic vorticity is equally evident south of South Africa; the mid-latitude cyclones and associating band of westerlies are moved further south (Figure 7).
For the seasonality of the wet patterns, CT3− is dominant from late austral autumn to early austral spring. CT4− tends to dominate mainly in austral summer as well as austral spring. Ref. [14] reported that anomalous circulation patterns that control the austral winter rainfall variability of the Western Cape extend into austral spring. CT8+ tends to dominate during May; nevertheless, it has a high probability of occurring throughout the seasons except for austral summer. The mid-latitude disturbance tracks northward and is equally well expressed under CT3− (Figure 3), and a band of westerlies is equally enhanced northward (Figure 7), allowing cold fronts to sweep across the Western Cape; cyclonic vorticity is also evident south of South Africa; as a result, rainfall is significantly enhanced at western regions of the Western Cape (Figure 6). A positive rainfall anomaly under CT4− is statistically significant in parts of the southeastern regions, and in the western regions under CT8+. The circulation features for both CTs are similar to CT3− with respect to the cyclonic relative vorticity south of South Africa and enhanced northward track of westerly winds. However, under CT8+, which has the highest probability of bringing wet days to the Western Cape, a well-defined cyclonic circulation with the associated westerly wind is evident, just south of the Western Cape. Unlike its inverse (i.e., CT8−), the deformation of the mid-latitude cyclone by the subtropical ridge, in this case, favors the northward track of the cyclone towards the Western Cape.

3.3. Relationship between the Selected Circulation Types and the Southern Annular Mode

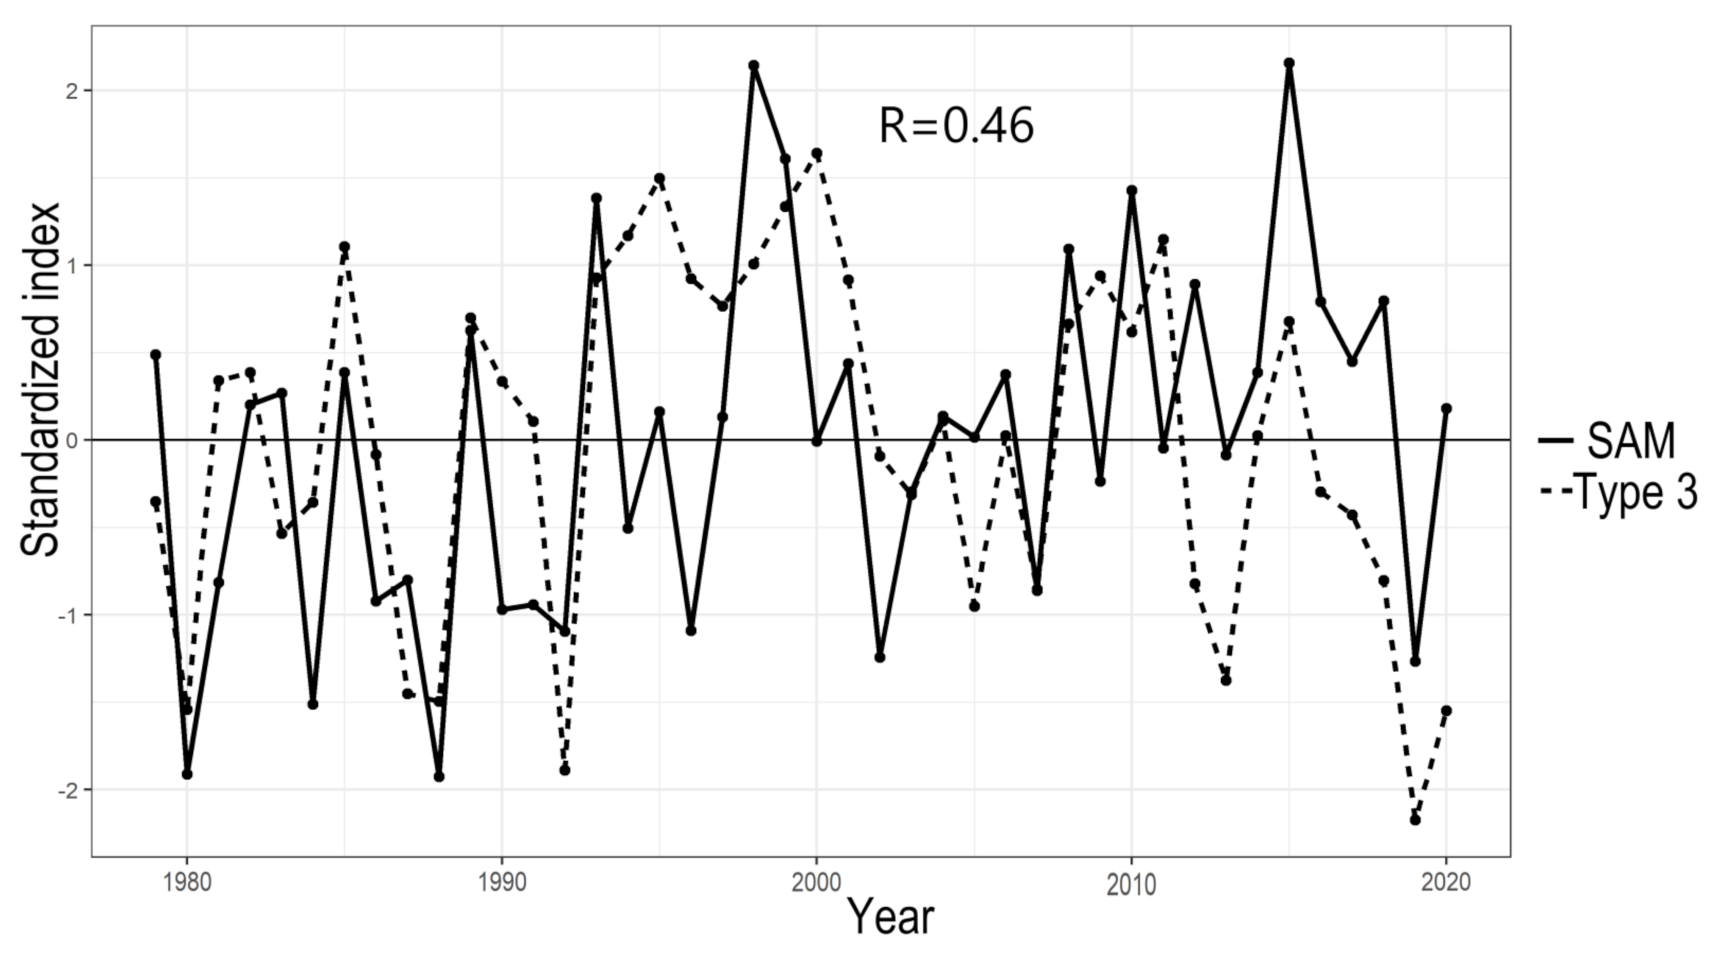
Correlation analysis between the loadings of the types selected to be associated with wet and dry conditions in the Western Cape and the SAM revealed that the SAM is significantly related to Type 3 (R = 0.46). At the monthly scale, the relationship was found to be strongest in December. From Figure 3, Type 3 (i.e., CT3+/CT3−) featured the southward/northward track of the mid-latitude cyclone. It can be generalized that the negative phase of SAM is related to CT3−, whereas the positive phase of SAM is related to CT3+, and this relationship is physically justified given the southward/northward track of mid-latitude cyclones during positive/negative phases of the SAM. The time series of the loadings of Type 3 and the SAM is shown in Figure 8 for 1979–2020; it can be seen that the variations of the SAM are strongly related to this input pattern at the inter-annual time scale, and through the dynamics of Type 3, the SAM can modulate wet and dry days in the Western Cape. Interestingly, CT3+ is also the austral summer climatology of atmospheric circulation in Africa, south of the equator [43], i.e., it is the most frequent and persistent austral summer pattern.
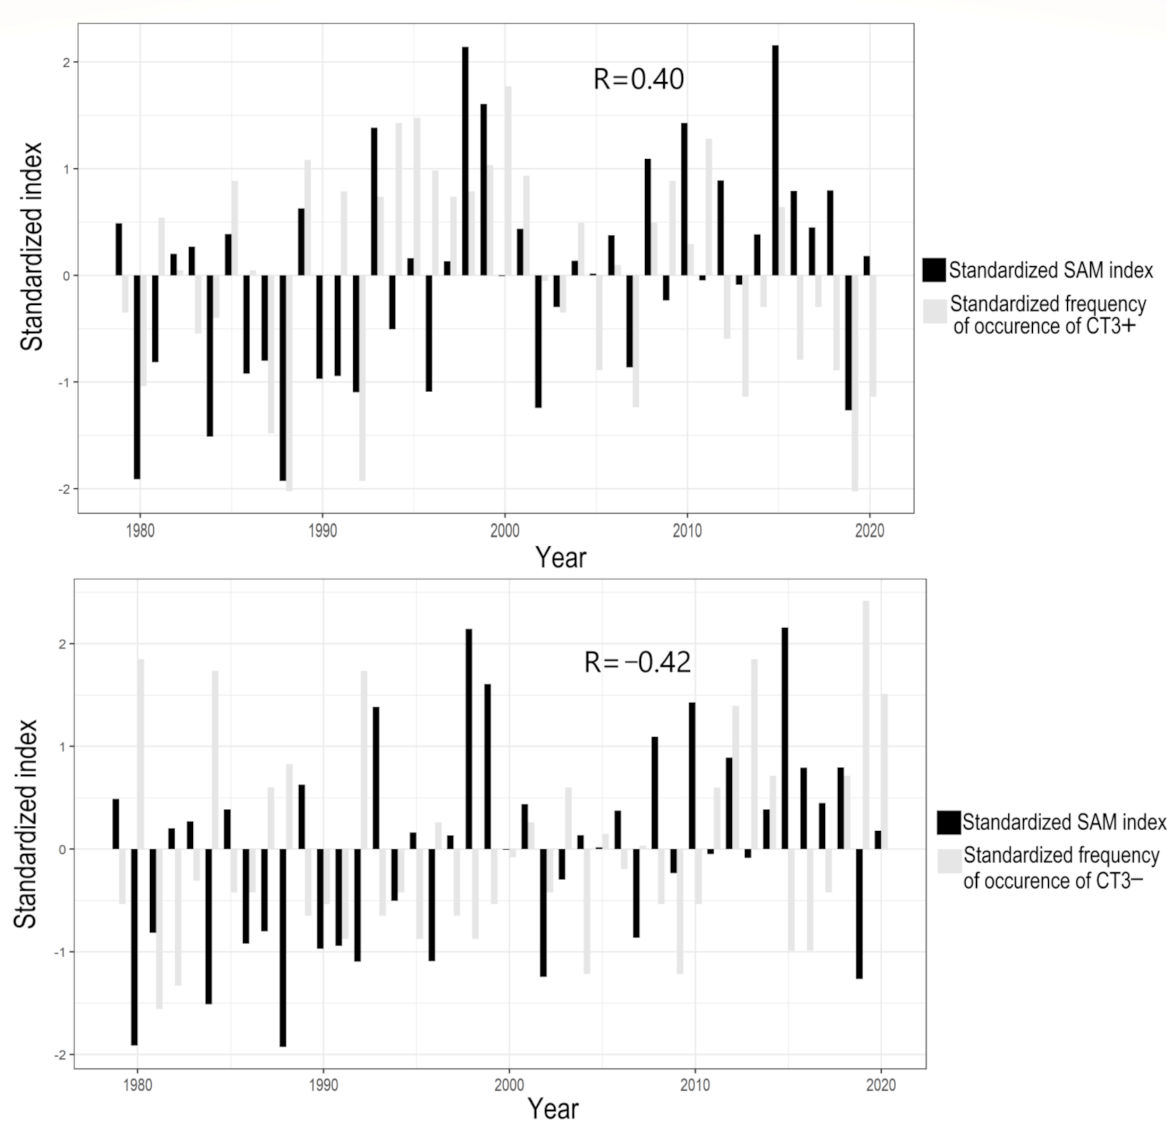
Figure 9 shows that years with an above-average SAM index can be significantly associated with the above-average frequency of occurrence of CT3+ but the below-average frequency of occurrence of CT3−. On the other hand, years with below-average SAM index can be associated with a below-average frequency of occurrence of CT3+ but an above-average frequency of occurrence of CT3−.
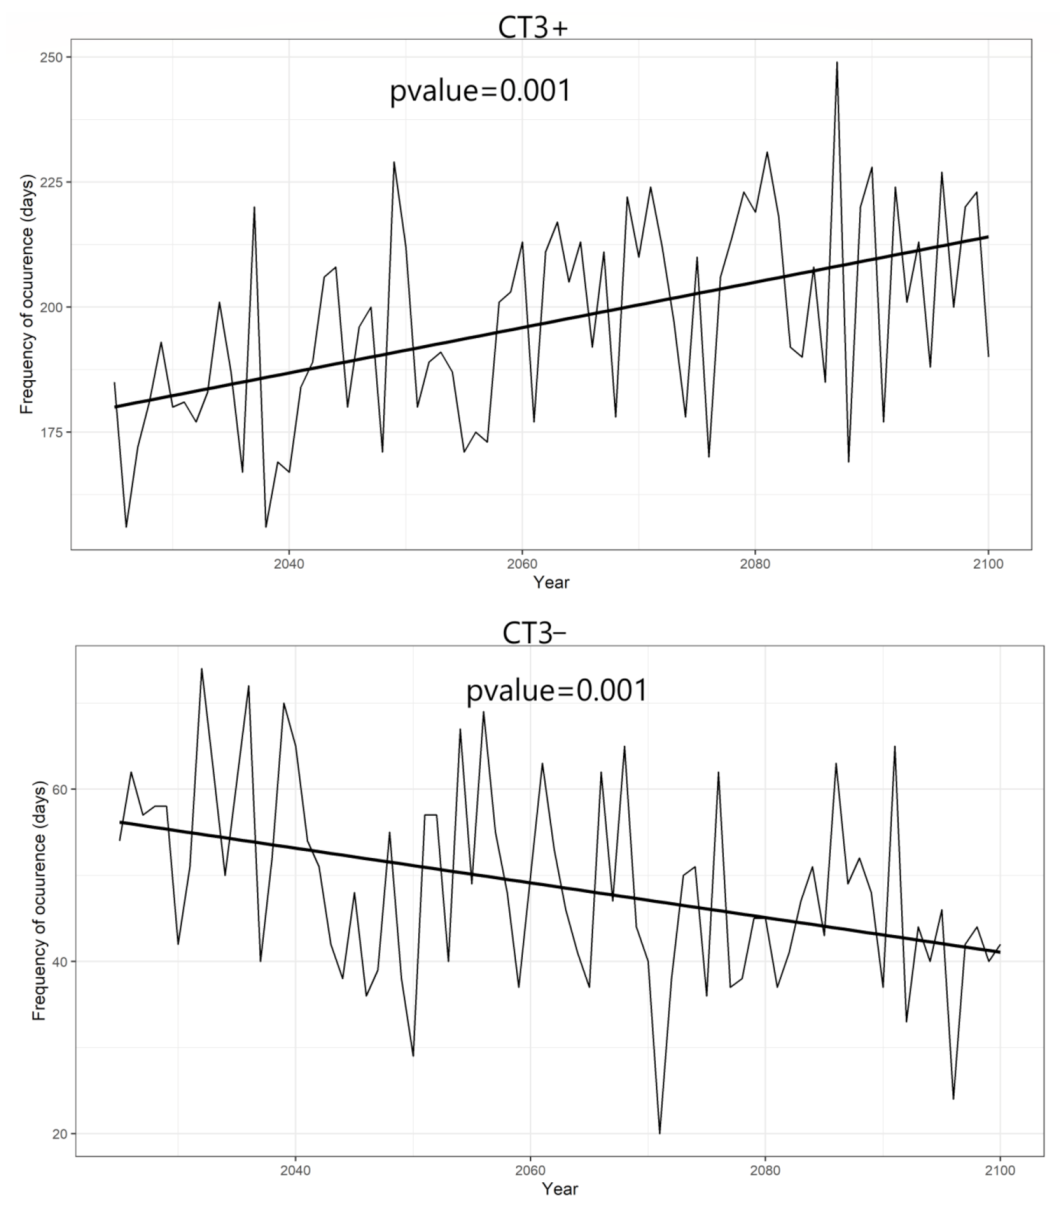
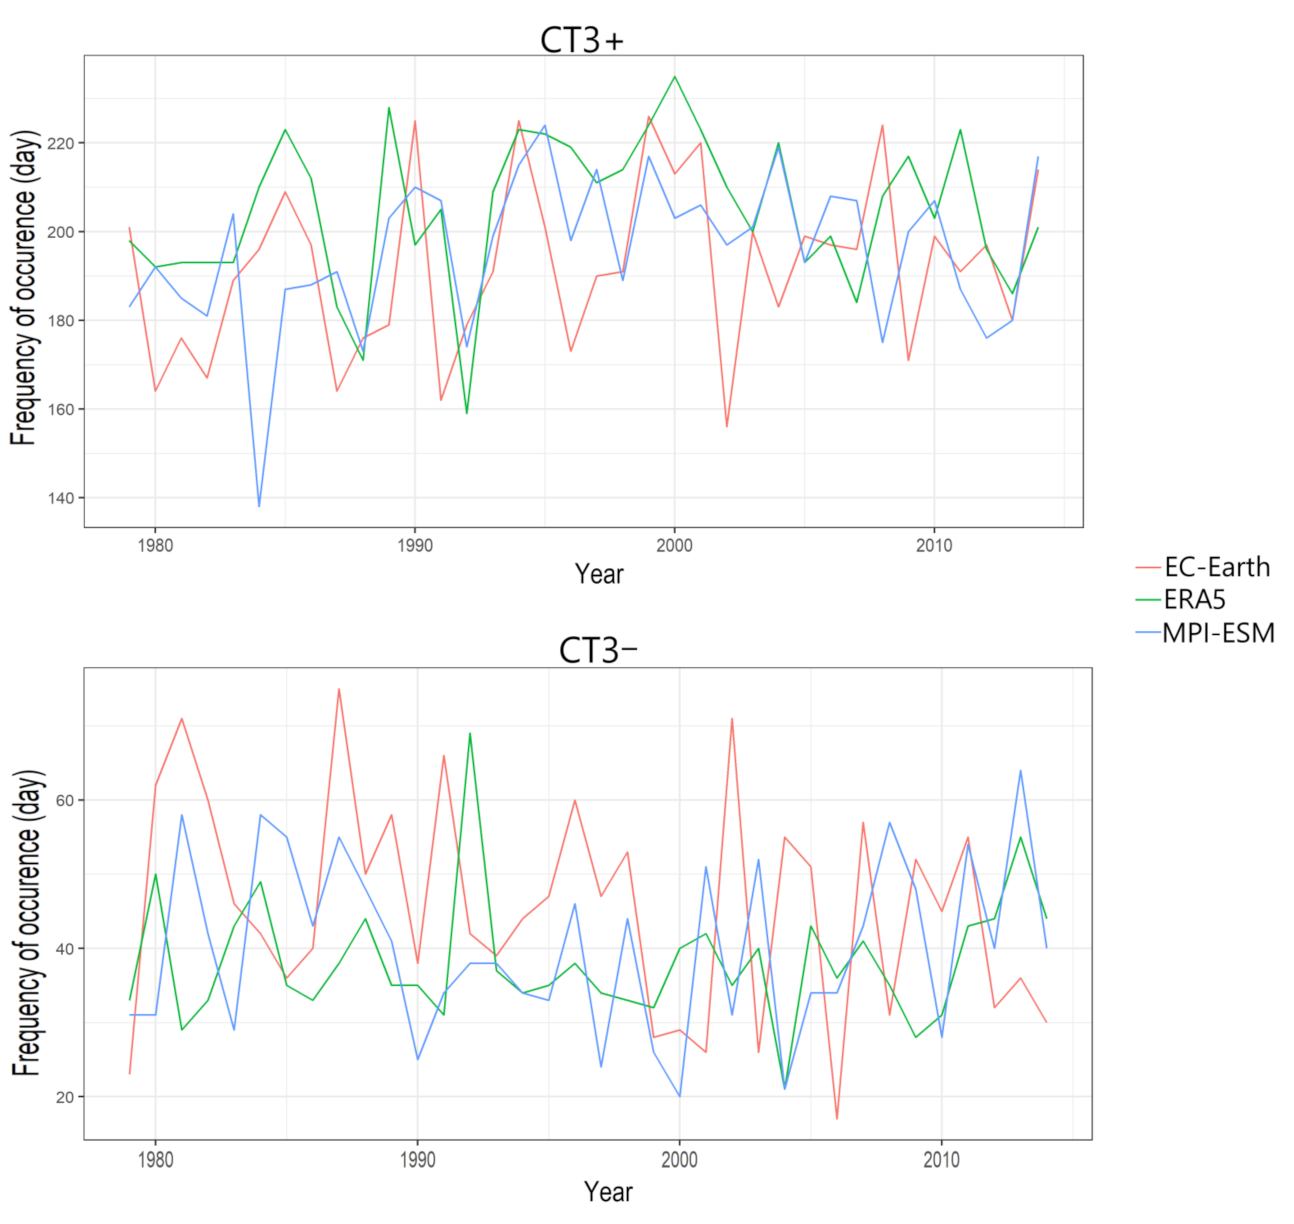
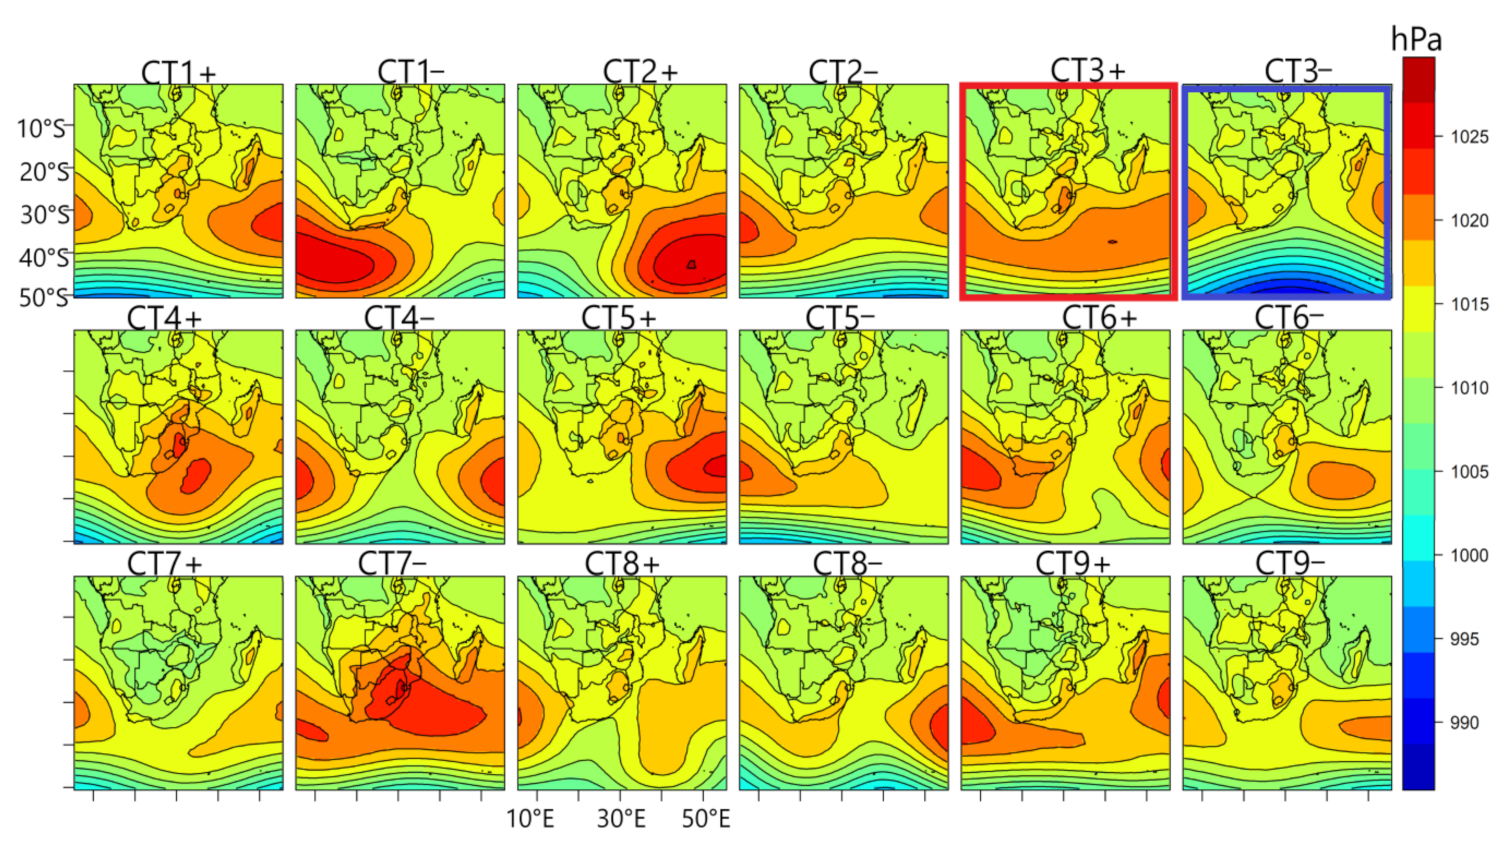
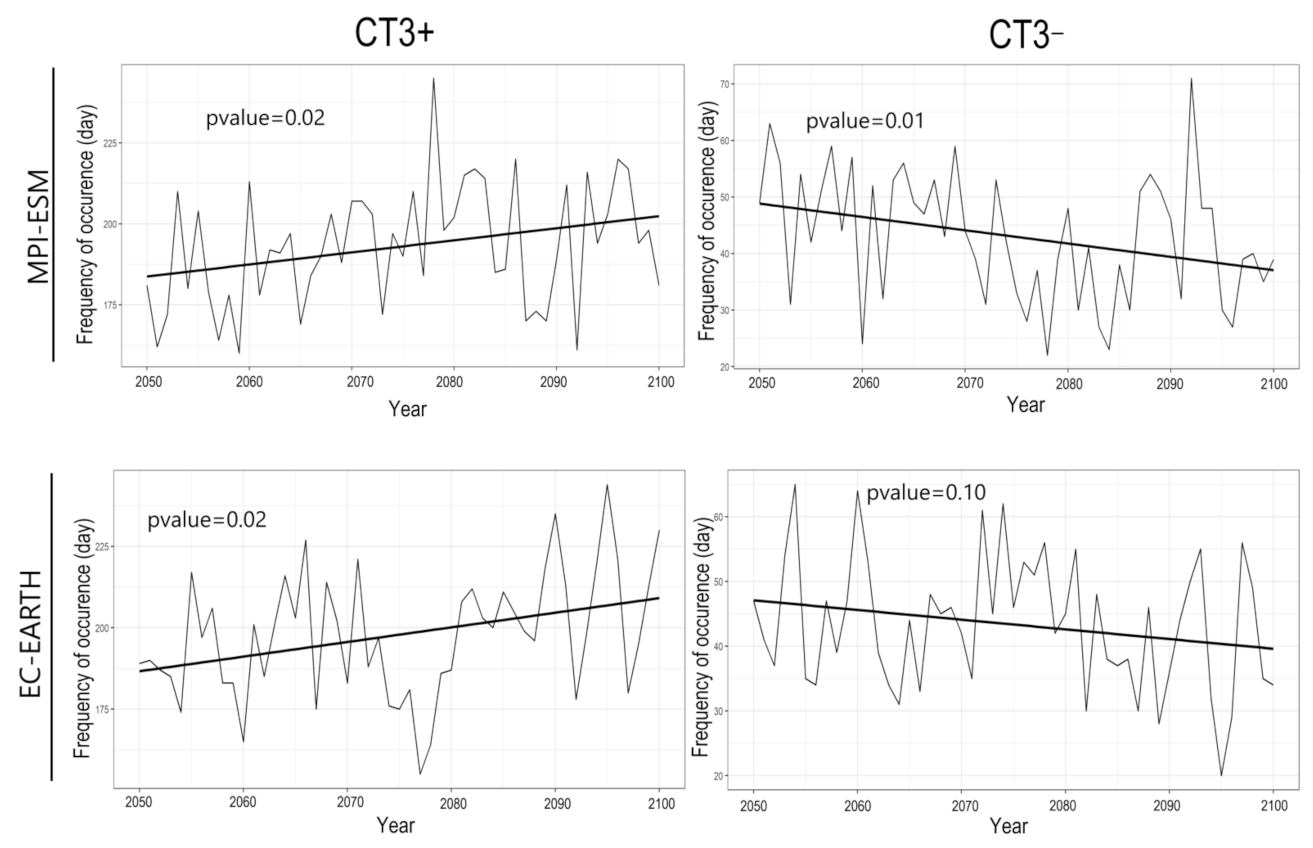
The classification scheme was applied to the selected GCMs, under historical and ssp585 experiments, and the input patterns and corresponding CTs were reproduced in all cases, with a one-to-one correspondence, based on the congruence coefficient between the scores and visual inspection of the maps. Figure 10 shows that under the historical experiment, the GCMs faithfully captured the annual frequency of occurrence of CT3+ and CT3−, although on average, it tended to overestimate/underestimate the frequency of CT3−/CT3+. Based on the mean absolute error, MPI-ESM captures the annual occurrence of the CTs as obtained from ERA5, compared to EC-Earth. Figure 11 exemplifies the CTs classified under the ssp585 scenario from the EC-Earth model. It can be seen that even under greenhouse gas warming, the climate models can reproduce the CTs as obtained from ERA5 in Figure 3. Thus, the CTs are integral parts of the underlying physics in the SLP datasets in the study region, regardless of the analysis period, choice of appropriate dataset [43], and climatic condition. The CTs related to the positive/negative SAM are marked by the red/blue frames. Under the ssp585 scenario, from Figure 12, a statistically significant positive trend was found in the frequency of occurrence of CT3+ for both GCMs, indicating that the frequency of enhanced SLP at the mid-latitudes might increase under climate change. The trend in CT3− is negative and statistically significant, as simulated by the EC-Earth GCM. Even though the negative trend in CT3− was not significant under the MPI-ESM model for the 2050–2100 analysis period, when the analysis period was extended to start from 2030 or before, the trend became statistically significant, suggesting that the frequency at which CT3 brought above-average rainfall in the western parts of the Western Cape might reduce under greenhouse gas-induced radiative heating towards the end of the 21st century.

4. Discussion

Ref. [17] found that some synoptic types associated with wet and dry conditions over the Western Cape can be linked to the SAM and ENSO. CT3− and CT5−, classified in this paper, were found to be significantly related to the SAM and ENSO, respectively. CT5− was dominant during austral summer and was found to be related to El Niño. It brought significantly below-average rainfall in some eastern parts of the Western Cape. It features a weaker state of the western branch of the Mascarene high and anticyclonic circulation south of South Africa. The relationship between CT5− and ENSO suggests that during El Niño events, the atmospheric Rossby waves generated by SST anomalies in the central or eastern Pacific that modulate southeasterly moisture fluxes advected by the western branch of the Mascarene high might cause below-average austral summer rainfall in some eastern parts of the Western Cape [32,42,44]. CT3− was dominant during austral winter and early austral spring; it featured the equatorward track of mid-latitude cyclones, low-level relative vorticity, and westerlies south of South Africa. It brought above-average rainfall in the western regions of the Western Cape. The synoptic features of CT3− were in agreement with the patterns of atmospheric circulation reported by [14,45] which were associated with wet events in the western regions of South Africa. Additionally, years with a below-average SAM index correlated with the above-average frequency of occurrence of CT3−.
Studies have indicated that, under global warming, the SAM is projected to undergo a trend towards positive polarity during austral summer, due to an increase in greenhouse gas concentrations and stratospheric ozone depletion [10]. This finding is in agreement with the positive trend found under the ssp585 scenario, in the frequency of occurrence of CT3+ (related to the SAM), which is also an austral summer-dominant CT, associated with enhanced SLP in the mid-latitudes. The occurrence of CT3+ is also enhanced by a positive SAM phase. It was equally found that the frequency of occurrence of CT3− significantly decreased under the ssp585 scenario. Ref. [15] reported a projected decrease in early austral winter rainfall (which correlated with the SAM) in the Western Cape under greenhouse gas warming. The decrease in the frequency of occurrence of CT3- might be related to a shift towards positive polarity of the SAM, because, on average, the above-average SAM index correlates with the below-average frequency of occurrence of CT3−. Thus, during austral winter, the southwestern parts of the Western Cape might be drier under global warming. This is also in agreement with the study of [28], that the decrease in the duration of rainfall events associated with cold fronts can be associated with Hadley expansion across the southern hemisphere and post-frontal high-pressure conditions that suppress orographically enhanced rainfall.

5. Conclusions

This study used circulation typing with obliquely rotated PCA to examine physically interpretable CTs in Africa south of the equator that can be associated with wet and dry conditions in the Western Cape, the relationship between the CTs and the SAM, and changes in the annual frequency of occurrence of the CTs related to the SAM under the ssp585 scenario. Four CTs were found to be associated with dry events in the Western Cape, and three CTs were found to be associated with wet events in the Western Cape. The synoptic features of CT4+ and CT7− revealed that during austral winter, large-scale subsidence and atmospheric blocking of the mid-latitude cyclone, adjacent to South Africa, can be associated with negative rainfall anomalies in the western regions of the Western Cape. During austral summer, the positioning of the semi-permanent high, south of South Africa, and to some extent, a weaker state of the western branch of the Mascarene high, can be associated with austral summer dryness in some eastern parts of the Western Cape. Generally, the CTs found to be associated with wet (dry) conditions in the Western Cape featured (i) low-level cyclonic (anti-cyclonic) relative vorticity, and (ii) the northward (southward) track of westerlies and mid-latitude cyclones. Wet synoptic situations favored cold fronts to sweep across the Western Cape. One of the selected wet CTs (i.e., CT3−), dominant during austral winter and early austral spring, was found to be correlated with the SAM, suggesting that the negative/positive phases of the SAM can be related to atmospheric circulations that favor positive/negative rainfall anomaly in the western parts of the Western Cape. Under global warming, a statistically significant negative trend was found in the frequency of occurrence of CT3−.
Finally, similar results were derived by analyzing the trend in the CTs related to SAM using the CMIP5 GCMs under the RCP8.5 scenario. Although the year-to-year variations in the annual occurrence of the CTs are subjected to inter-model uncertainties, they agree towards a tendency of decrease/increase in the annual occurrence of CTs associated with the northward/southward track of the mid-latitude cyclones (see Figure A1).

Funding

This publication was supported by the Open Access Publication Fund of the University of Wuerzburg. VAT DE 134187690.

Institutional Review Board Statement

Not applicable.

Informed Consent Statement

Not applicable.

Data Availability Statement

ERA5 datasets are available at https://climate.copernicus.eu/climate-reanalysis (accessed on 5 January 2021). The CMIP6 and CMIP5 datasets are available at https://esgf-data.dkrz.de/projects/esgf-dkrz/ (accessed on 5 January 2021). The CPC dataset is available at https://psl.noaa.gov/data/gridded/data.cpc.globalprecip.html (accessed on 5 January 2021).

Conflicts of Interest

The author declares no conflict of interest.

Appendix A

Figure A1. The trend in the annual frequency of occurrence of CT3+ and CT3− exemplified from the high-resolution CMCC-CMS CMIP5 GCM, for the 2030–2100 period under the RCP8.5 scenario.
Atmosphere 12 00753 g0a1

References

  1. Thompson, D.W.J.; Wallace, J.M. Annular modes in the extratropical circulation. Part I: Month-to-month variability. J. Clim. 2000, 13, 1000–1016. [Google Scholar] [CrossRef]
  2. Watterson, I.G. Zonal wind vacillation and its interaction with the ocean: Implication for interannual variability and predictability. J. Geophys. Res. 2001, 106, 965–975. [Google Scholar] [CrossRef] [Green Version]
  3. Screen, J.; Gillett, N.; Stevens, D.; Marshall, G.; Roscoe, H. The role of eddies in the Southern Ocean temperature response to the southern annular mode. J. Clim. 2009, 22, 806–818. [Google Scholar] [CrossRef] [Green Version]
  4. Hendon, H.H.; Thompson, D.W.J.; Wheeler, M.C. Australian rainfall and surface temperature variations associated with the Southern Hemisphere annular mode. J. Clim. 2007, 20, 2452–2467. [Google Scholar] [CrossRef]
  5. Codron, F. Relation between annular modes and the mean state: Southern Hemisphere summer. J. Clim. 2005, 18, 320–330. [Google Scholar] [CrossRef]
  6. Hall, A.; Visbeck, M. Synchronous Variability in the Southern Hemisphere Atmosphere, Sea Ice, and Ocean Resulting from the Annular Mode. J. Clim. 2002, 15, 3043–3057. [Google Scholar] [CrossRef] [Green Version]
  7. Seager, R.; Harnik, N.; Kushnir, Y.; Robinson, W.; Miller, J. Mechanisms of hemispherically symmetric climate variability. J. Clim. 2003, 16, 2960–2978. [Google Scholar] [CrossRef]
  8. Wang, G.; Cai, W. Climate-change impact on the 20th-century relationship between the Southern Annular Mode and global mean temperature. Sci. Rep. 2013, 3, 2039. [Google Scholar] [CrossRef] [PubMed]
  9. L’Heureux, M.L.; Thompson, D.W.J. Observed relationships between the El Niño–Southern Oscillation and the extratropical zonal-mean circulation. J. Clim. 2006, 19, 276–287. [Google Scholar] [CrossRef]
  10. Ding, Q.; Steig, E.J.; Battisti, D.S.; Wallace, J.M. Influence of the Tropics on the Southern Annular Mode. J. Clim. 2012, 25, 6330–6348. [Google Scholar] [CrossRef]
  11. Gillett, N.P.; Thompson, D.W.J. Simulation of recent Southern Hemisphere climate change. Science 2003, 302, 273–275. [Google Scholar] [CrossRef] [PubMed] [Green Version]
  12. Abram, N.J.; Mulvaney, R.; Vimeux, F.; Phipps, S.J.; Turner, J.; England, M.H. Evolution of the Southern Annular Mode during the past millennium. Nat. Clim. Chang. 2014, 4, 564–569. [Google Scholar] [CrossRef] [Green Version]
  13. Cai, W.; Van Rensch, P.; Borlace, S.; Cowan, T. Does the Southern Annular Mode contribute to the persistence of the multidecade-long drought over southwest Western Australia? Geophys. Res. Lett. 2011, 38, 14. [Google Scholar] [CrossRef]
  14. Reason, C.J.C.; Rouault, M. Links between the Antarctic Oscillation and winter rainfall over western South Africa. Geophys. Res. Lett. 2005, 32, 7. [Google Scholar] [CrossRef]
  15. Mahlalela, P.; Blamey, R.; Reason, C.J.C. Mechanisms behind early winter rainfall variability in the southwestern Cape, South Africa. Clim. Dyn. 2019, 53, 21–39. [Google Scholar] [CrossRef]
  16. Muller, M. Cape Town’s drought: Don’t blame climate change. Nature 2018, 559, 174–176. [Google Scholar] [CrossRef] [PubMed] [Green Version]
  17. Engelbrecht, C.J.; Landman, W.A. Interannual variability of seasonal rainfall over the Cape south coast of South Africa and synoptic type association. Clim. Dyn. 2016, 47, 295–313. [Google Scholar] [CrossRef]
  18. Philippopoulos, K.; Deligiorgi, D.; Kouroupetroglou, G. Performance Comparison of Self-Organizing Maps and k-means Clustering Techniques for Atmospheric Circulation Classification. Int. J. Energy Environ. 2014, 8, 171–180. [Google Scholar]
  19. Gong, X.; Richman, M.B. On the Application of Cluster Analysis to Growing Season Precipitation Data in North America East of the Rockies. J. Clim. 1995, 4, 897–931. [Google Scholar] [CrossRef] [Green Version]
  20. Xu, D.; Tian, Y.A. Comprehensive Survey of Clustering Algorithms. Ann. Data Sci. 2015, 2, 165–193. [Google Scholar] [CrossRef] [Green Version]
  21. Ibebuchi, C.C. On the fuzziness of circulation types derived from the application of obliquely rotated principal component analysis to a T-mode climatic field. Res. Square 2021. [Google Scholar] [CrossRef]
  22. Richman, M.B. Obliquely rotated Principal Components: An improved meteorological map typing technique? J. Appl. Meteorol. 1981, 20, 1145–1159. [Google Scholar] [CrossRef] [Green Version]
  23. Richman, M.B. Rotation of principal components. J. Climatol. 1986, 6, 293–335. [Google Scholar] [CrossRef]
  24. Huth, R. An intercomparison of computer-assisted circulation classification methods. Int. J. Climatol. 1996, 16, 893–922. [Google Scholar] [CrossRef]
  25. Compagnucci, R.H.; Araneo, D.; Canziani, P.O. Principal sequence pattern analysis: A new approach to classifying the evolution of atmospheric systems. Int. J. Climatol. 2001, 21, 197–217. [Google Scholar] [CrossRef] [Green Version]
  26. Otto, F.E.L.; Wolski, P.; Lehner, F.; Tebaldi, C.; Oldenborgh, G.; Hogesteeger, S.; Holden, P.; Fuckar, N.S.; Odoulam, R.C.; New, M.G. Anthropogenic influence on the drivers of the Western Cape drought 2015–2017. Environ. Res. Lett. 2018, 13, 124010. [Google Scholar] [CrossRef]
  27. Wolski, P. How severe is Cape Town’s “Day Zero” drought? Significance 2018, 15, 24–27. [Google Scholar] [CrossRef]
  28. Burls, N.J.; Blamey, R.C.; Cash, B.A.; Swenson, E.T.; Fahad, A.A.; Bopape, M.-J.; Straus, D.M.; Reason, C. The Cape Town “Day Zero” drought and Hadley cell expansion. Clim. Atmos. Sci. 2019, 2, 27. [Google Scholar] [CrossRef] [Green Version]
  29. Hersbach, H.; Bell, B.; Berrisford, P.; Hirahara, S.; Nicolas, J.; Radu, R.; Simmons, A.; Abellan, X.; Soci, C.; Bechtold, P.; et al. The ERA5 global reanalysis. Q. J. R. Meteorol. Soc. 2020, 146, 1999–2204. [Google Scholar] [CrossRef]
  30. Xie, P.; Chen, M.; Yang, S.; Yatagai, A.; Hayasaka, T.; Fukushima, Y.; Liu, C. A gauge-based analysis of daily precipitation over East Asia. J. Hydrometeor. 2007, 8, 607–626. [Google Scholar] [CrossRef]
  31. Grassi, B.; Redaelli, G.; Visconti, G. Simulation of Polar Antarctic trends: Influence of tropical SST. Geophys. Res. Lett. 2005, 32, L23806. [Google Scholar] [CrossRef]
  32. Cook, K.H. The South Indian Convergence Zone and Interannual Rainfall Variability over Southern Africa. J. Clim. 2000, 13, 3789–3804. [Google Scholar] [CrossRef]
  33. Kidson, J.W. The utility of surface and upper air data in synoptic climatological specification of surface climatic variables. Int. J. Climatol. 1997, 17, 399–414. [Google Scholar] [CrossRef]
  34. Richman, M.B.; Lamb, P.J. Climatic pattern analysis of three and seven-day summer rainfall in the Central United States: Some methodological considerations and regionalization. J. Clim. Appl. Meteor. 1985, 24, 1325–1343. [Google Scholar] [CrossRef] [Green Version]
  35. North, G.R.; Bell, T.L.; Cahalan, R.F.; Moeng, F.J. Sampling errors in the estimation of empirical orthogonal functions. Mon. Weather Rev. 1982, 110, 699–706. [Google Scholar] [CrossRef]
  36. Compagnucci, R.H.; Richman, M.B. Can principal component analysis provide atmospheric circulation or teleconnection patterns? Int. J. Climatol. 2008, 28, 703–726. [Google Scholar] [CrossRef]
  37. Barreira, S.; Compagnucci, R.H. Spatial fields of Antarctic sea-ice concentration anomalies for summer–autumn and their relationship to Southern Hemisphere atmospheric circulation during the period 1979–2009. Ann. Glaciol. 2011, 52, 140–150. [Google Scholar] [CrossRef] [Green Version]
  38. Richman, M.B.; Gong, X. Relationships between the definition of the hyperplane width to the fidelity of principal component loadings patterns. J. Clim. 1999, 2, 1557–1576. [Google Scholar] [CrossRef]
  39. Reason, C.J.C.; Smart, S. Tropical Southeast Atlantic warm events and associated rainfall anomalies over Southern Africa. Front. Environ. Sci. 2015, 3, 24. [Google Scholar] [CrossRef]
  40. Mann, H.B. Non-parametric tests against trend. Econometrica 1945, 13, 245–259. [Google Scholar] [CrossRef]
  41. Kendall, M.G. Rank Correlation Methods; Griffin: London, UK, 1975. [Google Scholar]
  42. Pinault, J.L. The Anticipation of the ENSO: What Resonantly Forced Baroclinic Waves Can Teach Us (Part II). J. Mar. Sci. Eng. 2018, 6, 63. [Google Scholar] [CrossRef] [Green Version]
  43. Ibebuchi, C.C. Can synoptic patterns influence the track and formation of tropical cyclones in the Mozambique Channel? Res. Square 2021. [Google Scholar] [CrossRef]
  44. Reason, C.J.C.; Jagadheesha, D. A model investigation of recent ENSO impacts over southern Africa. Meteorol. Atmos. Phys. 2005, 89, 181–205. [Google Scholar] [CrossRef]
  45. Gillett, N.P.; Kell, T.D.; Jones, P.D. Regional climate impacts of the Southern Annular Mode. Geophys. Res. Lett. 2006, 33. [Google Scholar] [CrossRef]
Figure 1. Annual cycle of rainfall from station data (obs) and CPC dataset for the 1979–2020 period.
Atmosphere 12 00753 g001
Figure 2. Seasonal rainfall climatology from CPC dataset for the 1979–2020 period.
Atmosphere 12 00753 g002
Figure 3. Circulation types in the study region. The CTs are presented by the mean SLP field of the days clustered in a given class. Wet (dry) CTs in the Western Cape are marked by the blue (red) frames. The blue polygons in the maps delineate the position of the Western Cape.
Atmosphere 12 00753 g003
Figure 4. Probability of wet days (top panel) and dry days (bottom panel) associated with the CTs in Figure 3.
Atmosphere 12 00753 g004
Figure 5. Annual cycle of the selected CTs associated wet days (right panel) and dry days (left panel) in the Western Cape.
Atmosphere 12 00753 g005
Figure 6. Rainfall anomaly associated with wet CTs (right panel) and the dry CTs (left panel). The anomaly was calculated as the difference between the season when the CTs are dominant and the climatology of the season. Blue (red) dots indicate grid points with statistically significant positive (negative) rainfall anomalies.
Atmosphere 12 00753 g006
Figure 7. Composites of wind vector and relative vorticity at 850 hPa for the selected CTs. The scale of wind is given on top of the map. The color bar is the relative vorticity with the unit in 10 6 / s . Green vectors are wind. The dry (wet) patterns are in the left (right) panel.
Atmosphere 12 00753 g007
Figure 8. Time series of the SAM and Type 3 for the 1979–2020 period. The correlation coefficient between the indices is written in the graph.
Atmosphere 12 00753 g008
Figure 9. Relationship between the annual frequency of occurrence of CT3+ (top) and CT3− (bottom) and the SAM for the 1979–2020 period. The correlation coefficient between the indices is written in the graph.
Atmosphere 12 00753 g009
Figure 10. Validation of the annual frequency of occurrence of CT3+ and CT3− as simulated from the GCMs compared to ERA5 for the 1979–2014 period.
Atmosphere 12 00753 g010
Figure 11. Circulation types classified from the EC-Earth CMIP6 GCM for the ssp585 experiment. The selected type related to the SAM are highlighted by the red frame (i.e., CT related to the positive SAM) and blue frame (i.e., the CT related to the negative SAM).
Atmosphere 12 00753 g011
Figure 12. Simulated trends in CT3+ and CT3− from the GCMs, under the ssp585 scenario for the 2050–2100 analysis period. The p-values from the Mann–Kendal test are written in the graph.
Atmosphere 12 00753 g012
Publisher’s Note: MDPI stays neutral with regard to jurisdictional claims in published maps and institutional affiliations.