Article

Linking ECMWF 2 m Temperature Forecast Errors with Upper-Level Circulation Situation: A Case-Study for China

1
Physical Oceanography Laboratory & Ocean-Atmospheric Interaction and Climate Laboratory, Ocean University of China, Qingdao 266100, China
2
State Key Laboratory of Severe Weather (LaSW), Chinese Academy of Meteorological Sciences, Beijing 100081, China
3
Southern Marine Science and Engineering Guangdong Laboratory (Zhuhai), Zhuhai 519082, China
4
School of Geodesy and Geomatics, Wuhan University, Wuhan 430079, China
*
Authors to whom correspondence should be addressed.
Atmosphere 2021, 12(6), 725; https://doi.org/10.3390/atmos12060725
Submission received: 2 May 2021 / Revised: 27 May 2021 / Accepted: 28 May 2021 / Published: 6 June 2021
(This article belongs to the Section Atmospheric Techniques, Instruments, and Modeling)

Abstract

:
Using the observational data and the forecast and reanalysis data from the European Centre for Medium-Range Weather Forecasts (ECMWF) during 2015–2018, the temporal and spatial distribution characteristics of the 2 m temperature forecast errors of ECMWF in China, as well as their attribution to upper-level circulation, are analyzed. Results show that positive 2 m temperature forecast errors mainly occur in northwestern, northern and northeastern China, and gradually increase from January to December. This kind of error is attributed to the circulation errors associated with the circumfluence of the low-level differential winds along the Mongolian Plateau, and influenced by the changes in the mid-latitude trough and ridge with the seasons. In contrast, the negative 2 m temperature forecast errors mainly occur in the southeastern part of the Qinghai-Tibet Plateau, with the largest errors around March and October, and the smallest errors around June and December. This kind of error is associated with a series of cyclonic and anticyclonic differential circulations generated by the detouring of the mid-level differential winds along the terrain near the south side of the Plateau. The positions and intensity of these differential circulations are also influenced by the variation in the mid-level circulation with the seasons.

1. Introduction

In recent decades, with the increasing improvement of models and data assimilation systems, numerical weather forecasting has developed rapidly and has become an indispensable means of weather forecasting. Although numerical weather prediction has been widely used, there are still obvious errors in numerical weather prediction due to the uncertainty of the model itself as well as the initial and boundary conditions [1,2,3]. In view of this, many studies have improved the numerical weather prediction effect by optimizing the model’s dynamic framework [4], model initial field [2,5,6], parameterization schemes of various physical processes and calculation schemes of model, etc. [7,8]. On the other hand, starting with the analysis of the distribution characteristics of model forecast errors and their physical causes, especially focusing on the characteristics and causes of systematic errors, the development of corresponding calculation methods and correction techniques to correct forecasts is another effective means to improve the accuracy of model forecasts, which has become a widely adopted and effective way in current operational forecasting [5,9,10,11,12,13].
Model forecast corrections can be roughly divided into two categories: error-based spatiotemporal statistical characteristics and physical cause analysis corrections. Among them, the study of model forecast corrections based on error-based spatiotemporal statistical characteristics [14], regardless of whether posterior corrections or process corrections are used, is mainly based on the statistical characteristics of the error; while the correction of the model forecast based on the physical cause of the error involves the analysis of the weather dynamics mechanism [15,16,17,18,19,20]. Comparing these two types of methods, the advantage of the model forecasting correction based on the analysis of physical causes is that the causes of errors can be understood from the distribution and evolution of the weather system, and thus a model dynamic forecast method based on the physical causes of errors might be proposed. In addition, ensemble forecasting is a very important method to quantify the uncertainty of numerical weather prediction [21,22,23,24], and the optimal weight allocation of each ensemble member is a key issue that needs to be solved urgently in ensemble forecasting [25,26,27]. The allocation of the weights of ensemble forecast members based on the temporal and spatial distribution characteristics of the errors from the physical causality analyses would just suggest such a possibility since it has a reasonable physical explanation basis.
At present, the forecast centers in various countries and regions provide many products of model forecast. Among them, the European Centre for Medium-Range Weather Forecasts (ECMWF) model forecast products have become widely used by various regional operational forecast centers in China, including temperature [28,29,30,31] and precipitation [23,32,33], even tropical cyclone path and intensity forecasts and other products [34]. At the same time, some evaluation studies on regional forecasts in China show that the forecast accuracy of ECMWF model is higher than those of the other forecast centers. The evaluation objects include the evolution and adjustment of atmospheric circulation and the trend of 850 hPa temperature fluctuation [35], 2 m temperature [14,30,31] and precipitation, etc. [36,37]. It can be seen that in terms of the wide range of applications and practicability, the correction to the ECMWF model forecasts is of great significance to China’s meteorological operational forecasts. However, the above-mentioned research did not perform physical attribution analysis or error source analysis of the model prediction.
In view of the above research progress, this paper selects the ECMWF model that currently has the best regional forecasting effect in China, and takes 2 m temperature forecasting as the research focus. The forecast error distribution is analyzed by time-space cluster analysis method and the physical attribution analysis based on the upper-level circulation situation, thereby revealing temporal and spatial distribution characteristics of the ECMWF model’s 2 m temperature forecast errors as well as the evolution mechanism of the circulation situation affecting them so as to provide some scientific basis for proposing dynamic or statistical correction methods for ECMWF 2 m temperature forecasts.
The next section first introduces the data and methods used in this article. Section 3 classifies the average errors of the ECMWF model for the 2 m temperature forecasts in China. In Section 4 and Section 5, the attribution analysis of the upper-level circulation situation against the regional stations where the forecasted temperature in the ECMWF model is significantly higher or lower than observation. Finally, Section 6 will summarize the analysis results and discuss them.

2. Data and Methods

The data used in this study are the observations of the national basic stations (a total of 2380) from 2015 to 2018 (the sum of 1461 days) by the China Meteorological Administration and the ECMWF forecast field from the National Meteorological Information Center of China, as well as the forecast data of the ERA5 reanalysis field from the ECMWF. Among them, the spatial resolution of the ECMWF forecast field and the ERA5 reanalysis field are both 0.25° × 0.25°, and the adopted levels are 850 hPa, 700 hPa, 600 hPa, 500 hPa, 400 hPa, and 300 hPa. The start time of the ECMWF forecast field is at 08 BST every day, and the forecast results with a forecast lead-time of 72 h and an interval of 6 h are adopted. In order to match the spatial resolution of the ECMWF forecast field, the data of the national basic stations is interpolated to 0.25° × 0.25°. In addition, the time resolution of the national basic stations data and the ERA5 reanalysis data is 1 h. To match the time resolution of the ECMWF forecast field, the national basic stations data and the ERA5 reanalysis data both use up to 6 h interval data. The analyzed elements include the surface temperature and the upper-level geopotential height, temperature and winds.
Firstly, calculate the average of the ECMWF 2 m temperature forecast errors over the 12 forecast lead-times for each national basic station and each day during 2015–2018. In this way, the daily ECMWF 2 m temperature forecast errors (referred to as forecast error hereinafter; the dimension is 2380 × 1461) for all stations during 2015–2018 are obtained. The K-means cluster analysis method is then used to classify the spatio-temporal distribution characteristics of the forecast errors. On this basis, the attribution analysis of the spatio-temporal distribution features of the forecast errors is carried out. The analysis is made through investigating the horizontal distribution and vertical profile of the above-mentioned surface and upper-level elements. Among them, the distribution characteristics of 2 m temperature forecast errors are mainly analyzed in the horizontal direction. On this basis, the forecast errors of the upper-level circulation situation field are analyzed as well, with the upper-level circulation situation errors linked to the 2 m temperature forecast error distribution. Combining the horizontal and vertical profile distributions of the forecast errors of the studied elements, the reasons for the formation of the upper-level circulation situation errors are discussed from the angle of the high-level circulation situation deviation and topographic effects, and then the reasons for the formation of the ECMWF 2 m temperature forecast errors are revealed from the perspective of the upper-level circulation situation.

3. Temporal and Spatial Distribution Characteristics of the ECMWF 2 m Temperature Forecast Errors

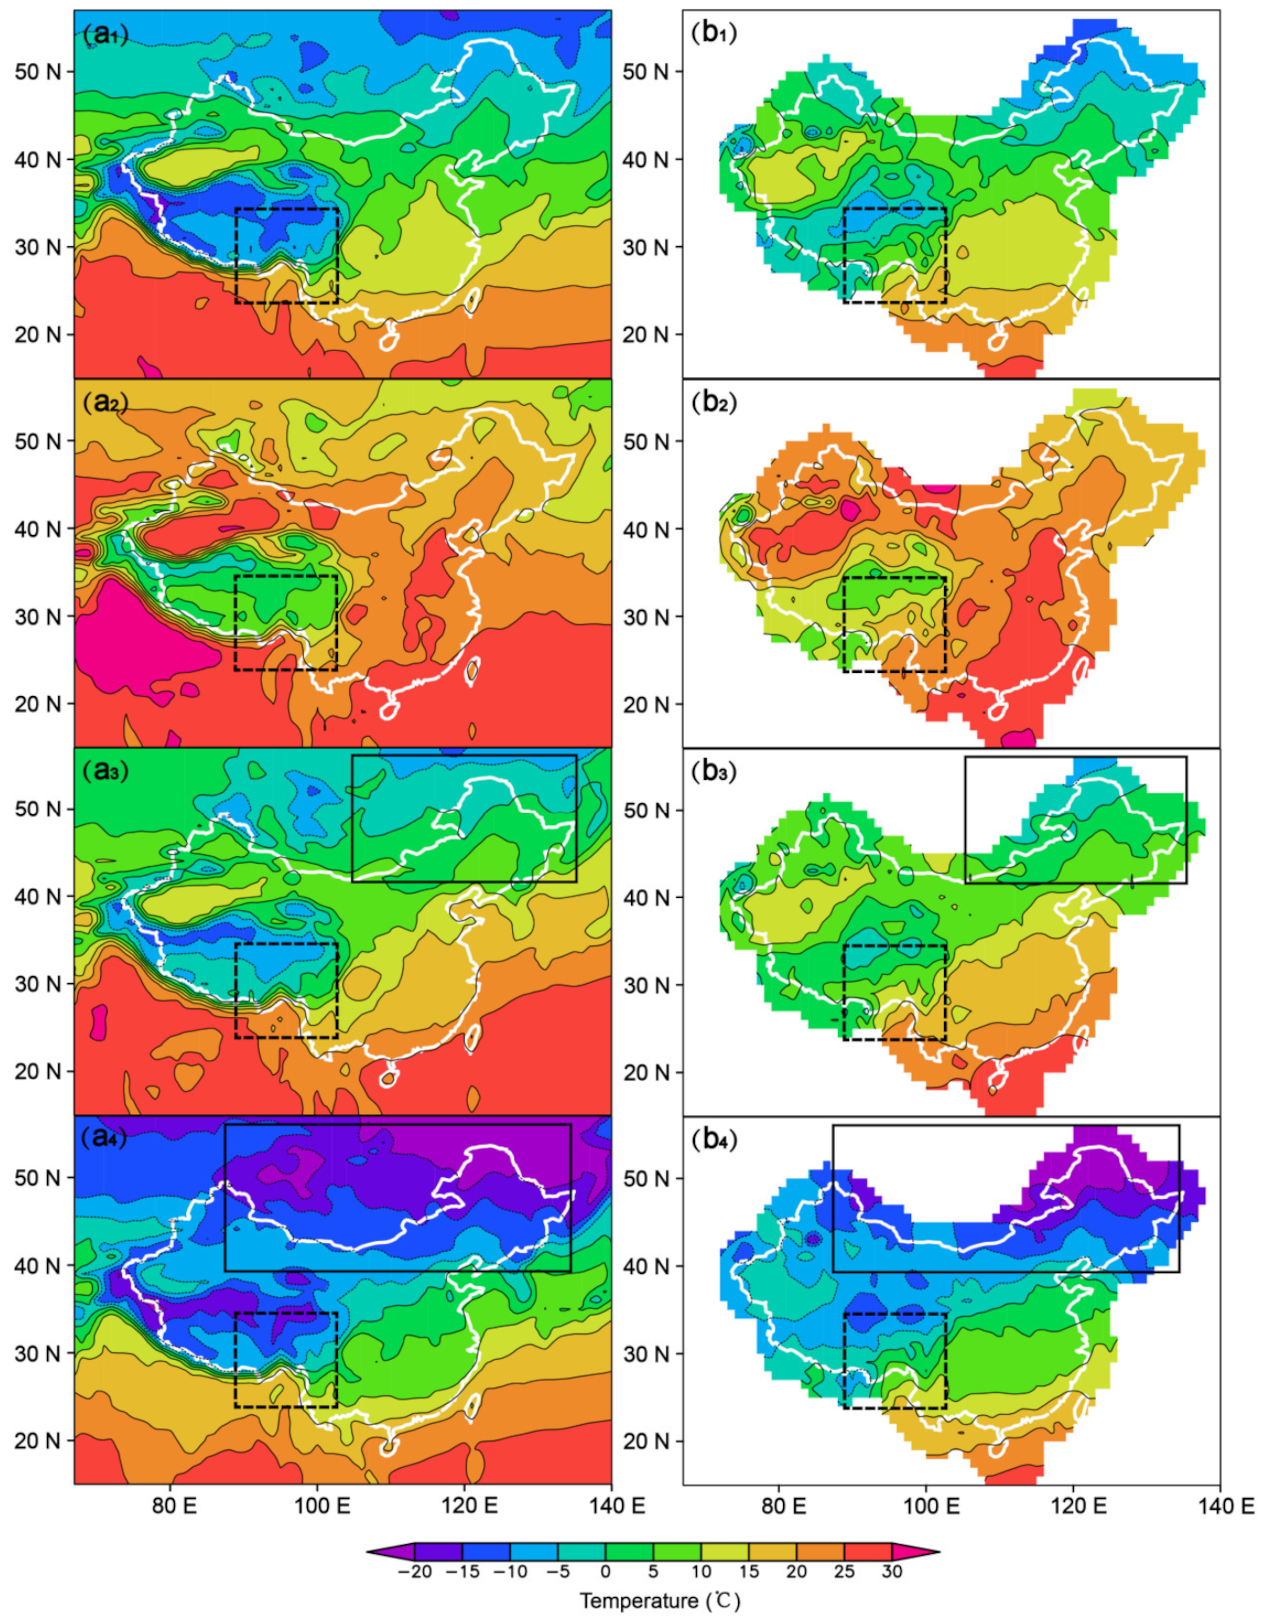
Compared to the ECMWF 2 m temperature forecast errors over eastern China during 2007–2010 [14], the ECMWF 2 m temperature forecast errors over the whole China region during 2015–2018 were improved significantly, with the annual mean root square errors of 2 m temperature forecast averaged over the whole China region and within 72-h forecast lead-times for 2015, 2016, 2017 and 2018 being 2.19, 2.21, 2.21 and 2.24 °C. This indicates that the ECMWF model has a good and stable forecast skill for the 2 m temperature in China as a whole. This section will focus on the description of characteristics of the ECMWF 2 m temperature forecast errors and then classify them to find out the areas and periods with large forecast errors based on their characteristics. The K-means clustering method is used to conduct spatio-temporal clustering analysis of the forecast error data, and three categories of forecast errors are finally obtained. Figure 1a describes the evolution of the centroid values (similar to the average or median values of various categories) of each category of the forecast errors, and Figure 1b–d describes, respectively, the distribution of national basic stations for these three categories. The red line in Figure 1a shows the temperature forecast higher than the observation, which is defined as the first category. This category of forecast error is mainly distributed in the stations located in northern China (see Figure 1b and the solid frames in Figure 2). The low values of forecast error for the first category occurs in March to June, and then the forecast error gradually increases till December. In Figure 1a, the black line shows the temperature forecast error being not obvious, and it is defined as the second category, which occurred mainly in the plain site over eastern Tibetan Plateau (Figure 1c). The lowest value of the second category of forecast error largely occurs in June, and the highest value appears near December. The blue line in Figure 1a shows the temperature forecast lower than the observation, which is defined as the third category, occurring in large at the sites over the eastern Tibetan Plateau (see Figure 1d and the dashed frames in Figure 2). It is noted that the evolution characteristics of forecast errors for the third category in 2015 are somewhat different from those in 2016–2018. For example, in 2015, the low values of such forecast errors occurred near March and December, while the high values occurred near June. In 2016–2018, the low values of this category of forecast error occurred near March and October, and the high values occurred near June and December. On the other hand, the absolute values of the forecast error of the second category are very small as compared with those of the first and third categories, which may be attributable to random process. Therefore, this paper will mainly analyze the forecast errors of the first and third categories. Additionally, in view of the above analysis, the average forecast errors in March, June, October and December from 2016 to 2018 are selected for analysis below.

4. Attribution Analysis of Positive 2 m Temperature Forecast Errors to Low-Level Circulation

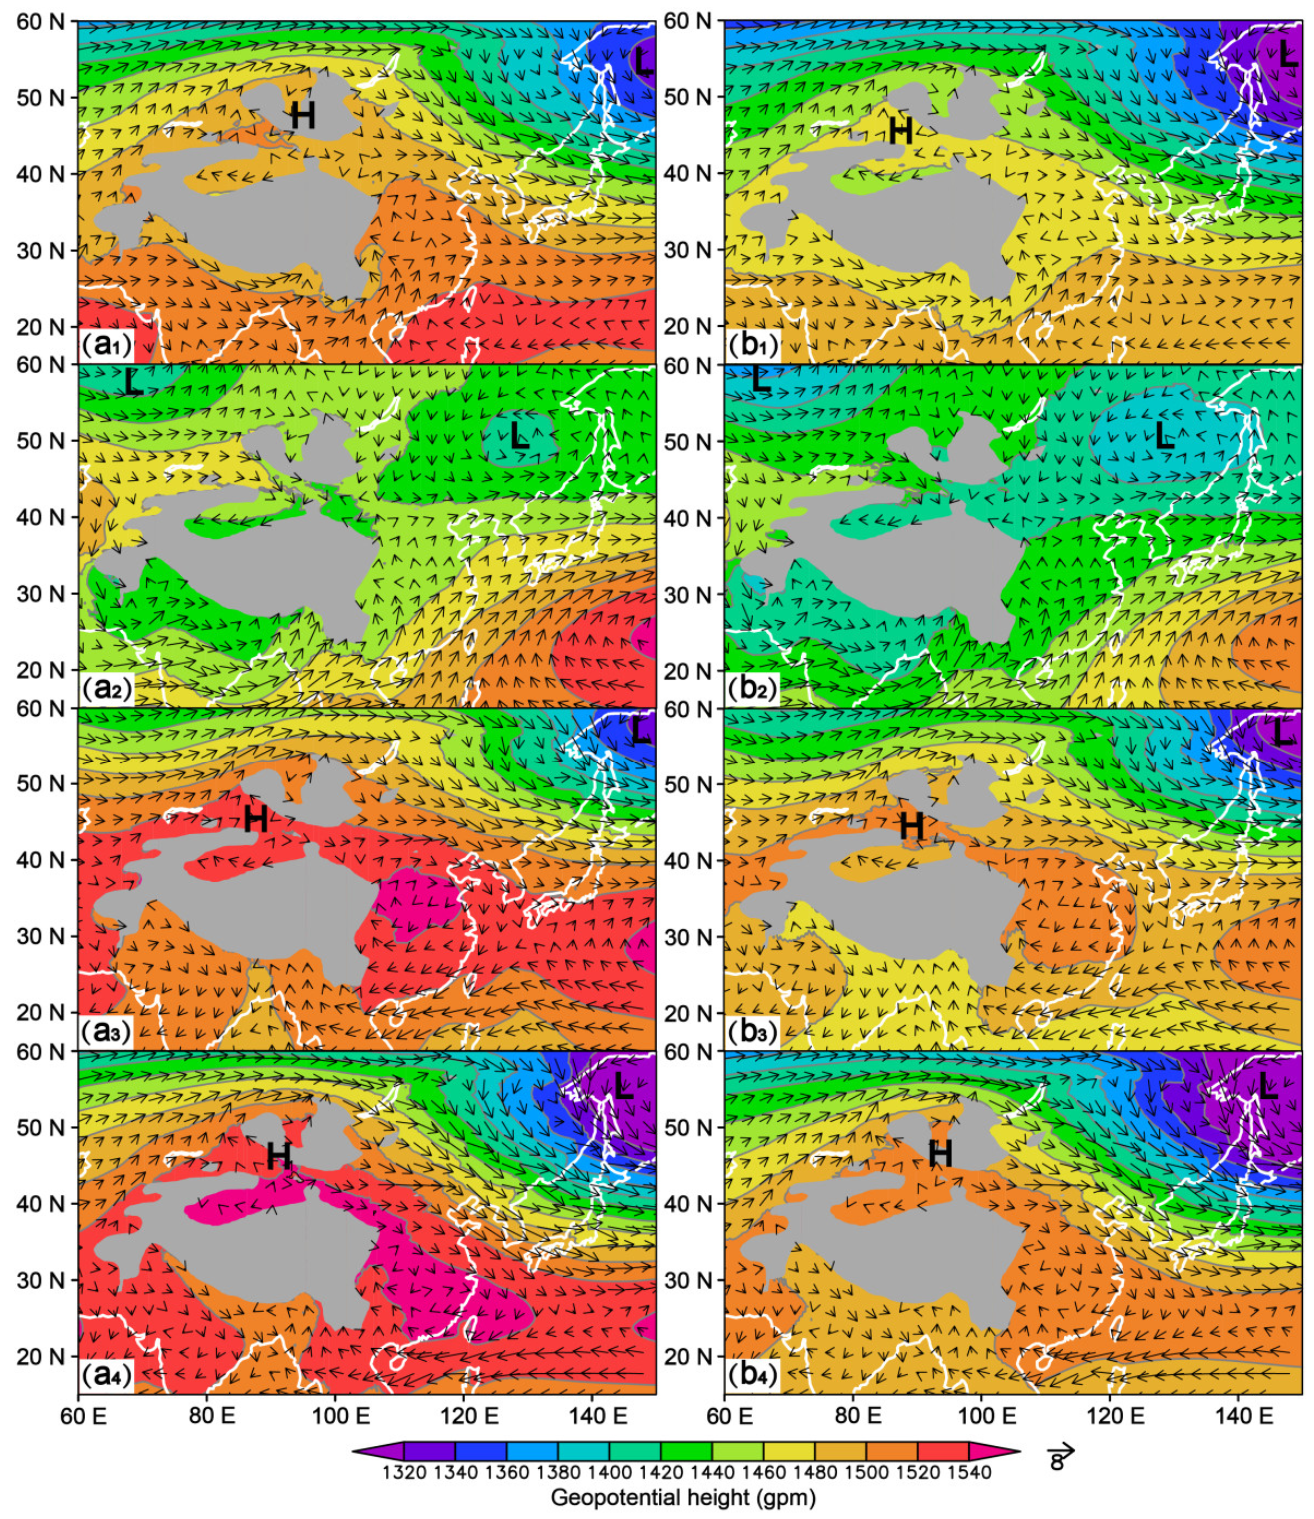
The above analysis shows that the higher temperature forecast mainly occurs at stations in northern China, and the altitude of these stations is basically below 850 hPa. In view of this, a low-level isobaric surface (850 hPa) is employed for analyzing the possible causes as shown in Figure 3, in which the forecasted and observed monthly averaged 850 hPa geopotential height fields over March, June, October and December 2016–2018, with the ERA5 reanalysis field of 0.25° × 0.25° used as an observation field, are given. Figure 3 shows that in March, October and December, a belt area from northwestern to northeastern China was mainly affected by a pattern of one ridge and one trough (highlighted by use of “H” and “L” in Figure 3), with the high pressure ridge located near the Mongolian Plateau and the low pressure trough located near Northeastern Asia. From October to December, the low pressure trough strengthened and extended toward the southwest (see Figure 3a3,a4 or Figure 3b3,b4), and from December to March it weakened and retreated toward the northeast (Figure 3a1,a4 or Figure 3b1,b4). In June, around the boreal summer, the northeastern and northern China regions are controlled by the cold vortices, with an obvious cyclonic low pressure system existing in the northeast region (Figure 3a2 or Figure 3b2). Overall, there is no significant change in the positions of the high pressure ridge and low pressure trough forecasted in March, October, and December, but the intensity of high pressure ridge is stronger, while the low pressure trough is weaker compared with observations. At the same time, the forecasted location of the low-level low pressure system as is in the northeast region in June has no significant change, but its intensity is obviously weaker than the observation. It can be seen from Figure 3 that the deviation of the forecasted low-level circulation situation relative to the observed low-level circulation is mainly manifested in intensity, and there is an obvious positive systematic deviation of geopotential height. Considering that the above-mentioned forecast field is the average field of the 3-day forecasts, and the general forecast field deviation will increase with the forecast lead-time, therefore, this systematic deviation is likely to be attributed to a large systematic deviation in the low-level circulation that might occur in longer forecast lead-times (such as those within the 2nd day or the 3rd day.)
In order to more clearly analyze the distribution characteristics of the errors in the forecasted low-level circulation, the longitudinal anomalies distribution of the differences between ECMWF-forecasted and reanalyzed 850 hPa wind vectors and geopotential heights for March (a), June (b), October (c), and December (d) averaged over the three years (2016–2018) is given in Figure 4. Here, the longitudinal anomaly calculation of the geopotential height difference between forecasts and observations is made to mainly eliminate the longitudinal mean of the geopotential height systematic deviation mentioned above (that is, the obvious positive deviation of geopotential height in this case), thus highlighting the distribution characteristics of the forecasted circulation error. It can be seen from Figure 4 that for March, June and December, the forecasted geopotential height error has a clear positive longitudinal anomaly center on the windward side (northwest side) of the Mongolian Plateau (see the “H“ in Figure 4a,c,d), and at the downwind direction of the positive longitudinal anomaly center, a significant negative zonal anomaly center (the “L” in Figure 4a,c,d) is produced, in which there was a positive–negative–positive zonal anomaly center pattern along the wind-direction in December, as seen in Figure 4d (shown by “H”-”L”-”H”). These positive and negative longitudinal anomalies correspond to the anticyclonic and cyclonic wind fields, respectively. It can be inferred that they are caused by a series of effects as the differential wind encounters the Mongolian Plateau and produces the circumfluence. However, due to the different positions and distribution patterns of the trough and ridge in different months, the distribution of the longitudinal anomaly of the difference in geopotential height caused by the circumfluence will present distinct characteristics. In March, since the low-pressure trough on the west side of the high-pressure ridge was deep, and the wind field on the upwind side (northwest side) of the Mongolian Plateau was significantly compressed, the anticyclonic circumfluence and the related positive longitudinal anomaly center of geopotential height difference occurred in the downwind side (northeast side) of the Mongolian Plateau where the differential wind was weaker. The anticyclonic circumfluence produces obvious cyclonic vortices and negative longitudinal anomaly center related to the geopotential height difference on the downwind side (Figure 3a1 or Figure 3b1 and Figure 4a). At the same time, the stronger westerly wind occurred on the northern side of the Mongolian Plateau, and thus the anticyclonic circumfluence and positive longitudinal anomalies of geopotential height differences stretched significantly to the downward wind direction, which lead the position of the accompanying cyclonic vortices, and the center of the negative longitudinal anomaly of geopotential height differences is easter than normal. In October, the intensity of the trough and ridge became weaker, and their positions moved northward. The positive longitudinal anomaly center of geopotential height difference and the related anticyclonic circumfluence occurred on the upwind side (northwest side) of the Mongolian Plateau. The center of the negative longitudinal anomaly associated with the cyclonic vortex and its related geopotential height difference appear on the east side of the Mongolian Plateau (Figure 3a3 or Figure 3b3 and Figure 4c). In December, the Northeast Asian major trough deepened significantly and approached southwestwards, and the position of both the trough and ridge shifted westwards. At the same time, the low-pressure trough on the west side of the Mongolian Plateau deepened, causing a stronger anticyclonic circumfluence and a positive longitudinal anomaly center of geopotential height difference to occur on the west side of the Mongolian Plateau, followed by cyclonic vortices and anticyclonic flows on the north and northeast sides of the Mongolian Plateau, corresponding to the negative and positive longitudinal anomalies of the geopotential height difference (Figure 3a4 or Figure 3b4 and Figure 4d). In June, the low pressure system that was weaker than normal as was done by forecasting resulted in a strong anticyclonic differential circulation with a positive longitudinal anomaly center of geopotential height difference in the northeast. The anticyclonic circulation brought a difference of easterly winds to the Mongolian Plateau, and this easterly difference caused a cyclonic circumfluence on its north side (Figure 3a2 or Figure 3b2 and Figure 4b).
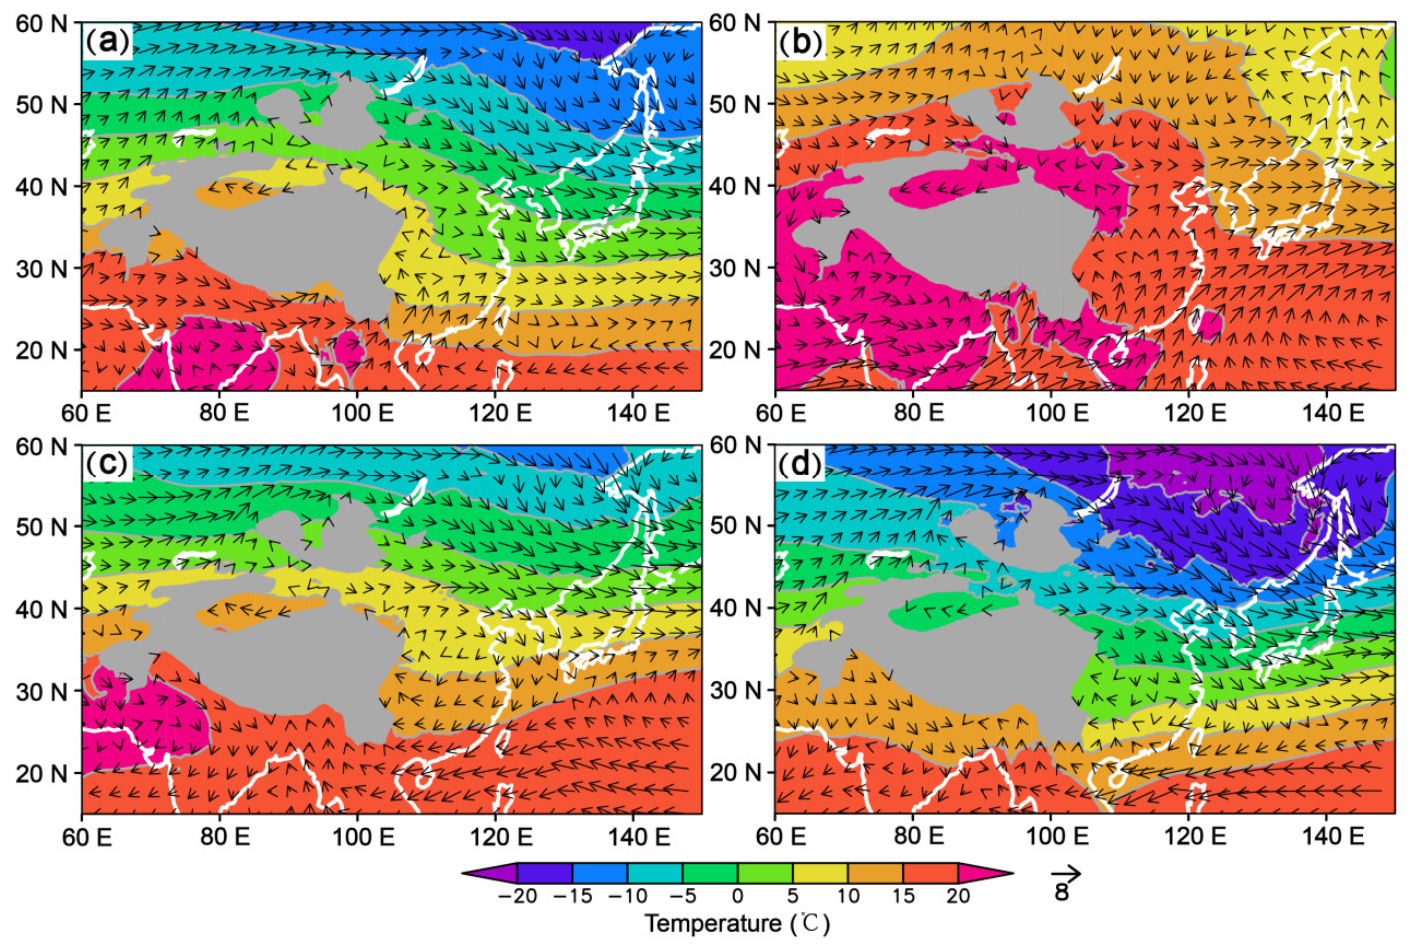
Northern China and the northeast are controlled by the southerly differential wind on the east side of the cyclonic circulation in March and October (Figure 4a,c), while in December, it is controlled by the large areas of southeast differential wind on the west and south sides of the anticyclonic differential circumfluence (Figure 4d), and in June, the west side of the anticyclonic differential circulation in the northeast brought southerly differential winds to northern China (Figure 4b). These differential southerly winds help to weaken the northwesterly wind behind the Northeast Asian major trough, thereby inhibiting the degree of cooling in northern China, and causing positive temperature forecast deviations in these areas. On the other hand, in conjunction with the low-level temperature distribution analyses, the temperature gradient in northern China is the largest in December (Figure 5d), and the large areas of differential southeasterly wind bring warmer temperature advection differences to northern China, resulting in the difference in temperature advection therein being the largest in December. As a result, the largest positive temperature forecast deviations for the stations in these areas were caused in this month, while in other months, due to smaller range of the differential southerly wind (March and October; Figure 4a,c) or weaker temperature gradient (June; Figure 5b) the positive deviation of temperature forecasts at these sites is relatively small.
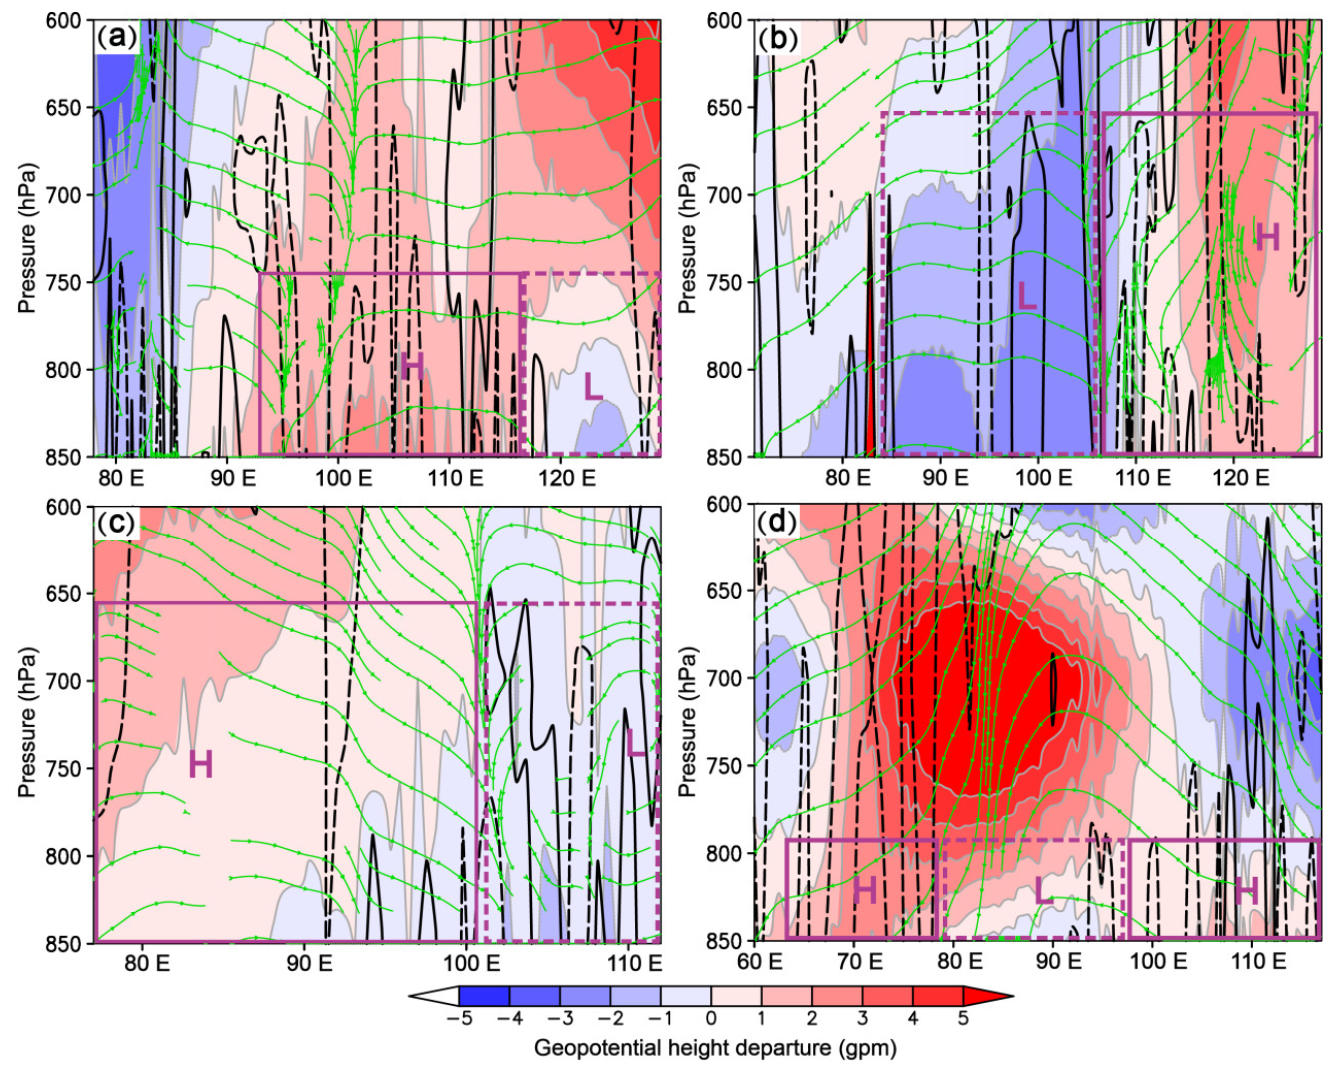
The above analysis shows that as a whole, the terrain plays a very important role in the specific distribution of the forecast deviation. In order to verify whether the longitudinal anomalies of the geopotential height differences and the differential circumfluence near the Mongolian Plateau are related to the plateau topography, the vertical cross-sections (Figure 6) of the longitudinal anomalies of the geopotential height difference, differential wind fields and its vorticity distribution, are made along the curves around the Mongolian Plateau shown in Figure 4. When the longitudinal anomaly center of the geopotential height difference or the vorticity difference center weakens from the lower-level to the upper-level, it can be regarded as the basis that the topography of the Mongolian Plateau plays an important role. On the contrary, it can be regarded as the upper-level circulation system having a main influence if the longitudinal anomaly center of the geopotential height difference or the vorticity difference center weakens gradually from upper level to lower level. Based on this, it might be seen from Figure 6 that for March, June, October, and December, the Mongolian Plateau has a significant effect on the differential wind, and the positive and negative longitudinal anomaly center of the geopotential height difference and its differential circulation are directly related to the plateau topography in March and December. They are located below 750 hPa and match the plateau height (Figure 6a,d). The positive longitudinal anomaly center of the geopotential height difference and its differential circulation in June and October are mainly due to the interaction of the upper-air circulation system with the Mongolian Plateau, which induces negative zonal anomaly center of the geopotential height difference and its differential circulation on the north and east sides of the plateau, respectively (Figure 6b,c). It can be seen that with regard to the systematic deviation of the forecast, the terrain plays a very important role in the specific distribution of the geopotential height and its circulation difference.

5. Attribution Analysis of Negative 2 m Temperature Forecast Errors to Mid-Level Circulation

The above analysis shows that the third category of temperature forecast is relatively lower than the observation, which is distributed mainly in the southeastern part of the Qinghai-Tibet Plateau. Different from northern China, the southeastern part of the Qinghai-Tibet Plateau has a high altitude. The forecasted and observed monthly averaged 500 hPa circulation situation fields for March, June, October and December over 2016–2018 are shown in Figure 7. It can be seen that in March, October, and December, the Qinghai-Tibet Plateau was mainly controlled by a strong straight westerly airflow, and no strong troughs and ridges appeared (Figure 7b1,b3,b4), while in June, the plateau is located in the saddle field of geopotential height, controlled by the weak westerly airflow (Figure 7b2). For all months, when the westerly airflow encounters the topography located over the southern side of the plateau, there is an obvious anticyclonic shear to form (the dotted line in Figure 7), and it then turns into a southwesterly wind, which is related to terrain uplift and ground drag.
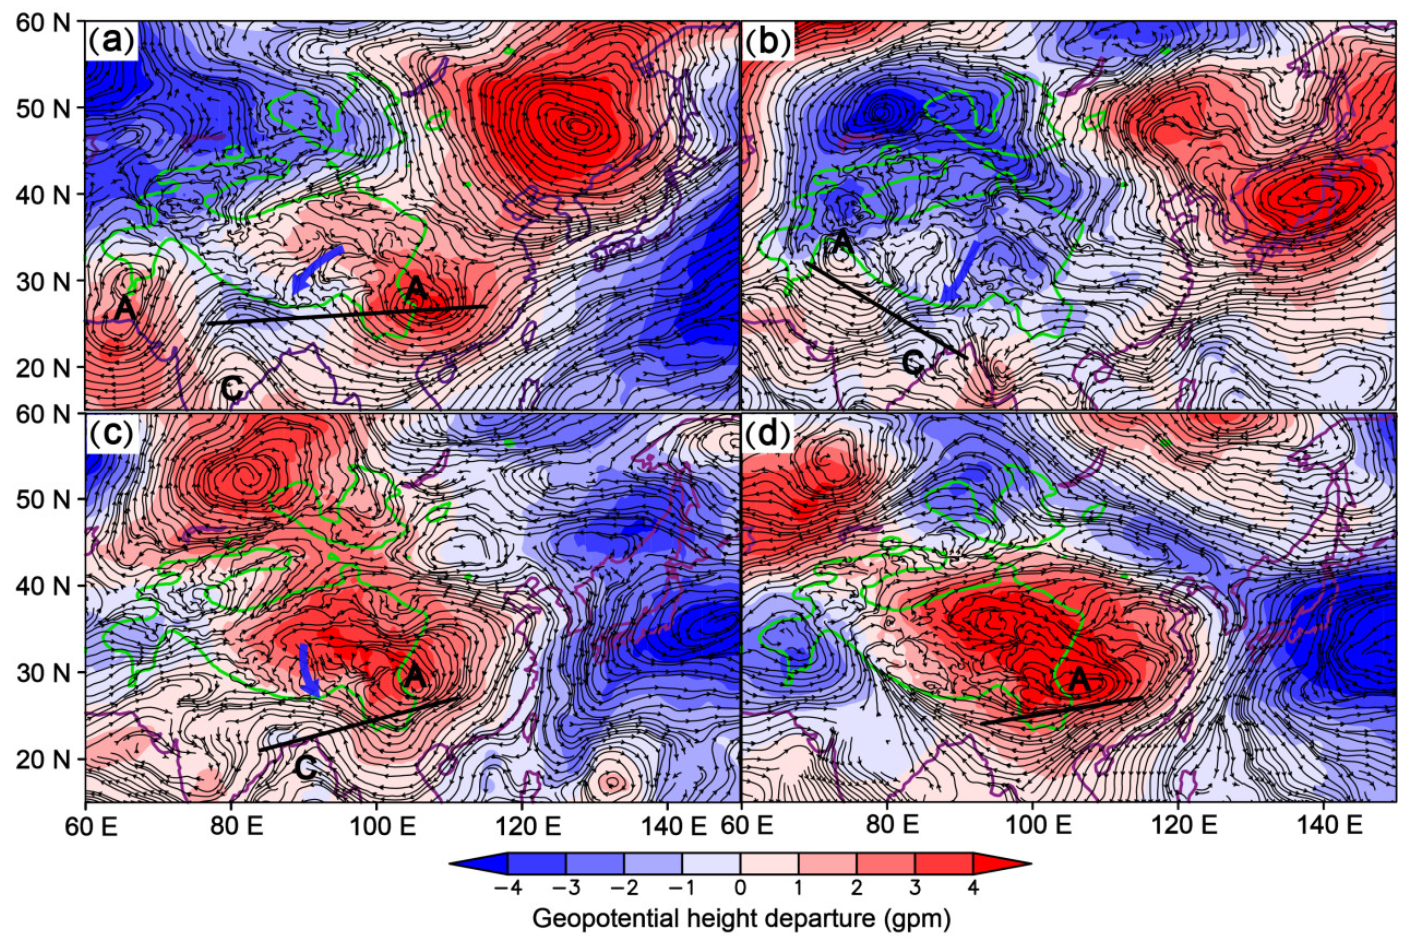
From the longitudinal anomaly distributions of the differences between ECMWF-forecasted and reanalyzed 500 hPa wind vectors and geopotential heights for March, June, October, and December averaged over the three years (2016–2018) (Figure 8), in March, June, October, and December, the south side of the Qinghai-Tibet Plateau is controlled by the differential easterly wind, that is, the forecasted westerly wind in this area is weaker. The topography on the south side of the Qinghai-Tibet Plateau is characterized by convex southward on both sides and concave northward in the middle. The differential easterly wind forms a distinct anticyclonic differential circulation near the convex-southward terrain on both sides, and a cyclonic differential circulation near the middle concave-northward terrain, that is, anticyclonic–cyclonic–anticyclonic differential circulations to be shaped from west to east along the southern side of the plateau, which correspond to the positive–negative–positive longitudinal anomaly centers of the geopotential height difference. However, in the different months, as the overall circulation situation behaves differently, the distribution positions of these differential circulations also change accordingly. In March, the anticyclonic–cyclonic–anticyclonic differential circulation distributed basically at an east–west direction along the southern side of the plateau (Figure 8a). In October, due to a small trough of low pressure that occurred in the westerly wind circulation on the south side of the plateau (Figure 7a3 or Figure 7b3), the differential circulation distribution turned into a cyclonic–anticyclonic differential circulation pattern, which appeared to be southwest–northeast distributed on the southeast side of the plateau (Figure 8c). Until December, the westerly wind on the south side of the plateau became flat, and the Northeast Asian major trough deepened (Figure 7a4 or Figure 7b4). The plateau area as a whole was controlled by the large anticyclonic difference circulation, and only an east–west flat anticyclone difference vortex appeared at the southeastern end of the plateau (Figure 8d). In June, the southern side of the plateau is located in the saddle-shaped field between the two anticyclonic differential circulations (Figure 7a2 or Figure 7b2), and the anticyclonic-cyclonic-anticyclonic differential circulation pattern is distributed at the northwest-southeast direction on the south side of the plateau (Figure 8b). In March, June and October, the differential winds of easterly or northeasterly at the north and northwest of the cyclonic circulation on the southern side of the plateau have a significant weakening effect on the westerly wind. The anticyclonic shear generated when westerly wind encounters the south side of the plateau became weaker, resulting in obvious differential northerly wind prevailing in the southern part of the plateau (Figure 8a–c). In contrast, in December, affected by the overall strong anticyclonic differential circulation of the plateau, the southern part of the plateau was controlled by the differential easterly wind (Figure 8d). Based on the 500 hPa temperature field distribution (Figure 9), the temperature gradient near the southern part of the plateau is in a north–south distribution, with colder north and warmer south. In view of this, in December, the direction of the differential easterly airflow that appeared in the southern part of the plateau was perpendicular to the direction of the temperature gradient (Figure 8d and Figure 9d), which was not conducive to the appearance of large temperature deviations. That might, to some extent, explain why there is no large temperature forecast deviation is found from these stations located in the area southeast of the Qinghai-Tibet Plateau in this month. In June, due to the strengthening of solar radiation, the plateau as a whole is a relatively uniform high temperature area with a weak temperature gradient (Figure 9b). Although the southern part of the plateau is controlled by differential northerly winds (Figure 8b), it is not conducive to strong cold temperature advection difference to form, so that the deviation of the temperature forecast for that month is also small. In contrast, in March and October, the differential northerly airflow and the obvious north–south temperature gradient in the southern part of the plateau are conducive to the cold temperature advection difference to form (Figure 8a,c and Figure 9a,c), resulting in a large negative temperature forecast deviation in these two months.
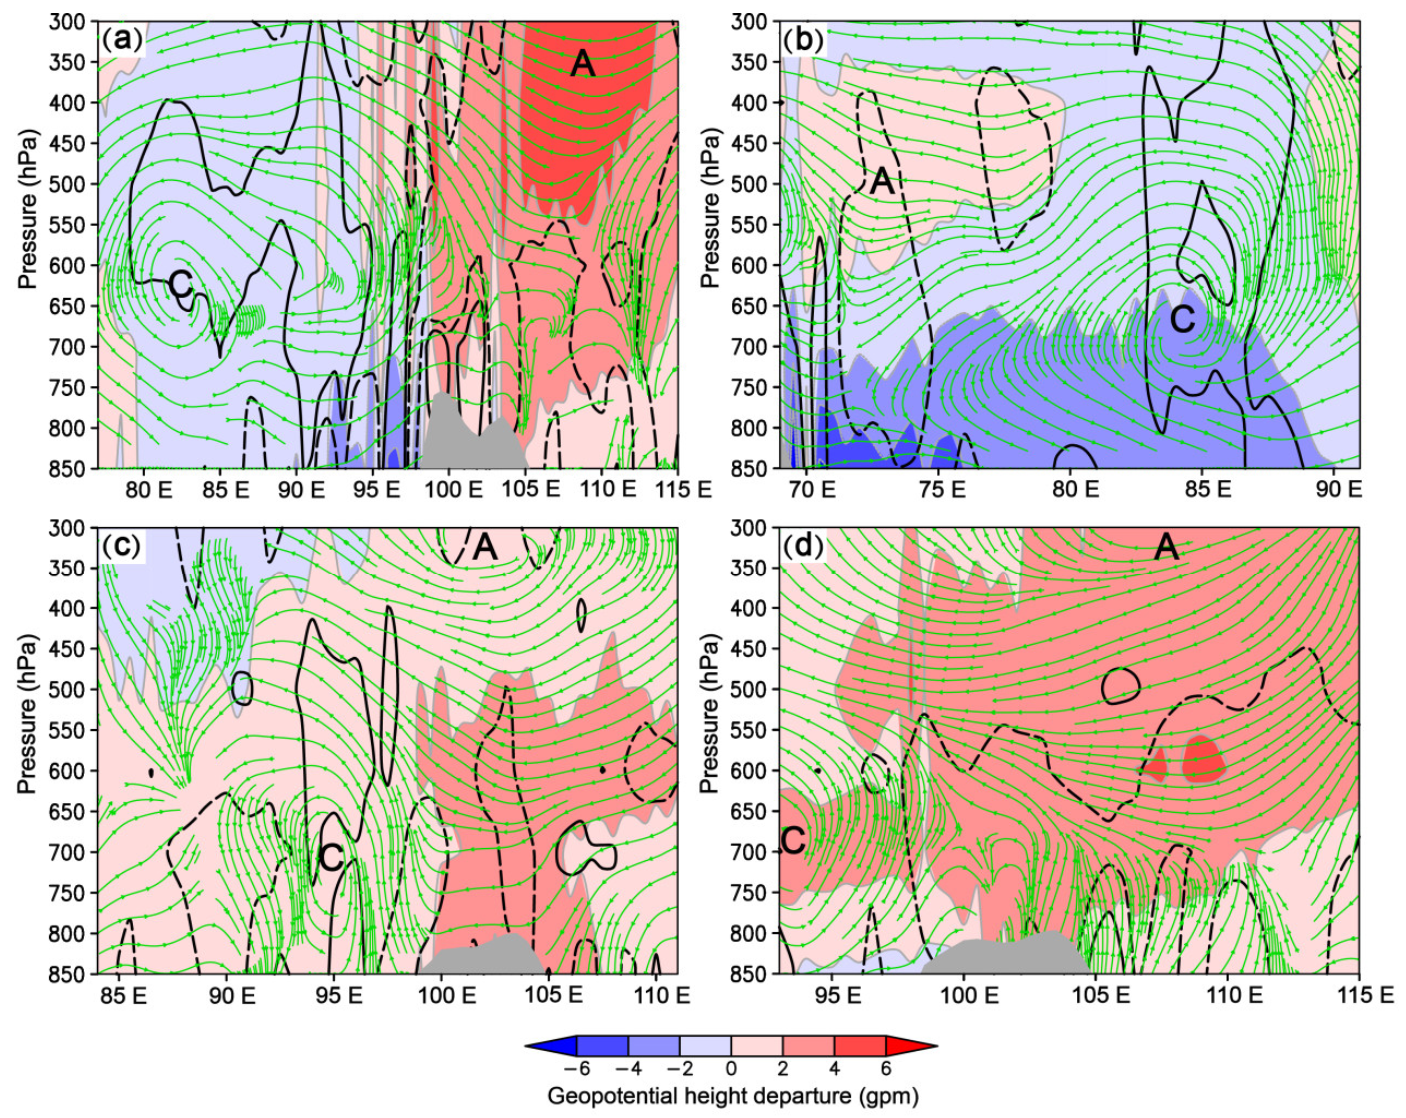
Figure 10 shows the vertical cross-sections of the vorticity differences, horizontal wind vector differences, and the longitudinal anomalies of the geopotential height differences between the ECMWF-predicted and the reanalyzed along the straight lines shown in Figure 8a–d. From the vertical profile distribution of these parameters, it can be seen that at upper levels, the southern part of the Qinghai-Tibet Plateau is mainly controlled by positive longitudinal anomalies of geopotential height differences, accompanied by strong anticyclonic differential circulation. When the anticyclonic differential circulation reaches below the middle layer, that is, the levels where the Qinghai-Tibet Plateau is located, an obvious cyclonic differential circulation is induced on the leeward or upwind side of the anticyclonic differential wind, with the center of the cyclonic circulation being below 500 hPa (that is, below the height above sea level of the plateau). These different cyclonic circulations correspond to lower longitudinal anomalies of geopotential height differences and positive vorticity differences. It can be seen that the above-mentioned differential circulation is caused by the response of the Qinghai-Tibet Plateau to the upper level anticyclonic differential circulation. In addition, the intensity of the upper level anticyclonic differential circulation has a significant impact on the altitude touched by the cyclonic differential circulation that is induced via the interaction with the plateau. When it is strong, the coverage area increases, and the induced cyclonic differential circulation is suppressed, which will not affect the behavior of atmospheric parameters near the surface of the plateau, such as the vertical profile distribution in December (Figure 10d); when it is weak, the induced cyclonic differential circulation can expand to higher altitudes, which will have a significant impact on the behavior of atmospheric parameters near the ground of the plateau, such as the vertical profile distribution in March, June and October (Figure 10a–c).

6. Conclusions and Discussion

Numerical weather prediction is the current main approach to providing quantitative weather forecasting, and correcting its errors is an effective method often used by operational forecasting centers. Correcting numerical forecasts requires analysis of forecast errors, including statistical analysis of errors and physical attribution analysis. The physical attribution analysis of forecast errors not only reveals the spatial and temporal characteristics of forecast errors, but also finds the source of them, thus additionally providing a scientific basis for error correction. Previous studies mainly focused on the statistical analysis of forecast errors before the correction. In contrast, this paper investigates the forecast errors with a physical attribution analysis, and takes the 2 m temperature as the research focus based on the ECMWF model forecasts that are commonly used by numerous operational forecast centers worldwide. The study first uses the 2 m temperature and upper-air circulation situation data for 2015–2018 to analyze the temporal and spatial distribution characteristics of the 2 m temperature forecast errors in China. The months and distribution areas with the largest temperature forecast errors are then identified, and the reasons for these forecast errors are analyzed and revealed from the perspective of the upper-level circulation situation. The main conclusions obtained from the analyses are as follows:
For China’s national surface stations, the temporal and spatial distribution of the average 2 m temperature forecast errors within 72 h forecasted by ECMWF can be mainly classified into three categories. The first category (Category 1) shows that the temperature forecast is relatively higher than the observation. This category of forecast deviation is mainly distributed in northwestern, northern and northeastern China, and the forecast error gradually increases from January to December on an intra-annual scale, and reaches its maximum around December. The second category (Category 2) shows that the temperature forecast error is not obvious. This category of forecast error is mainly distributed in the plain stations on the east side of the Qinghai-Tibet Plateau and south of northern China, with little change in time evolution. The third category (Category 3) shows that the temperature forecast is lower than the observation. This category of forecast error is mainly distributed in the stations over the southeastern part of the Qinghai-Tibet Plateau. The forecast error fluctuated with an alternative increase and decrease twice in the time evolution of the scale within the year. The largest forecast error occurred around March and October, while the smallest one occurred around June and December. These distributions of 2 m temperature forecast errors are basically consistent with those shown over eastern China during 2007–2010 [14], which indicated that the significant errors happened near northeast China and the region west to the Sichuan Province where the eastern Qinghai-Tibet Plateau is located.
For the stations in northern and northeastern China, which are stations with higher temperature forecasts than the observation in our case, from the monthly averaged upper level circulation situation over 2016–2018, they are mainly affected by northwesterly winds behind the Northeast Asian major trough (March, October and December) or controlled by the northerly wind on the west side of the upper level cold vortex over northeastern China (June). The error of the wind field forecasted by ECMWF produces circumfluence near the Mongolian Plateau, forming obvious differential circulations. Northern and northeastern China are controlled by the differential southerly wind on the east side of the cyclonic differential circulation in March and October. In December, they are controlled by the large differential southeasterly wind on the west and south sides of the anticyclonic differential circulation, while in June, the west side of the anticyclonic differential circulation over northeastern China brings differential southerly winds to northern China. These differential southerly winds weaken the influence of colder northerly winds on northern and northeastern China, resulting in higher 2 m temperature forecasts (than the observation) in these areas. In December, the temperature gradient in northern and northeastern China was the largest, and large areas of differential southeasterly wind brought the warmer temperature advection difference to northern and northeastern China, which led the largest positive temperature forecast error to the stations in these areas in December. For other months, due to the small differential southerly wind range (March and October) or the weaker temperature gradient (June), the positive temperature forecast errors of the stations in these areas are relatively small.
For the stations in the southeastern part of the Qinghai-Tibet Plateau which are stations with lower temperature forecasts than the observation in our case, from the monthly averaged upper level circulation situation over 2016–2018, it is mainly controlled by the flat and straight westerly wind. This westerly wind, under the effect of uplifting and drag due to the plateau existing, produced a distinct anticyclonic shear and southwesterly wind over the southern part of the plateau. The ECMWF forecast produces a differential easterly wind field on the south side of the plateau, and it encounters the terrain on the south side of the plateau to form an anticyclonic–cyclonic–anticyclonic differential circulations pattern from east to west. Among them, the easterly wind on the north side of the cyclonic differential circulation has a significant weakening effect on the westerly wind, inhibiting the formation of anticyclonic shear and southwesterly wind in the southern part of the plateau, thereby weakening the warmer temperature advection and thus resulting in lower temperature forecasts than the observation in the region. In December, the upper level anticyclonic differential airflow is the strongest over the plateau, with the southern part of the plateau being controlled by the differential easterly airflow. The direction of the differential airflow is perpendicular to the direction of the temperature gradient, which is not conducive to the appearance of large temperature deviations. In June, though the southern part of the plateau is controlled by the differential northerly airflow, the plateau as a whole is a relatively uniform high temperature area with weak temperature gradients, which is not conducive to the formation of obvious cold temperature advection differences so as to make the temperature forecast error of this month also small. In contrast, in March and October, the differential northerly airflow and the obvious north–south temperature gradient in the southern part of the plateau are very conducive to the cold temperature advection difference to occur, leading to the most obvious negative temperature forecast errors in these two months.
For 2 m temperature forecasting, in addition to the temperature advection caused by the upper-level circulation situation, local characteristics are also important influencing factors, such as the thermal characteristics of the underlying surface, the effects of precipitation and radiation, etc. This paper mainly analyzes the attribution of the 2 m temperature forecast errors from the angle of the upper-level circulation situation analysis. Future research needs to combine the above-mentioned local characteristics to conduct a more detailed attribution analysis of the 2 m temperature forecast errors, so as to provide a more comprehensive scientific basis for developing correction approaches to the 2 m temperature forecast.

Author Contributions

Conceptualization, X.W., X.S., Z.L. and J.S.; methodology, X.W., X.S. and J.S.; software, X.W., Z.L and Z.X.; validation, X.W., X.S. and J.S.; formal analysis, X.W., Z.L. and X.S; investigation, X.W., X.S., Z.L. and Z.X.; resources, X.W., X.S. and J.S.; data curation, X.W., X.S. and Z.L.; writing—original draft preparation, X.W. and Z.L.; writing—review and editing, X.W., X.S., Z.L.; visualization, X.W. and Z.L.; supervision, X.W. and X.S.; project administration, X.W., X.S. and J.S.; funding acquisition, X.S. and Z.L. All authors have read and agreed to the published version of the manuscript.

Funding

This research was funded by the China Meteorological Administration Special Public Welfare Research Fund (GYHY201306009), National key research and development program of China (2018YFC1506606), Key project of basic scientific research operating expenses of Chinese Academy of Meteorological Sciences (2019Z003) and Special key project of Chongqing technology innovation and application development (cstc2019jscx-tjsbX0007).

Institutional Review Board Statement

Not applicable.

Informed Consent Statement

Not applicable.

Data Availability Statement

The ERA5 data are obtained from https://www.ecmwf.int/en/forecasts/datasets/reanalysis-datasets/era5 (accessed on 2 April 2021), after registration. In addition, the forecast data from ECMWF are provided by the National Meteorological Information Center of China and only used to assess the forecast errors. They are not publicly available.

Acknowledgments

This research has received valuable suggestions for improvement provided by researcher Jisong Sun from the Chinese Academy of Meteorological Sciences in terms of weather dynamics analysis, and the authors hereby express their gratitude to him. All ERA5 data products are downloaded from https://www.ecmwf.int/en/forecasts/datasets/reanalysis-datasets/era5 (accessed on 2 April 2021).

Conflicts of Interest

The authors declare no conflict of interest.

References

  1. Lorenz, E.N. Atmospheric predictability experiments with a large numerical model. Tellus 1982, 34, 505–513. [Google Scholar] [CrossRef]
  2. Simmons, A.J.; Hollingsworth, A. Some aspects of the improvement in skill of numerical weather prediction. Q. J. R. Meteorol. Soc. 2002, 128, 647–677. [Google Scholar] [CrossRef]
  3. Bednář, H.; Raidl, A.; Mikšovský, J. Recalculation of error growth models’ parameters for the ECMWF forecast system. Geosci. Model Dev. 2020. under discussion. [Google Scholar] [CrossRef]
  4. Mengaldo, G.; Wyszogrodzki, A.; Diamantakis, M.; Lock, S.; Francis, X. Current and emerging time-integration strategies in global numerical weather and climate prediction. Arch. Comput. Methods Eng. 2019, 26, 663–684. [Google Scholar] [CrossRef] [Green Version]
  5. Muñoz-Sabater, J.; Lawrence, H.; Albergelb, C.; Rosnaya, P.; Isaksen, L.; Mecklenburg, S.; Kerr, Y.; Drusch, M. Assimilation of SMOS brightness temperatures in the ECMWF Integrated Forecasting System. Q. J. R. Meteorol. Soc. 2019, 145, 2524–2548. [Google Scholar] [CrossRef]
  6. Bannister, R.N. A review of operational methods of variational and ensemble-variational data assimilation. Q. J. R. Meteorol. Soc. 2017, 143, 607–633. [Google Scholar] [CrossRef] [Green Version]
  7. Buizza, R.; Miller, M.; Palmer, T.N. Stochastic representation of model uncertainties in the ECMWF ensemble prediction system. Q. J. R. Meteorol. Soc. 1999, 125, 2887–2908. [Google Scholar] [CrossRef]
  8. Charron, M.; Pellerin, G.; Spacek, L.; Houtekamer, P.L.; Gagnon, N.; Mitchell, H.L.; Michelin, L. Toward random sampling of model error in the Canadian ensemble prediction system. Mon. Weather Rev. 2010, 138, 1877–1901. [Google Scholar] [CrossRef]
  9. Jung, T. Systematic errors of the atmospheric circulation in the ECMWF forecasting system. Q. J. R. Meteorol. Soc. 2005, 131, 1045–1073. [Google Scholar] [CrossRef]
  10. Jung, T.; Tompkins, A.; Rodwell, M. Systematic errors in the ECMWF forecasting system. ECMWF Shinfield Park Read. Berks. Rg2ax 2003, 107, 96. [Google Scholar]
  11. Heckley, W.A. Systematic errors of the ECMWF operational forecasting model in tropical regions. Q. J. R. Meteorol. Soc 1985, 111, 709–738. [Google Scholar] [CrossRef]
  12. Jung, T.; Tompkins, A.M.; Rodwell, M.J. Some aspects of systematic error in the ECMWF model. Atmos. Sci. Lett. 2005, 6, 133–139. [Google Scholar] [CrossRef]
  13. Kamga, A.F.; Fongang, S.; Viltard, A. Systematic errors of the ECMWF operational model over tropical Africa. Mon. Weather Rev. 2000, 128, 1949–1959. [Google Scholar] [CrossRef]
  14. Li, B.P.; Zhi, X.F. Comparative Study of Four Correction Schemes of the ECMWF Surface Temperature Forecasts. Meteorol. Mon. 2012, 38, 897–902. (In Chinese) [Google Scholar]
  15. Zhao, G.R.; Li, Y.P.; Yan, Y.X. Analysis of the causes of temperature forecast errors for the four counties of Haibei State in Qinghai Province. Qinghai Sci. Technol. 2020, 27, 65–69. (In Chinese) [Google Scholar]
  16. Li, G.C.; Lian, Z.L.; Zhao, Y.C.; Niu, C.Y. Temperature forecast verification and its controls in Shijiazhuang Hebei province. J. Meteorol. Environ. 2009, 25, 15–18. (In Chinese) [Google Scholar]
  17. Yu, J.H.; Tang, J.X.; Dai, Y.H.; Yu, B.Y. Analyses in errors and their causes of Chinese typhoon track operational forecasts. Meteorol. Mon. 2012, 38, 695–700. (In Chinese) [Google Scholar]
  18. Chang, L.; Yu, J.H. Analysis of tropical cyclone motion velocity anomalies over the western North Pacific and their forecast error. Acta Atmos. Sci. 2017, 40, 71–80. (In Chinese) [Google Scholar]
  19. Wang, W.B.; Gao, X.M.; Yang, M.; Wang, S.J.; Wang, S.Y. Analysis on the causes and forecast error of a local short-time heavy rainfall. J. Mar. Meteorol. 2019, 39, 142–150. (In Chinese) [Google Scholar]
  20. Li, R.P.; Guo, X.M.; Li, Z.C. Analysis and test about possible reasons for temperature change in Shanxi province. Meteorol. Environ. Sci. 2015, 38, 77–81. (In Chinese) [Google Scholar] [CrossRef]
  21. Weyn, J.A.; Durran, D.R.; Caruana, R.; Cresswell-Clay, N. Sub-seasonal forecasting with a large ensemble of deep-learning weather prediction models. arXiv 2021, arXiv:2102.05107. [Google Scholar]
  22. Buckingham, C.; Marchok, T.; Ginis, I.; Rothstein, L.; Rowe, D. Short-and medium-range prediction of tropical and transitioning cyclone tracks within the NCEP Global Ensemble Forecasting System. Weather. Forecast. 2010, 25, 1736–1754. [Google Scholar] [CrossRef]
  23. Aminyavari, S.; Saghafian, B.; Delavar, M. Evaluation of TIGGE ensemble forecasts of precipitation in distinct climate regions in Iran. Adv. Atmos. Sci. 2018, 35, 457–468. [Google Scholar] [CrossRef]
  24. Zheng, Z.H.; Feng, G.L.; Huang, J.P.; Chou, J.F. Predictability-based extended-range ensemble prediction method and numerical experiments. Acta Phys. Sin. 2012, 61, 199203. (In Chinese) [Google Scholar]
  25. Gu, R.Y.; Song, G.Y.; Zhang, G.; Wang, D.M.; Lan, W.U. Research on the integrating methods of numerical weather prediction in inner Mongolia. J. Chengdu Univ. Inf. Technol. 2011, 26, 451–454. (In Chinese) [Google Scholar]
  26. Zhi, X.F.; Ji, X.D.; Zhang, J.; Zhang, L.; Bai, Y.Q.; Lin, C.Z. Multimodel ensemble forecasts of surface air temperature and precipitation using TIGGE datasets. J. Atmos. Sci. 2013, 36, 257–266. (In Chinese) [Google Scholar]
  27. Wei, X.M.; Sun, X.G.; Sun, J.L.; Yin, J.F.; Sun, J.; Liu, C.J. Preliminary study of a modified variant weight technique for improving multi-model ensemble forecasting accuracy. J. Meteorol. Soc. Jpn. 2021. under review. [Google Scholar]
  28. Durai, V.R.; Bhradwaj, R. Evaluation of statistical bias correction methods for numerical weather prediction model forecasts of maximum and minimum temperatures. Nat. Hazards 2014, 73, 1229–1254. [Google Scholar] [CrossRef]
  29. Alidoost, F.; Stein, A.; Su, Z.; Sharifi, A. Three novel copula-based bias correction methods for daily ecmwf air temperature data. Hydrol. Earth Syst. Sci. 2017. under discussion. [Google Scholar]
  30. Xue, C.B.; Chen, X.; Zhang, Y.; Zheng, J.; Ma, X.H.; Zhang, Y.B.; Pan, L.J. Bias correction for the 2m temperature forecast of ECMWF high resolution model. Meteorology 2019, 45, 831–842. (In Chinese) [Google Scholar]
  31. Zhang, C.; Li, N.; Jia, J. Test of ECMWF refined net numerical 2m temperature forecast data in temperature Forecasting in Urumqi. Meteorol. Deserts Oasis 2015, 9, 62–68. (In Chinese) [Google Scholar]
  32. Xie, H.; Wu, L.; Xie, W.; Lin, Q.; Liu, M.; Lin, Y. Improving ECMWF short-term intensive rainfall forecasts using generative adversarial nets and deep belief networks. Atmos. Res. 2020, 249, 105281. [Google Scholar] [CrossRef]
  33. Zhao, H.; Huang, X.; Huang, Y.; Jin, J. A revised forecast method of ECMWF precipitation based on CNN feature extraction. Available online: https://iopscience.iop.org/article/10.1088/1755-1315/658/1/012025 (accessed on 2 April 2021).
  34. Yang, Y.P.; Liu, L.Y.; Ni, Z.P.; Gao, L. Evaluation on ECMWF typhoon track forecast that affects Zhejiang province under different synoptic situation. Ocean Forecast 2019, 36, 70–78. (In Chinese) [Google Scholar]
  35. Niu, R.Y. The performance verification of the Medium-Range Forecast for T639 and ECMWF and Japan Model from December 2008 to February 2009. Meteorol. Mon. 2009, 35, 112–119. (In Chinese) [Google Scholar]
  36. Zhang, N.N.; Huang, G.; Wu, M.L.; Liang, H.; Sheng, Y.; Liu, G.Y. Contrastive verification of three numerical prediction products in the northeast of China in 2010. J. Meteorol. Environ. 2012, 28, 28–34. (In Chinese) [Google Scholar]
  37. Zhang, Y.M. Comparative analysis of different numerical forecast products and their effect verification. Sci. Technol. Innov. 2021, 8, 5–6. (In Chinese) [Google Scholar]
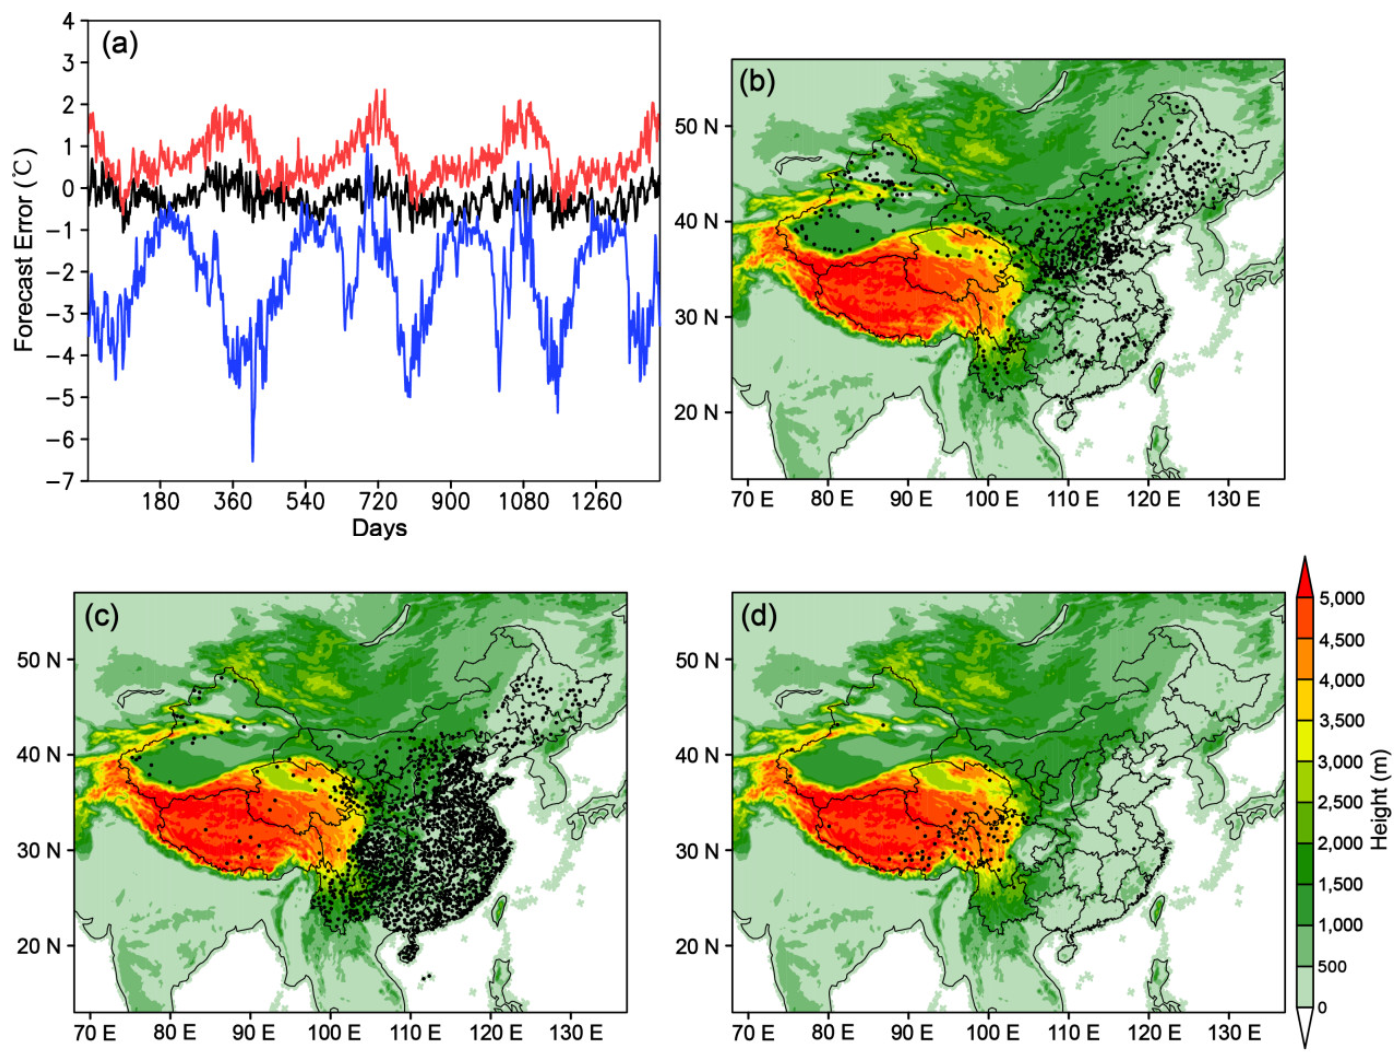
Figure 1. (a) Classification of the 2 m temperature forecast errors (units: °C) of the surface stations in China from 2015 to 2018 using the K-means clustering method. (bd) Distributions of the surface stations presenting the three categories of 2 m temperature forecast errors that are shown in (a) (the red, black and blue contours, respectively). The color-shaded in (bd) are topographic heights (units: m).
Atmosphere 12 00725 g001
Figure 2. ECMWF-predicted (a1a4) and reanalyzed (b1b4) 2 m temperature distributions (shaded; units: °C) of March (a1,b1), June (a2,b2), October (a3,b3), and December (a4,b4) averaged over the three years (2016–2018). The black solid and dashed frames in each panel mark the areas with the predicted temperature being higher and lower than the observation, respectively.
Atmosphere 12 00725 g002
Figure 3. ECMWF-predicted (a1a4) and reanalyzed (b1b4) 850 hPa geopotential heights (shaded; units: gpm) and wind vectors (units: m·s−1) of March (a1,b1), June (a2,b2), October (a3,b3), and December (a4,b4) averaged over the three years (2016–2018). H and L stand for the centers of high and low geopotential heights, respectively. The Qinghai-Tibet Plateau and the Mongolian Plateau are grey-shaded.
Atmosphere 12 00725 g003
Figure 4. Longitudinal anomalies distribution of the differences between ECMWF-predicted and reanalyzed 850 hPa wind vectors (units: m·s−1) and geopotential heights (shaded; units: gpm) for March (a), June (b), October (c), and December (d) averaged over the three years (2016–2018). The green curves in (ad) are for the position along which the cross-section in Figure 6a–d is made. The red arrows mark the southerly branch that affects northern China. H and L stand for the centers of high and low geopotential heights, respectively. The Qinghai-Tibet Plateau and the Mongolian Plateau are grey-shaded.
Atmosphere 12 00725 g004
Figure 5. ECMWF-reanalyzed 850 hPa temperature (shaded; units: °C) and wind vector (arrow; units: m·s−1) fields for March (a), June (b), October (c), and December (d) averaged over the three years (2016–2018). The Qinghai-Tibet Plateau and the Mongolian Plateau are grey-shaded.
Atmosphere 12 00725 g005
Figure 6. Vertical cross-sections of the vorticity differences (solid and dashed lines are, respectively, for the vorticity contours of 0.2 × 10⁻⁵ and −0.2 × 10⁻⁵ s−1) and the longitudinal anomalies of the geopotential height difference (shaded; units: gpm) between the ECMWF-predicted and the reanalyzed along the curves around the Mongolian Plateau as are shown in Figure 4a–d. The solid frame “H” and dashed frame “L” in each panel of (ad) mark, respectively, the high and low value centers of the longitudinal anomaly of geopotential height differences in Figure 4a–d.
Atmosphere 12 00725 g006
Figure 7. ECMWF-predicted (a1a4) and reanalyzed (b1b4) 500 hPa geopotential heights (shaded; units: gpm) and wind vectors (units: m·s−1) of March (a1,b1), June (a2,b2), October (a3,b3), and December (a4,b4) averaged over the three years (2016–2018). The Qinghai-Tibet Plateau and the Mongolian Plateau are purple-shaded. Black-dashed lines stand for wind shear-lines.
Atmosphere 12 00725 g007
Figure 8. As in Figure 4, but for 500 hPa. The black lines in (ad) are for the position along which the cross-section in Figure 10a–d is made. The blue arrows mark the northerly currents that affect the southeastern part of the Qinghai-Tibet Plateau. C and A stand, respectively, for the centers of the cyclonic and anticyclonic systems. The areas bounded by green lines are for the Qinghai-Tibet Plateau and the Mongolian Plateau.
Atmosphere 12 00725 g008
Figure 9. As in Figure 5, but for 500 hPa. The areas bounded by black lines are for the Qinghai-Tibet Plateau and the Mongolian Plateau. (a) March; (b) June; (c) October; (d) December.
Atmosphere 12 00725 g009
Figure 10. Vertical cross-sections of the vorticity differences (solid and dashed lines are, respectively, for the vorticity contours of 0.2 × 10⁻⁵ and −0.2 × 10⁻⁵ s−1), horizontal wind vector differences, and the longitudinal anomalies of the geopotential height difference (shaded; units: gpm) between the ECMWF-predicted and the reanalyzed along the straight lines shown in Figure 8a–d. The “A” and “C” in each panel of (ad) are, respectively, for the anticyclonic and cyclonic center marked in Figure 8a–d. The mountain area of southeastern Qinghai-Tibet Plateau is grey-shaded.
Atmosphere 12 00725 g010
Publisher’s Note: MDPI stays neutral with regard to jurisdictional claims in published maps and institutional affiliations.