Article

Sub-Cloud Secondary Evaporation in Precipitation Stable Isotopes Based on the Stewart Model in Yangtze River Basin

1
College of Geography and Environmental Science, Northwest Normal University, Lanzhou 730070, China
2
Key Laboratory of Resource Environment and Sustainable Development of Oasis, Lanzhou 730070, China
*
Author to whom correspondence should be addressed.
Atmosphere 2021, 12(5), 575; https://doi.org/10.3390/atmos12050575
Submission received: 16 March 2021 / Revised: 24 April 2021 / Accepted: 25 April 2021 / Published: 28 April 2021
(This article belongs to the Section Climatology)

Abstract

:
The stable isotopes (2H, 18O) of precipitation change due to the sub-cloud secondary evaporation during raindrop fall. The study of the temporal and spatial variation of sub-cloud secondary evaporation and its causes by using hydrogen and oxygen stable isotopes is of great significance to the study of the regional water cycle process. Based on the hourly meteorological data of 648 meteorological stations in 17 provinces (cities) of the Yangtze River Basin from March 2018 to February 2019, we analyzed the temporal and spatial characteristics of precipitation excess deuterium variation (Δd) in the region, based on the improved Stewart model. We discuss the various influence factors under different magnitude Δd value change and the impact factor of each partition sub-cloud secondary evaporation influence of the difference. The results show the following: (1) In terms of hourly variation, the sub-cloud secondary evaporation in the daytime is stronger than that at night. In terms of monthly variation, different regions of the study area have different characteristics; that is, the effect of sub-cloud secondary evaporation is more significant in summer and autumn in the northern subtropics and south temperate zones, and in spring and summer in the mid-subtropics and plateau climate zones. (2) There were significant spatial differences in the study area in different seasons, and the effect of sub-cloud secondary evaporation was the most significant in the plateau climate area throughout the year. (3) When the rainfall is 0–5 mm, the temperature is >30 °C, the vapor pressure is <3 hPa, the relative humidity is 50–60%, and the raindrop diameter is 0.5–1 mm; the sub-cloud secondary evaporation effect is the most obvious.

1. Introduction

Hydrogen and oxygen stable isotopes (2H, 18O) are important components in water molecules [1,2], and deuterium excess (d-excess) is a second-order isotopic parameter connecting stable hydrogen and oxygen isotopes [3,4]. Both record the internal process information of the water cycle and are highly sensitive to environmental changes; moreover, they are used as important tracers and are widely used in the study of complex climate and hydrological processes on a regional or a global scale [5,6,7,8,9]. During precipitation, the evaporation of raindrops falling from the bottom of the cloud layer to the ground and passing through unsaturated air, a process called sub-cloud secondary evaporation, enriches the heavy isotopes (18O, 2H, etc.) in the precipitation and decreases deuterium excess, thereby changing the isotope composition of precipitation [10,11,12]. Therefore, the stable isotopes of hydrogen and oxygen (2H, 18O), as well as the deuterium excess, can provide a deeper understanding of the existence and influencing factors of the sub-cloud secondary evaporation effect. Moreover, they are of great significance for further study of the regional water cycle. Stewart [13] proposed the Stewart model for study the stable isotope changes during the evaporation of raindrops in different gas environments; it is mostly used to evaluate the changes in the isotope ratio of raindrops. The temperature and relative humidity during the fall of raindrops are the main factors. This model provides theoretical support for the subsequent sub-cloud secondary evaporation isotope fractionation. In recent years, various improved models based on Stewart have become increasingly prominent to enrich the quantitative research of the regional sub-cloud secondary evaporation, but there are certain differences in algorithms for different improved models. Froehlich et al. [10] found that when the remaining fraction of raindrop mass after evaporation (f) in the study area is large, the f and the deuterium excess variation (Δd) have a linear relationship of 1‰/1%. Based on this, Peng et al. [14] directly used the linear relationship to reverse the evaporation rate of raindrops according to the difference of precipitation isotopes at different sampling points. Subsequently, Salamalikis et al. [15] and Wang et al. [16] believed that this linear relationship does not apply to all regions, and there was a large error indirectly applying 1‰/1%. In terms of parameter input of the Stewart model, predecessors often use fixed values to represent initial values of raindrop diameter and raindrop falling height, which may cause certain errors [10,14]. Therefore, on this basis, Wang et al. [16] calculated the raindrop diameter and falling height, using conventional meteorological parameters, and then analyzed the sub-cloud secondary evaporation effect of precipitation isotopes in Xinjiang. Crawford et al. [17] input reanalysis data into the model for calculation when meteorological parameters are changing. The setting of atmospheric conditions is also the key process to the Stewart model. At present, the assumption of homogeneity [18,19] and stratification [17,20] are mainly used. Among them, the homogeneity hypothesis is more widely used.
The Yangtze River Basin has a vast area and complex terrain. Although the monsoon climate is very typical, the spatial and temporal distribution of annual precipitation and temperature in the basin is very uneven. The special geographical location and important domestic and international status of this basin make it a hot spot for various kinds of natural studies, and the research on isotopic hydrology is also flourishing in this region. Among them, the precipitation isotope research in the Yangtze River Basin is quite abundant [21,22,23,24]. Zhou et al. [22] studied the relationship between stable isotopes of precipitation and precipitation amount, water vapor pressure, temperature, and water vapor sources in the Yangtze River Basin based on the data of δ2H and δ18O in monthly mean precipitation provided by GNIP and NCEP/NCAR reanalysis data provided by Noaa-cires and discussed the main water vapor sources in the Yangtze River Basin. Dong et al. [23] used the data provided by GNIP to study the temporal and spatial distribution characteristics of precipitation δ18O and its related elements at Nanjing, Wuhan, Chengdu, and Kunming stations in the Yangtze River Basin. The study showed that the slope and intercept of the local meteoric water line in the basin are smaller than that of the global meteoric water line and concluded that there are different water vapor sources at the stations through HYSPLIT analysis. However, the research on the sub-cloud secondary evaporation effect in the Yangtze River Basin is relatively poor. Meng et al. [25] used the original isotope data of 443 GNIP precipitation samples in the Yangtze River Basin to calculate the corresponding atmospheric precipitation lines for rainfall and snowfall in the basin. The correlation between different levels of precipitation, temperature, vapor pressure, and the slope and intercept of atmospheric precipitation was discussed, and it is concluded that the secondary evaporation effect only causes a slight decrease in the slope and intercept of the regional atmospheric precipitation equation. However, we know little about the quantities of secondary evaporation in the Yangtze River Basin, the temporal and spatial differences of sub-cloud secondary evaporation in different regions of the basin, and the different influences of different factors on sub-cloud secondary evaporation. Thus, additional studies on sub-cloud secondary evaporation in this region are needed. Therefore, we used the improved Stewart model [16] to explore the sub-cloud secondary evaporation based on the hourly meteorological data of 648 meteorological stations in 17 provinces (cities) in the Yangtze River Basin, from March 2018 to February 2019. The objectives of this study are to provide an in-depth understanding of the temporal and spatial variation and causes of sub-cloud secondary evaporation of precipitation isotopes in the Yangtze River Basin, providing a scientific basis for the water cycle process studied by using precipitation isotopes.

2. Materials and Methods
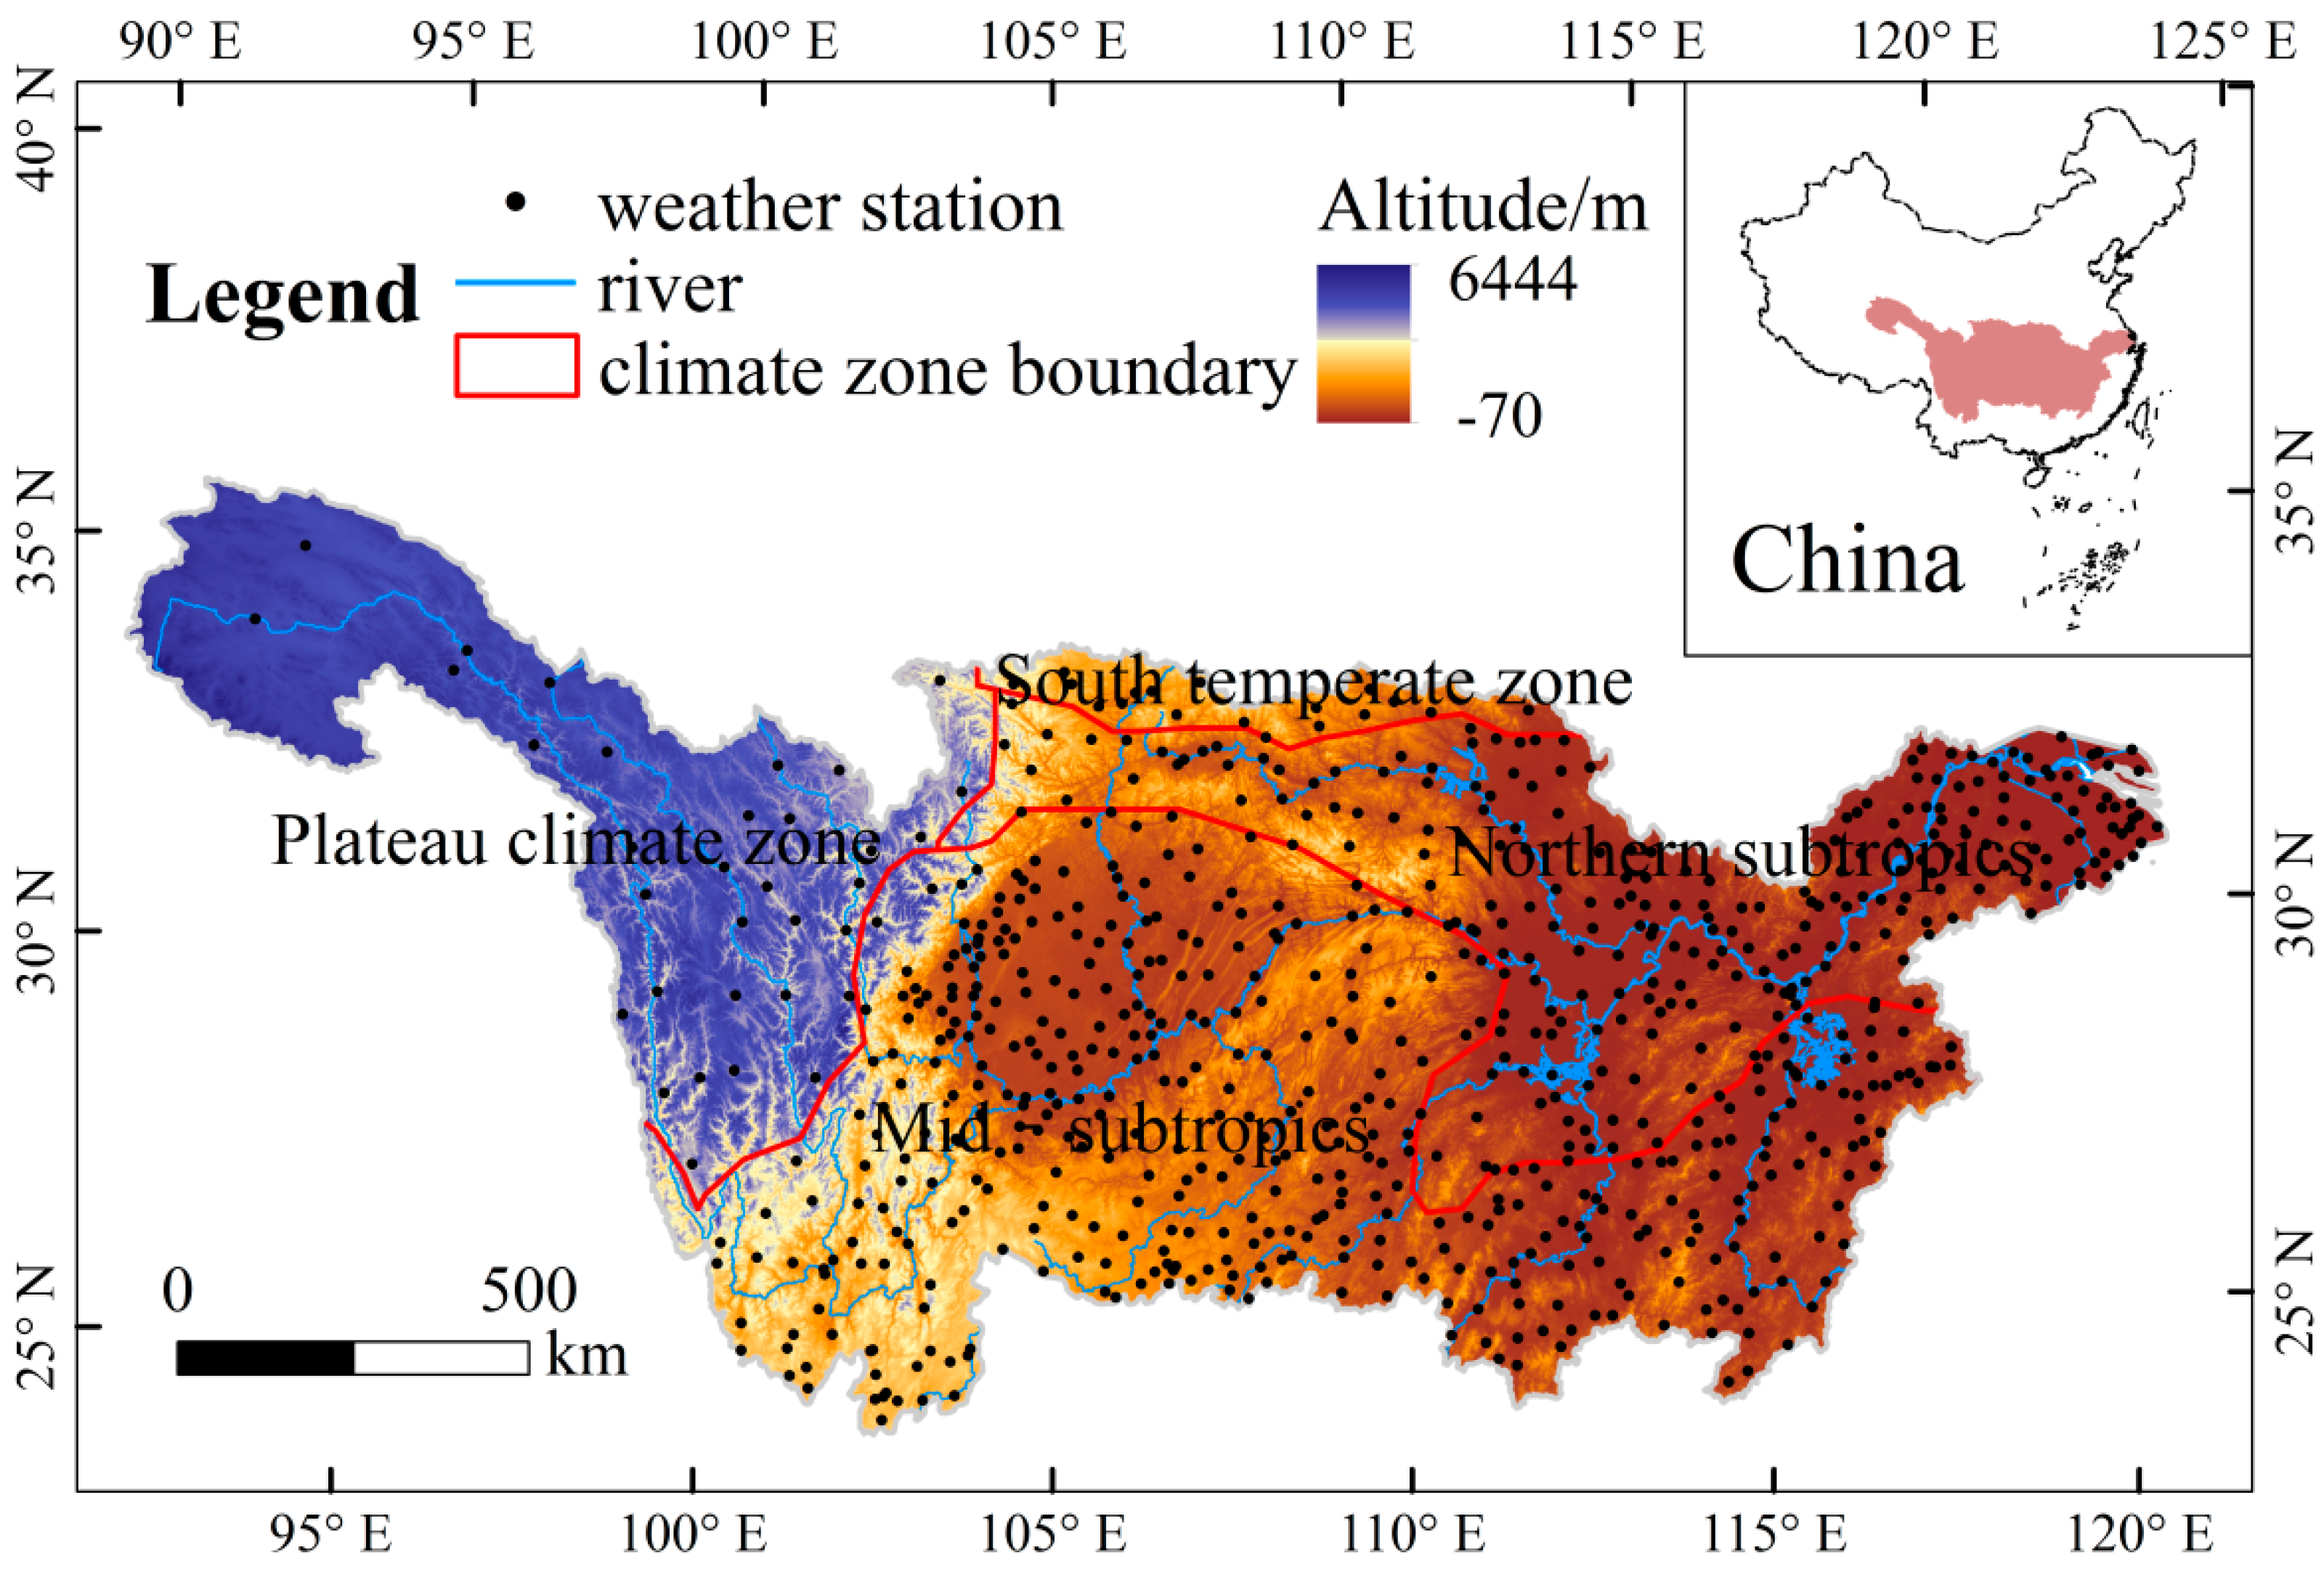
2.1. Study Area

The Yangtze River Basin (Figure 1) is situated between 90°33′~122°25′ E and 24°30′~35°45′ N, with a total length of 6300 km and a total area of 1.8 million km2. It straddles the three economic regions of Eastern, Central, and Western China and is the third-largest basin in the world, accounting for 18.8% of China’s land area. The river originates from Tanggula Mountain in Qinghai Province and finally flows into the East China Sea near Chongming Island in Shanghai. The Yangtze River Basin is a multi-level stepped terrain, which flows through mountains, plateaus, basins (tributaries), hills, and plains. The annual average temperature in the basin is 13.3 °C, and the space presents a trend of decreasing from east to west and from south to north; the annual average precipitation is 1067 mm. Due to the vast area, complex terrain, and typical monsoon climate of the basin, the spatial and temporal distribution of annual precipitation and rainstorm is very uneven [26]. Considering that the sub-cloud secondary evaporation is significantly affected by climate factors, the Yangtze River Basin was divided into four grade 1 climate zones, namely northern subtropics, mid-subtropics, south temperate zone, and plateau climate zone, according to China’s climate regionalization [27].

2.2. Data Sources

This study used the hourly meteorological data of 648 meteorological stations in 17 provinces (cities) from China Meteorological Data Network (http://data.cma.cn (accessed on October 2020)), from March 2018 to February 2019, including temperature, precipitation, relative humidity, and water vapor pressure.

2.3. Methods

In this study, the improved Stewart model was adopted: the conventional meteorological parameters were substituted into the calculation of the raindrop diameter and the raindrop falling height, which made the calculation results more accurate.
According to previous studies [10,13,16], assuming that the cloud bottom precipitation and the surrounding water vapor reach equilibrium fractionation state, the difference Δd between the excess deuterium (d-excess) in the cloud bottom raindrops and the excess deuterium (d-excess) in the surface raindrops can be used to express the sub-cloud secondary evaporation effect:
Δ d = ( 1 2 γ 2 α ) ( f 2 β 1 ) 8 ( 1 18 γ 18 α ) ( f 18 β 1 )
where 2α and 18α are the equilibrium fractionation coefficients of hydrogen and oxygen isotopes between water and gas respectively [28,29]; the calculation methods of parameters 2γ, 18γ, 2β, and 18β are detailed in Reference [13]; and f is the residual evaporation ratio of raindrops, that is, the percentage of the residual mass of raindrops after evaporation in the process of falling:
f = m e n d m e n d + m e v
where mend is the mass of raindrops on the ground (g), and mev is the mass of raindrops’ evaporation loss (g):
m e v = r e v t
where rev is the evaporation rate of raindrops, and t is the falling time of raindrops, where the formula of t is as follows:
t = H v e n d
where vend is the final falling speed of raindrops (ms−1), and H is the falling height of raindrops, namely the height at cloud base (km). Considering that it is difficult to measure the height of the cloud base, the Laplace pressure height formula was used in this study:
H = 18400 ( 1 + T m e a n 273 ) lg P P L C L
where Tmean is the average temperature (°C) between the condensation height and the landmark.
In this study, the arithmetic mean of the temperature of the ground and LCL was used. P and PLCL are pressure at surface and condensation altitude, respectively.
Although the shape of raindrops will change in the process of falling, they are generally assumed to be spheres in the physics simulation of cloud and precipitation. Therefore, the formula of mend is as follows:
m e n d = 4 3 π r e n d 3 ρ
where rend is the radius when the rain drops fall to the ground, and ρ (g/cm3) is the density of water.
In this study, by referring to the method of Wang et al. [16], the measured precipitation intensity was used to calculate the size of raindrops. Combined with the empirical formula of global rainfall raindrop diameter distribution proposed by BestAC [30], the relationship between raindrop diameter and precipitation intensity is derived:
D 50 = 0.69 n A I p
where D is the raindrop diameter, n is 2.25, A is 1.30, P is 0.232, and I is the precipitation intensity (mm·h−1).

3. Results

3.1. Temporal Variation of Precipitation Deuterium Excess (Δd)

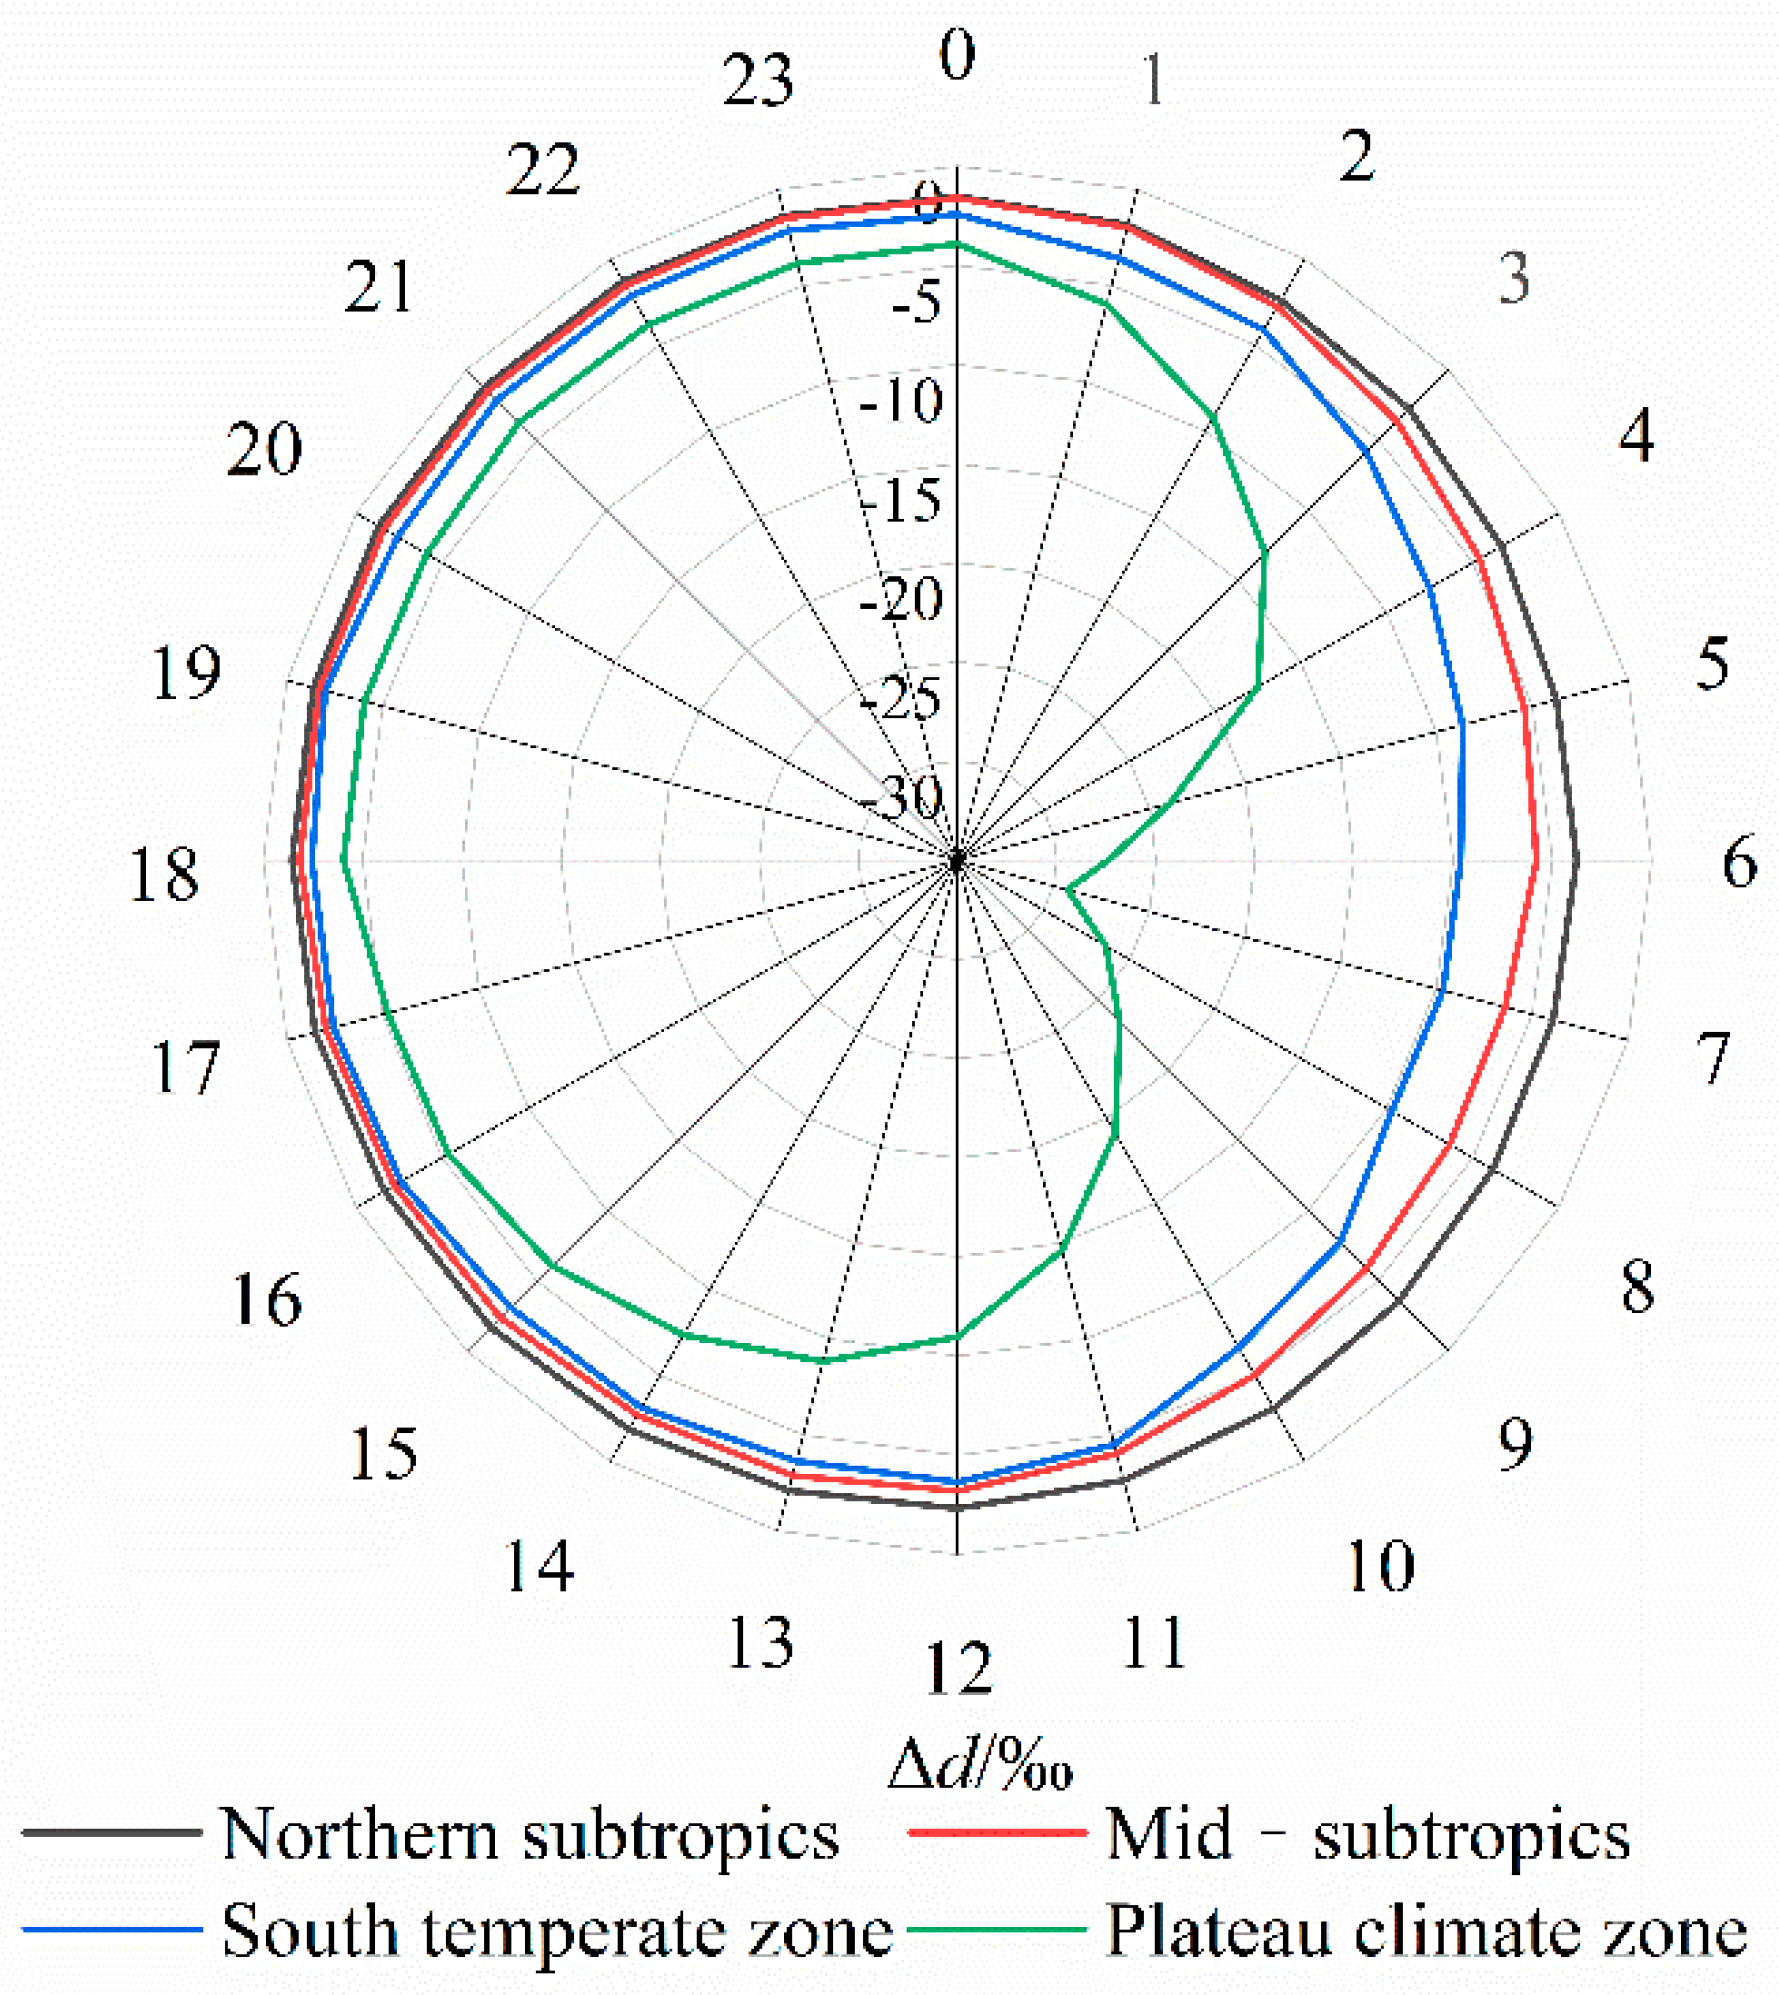
3.1.1. Δd Hourly Changes

The Δd value in the northern subtropics varies hourly from −2.56‰ to −2.12‰, with the lowest value of the day at 7:00 and the highest value at 21:00. In terms of the hourly Δd value, it showed an obvious upward trend from 7:00 to 21:00 and a significant downward trend from 21:00 to 7:00 the next day. If 6:00–18:00 in a day is divided into daytime and 18:00–6:00 in the next day is divided into the night, the average value of Δd during the day is −2.88‰, and at night, it is −2.12‰. The mid-subtropics Δd value varies hourly from −6.42‰ to −1.49‰; the lowest value appeared at 7:00, and the highest value appeared at 23:00. As far as the change of Δd value is concerned, there is a significant downward trend from 0:00 to 7:00 and an obvious upward trend from 7:00 to 23:00. The average value of Δd during the daytime is −3.90‰, and at night, it is −2.74‰. The south temperate zone Δd value was one by one-hour range for −9.71‰ to approximately −2.0‰, with the lowest at 8:00 of the day; the peak appeared on the 19:00. In terms of the Δd value trend, a significant reduction in the 0 to 8:00, 8:00–23:00 upward trend is obvious. The average value of Δd during the daytime is −5.30‰, and at night, it is −4.24‰. The Δd value of the Plateau climate zone varies hourly from −29.28‰ to −3.77‰. The lowest value of the day appears at 7:00, and the highest value appears at 21:00. As for the hourly change of Δd, there is a significant downward trend from 0:00 to 7:00 and an obvious upward trend from 7:00 to 23:00. The average value of Δd during the daytime is −14.48‰, and at night, it is −9.59‰ (Figure 2). Comparing the hourly changes of the Δd values in the four regions of the Yangtze River Basin, it can be seen that the variation range of Δd value is the largest in the plateau climate zone, which indicates that the fluctuation of sub-cloud secondary evaporation effect in this region more strongly than other regions. Except for the south temperate zone, the lowest values of Δd value appear at the same time in a day, and the highest values appear at different times, but they are close to each other, which indicates that, except for the south temperate zone, the maximum and minimum values of sub-cloud secondary evaporation in the Yangtze River basin appear at the same time. In terms of the changing trend of the Δd value within a day, the divisions are relatively consistent. Comparing the daytime and night of the day, we see that the average value of Δd during the day in each region is less than that at night, indicating that the sub-cloud secondary evaporation effect in the Yangtze River Basin is stronger during the daytime than at night.

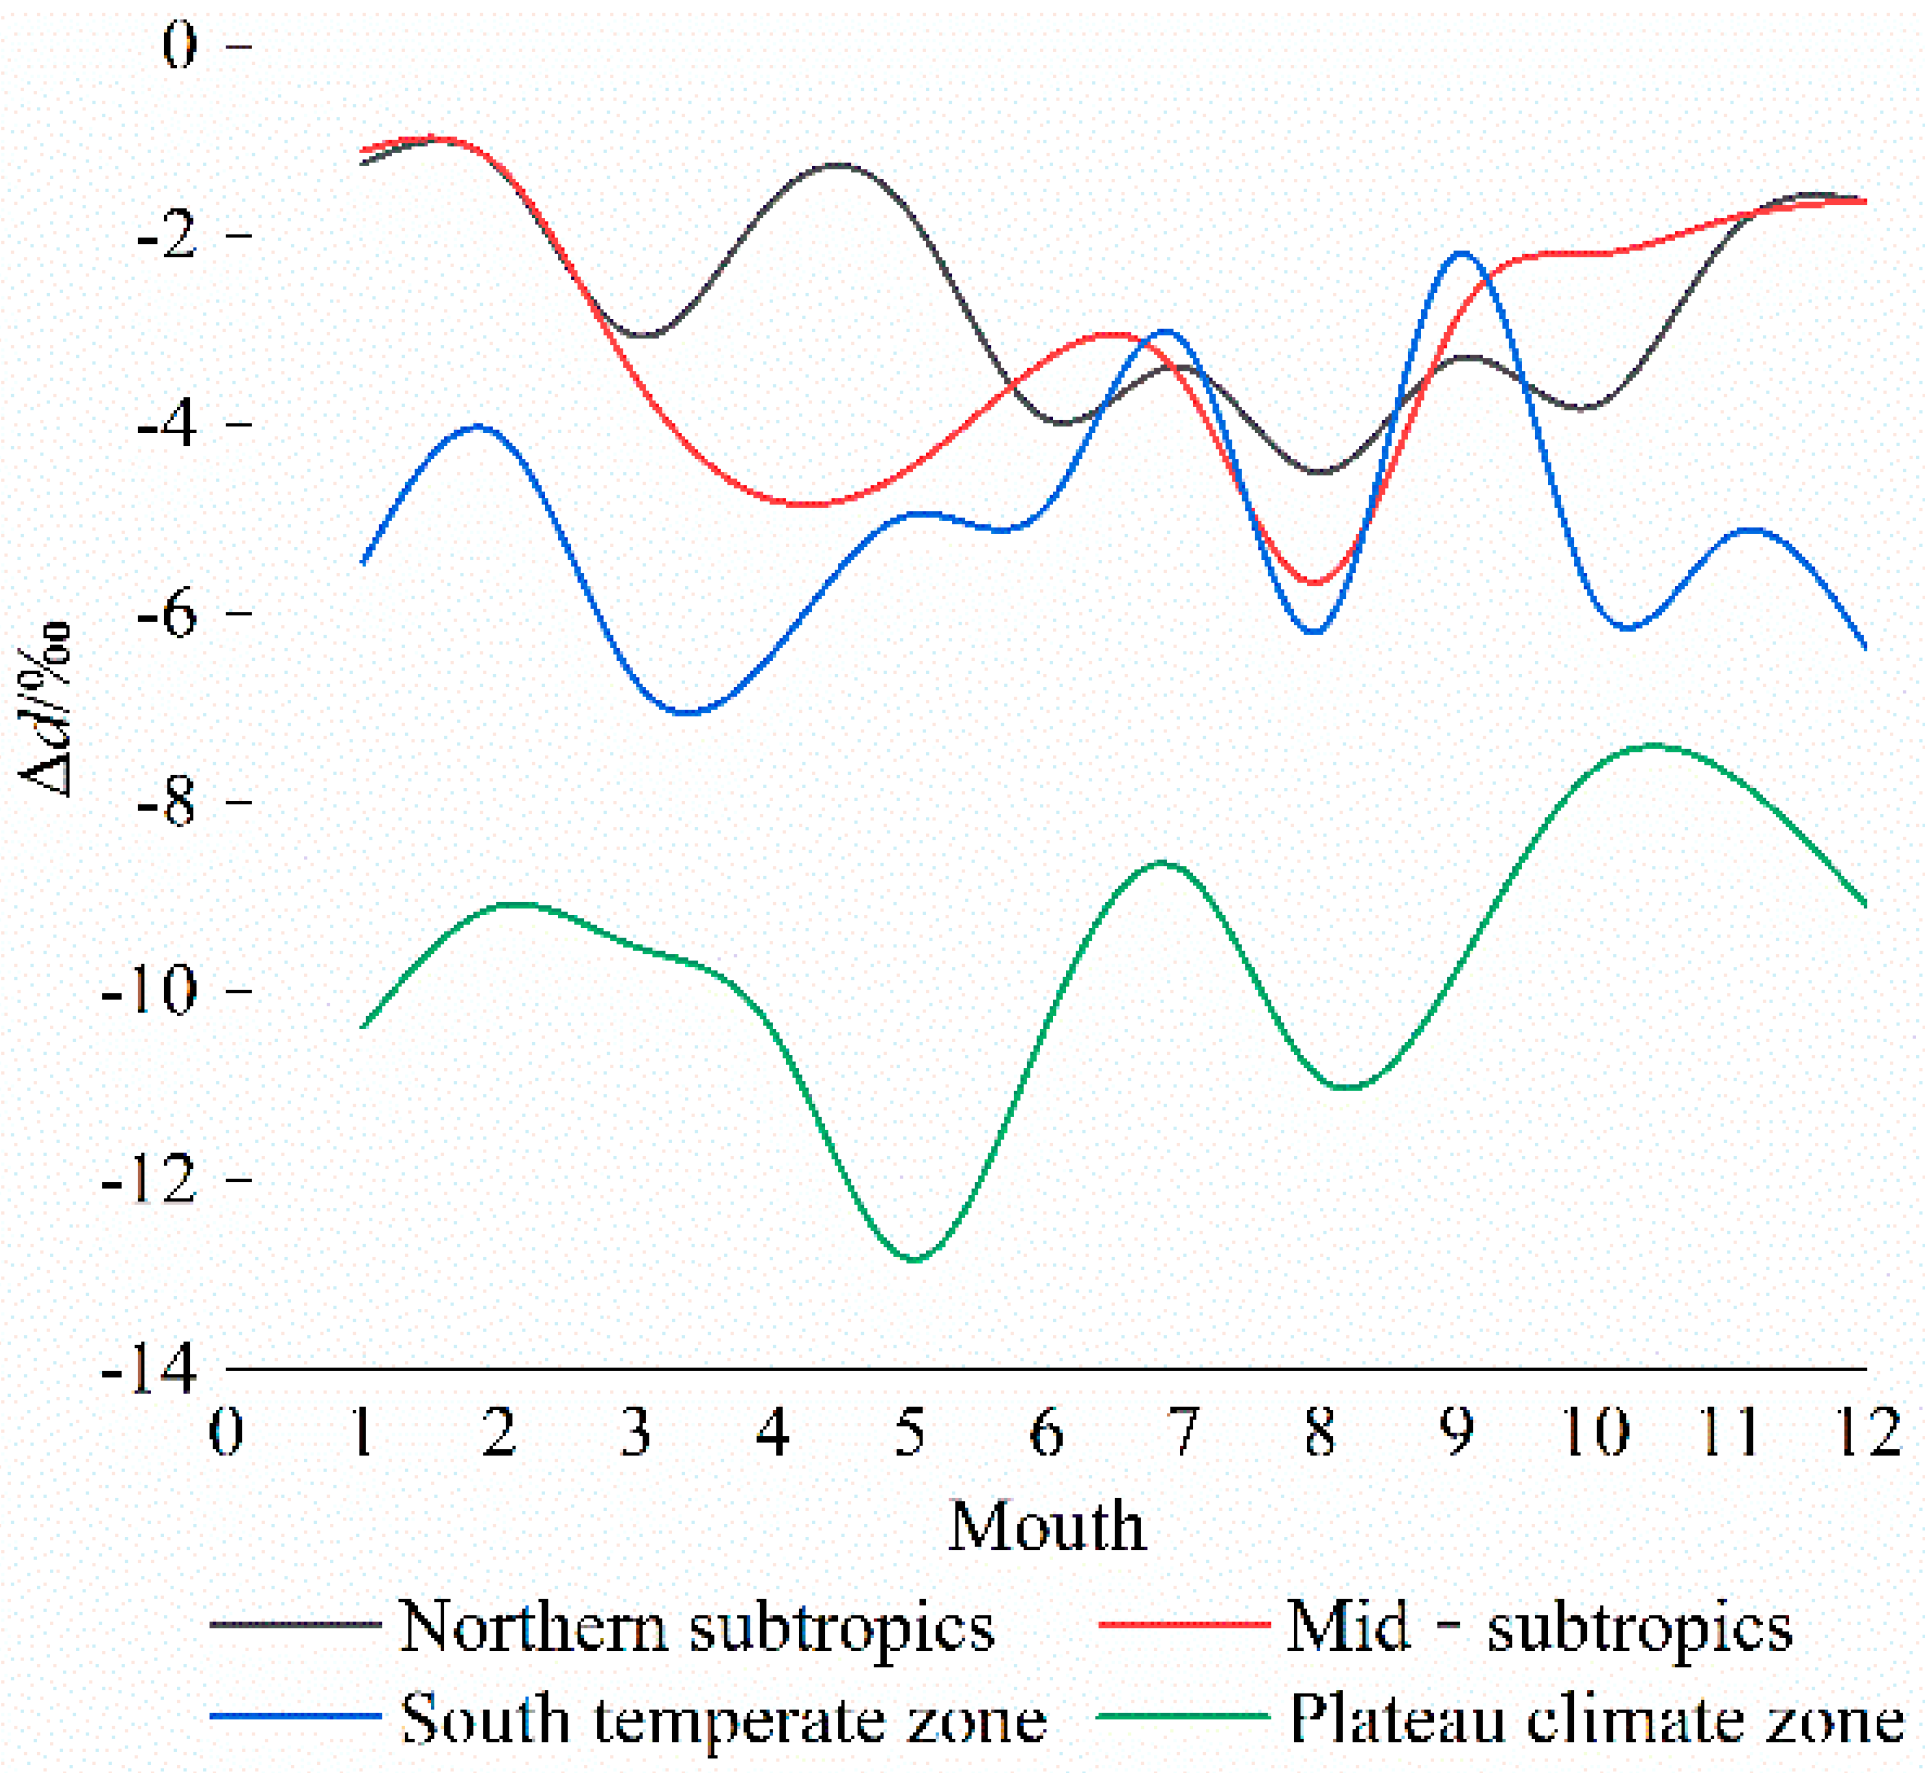
3.1.2. Δd Monthly Changes

The Δd value in the northern subtropics varies from −4.51‰ to −1.24‰ from month to month, with the minimum value in August and the maximum value in January. In terms of the monthly change trend of the Δd value, it shows a trend of decreasing in the fluctuation from February to August and increasing in the fluctuation from August to February of the following year. The seasons are divided into spring (March to May), summer (June to August), autumn (September to November), and winter (December to February of the following year). The average value of Δd in spring is −2.16‰, and in summer is −3.95‰, in autumn is −3.04‰, and in winter is −1.39‰. It can be seen that the average value of Δd in summer and autumn in this area is smaller than that in winter and spring. Mid-subtropics Δd values range from month to month was −5.67‰ to −1.10‰, minimum appeared in August, the maximum value appeared in January. In terms of Δd value changes from month to month, from February to August, the value significantly decreases, and there is an obvious increasing trend in August to February. The average value of Δd in spring is −4.26‰, summer is −4.18‰, autumn is −2.29‰, and winter is −1.34‰, which indicates that the average value of Δd in spring and summer is smaller than that in autumn and winter. The monthly variation range of Δd value in the south temperature zone is −6.73‰ to −2.19‰, the minimum appeared in March, the maximum appeared in September. As for the monthly variation of Δd value, it increased significantly from March to July and fluctuated greatly from July to March of the next year. The average value of Δd in spring is −6.03‰, in summer is −4.72‰, in autumn is −4.40‰, in winter is −5.31‰, the average value of Δd in summer and autumn is smaller than that in winter and spring. The Δd value of the Plateau climate zone varies from −12.83‰ to −7.65‰ from month to month, with the minimum value in May and the maximum value in October. The Δd value changes month by month, showing an increase in fluctuations from May to October. From October to May of the following year, the average value of Δd is −10.93‰ in spring, −9.99‰ in summer, −8.37‰ in autumn, and −9.52‰ in winter. Then the average value of Δd in spring and summer in this area is smaller than that in autumn and winter (Figure 3) (Table 1). In summary, it can be seen that the plateau climate region has the largest monthly variation of Δd in the four subregions of the Yangtze River Basin, which shows that the monthly change of the sub-cloud secondary evaporation effect is stronger than that of other regions. From the perspective of the monthly maximum Δd change, the maximum and minimum values of the northern subtropics and mid-subtropics are the same months. Although the months of the south temperate and plateau climate zone are different, they are relatively close. It is worth noting that the maximum value of the northern subtropics and mid-subtropics appeared in the winter half-year, and the minimum value appeared in the summer half-year. On the contrary, south temperate zone and plateau climate zone, the maximum value appears in the summer half-year, and the minimum value appears in the winter half-year. As far as the monthly change trend of Δd is concerned, the northern subtropics and mid-subtropics are consistent, that is, falling from February to August and rising from August to February of the following year, and the south temperate zone (significantly increased from March to July, fluctuated greatly from July to the following March) and plateau climate zone (increased in fluctuations from May to October and decreased in fluctuations from October to May of the following year) showed the opposite trend to these two regions. The seasonal variation of Δd values in the entire Yangtze River Basin presents the same trend in the northern subtropics and south temperate zones, and the same trend in the mid-subtropics and plateau climate zone, that is, the northern subtropics and southern temperate zone have more significant sub-cloud secondary evaporation effects in summer and autumn. Moreover, mid-subtropics and plateau climate zone sub-cloud secondary evaporation effect is more significant in spring and summer.

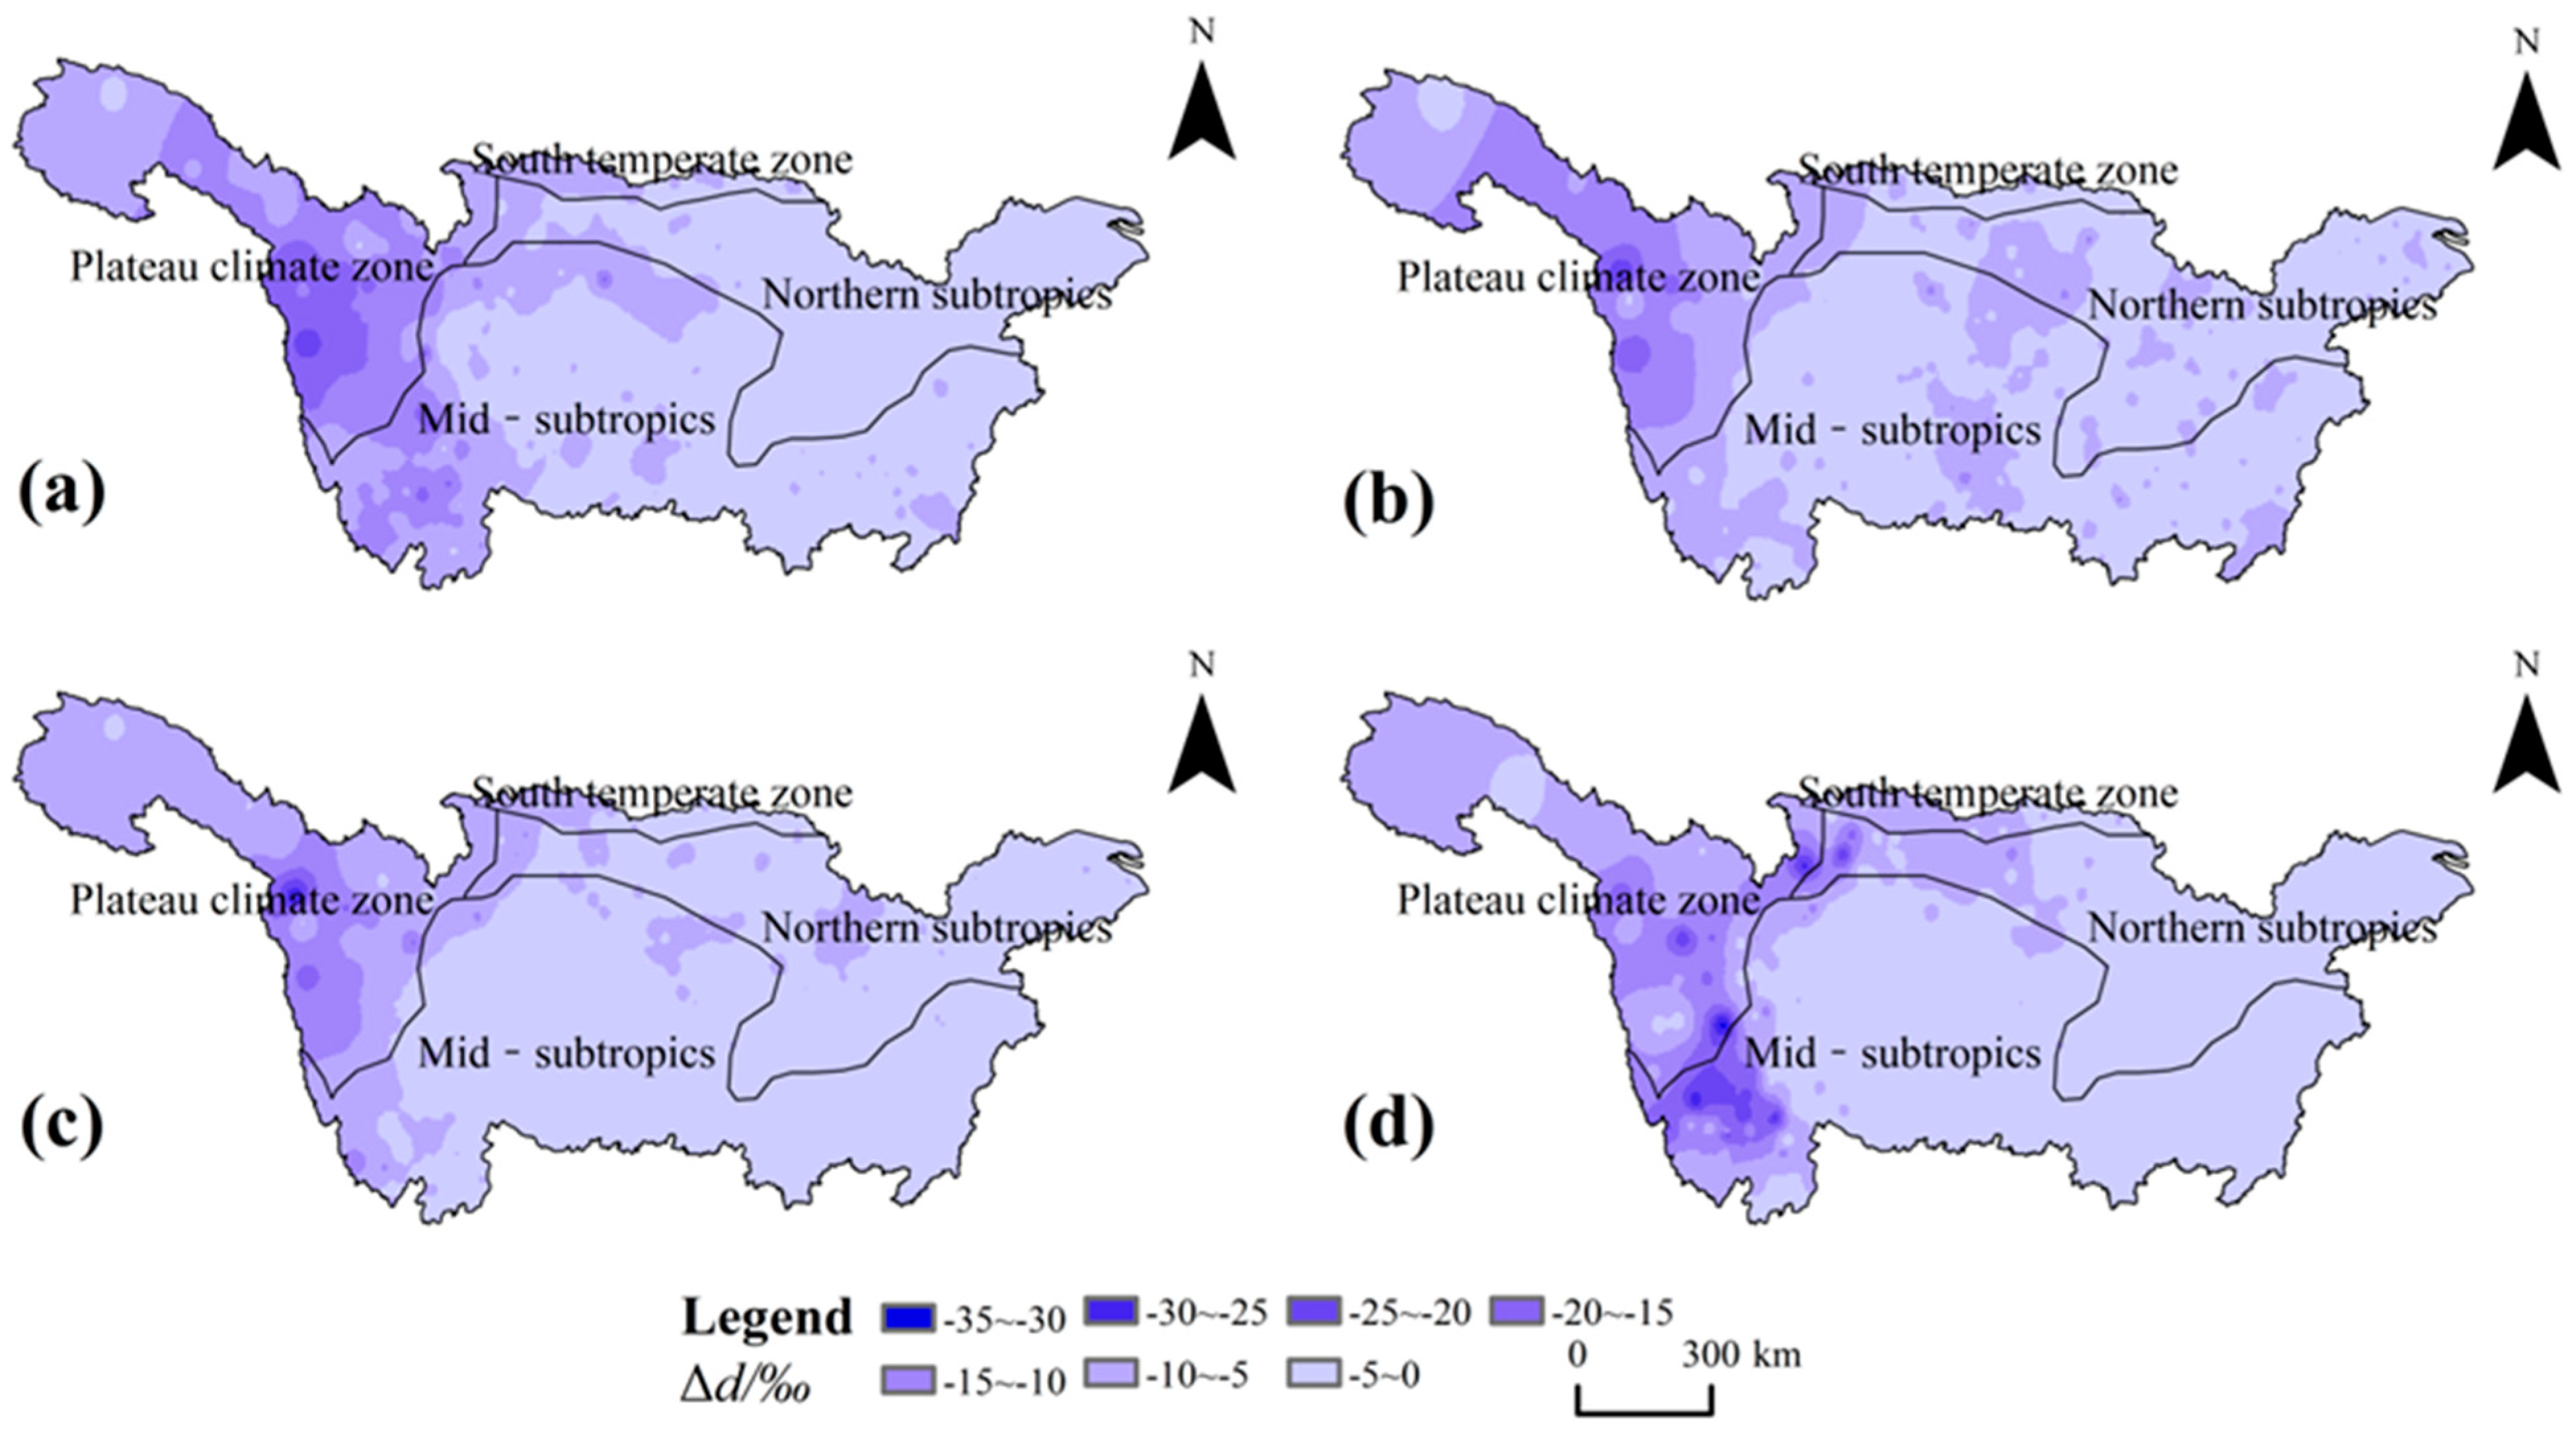
3.2. Spatial Variation of Precipitation Excess Deuterium Variation (Δd)

In spring, the Δd value in the whole plateau climate zone, southwest and upper northwest of the mid-subtropics, northwest of the northern subtropics, and northwest of the south temperate zone is relatively small, and the lowest value appears in the south and west of the plateau climate zone. Therefore, the sub-cloud secondary evaporation effect is more significant in the above regions (Figure 4a). In summer, the whole plateau climate zone and the southwest corner and central part of the mid-subtropics, the northwest corner and central part of the northern subtropics, and the northwest corner of the south temperate zone Δd value is low, which suggests that sub-cloud secondary evaporation above area than other areas (Figure 4b). In autumn, the value of Δd in the plateau climate zone is generally small, and the northern subtropics, mid-subtropics, and south temperate zone are larger as a whole. However, the values of Δd in the southwest and upper northwest of the mid-subtropics, northwest and upper central part of the northern subtropics, and the western part of the south temperate zone are massive low values. This indicates that the sub-cloud secondary evaporation is more obvious in these areas except for the plateau climate zone (Figure 4c). In winter, the values of Δd in the southern part of the plateau climate zone, the southwest part of the mid-subtropics, and the northwest part of the northern subtropics are smaller, which indicates that the sub-cloud secondary evaporation in these areas is more significant (Figure 4d). It is worth noting that the value of Δd in winter is higher than that in other seasons.

3.3. The Relationship between Precipitation Deuterium Excess Variation (Δd) and Influence Factors

To explore the relationship between different rainfall levels and the value of Δd, the precipitation samples were divided into four groups according to the levels: 0–5, 5–10, 10–50, and >50 mm. When the rainfall is 0–5 mm, the average value of Δd is −3.18‰, 5–10 mm is −0.61‰, 10–50 mm is −0.36‰, and >50 mm is −0.35‰ (Figure 5). In summary, when the rainfall is 0–5 mm, the average value of Δd is the smallest, and then the sub-cloud secondary evaporation intensity is the largest; with the increase of rainfall, the average value of Δd shows a regular decrease. This indicates that the strong sub-cloud secondary evaporation mainly occurs in small rainfall events in the Yangtze River Basin.
When the rainfall level is 0–5 mm, the sub-cloud secondary evaporation intensity is the highest, so the following uses 0–5 mm rainfall samples to focus on the correlation between different elements and Δd. This study divided the temperature into five groups to explore the difference of the sub-cloud secondary evaporation effect at different temperatures. It can be seen from Table 2 that, when the temperature is 0–10 °C, the effect of sub-cloud secondary evaporation is not obvious, and when the temperature is >30 °C, the value of Δd decreases rapidly to the minimum, compared with that when the temperature is 20–30 °C; moreover, the effect of the sub-cloud secondary evaporation is the most significant, which indicates that the higher the temperature is, the more significant the sub-cloud secondary evaporation is.
The vapor pressure is divided into five groups. It can be seen from Table 2 that, when the vapor pressure is less than 3 hPa, the sub-cloud secondary evaporation effect is the most significant. When the vapor pressure is 6–9 hPa, the sub-cloud secondary evaporation effect is the least obvious. From previous studies [31,32], the vapor pressure is inversely proportional to the sub-cloud secondary evaporation effect: the Δd value continues to increase with the vapor pressure increases, and the sub-cloud secondary evaporation effect continues to decrease. The correlation between vapor pressure and Δd in Table 1 roughly follows this rule, but there are still discrepancies. This may be because the article uses hourly data, and the larger sample size makes the results more detailed.
The relative humidity is divided into six groups. It can be seen from Table 2 that, when the relative humidity is 50–60%, the sub-cloud secondary evaporation effect is the most significant; when the relative humidity is >90%, the sub-cloud secondary evaporation effect is the least obvious.
The raindrop diameter is divided into three groups. It can be seen from Table 2 that, when the raindrop diameter is 0.5–1 mm, the sub-cloud secondary evaporation effect is the most significant, and when the raindrop diameter is >1.5 mm, the sub-cloud secondary evaporation effect is the least obvious. We can conclude that, with the increase of raindrop diameter, the value of Δd is increasing, and there is an obvious positive correlation between them.

4. Discussion

According to previous studies, the sub-cloud secondary evaporation is more significant in arid and semi-arid areas, while it is relatively weak in humid and semi-humid areas, so the in-depth research on it is less. However, further studies on the sub-cloud secondary evaporation effect of precipitation isotope in these areas can provide a scientific basis for the study of the regional water-cycle process by using stable isotopes of precipitation. Moreover, the comparative study of sub-cloud secondary evaporation in arid and semi-arid regions and humid and semi-humid regions is also very important. The comparative study of the existence, spatial-temporal differences, and influencing factors of sub-cloud secondary evaporation in different climate regions will provide better theoretical support for the study of precipitation isotopes. In future research, it is possible to strengthen the comparative study of sub-cloud secondary evaporation in typical topographic areas or watersheds in different large climate regions, so that the study of sub-cloud secondary evaporation of precipitation isotope can be further developed. Previous studies [25] on the sub-cloud secondary evaporation effect in humid and semi-humid areas mostly used the change of the slope and intercept of meteoric water line to determine whether there is sub-cloud secondary evaporation, but they lacked in-depth quantitative analysis and demonstration. Therefore, the Stewart model was used in this study to quantitatively analyze the temporal and spatial distribution differences of sub-cloud secondary evaporation in this area, which provides certain theoretical support for the study of sub-cloud secondary evaporation in humid and semi-humid areas. Moreover, different from the previous rough monthly and annual data, this study was based on hourly data, making the results more accurate [33,34]. When Meng et al. [25] studied the sub-cloud secondary evaporation in the Yangtze River Basin, they thought that when the rainfall was small (1–10 mm), the slope and intercept of the atmospheric precipitation line decreased slightly, and the sub-cloud secondary evaporation was obvious, while the snow and heavy rainfall events had little effect. In this study, the precipitation was also divided into different magnitudes, and a more consistent conclusion was drawn: in the 0–5 mm precipitation event, the sub-cloud secondary evaporation effect is the most significant. Moreover, this study quantified the changes of sub-cloud secondary evaporation in different orders by Δd value, which makes the results more convincing.
The plateau climate zone has the largest fluctuation from the view of the hourly variation range of Δd value in the Yangtze River Basin, which indicates that the fluctuation of sub-cloud secondary evaporation effect in this region is stronger than that in other regions, and the diurnal temperature difference in this region is significant, which may be the main reason for this phenomenon. The average value of Δd during the day in the Yangtze River Basin is smaller than that at night: the sub-cloud secondary evaporation effect is stronger during the day than at night. The correlation between temperature and Δd shows that, the lower the temperature, the greater the Δd value; the higher the temperature, the greater the Δd value. The temperature is different at each time of the day, and the temperature during the day is generally higher than that at night. Therefore, the sub-cloud secondary evaporation in this area is more obvious during the day than at night, which is mainly related to temperature. In terms of the maximum monthly variation of Δd value in the Yangtze River Basin, the maximum value appears in the winter half-year and the minimum value appears in the summer half-year in the northern and middle subtropics, which has a great relationship with the climate characteristics of subtropics zone which is warm in winter and hot in summer. In the south temperate zone and the plateau climate zone, the opposite is the case: the maximum occurs in the summer half of the year, and the minimum occurs in the winter half of the year. Considering that precipitation has a more significant impact on the sub-cloud secondary evaporation effect than temperature.
Previous studies have found that the main influencing factors of sub-cloud secondary evaporation are temperature, precipitation, relative humidity, and raindrop diameter [30,35], in which temperature is positively proportional to sub-cloud secondary evaporation, while other factors are inversely proportional to sub-cloud secondary evaporation. According to the previous article, when the rainfall level is 0–5 mm, the sub-cloud secondary evaporation intensity is the largest. Therefore, exploring the correlation between different elements and Δd for 0–5 mm rainfall samples will make the results more representative. Based on this, the temperature, vapor pressure, relative humidity, and raindrop diameter are divided into different magnitudes to compare and analyze the Δd value. Compared with the simple linear correlation analysis in the past, it is more intuitive to see the influence difference of each influencing factor on the sub-cloud secondary evaporation. Furthermore, the amount of data in this study is large, the time resolution is high, and the Δd value can be described more finely, which can better explain the reason for the sudden drop of the Δd value at a certain magnitude.
The setting of atmospheric conditions is also the key process to the Stewart model. At present, the assumption of homogeneity [18,19] and stratification [17,20] are mainly used. Among them, the homogeneity hypothesis is more widely used. It means that the air in the raindrop descent process is treated as homogeneity, and the ground meteorological parameters are used as input parameters to study the sub-cloud secondary evaporation effect. Stratification hypothesis means that the air is stratified by several isobaric surfaces during the process of raindrop falling, and the ground and upper air meteorological parameters are brought into the model for calculation at the same time. However, because there are few upper air meteorological stations, the method cannot correspond to the ground meteorological stations one by one; given this, we can use the high-altitude meteorological stations near the study area to match with the surface meteorological stations in the study area by spatial interpolation, but this will increase the uncertainty of the results. Therefore, under the consideration of many factors, this paper chooses the relatively mature homogenization hypothesis, which indicates that future research can focus on the optimization of the homogenization hypothesis and stratification hypothesis of the Stewart model, and strengthen the real-time monitoring of water vapor isotopes on the ground and at high altitude, to further develop the model.

5. Conclusions

Based on hourly meteorological data from 648 meteorological stations in 17 provinces (cities) in the Yangtze River Basin, from March 2018 to February 2019, the improved Stewart model was used to investigate the differences of sub-cloud secondary evaporation effects in different climatic regions of the Yangtze River Basin. The results are as follows:
(1)
As far as the hourly variation is concerned, the Δd value of the whole Yangtze River Basin is smaller in the daytime than at night. As far as the monthly variation is concerned, the northern subtropics and the south temperate zone are more consistent: the Δd value is smaller in summer and autumn. The mid-subtropics and plateau climate zones have lower Δd values in spring and summer.
(2)
The spatial variation of Δd value in different seasons of the Yangtze River Basin is significant. The annual Δd value in the plateau climate zone is smaller than that in other areas, while the winter Δd value in the plateau climate zone is larger than that in other seasons.
(3)
The influence factors of different magnitudes have obvious differences in the sub-cloud secondary evaporation. When the rainfall is 0–5 mm, the average value of Δd is the smallest, and with the increase of rainfall, the average value of Δd decreases regularly. When the temperature is greater than 30 °C, the value of Δd decreases rapidly to the minimum, compared to when the temperature is 20–30 °C. The higher the temperature, the more significant the sub-cloud secondary evaporation. When the vapor pressure is less than 3 hPa, the Δd value is the smallest. As the vapor pressure increases, the Δd value continues to increase; when the relative humidity is 50–60%, the Δd value is the smallest. When the raindrop diameter is 0.5–1 mm, the value of Δd is the smallest. With the increase of raindrop diameter, the value of Δd is increasing, and there is an obvious positive correlation between them.

Supplementary Materials

The following are available online at https://www.mdpi.com/article/10.3390/atmos12050575/s1.

Author Contributions

Conceptualization, M.Z. and H.X.; Software, Z.H.; Formal Analysis, H.X.; Writing—Original Draft Preparation, H.X.; Writing—Review & Editing, Y.Z.; X.Y.; J.W.; T.H.; P.S.; Project Administration, M.Z.; Funding Acquisition, M.Z. All authors have read and agreed to the published version of the manuscript.

Funding

This research was funded by the Scientific Research Program of Higher Education Institutions of Gansu Province No. 2018C-02.

Institutional Review Board Statement

Not applicable.

Informed Consent Statement

Not applicable.

Data Availability Statement

The data presented in this study are available in supplementary material here.

Acknowledgments

Thank you very much for the support from the Scientific Research Program of Higher Education Institutions of Gansu Province No. 2018C-02 for this article; thank you editors and reviewers for your valuable comments on this article.

Conflicts of Interest

The authors declare no conflict of interest. The funders had no role in the design of the study; in the collection, analyses, or interpretation of data; in the writing of the manuscript; or in the decision to publish the results.

References

  1. Brunel, J.P.; Walker, G.R.; Dighton, J.C. Use of stable isotopes of water to determine the origin of water used by the vegetation and to partition evapotranspiration. A case study from HAPEX-Sahel. J. Hydrol. 1997, 188, 466–481. [Google Scholar] [CrossRef]
  2. Wu, X.; Zhu, X.; Pan, M. Seasonal variability of oxygen and hydrogen stable isotopes in precipitation and cave drip water at Guilin, southwest China. Environ. Earth Sci. 2014, 72, 3183–3191. [Google Scholar] [CrossRef]
  3. Masson-Delmotte, V.; Jouzel, J.; Landais, A. GRIP deuterium excess reveals rapid and orbital-scale changes in Greenland moisture origin. Science 2005, 309, 118–121. [Google Scholar] [CrossRef] [Green Version]
  4. Aemisegger, F.; Pfahl, S.; Sodemann, H. Deuterium excess as a proxy for continental moisture recycling and plant transpiration. Atmos. Chem. Phys. 2014, 14, 4029–4054. [Google Scholar] [CrossRef] [Green Version]
  5. Merz, N.; Gfeller, G.; Born, A. Influence of ice sheet topography on Greenland precipitation during the Eemian interglacial. J. Geophys. Res. Atmos. 2014, 119, 10749–10768. [Google Scholar] [CrossRef] [Green Version]
  6. Dudgeon, D.; Arthington, A.H.; Gessner, M.O. Freshwater biodiversity: Importance, threats, status and conservation challenges. Biol. Rev. 2006, 81, 163–182. [Google Scholar] [CrossRef]
  7. Dansgaard, W. The abundance of 18O in atmospheric water and water vapor. Tellus 1953, 5, 461–469. [Google Scholar] [CrossRef]
  8. Dansgaard, W. Stable isotopes in precipitation. Tellus 1964, 16, 436–468. [Google Scholar] [CrossRef]
  9. Craig, H. Isotopic variations in meteoric waters. Science 1961, 133, 1702–1703. [Google Scholar] [CrossRef]
  10. Froehlich, K.; Kralik, M.; Papesch, W. Deuterium excess in precipitation of Alpine regions: Moisture recycling. Isot. Environ. Health Stud. 2008, 44, 61–70. [Google Scholar] [CrossRef] [PubMed]
  11. Kress, A.; Saurer, M.; Siegwolf, R.T.W. A 350 year drought reconstruction from Alpine tree ring stable isotpes. Glob. Biogeochem. Cycles 2010, 24, GB2011. [Google Scholar] [CrossRef] [Green Version]
  12. Steen-Larsen, H.C.; Masson-Delmotte, V.; Sjolte, J. Understanding the climatic signal in the water stable isotope records from the NEEM shallow firn/ice cores in northwest Greenland. J. Geophys. Res. 2011, 116, D06108. [Google Scholar] [CrossRef]
  13. Stewart, M.K. Stable isotope fractionation due to evaporation and isotopic exchange of falling waterdrops: Applications to atmospheric processes and evaporation of lakes. J. Geophys. Res. 1975, 80, 1133–1147. [Google Scholar] [CrossRef]
  14. Peng, T.; Wang, C.H.; Huang, C. Stable isotopic characteristic of Taiwan’s precipitation: A case study of western Pacific monsoon region. Earth Planet. Sci. Lett. 2010, 289, 357–366. [Google Scholar] [CrossRef]
  15. Salamalikis, V.; Argiriou, A.A.; Dotsikae, E. Isotopic modeling of the sub-cloud evaporation effect in precipitation. Sci. Total Environ. 2016, 544, 1059–1072. [Google Scholar] [CrossRef] [PubMed]
  16. Wang, S.J.; Zhang, M.J.; Che, Y. Influence of below-cloud evaporation on deuterium excess in precipitation of arid central Asia and its meteorological controls. J. Hydrometeorol. 2016, 17, 1973–1984. [Google Scholar] [CrossRef]
  17. Crawford, J.; Hollins, S.E.; Meredith, K.T. Precipitation stable isotope variability and sub-cloud evaporation processes in a semiarid region. Hydrol. Process. 2017, 31, 20–34. [Google Scholar] [CrossRef]
  18. Ma, Q.; Zhang, M.J.; Wang, S.J. An investigation of moisture sources and secondary evaporation in Lanzhou, Northwest China. Environ. Earth Sci. 2014, 71, 3375–3385. [Google Scholar] [CrossRef]
  19. Kong, Y.L.; Pang, Z.H.; Froehlich, K. Quantifying recycled moisture fraction in precipitation of an arid region using deuterium excess. Tellus B Chem. Phys. Meteorol. 2013, 65. [Google Scholar] [CrossRef]
  20. Zhou, S.E.; Zhang, M.J.; Wang, S.J. Sub-cloud secondary evaporation in summer precipitation isotope in Gansu, China. Mt. Res. 2019, 37, 808–817. [Google Scholar]
  21. Sun, T.T. Study on the Variable Characteristic of the Water Stable Isotopic Compositions in Yangtze River Basin; Hohai University: Nanjing, China, 2007. [Google Scholar]
  22. Wu, H.W.; Zhang, X.P.; Sun, G.L. Variations of Δ18O in precipitation and moisture sources in the Yangtze River Basin. J. Meteorol. Environ. 2011, 27, 7–12. [Google Scholar]
  23. Dong, X.F.; Deng, H.Y.; Zheng, X.M. Analysis of stable isotope characteristics and water vapor origins in atmospheric precipitation in the Yangtze River Basin. Environ. Sci. Technol. 2017, 40, 78–84. [Google Scholar]
  24. Zhou, Y.; Wu, H.W.; He, B. Temporal and spatial variation characteristics of Δ18O and Δd in Yangtze River water and their influencing factors. Resour. Environ. Yangtze Basin 2017, 26, 678–686. [Google Scholar]
  25. Meng, Y.C.; Liu, G.D. Effect of below-cloud secondary evaporation on the stable isotopes in precipitation over the Yangtze River basin. Adv. Water Sci. 2010, 21, 327–334. [Google Scholar]
  26. Guo, J.; Chen, H.; Xu, C.Y. Prediction of variability of precipitation in the Yangtze river basin under the climate change conditions based on Automated statistical downscaling. Stoch. Environ. Res. Risk Assess. 2012, 26, 157–176. [Google Scholar] [CrossRef]
  27. Zhu, B.H. Chinese Climate; Science Press: Beijing, China, 1962. [Google Scholar]
  28. Friedman, I.; O’Neil, J. Data of Geochemistry: Compilation of Stable Fractionation Factors of Geochemical Interest; US Government Printing Office: Washington, DC, USA, 1977.
  29. Craig, R. Principles of Stable Isotope Distribution; Oxford University: New York, NY, USA, 1999. [Google Scholar]
  30. Best, A.C. The size distribution of raindrops. Q. J. R. Meteorol. Soc. 1950, 76, 16–36. [Google Scholar] [CrossRef]
  31. Chen, F.L.; Zhang, M.J.; Wang, S.J. Relationship between sub-cloud secondary evaporation and stable isotope in precipitation of Lanzhou and surrounding area. Quat. Int. 2015, 380–381, 68–74. [Google Scholar] [CrossRef]
  32. Jin, X.G.; Zhang, M.J.; Wang, S.J. Effect of below-cloud secondary evaporation in precipitation over the Loess Plateau based on the stable isotopes of hydrogen and oxygen. Environ. Sci. 2015, 36, 1241–1248. [Google Scholar]
  33. Zhou, S.E.; Zhang, M.J.; Wang, S.J. A comparison of sub-cloud secondary evaporation effect of precipitation isotope in Xinjiang based on the Stewart model improvement scheme. J. Glaciol. Geocryol. 2019, 41, 304–315. [Google Scholar]
  34. Xiao, H.Y.; Zhang, M.J.; Wang, S.J. Sub-cloud secondary evaporation effect of precipitation isotope in Shaanxi-Gansu-Ningxia region, China. Chin. J. Appl. Ecol. 2020, 31, 3814–3822. [Google Scholar] [CrossRef]
  35. Wu, H.W.; Zhang, X.P.; Li, X.Y. Seasonal variations of deuterium and oxygen-18 isotopes and their response to moisture source for precipitation events in the subtropical monsoon region. Hydrol. Process. 2015, 29, 90–102. [Google Scholar] [CrossRef]
Figure 1. Spatial distribution of weather stations in the Yangtze River Basin.
Atmosphere 12 00575 g001
Figure 2. Hourly variation of Δd in the Yangtze River Basin. Each climate zone is marked with different colors: northern subtropics (gray), mid-subtropics (red), south temperate zone (blue), and plateau climate zone (green).
Atmosphere 12 00575 g002
Figure 3. Monthly variation of Δd in the Yangtze River Basin. Each climate zone is marked with different colors: northern subtropics (gray), mid-subtropics (red), south temperate zone (blue), and plateau climate zone (green).
Atmosphere 12 00575 g003
Figure 4. Spatial variation of Δd value in different seasons in the Yangtze River basin: (a) spring, (b) summer, (c) autumn, and (d) winter.
Atmosphere 12 00575 g004
Figure 5. Δd value of different rain levels.
Atmosphere 12 00575 g005
Table 1. The average value of Δd in different regions of the Yangtze River basin in different seasons.
SubregionSpringSummerAutumnWinter
Northern subtropics−2.16‰−3.95‰−3.04‰−1.39‰
Mid-subtropics−4.26‰−4.18‰−2.29‰−1.34‰
South temperature zone−6.03‰−4.72‰−4.40‰−5.31‰
Plateau climate zone−10.93‰−9.99‰−8.37‰−9.52‰
Table 2. Relationship between meteorological elements and Δd in the Yangtze River Basin.
Influence FactorRange of VariationΔd/‰
Temperature/°C<0−2.50
0–5−1.36
5–10−2.29
10–20−3.10
20–30−4.35
>30−24.18
Vapor pressure/hPa<3−12.21
3–6−4.93
6–9−2.43
9–12−3.20
>12−3.30
Relative humidity/%<50−20.78
50–60−26.57
60–70−25.67
70–80−18.73
80–90−8.36
>90−0.94
Raindrop diameter/mm0.5–1−4.39
1–1.5−1.36
>1.5−0.71
Publisher’s Note: MDPI stays neutral with regard to jurisdictional claims in published maps and institutional affiliations.

