Abstract
It is estimated that the excessive emission of airborne particulate matter shortens the life expectancy of a European city inhabitant by up to eight months. The conducted comparison shows the emission and concentration of PM10 in Poznan against the supra-regional background. The purpose of the comparison with similar area and population cities is to identify the position of the Poznan agglomeration in terms of particulate matter emissions. The main sources are: original research, PM official measuring stations’ data, and the relevant organizations’ reports. On the basis of the conducted comparison, it can be concluded that Wroclaw and Poznan achieve very similar results in terms of emissions. Cracow, on the other hand, as a city where for several years there have been significant problems with the phenomenon of smog and excessive emission of particulate matter, reaches extremely different values compared to Poznan. The article presents also the air quality in Poznan and other Polish and European cities. There were also measurements of PM mass and number conducted in Poznan. The results show that there is a significant difference between the air quality measured at official measuring stations (only some of them are measuring PMs at all) and that measured with portable equipment in different parts of the city.
1. Introduction
Economic development and the associated climate change are constantly contributing to significant deterioration of air quality. Due to the complexity of this problem it is now considered on a global scale. According to data [1], about 90% of the inhabitants of European cities are exposed to pollutants at concentrations higher than the air quality levels that are considered harmful to health. It is estimated that the excessive emission of dust suspended in the air (e.g., Particulate Matter, PM10) shortens the life expectancy of a European city inhabitant by more than eight months. Deteriorating air quality negatively affects the health of the entire population, however some groups are particularly vulnerable. These include not only children, pregnant women, and elder people, but also inhabitants of industrial cities and people living near the communication routes [2,3].
Particulate matter (PM) is a term generally used to describe a type of air pollutant consisting of a complex of various mixtures of suspended particles that differ in composition, place of formation and size. For example, suspended dusts 2.5 are atmospheric aerosols, the diameter of which does not exceed 2.5 µm. According to the World Health Organization (WHO), dust of this diameter is the most dangerous to human health among atmospheric pollutants. WHO reports that long-term exposure to PM2.5 dust results in a shorter life expectancy. These dusts are so small that they freely penetrate the lungs and even the blood vessels of human beings. Short-term exposure to PM10 or PM2.5 results in an increased number of cardiovascular and respiratory diseases, such as: exacerbation of asthma, acute respiratory reactions, and decreased lung function. Poznan is undoubtedly one of the cities where the problem of air pollution occurs, as in the whole of Poland, it is mainly associated with household heating, industry, road transport, energy and agriculture (Figure 1). The household energy has the largest share in air pollution sources in European cities, the second (17%) compares with industry and the rest are energy supply, agriculture, and others. The European Union (EU) has been working on improving air quality in Europe for many years. Its activities mainly focus on monitoring the emission of harmful substances into the atmosphere, improving quality used fuels and implementation of environmental protection requirements to the transport and industry sectors and energy [4,5,6,7,8].
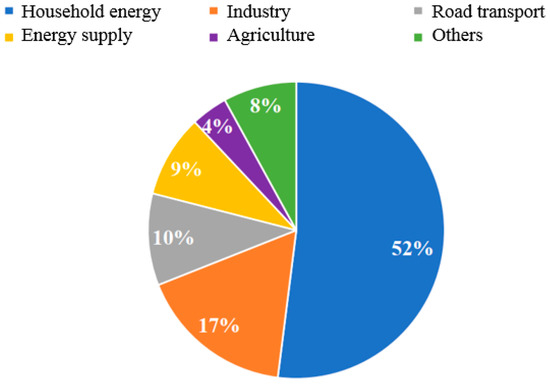
Figure 1.
Air pollution sources in Polish cities, based on [1].
The European Union agency responsible for providing information on the environment is the European Environment Agency (EEA). Thanks to the annual reports prepared by the EEA, it is possible to analyze air quality in all European Union countries [1,7,8,9].
It was on their basis that it was assumed that the permissible values of the annual average concentration of suspended dust (according to the European Commission) are as follows [10]:
- PM10 (40 µg/m3),
- PM2.5 (25 µg/m3).
The EEA report on air quality in the years 2000–2017, updated in 2019, shows that the highest values of the average annual concentration of PM10 particulate matter (above the limit value of 40 µg/m3) were recorded in Turkey, Poland, Italy, Macedonia, and Bulgaria. For PM2.5 airborne particulate matter, the annual average concentration values were exceeded in seven Member States (including Poland) and three other reporting countries (Slovakia Bulgaria, Spain). Thus, the main aim of the work is to establish the place of the city of Poznan compared to other cities in Poland and Europe, and to establish the reasons for the differences. On this basis, it can be concluded which actions taken by city managers have the greatest impact on the air quality in cities, and indirectly on the health of their inhabitants [8,10,11].
2. Materials and Methods
The materials enabling the comparison were, inter alia, data from annual reports published by the Main Inspectorate of Environmental Protection (in the case of Poland), the National Office for Environment, Agriculture and Geology (Germany) and Slovak Hydrometeorological Institute (Slovakia), ministries of the environment of the given countries, services, and applications allowing users to determine the level of air pollution and EEA database [12,13,14,15]. A device for air quality monitoring was used in the conducted research of external environment in Poznan. The criterion of air quality in the city was assumed particulate matter emission depending on the number and mass. The device used to conduct measurements is the TSI Optical Particle Sizer (OPS) Model 3330 (Figure 2).
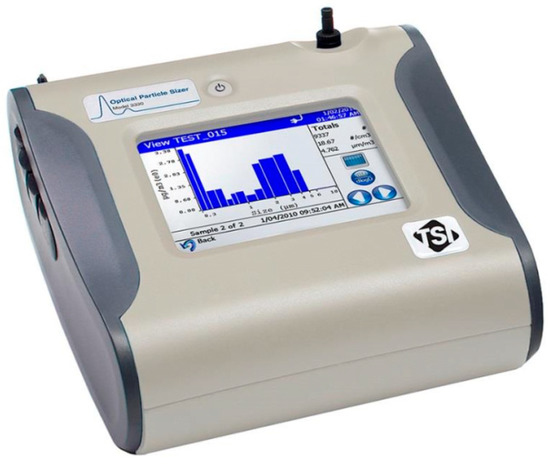
Figure 2.
The TSI Optical Particle Sizer (OPS) Model 3330 [16].
It enables the measurement of particles in the range from 0.3 to 10 μm for concentration from 0 to 3000/cm3. The OPS is a lightweight, portable device that provides fast and accurate particle concentration and size distribution measurement using single particle counting technology. The protocol for research in Poznan was programmed. The samples were gathered every ten seconds for 31 min at each of three chosen places. It enables to gather 186 samples each time. In order to analyze the collected research results, appropriate characteristics were developed. The number and mass distributions of solid particles as well as total averages will be presented particle concentration by number and mass. The 6 measurements (3 in the morning and 3 in the afternoon) were taken. The places of measurement were chosen according to proximity of road, household, and point (industry) emission sources and close to the official measuring stations [16].
3. Results
3.1. Comparison of Particulate Matter Emissions in Poznan with Other Cities
3.1.1. Comparison with European Cities
Cities similar to Poznan were selected for the comparative analysis, mainly in terms of population density. The first of the selected cities is Dresden, which is the capital of Saxony in eastern Germany. The second city is Bratislava (the capital of Slovakia), it is divided into 5 districts, there are 6 measuring stations in its area, 4 of which are state-owned [3,17]. Dresden covers an area of 328.28 km2, and in 2019 it had a population of around 557,000 (Table 1).

Table 1.
Descriptive parameters of analyzed European cities, based on Refs. [17,18,19].
There are 3 measuring stations of the National Office for Environment, Agriculture and Geology (LgULG) in Dresden city, where PM10 and PM2.5 are measured [20]:
- Bergstraße,
- Winckelmannstraße,
- Nord.
Bratislava is a city with an area of 367.9 km2, 432 thousand habitants, there are 4 measuring stations belonging to the national air quality monitoring network [15,21]:
- Bratislava-Jeséniova,
- Bratislava-Kamienne namestie,
- Bratislava-Trnawskie myto,
- Bratislava-Mamatejowa.
Based on the results obtained from the reports (Polish Chief Inspectorate of Environmental Protection and the Free City of Saxony), a comparison was made of the average annual concentration of PM10 dust in Poznan, Dresden, and Bratislava agglomeration (Table 2).

Table 2.
Average annual concentration of PM10 in European cities with the highest annual value in ug/m3 [14,15,18,21,22,23,24,25,26].
The agglomeration is the area which comprises a city or town proper and the suburban fringe or thickly settled territory lying outside, but adjacent to, its boundaries. A single large urban agglomeration may comprise several cities or towns and their suburban fringes [7,8]. In the case of Poznan it is the city and 15 other districts, e.g., Buk, Dopiewo, Swarzedz. The study was prepared for 2017–2019. It shows that the average annual concentration of PM10 is lower in Dresden than in Poznan every year, and this applies to all measuring stations. In analyzed cities, there was an increase in the average annual concentration of PM10 (compared to 2017), although in 2019 there was a slight decrease [18,22,27,28]. As can be seen, the average annual concentration of PM10 is lower in Bratislava than in Poznan agglomeration in 2017, 2018, and 2019, and this applies to all measuring stations. However, both in Bratislava and in Poznan, the average annual concentration increased in 2018 compared to 2017. At no measurement station was any exceedance of the permissible level recorded in any year [12]. In the case of Poznan, there are no measurement results for the station at Polanka St., so it is not possible to compare the difference in the annual concentration at one station. Every year the biggest annual concentration value was measured in Poznan (marked red in Table 2).
The next step of the analyzes enables to compare Poznan with cities of neighboring countries (Dresden, Bratislava, Brno, Vilnius and Gothenburg, Copenhagen beyond Baltic Sea). Ukrainian and Belarusian cities were not considered due to the lack of data on the emissions of the separated PM10 and PM2.5 fractions. The data are presented in Figure 3.
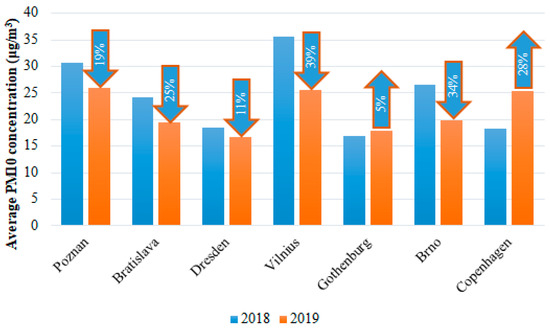
Figure 3.
Average PM10 concentration in cities of neighboring countries of Poland in 2018 and 2019, own study based on [13,29].
In 2018 the average PM10 concentration in Poznan was the second largest after Vilnius, however in 2019 there was a significant decrease in Vilnius which made Poznan almost even. The rest of the cities had lower concentration of PMs than Poznan, even though Gothenburg and Copenhagen noted an increase.
3.1.2. Comparison with Other Polish Cities
After comparing the emissions in European cities, selected cities in Poland were analyzed. When selecting the cities to be thoroughly compared in Poland, a similar territorial area and a similar population density in a given agglomeration were taken into account. It was assumed that the data of selected cities may differ by up to 25% compared to the data of Poznan. Two proper cities were selected: Wroclaw and Cracow. As shown in the Table 3, the area of the cities and the population density are similar. In 2016, Cracow was included in the list of the most polluted cities in the European Union prepared by the WHO (World Health Organization), which is an additional argument for the rightness of including it in the analysis.

Table 3.
Descriptive parameters of analyzed Polish cities [27,28,30,31,32].
The cities compared in Poland are Poznan, Wroclaw, and Cracow, the last one has the largest number of measuring stations. The first discussed parameter is the annual average PM10 dust concentration expressed in micrograms per m3. As can be seen, the average annual concentration of PM10 particulate matter in Poznan and Wroclaw is similar. No exceedance of the permissible level was recorded in any of the measuring stations through the years (Table 4).

Table 4.
Average annual concentration of PM10 in Polish cities (ug/m3) [12,13,18,27,28,30,31,32,33,34,35,36].
There were three stations measuring concentration of PM10 in Poznan (station at Chwialkowskiego St., Dabrowskiego St., and Szymanowskiego St.) and one more station in 2019 (Polanka station). The lowest average annual concertation of PM10 in Poznan was noted at Szymanowskiego St. station and was equal 25 µg/m3. The highest one was in 2018 at Dabrowskiego station [36,37]. It is located near one of the main exit routes from Poznan leading towards Poland’s western border. In Wroclaw, there are two measuring station (at Korzeniowskiego Street and Orzechowa Street). The average annual concentration of PM10 in Wroclaw is the lowest in 2019 at Wroclaw Orzechowa station, the highest in 2018 at Korzeniowskiego Street, but none of them were that high to exceed the acceptable level of 40 µg/m3. When analyzing the annual average concentration of PM10 in Cracow, it can be seen that this concentration decreased in 2019 compared to 2018. The values of the average annual concentration in Cracow are much higher than in Poznan. In 2017 almost every station in Cracow recorded an exceedance of the limit value. For 4 stations in 2018 in Cracow, the limit was exceeded, and in 2019 in one station. The maximum value every analyzed year was noted at Krasinskiego St. [34,35].
The 36th maximum concentration is the concentration value at the 36th measurement exceeding the allowable level. The 35 is the permissible level of the number of cases above the permissible concentration of PM10 dust (Figure 4, Figure 5 and Figure 6).
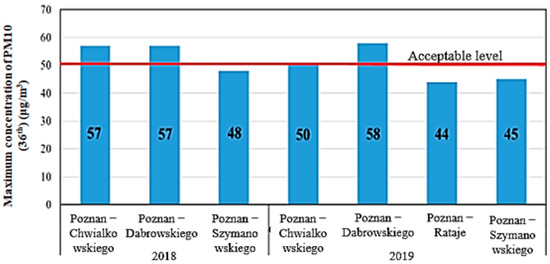
Figure 4.
Maximum concentration of PM10 (36th) in Poznan [27,28].
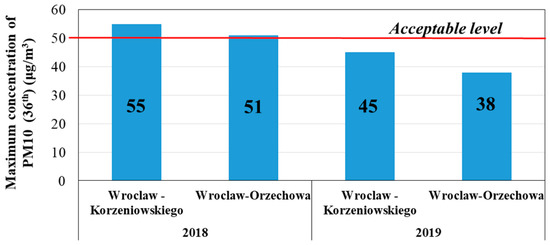
Figure 5.
Maximum concentration of PM10 (36th) in Wroclaw [31,32].
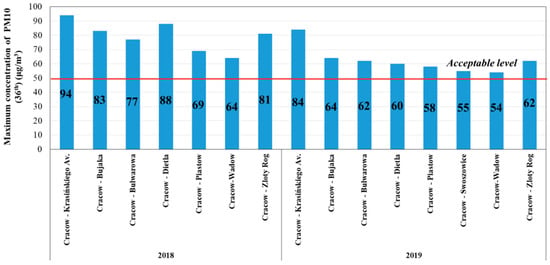
Figure 6.
Maximum concentration of PM10 (36th) in Cracow [30,38].
In the case of the maximum concentration of PM10 dust, it can be noticed that in Poznan the maximum concentrations reached highest values at Dąbrowskiego and Chwialkowskiego Street (Figure 4). In the case of 3 stations in Poznan, the permitted level was exceeded. Additionally, no maximum PM10 dust concentration values lower than 40 μg/m3 were recorded at any of the stations. In Wroclaw [15], on the other hand, the permissible level was exceeded only in one station, and the maximum concentration values were below 40 μg/m3 (Figure 5).
Taking into account the maximum concentration of PM10 in Cracow and Poznan, a significant difference can be noticed again (Figure 4 and Figure 6). In Cracow, the maximum values are much higher than in Poznan. At each station, the permissible level is exceeded. As before, there is a decrease in the value of the maximum concentration of PM10 suspended dust in 2019 compared to 2018.
In the case of the maximum concentration of PM10 dust (Figure 4 and Figure 5), it can be noticed that in Poznan the maximum concentrations reached higher values. In the case of 3 stations in the area of Poznan an exceedance of the limit was registered. Additionally, not at any of the station’s values of the maximum concentration of PM10 was less than 40 μg/m3 recorded. In Wroclaw, while the limit was exceeded only for one station, and the values the maximum concentration was below 40 μg/m3. Analyzing the number of exceedances above the permissible PM10 concentration level (Table 5), it can also be concluded that in Poznan this number was higher than in Wroclaw, both in 2018 and 2019.

Table 5.
Number of cases when the acceptable level was exceeded in Polish cities [19,27,28,30,31,32,33,34].
When analyzing the number of exceedances above the permissible PM10 concentration level, it can also be concluded that in Poznan this number was much lower than in Cracow, both in 2018 and 2019. Additionally, in Cracow, at each station, the permitted level was exceeded by as much as 400% in the case of stations on Krasinski Avenue. At other stations, the exceedances range from 50 to 70%. It should be noted that in both agglomerations the number of exceedances of the permissible level is lower in most measuring stations in 2019 compared to 2018. In order to extend the analysis, data on the emission of suspended dust PM10 in the compared agglomerations were also collected. The presented data are divided according to the type of emission and expressed in Mg/year. On the basis of the collected data, the characteristics of the emission volume in a given city were made, broken down into its types (Figure 7). When analyzing the emission of PM10 suspended dust in selected agglomerations, it can be noticed that the highest emission occurs in Wroclaw in 2018. The sum of the missions in Poznan is comparable to that in Wroclaw. In 2019, the smallest sum of emissions was recorded in Wroclaw, and Poznan, as in 2018, achieved a comparable value. In Cracow, the largest point issue was registered in both 2018 and 2019. It increased significantly in 2019 compared to 2018 and is over three times higher than in Poznan. The communal and housing emission reaches the highest values in Poznan and Wroclaw. It should be noted that it decreased significantly in both agglomerations in 2019. Road transport emissions are similar in Poznan and other agglomerations. Figure 7 shows the amount of suspended dust PM2.5 in the compared agglomerations in 2018 and 2019. As in the case of PM10 dust, the highest emission occurs in Poznan and Wroclaw in 2018. Similarly, to the previous analysis, municipal and household emissions achieve the highest values in Poznan and Wroclaw. It also decreased significantly in 2019. In Cracow, the largest point issue was registered in both 2018 and 2019. It increased significantly in 2019 compared to 2018 and is over three times greater than in Poznan [39].
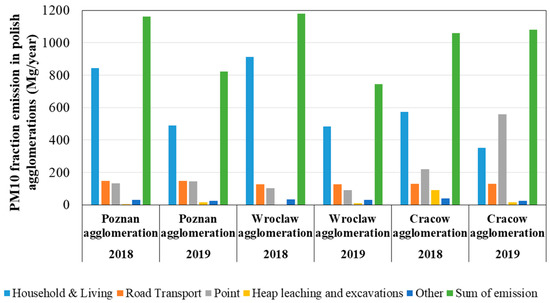
Figure 7.
PM10 emission in Polish agglomerations in 2018 and 2019 [19,24,25,33,34,40].
Extending the analysis reveals the importance of considering particulate matter air pollution in terms of both emissions and concentration. Annual average concentrations and the number of exceedances of permissible levels reach much higher values in the agglomeration Cracow than in Poznan. Analyzing for emissions, however, shows higher values for particulate matter for Poznan and Wroclaw. A significant annual decline in the value of household and living emission (PM fraction) in Polish agglomerations may be caused, inter alia, by the local government programs like KAWKA bis [38]. The performed comparison shows the emission and concentration of suspended dust PM10 in Poznan against the supraregional background. Taking into consideration values of average PM concentration in Polish cities and the ones in neighboring countries, which have a similar number of habitants, it can be stated that in most cities the average in 2019 is lower than 2018 (Figure 8). The only exceptions are Copenhagen and Gothenburg but still the values are lower than in most Polish cities. Additionally, Dresden, Brno, and Bratislava obtained better results than Poznan. The worst air quality was noted in Cracow, GZM (the metropolitan union with Bytom, Chorzow, Katowice, Sosnowiec, and around 30 other districts). Belarusian and Ukrainian cities could not be analyzed, because there are no certificated national stations measuring PMs (Figure 8).
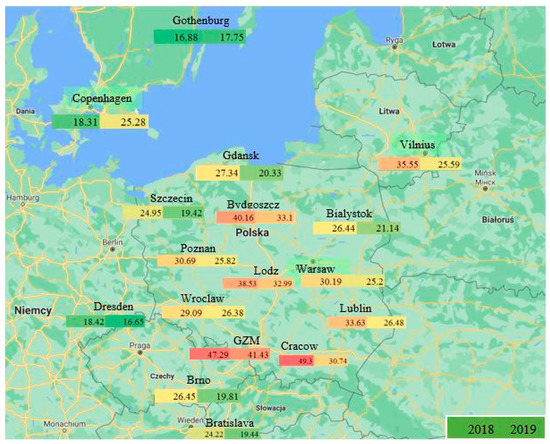
Figure 8.
Average PM10 concentration in Polish and neighboring countries in 2018 and 2019, own study based on [13].
Additionally, based on monthly average concentration of PMs in Poznan in 2018 and 2019, it can be observed that the changes in values are seasonal (Figure 9). The average concentration of PM10 and PM2.5 is lower from May to September and higher in months with lower temperature while more habitants commute by car, the houses are heated and, due to shorter days, more electricity is used.
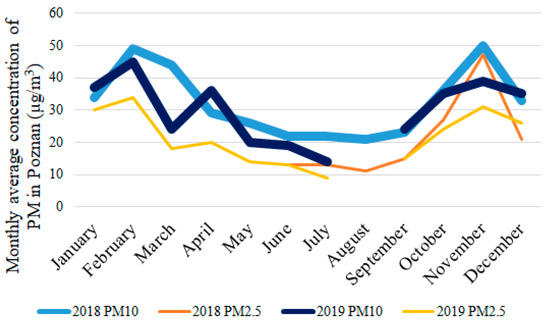
Figure 9.
Monthly average concentration of PM10 and PM2.5 in Poznan in 2018 and 2019, own study based on [16].
3.2. Measurements in Poznan
The Chief Inspector of Environmental Protection (CIEP) deployed 4 measurement points in Poznań. These are the stations on the streets: Chwialkowskiego (1), Szymanowskiego (2), Polanka (3), and Dabrowskiego (4) [34]. All of them allow the measurement of PM concentration. Two of them are automatic stations, two are manual. Another CIEP station located close to Poznań (in the neighboring Czerwonak commune) is the automatic station in Kozieglowy (5). In Figure 10, the following are marked respectively: green color—manual stations, blue—automatic stations, yellow—automatic-manual stations, and red—measuring points where the tests were carried out: Rondo Rataje (A), Fabryczna (B), Przemysłowa (C).
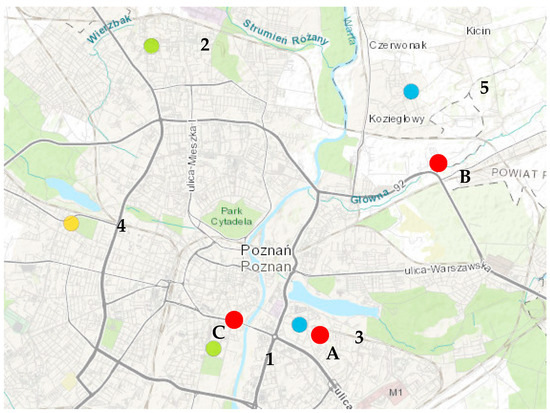
Figure 10.
Measuring point and stations in Poznan.
The mass concentration and the number of solid particles were measured in Poznan using the apparatus Optical Particle Sizer OPS 3330. The measurements took place in three different points in Poznan characterized by the proximity of: point, household and living, and road transport emission sources. The tests of air quality (understood as measuring mass and number concentration of PM10) were carried out in the morning rush hours (first measurement) and in the afternoon (second measurement). Each of the measurements lasted 31 min, during this time the device collected 186 samples (1 sample/10 s). In total, 6 measurements were carried out. The measurement points were chosen as they were located in places characteristic for emission sources: point, household and living, and road transport (Figure 11 and Figure 12).
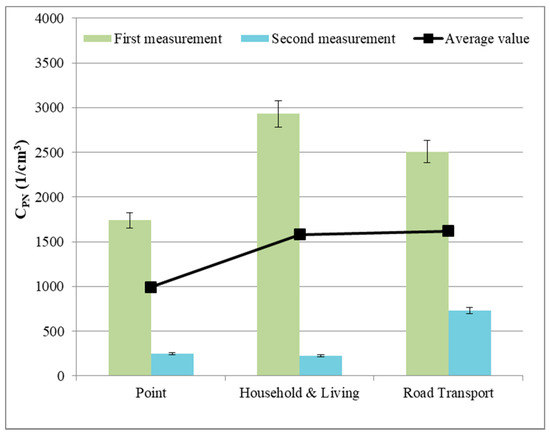
Figure 11.
Number of PM10 per cm3 in Poznan (own study).
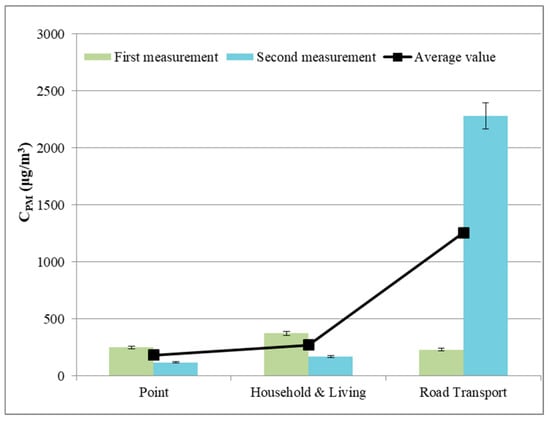
Figure 12.
Mass concentration of PM10 in Poznan (own study).
It can be observed that there are more PM10 in number and mass in the morning near point and household emission sources [38]. When it comes to road transport emission it can be stated that the mass is significantly higher than the number of PM, thus in the road transport emission there is a greater share of larger particulate matters. The CPM in all measurement points is approximately a few hundred micrograms per cubic meter at the same time, official measuring stations at Dabrowskiego and Zelazna Street noted average concentration of PM10 24 μg/m3 during the time of first measurement and 12 μg/m3 during the second. It is crucial to highlight the difference between designated measuring points and level of emission in other parts of the city where people also live, commute, and work.
The collected data are compared with daily average from the closest measuring station (Table 6). It can be noted that the differences between the first measurement (morning) and the second (afternoon) are greatest in the case of the proximity to the sources of road emissions, additionally, the measurement from Polanka station (3 in the Figure 10) are not available. At the B point, the values from the conducted studies are lower than the daily average from the closest station. In the case of household and living (H&L) there is the slightest difference. The average emission for Poznan on the measurement day equals 24.5 µg/m3 [1].

Table 6.
A comparison on of real time test results with measurements from the official stations [12,41,42].
4. Discussion
When analyzing all the results related to air pollution in urban areas, it is important to remember about their seasonality, related to both home heating and daily and weekly changes in traffic emissions. Significant differences can also be noted during the summer holidays. This is important when using modeling to obtain air pollution maps. In terms of air quality understood as PM10 concentration, Poznan compares well with other cities in Poland, but much worse than neighboring cities located nearby. The situation is improving year by year; however, this is not as spectacular as it is in Cracow. Actions to improve air quality, especially regarding particulate matter emissions, should begin before such high levels of exceedance are achieved as in Krakow. In all analyzed Polish cities, however, a decrease in the number of days with exceeded permissible values is observed. The conducted research shows that averaged values are not everything. The air quality can vary considerably up to several hundred meters from the measuring site. All measurement points were located in places where the inhabitants of the city travel on a daily basis. This is especially noticeable when measuring at a point related to traffic emission. The average of the measuring points that are distant from the street does not indicate a real danger. Therefore, it is important to establish a dense network of measuring stations and to warn residents of exceeded limits on a regular basis. Poznan has taken steps to improve air quality, these are activities based on the elimination of low-emission heat sources caused by solid fuel furnaces, control of home furnaces and home boiler rooms as well as improvement of communication and reduction of transport emissions, district heating, gas or electric heating. Cracow: “Infoair—what do we know about smog?” It is a program that informs the public about air quality. Cracow was the first city in Poland to introduce a system of informing about high air pollution with the concentration of PM10 dust at the level exceeding 150 µg/m3. Moreover, from 6 July 2015, urban transport company in Cracow puts on displays with the timetable located at communication stops municipalities, information on the air condition in Cracow. On the basis of the conducted comparison, it can be concluded that Wroclaw and Poznan achieve very similar results in terms of emissions. Cracow, on the other hand, is a city where for a few years there have been significant problems, with the phenomenon of smog and excessive emission of particulate matter reaching extremely different values compared to Poznan. However, it should be noted that for each of the compared cities, it actively works for air protection and reduction air pollutant emissions. The effects of these activities can be seen in significantly reduced municipal and household emissions in 2019 compared to 2018. Both Bratislava and Dresden have lower concentrations of particulate matter than Poznan, but these values increased in 2018 compared to 2017. Wroclaw and Poznan have similar emission values, but Cracow’s efforts to improve air quality are worth following. Most of the reports consist the data about the whole countries, e.g., there are comparisons of harmful compounds in Poland, Germany, Norway, and the Czech Republic. These dates are average form the data from the cities, and the annual value is an average from hourly measurements from stations in a few points in the city. This makes the comparison a huge generalization and makes it harder to propose the appropriate corrective actions.
5. Conclusions
The purpose of the article is to identify the position of the Poznan agglomeration compared with similar cities in terms of particulate matter emissions. It can be concluded that Wroclaw and Poznan achieve very similar results in terms of emissions. Cracow, on the other hand, as a city where for several years there have been significant problems with the phenomenon of smog and excessive emission of particulate matter, reaches extremely different values compared to Poznan. When comparing Poznan, Dresden, and Bratislava (2017–2019) it can be seen that every year the biggest annual concentration value was measured in Poznan. Average PM10 concentration in Poznan is one of the highest comparing with neighboring countries’ cities and the Vilnius noted better improvement in the matter. The communal and housing emission reaches the highest values in Poznan and Wroclaw and it can be significantly improved as the Cracow example shows. Changes in values of PM10 are seasonal. It can be observed that there are more PM10 in number and mass in the morning near point and household emission sources. When it comes to road transport emission it can be stated that the mass is significantly higher than the number of particles, thus in the road transport emission there is a greater share of larger particles. The location and the distance of the measuring station from the emission source is crucial.
Author Contributions
Conceptualization, R.J. and M.G.-G.; methodology, R.J.; software, M.N.; validation, P.K., M.M., M.G. and K.K.; formal analysis, K.K.; investigation, P.K.; resources, M.M.; data curation, M.N.; writing—original draft preparation, M.G.; writing—review and editing, K.K. and M.G.; visualization, M.M. and P.K.; supervision, M.G.-G.; project administration, R.J.; funding acquisition, R.J. All authors have read and agreed to the published version of the manuscript.
Funding
This research and APC was funded by Interdisciplinary Rector’s Grant, grant number ERP/33/32/SIGR/0004.
Institutional Review Board Statement
Not applicable.
Informed Consent Statement
Not applicable.
Data Availability Statement
Data available on request due to restrictions e.g., privacy or ethical. The data presented in this study are available on request from the corresponding author. The data are not publicly available due to onging project.
Conflicts of Interest
The authors declare no conflict of interest.
References
- European Environment Agency. Air Pollution. Available online: https://www.eea.europa.eu/pl/themes/air/intro (accessed on 9 August 2020).
- Jasinski, R. Number and mass analysis of particles emitted by aircraft engine. MATEC Web Conf. 2017, 18, 00023. [Google Scholar] [CrossRef]
- Kryzia, D.; Pepłowska, M. The impact of measures aimed at reducing low-stack emission in Poland on the energy efficiency and household emission of pollutants. Energy Policy J. 2019, 22, 121–132. [Google Scholar] [CrossRef]
- Directive 2004/107/EC of the European Parliament and of the Council of 15 December 2004 Relating to Arsenic, Cadmium, Mercury, Nickel and Polycyclic Aromatic Hydrocarbons in Ambient Air, L 23/3, 2004. Available online: https://www.eumonitor.eu/9353000/1/j9vvik7m1c3gyxp/vitgbgig0qzr (accessed on 10 August 2020).
- Directive (EU) 2016/2284 Of The European Parliament and of the Council of 14 December 2016. Available online: https://www.legislation.gov.uk/eudr/2016/2284/contents (accessed on 10 August 2020).
- Directive 2008/50/EC of the European Parliament and of the Council of 21 May 2008 on Ambient air Quality and Cleaner Air for Europe, L 152. Available online: https://eur-lex.europa.eu/legal-content/en/ALL/?uri=CELEX%3A32008L0050 (accessed on 10 August 2020).
- EEA Report No 5/2020. European Union Emission Inventory Report 1990–2018 under the UNECE Convention on Long-Range Transboundary Air Pollution (LRTAP); Publications Office of the European Union: Luxembourg; Copenhagen, Denmark, 2020. [Google Scholar]
- European Environment Agency. Air Quality in Europe—2019 Report. Available online: https://www.eea.europa.eu/publications/air-quality-in-europe-2019 (accessed on 9 August 2020).
- Commission Regulation (EU) 2018/1832 of 5 November 2018 Amending Directive 2007/46/EC of the European Parliament and of the Council, Commission Regulation (EC) No 692/2008 and Commission Regulation (EU) 2017/1151 for the Purpose of Improving the Emission Type Approval Tests and Procedures for Light Passenger and Commercial Vehicles, Including Those for In-Service Conformity and Real-Driving Emissions and Introducing Devices for Monitoring the Consumption of Fuel and Electric Energy (OJ L 301, 27.11.2018, pp. 1–314). Available online: https://eur-lex.europa.eu/legal-content/GA/TXT/?uri=CELEX:32018R1832 (accessed on 10 August 2020).
- Sokolnicka-Popis, B.; Szymlet, N.; Siedlecki, M.; Gallas, D. The impact of particulate filter substrate type on the gaseous exhaust components emission. Combust. Engines 2020, 183, 58–62. [Google Scholar] [CrossRef]
- Zhang, N.; Huang, H.; Duan, X.; Jinlong, Z.; Su, B. Quantitative Association Analysis between PM2.5 Concentration and Factors on Industry, Energy, Agriculture, and Transportation; Scientific Reports; Nature Publishing Group: Berlin, Germany, 2018. [Google Scholar] [CrossRef]
- Atlas of Air Quality Zones and Monitoring Stations 2013&2014, Slovakia; DG Environment: Brussels, Belgium, 2014.
- Discomap. Available online: eea.europa.eu (accessed on 3 February 2021).
- Dresden. Luftreinhalteplanfür die Landeshauptstadt Dresden 2017, Dresden, 2019. Available online: https://www.dresden.de (accessed on 9 August 2020).
- Národný Program Znižovania Emisií; Ministerstvo Zivotneho Prostredia Slovenskej Rebubliky: Bratislava, Slovakia, 2020.
- Technical Data of Optical Particle Sizer 3330. Available online: https://tsi.com/products/particle-sizers/particlesize-spectrometers (accessed on 12 August 2020).
- Bratislava in Figures; Statistical Office of the Slovak Republic: Bratislava, Slovakia, 2019.
- Dresden. AllgemeineLuftbelastung. Available online: https://www.dresden.de (accessed on 9 August 2020).
- POZnan. City Activities to Improve Air Quality. Available online: https://www.poznan.pl/mim/main/en/ (accessed on 11 August 2020).
- Sachsen.de, Aktuelle Messwerte. Available online: https://www.luft.sachsen.de/aktuelle-messwerte-15045.html (accessed on 9 August 2020).
- Slovak Hydrometeorological Institute, Department Of Emissions and Air Quality Monitoring. Air Pollution in the Slovak Republic in 2015; Ministry of Environment of the Slovak Republic: Bratislava, Slovakia, 2017.
- Dresden. Bevölkerungsbestand. Available online: https://www.dresden.de (accessed on 9 August 2020).
- Informácia o Kvalite Ovzdušia a Podiele Stacionárnych Zdrojov na Znečisťovaní Ovzdušia, o Programoch na Zlepšenie Kvality Ovzdušia a Akčných Plánoch v Bratislavskom Kraji; Oddelenie Štátnej Správy vôd a Vybraných Zložiek Životného Prostredia Kraja Žilina, Slovakia; The Ministry of Interior of the Slovak Republic: Bratislava, Slovakia, 2017.
- Pausch, A.; Franke, J.; Löschau, G.; Mühlner, M. Luftqualität in Sachsen-Jahresbericht 2018; Sächsische Staatskanzlei: Freistaat Sachsen, Germany, 2018.
- Pausch, A.; Franke, J.; Löschau, G.; Straková, M.; Mannewitz, A. Luftqualität in Sachsen-Jahresbericht 2017; Sächsische Staatskanzlei: Freistaat Sachsen, Germany, 2017.
- Správa o Kvalite Ovzdušia v Slovenskej Republike, 2018; Slovenský Hydrometeorologický Ústav: Bratislava, Slovakia, 2019.
- Regional Department of Environmental Monitoring in Poznan. Annual Assessment of Air Quality in the Lesser Poland Voivodeship, Voivodeship Report for 2019; Regional Department of Environmental Monitoring in Poznan: Poznań, Poland, 2020.
- Regional Department of Environmental Monitoring in Poznan. Annual Assessment of Air Quality in the Lesser Poland Voivodeship, Voivodeship Report for 2018; Regional Department of Environmental Monitoring in Poznan: Poznań, Poland, 2019.
- Report on the State of Current National Legislation and Policies to Improve the Air Quality; Interreg Central Europe: Vienna, Austria, 2018.
- Regional Department of Environmental Monitoring in Cracow. Annual Assessment of Air Quality in the Lesser Poland Voivodeship, Voivodeship Report for 2018; Regional Department of Environmental Monitoring in Cracow: Kraków, Poland, 2019.
- Regional Department of Environmental Monitoring in Wroclaw. Annual Assessment of Air Quality in the Lesser Poland Voivodeship, Voivodeship Report for 2019; Regional Department of Environmental Monitoring in Wroclaw: Wrocław, Poland, 2020.
- Regional Department of Environmental Monitoring in Wroclaw. Annual Assessment of Air Quality in the Lesser Poland Voivodeship, Voivodeship Report for 2018; Regional Department of Environmental Monitoring in Wroclaw: Wrocław, Poland, 2019.
- Report: Solid Fuel Heat Sources in Residential Buildings; Wrocław University of Technology, Research Center for Sustainable Built Environment RoSE: Wrocław, Poland, 2019.
- Poznan–Measurement Data of Air Quality. Available online: powietrze.poznan.wios.gov.pl/dane-pomiarowe/ (accessed on 2 February 2021).
- Regional Department of Environmental Monitoring in Cracow. Annual Assessment of Air Quality in the Lesser Poland Voivodeship, Voivodeship Report for 2019; Regional Department of Environmental Monitoring in Cracow: Kraków, Poland, 2020.
- Regional Annual Air Quality Assessment in the Greater Poland Voivodeship for 2017; Chief Inspectorate for Environmental Protection in Poznan: Poznan, Poland, 2018.
- Stations’ Browser. Available online: https://powietrze.gios.gov.pl/pjp/station/search (accessed on 7 August 2020).
- Website of KAWKA Project Plus Realized in Wroclaw. Available online: https://zmienpiec.pl/kawka-plus (accessed on 10 August 2020).
- MOCH, B. Learn about Renewable Energy Sources. 2019. Available online: https://www.wroclaw.pl/srodowisko/poznaj-oze/czerwiec (accessed on 9 August 2020).
- Jasinski, R. Mass and number analysis of particles emitted during aircraft landing. E3S Web Conf. 2018, 44, 00057. [Google Scholar] [CrossRef]
- Regional Annual Air Quality Assessment in the Greater Poland Voivodeship for 2018; Chief Inspectorate for Environmental Protection in Poznan: Poznan, Poland, 2019.
- Airly.eu. Available online: https://airly.org/pl/ (accessed on 10 August 2020).
Publisher’s Note: MDPI stays neutral with regard to jurisdictional claims in published maps and institutional affiliations. |
© 2021 by the authors. Licensee MDPI, Basel, Switzerland. This article is an open access article distributed under the terms and conditions of the Creative Commons Attribution (CC BY) license (https://creativecommons.org/licenses/by/4.0/).