Article

Estimation and Prediction of Industrial VOC Emissions in Hebei Province, China

1
Key Laboratory of Beijing on Regional Air Pollution Control, College of Environmental & Energy Engineering, Beijing University of Technology, Beijing 100124, China
2
Beijing Key Laboratory for VOCs Pollution Prevention and Treatment Technology and Application of Urban Air, National Engineering Research Center of Urban Environmental Pollution Control, Beijing Municipal Research Institute of Environmental Protection, Beijing 100037, China
*
Author to whom correspondence should be addressed.
Atmosphere 2021, 12(5), 530; https://doi.org/10.3390/atmos12050530
Submission received: 24 February 2021 / Revised: 3 April 2021 / Accepted: 16 April 2021 / Published: 21 April 2021
(This article belongs to the Section Air Quality)

Abstract

:
The study of industrial volatile organic compound (VOC) emission inventories is essential for identifying VOC emission levels and distribution. This paper established an industrial VOC emission inventory in 2015 for Hebei Province and completed an emission projection for the period 2020–2030. The results indicated that the total emissions of industrial VOCs in 2015 were 1017.79 kt. The use of VOC products accounted for more than half of the total. In addition, the spatial distribution characteristics of the industrial VOC emissions were determined using a geographic information statistics system (GIS), which showed that the VOCs were mainly distributed the central and southern regions of Hebei. Considering the future economic development trends, population changes, related environmental laws and regulations, and pollution control technology, three scenarios were defined for forecasting the industrial VOC emissions in future years. This demonstrated that industrial VOC emissions in Hebei would amount to 1448.94 kt and 2203.66 kt in 2020 and 2030, with growth rates of 42.36% and 116.51% compared with 2015, respectively. If all industrial enterprises took the control measures, the VOC emissions could be reduced by 69% in 2030. The analysis of the scenarios found that the most effective action plan was to take the best available control technologies and clean production in key industries, including the chemical medicine, coke production, mechanical equipment manufacturing, organic chemical, packaging and printing, wood adhesive, industrial and construction dye, furniture manufacturing, transportation equipment manufacturing, and crude oil processing industries.

1. Introduction

Volatile organic compounds (VOCs) are known as one of the main sources of secondary organic aerosols (SOAs) generated through photochemical oxidation and as the key precursors to the formation of ground-level ozone [1]. Additionally, VOCs themselves are harmful to human health. For example, BTEX (i.e., the group of VOCs of benzene, toluene, ethyl-benzene, and xylenes) have inhalation toxicity and cause cancer [2]. In particular, benzene was listed as a first-class carcinogen by the International Institute of cancer (IARC). Therefore, the abatement of VOC emissions has gradually become a significant issue in improving air quality and public health. Before the formulation of effective control strategies to reduce VOC emissions, it is an essential and urgent matter to accurately estimate the present emissions of pollutants and predict the future trend.
The establishment of an emission inventory with a high spatial and temporal resolution could not only help to quantify and characterize pollutant emissions from anthropogenic and natural sources but also be used as input data for air quality models to simulate air quality variation in preparation for further health and cost–benefit analyses that are of greater concern. Since the 1990s, Europe and the United States have recognized the harm of VOC pollutants and thus conducted some studies for the establishment of VOC emission inventories and emission factor libraries [3,4,5]. A global VOC emission inventory of anthropogenic sources was established in 1990, where wood fuel combustion, savannah combustion, gasoline production, waste treatment, organic chemical industry, and other sectors were found to be the main emission sources [6]. Moreover, Rajabi [7] evaluated the overall scale of global VOC emissions from all stages of oil processing. Until now, a number of studies have already established national and regional VOC emission inventories with higher sectoral, temporal, spatial, and chemical species resolutions. For instance, Benjamin [8] conducted a study on the resolved biogenic hydrocarbon emission inventory for the California south coast air basin. Dommen [9] developed a VOC emission inventory for the Lombardy region in Italy with a one hour temporal and 3 km spatial resolution which comprehensively covered emission sources such as biological sources, industrial production, solvent use, waste treatment, transportation, power plants, and oil refineries. Besides this, there are also some studies on VOC emissions focused on other countries and regions, including Spain [10], Greece [11], Denmark [12], India [13], southwest Africa [14], and Korea [15]. The first inventory of anthropogenic sources of VOCs in China from 1990 to 2000 was established referring to the emission factors from Western countries [16]. After that, more studies began to focus on VOC emission inventories from anthropogenic sources in China. For example, Wei [17] and Gong [4] established a VOC emission inventory from 2005 to 2010 in China which was more accurate than its predecessor, owing to its refinement and localization of emission factors. A VOC emissions inventory of anthropogenic sources at the county level in China was compiled in 2000 based on the investigation of activity data for all cities, prefecture-level cities, and counties throughout the country [4,18]. Moreover, a couple of studies focused on VOC emission inventories for some key regions, such as north China, the Yangtze River Delta (YRD), the Pearl River Delta (PRD), and other areas [19,20,21,22,23,24].
However, there is still lack of VOC emission inventories for some major areas, such as Hebei Province. This region is of particular interest because of its special location and poor air quality. It lies in the key area (Beijing-Tianjin-Hebei region) of pollution control in China. In fact, 6 of the 10 worst air pollution cities of China were found to be located in Hebei Province in 2015 [25]. Therefore, it is of vital importance to establish a VOC emission inventory to further improve air quality and formulate more effective pollution control strategies for Hebei Province.
The VOC emission sources in China generally comprise stationary combustion, road vehicles, solvent utilization, and industrial processes. Some studies have shown that biomass-burning sources cause the largest amount of emissions, but the total amount of industrial VOC emissions is projected to grow substantially in the future [6,26,27,28]. In addition, the study results of Zhang [29] showed that anthropogenic VOC emissions could dominate on a global level, especially in densely populated urban areas or highly industrialized regions. Moreover, Hebei Province is characterized by its small area, large population density, and developed industry, with a large amount of coal and chemical industries. According to the China Statistical Yearbook [30], the industrial GDP of Hebei Province in 2015 was 144 billion Yuan, accounting for 5.1% of the national industrial GDP, where the output of major industries related to VOC emissions, including chemical medicine, petrochemicals, coke production, machine equipment manufacturing, wood adhesives, organic chemistry, and packaging and printing, accounts for 1%, 2%, 3%, 4%, 5%, 7%, and 8% of the national output, respectively. Hence, it is necessary to fully understand the characteristics of the VOCs emitted from industrial sources in Hebei Province.
In this paper, the emission factor method was used to establish a VOC emission inventory from industrial sources in Hebei Province for 2015. Additionally, the spatial distribution of industrial VOCs was analyzed by applying population density information based on geographic information systems (GIS). Moreover, three emission reduction scenarios were defined based on the presently feasible VOC control strategies in order to predict the changing trend of industrial VOC emissions in Hebei Province for 2020 and 2030. The results could be fundamental and valuable for formulating VOC control policies.

2. Materials and Methods
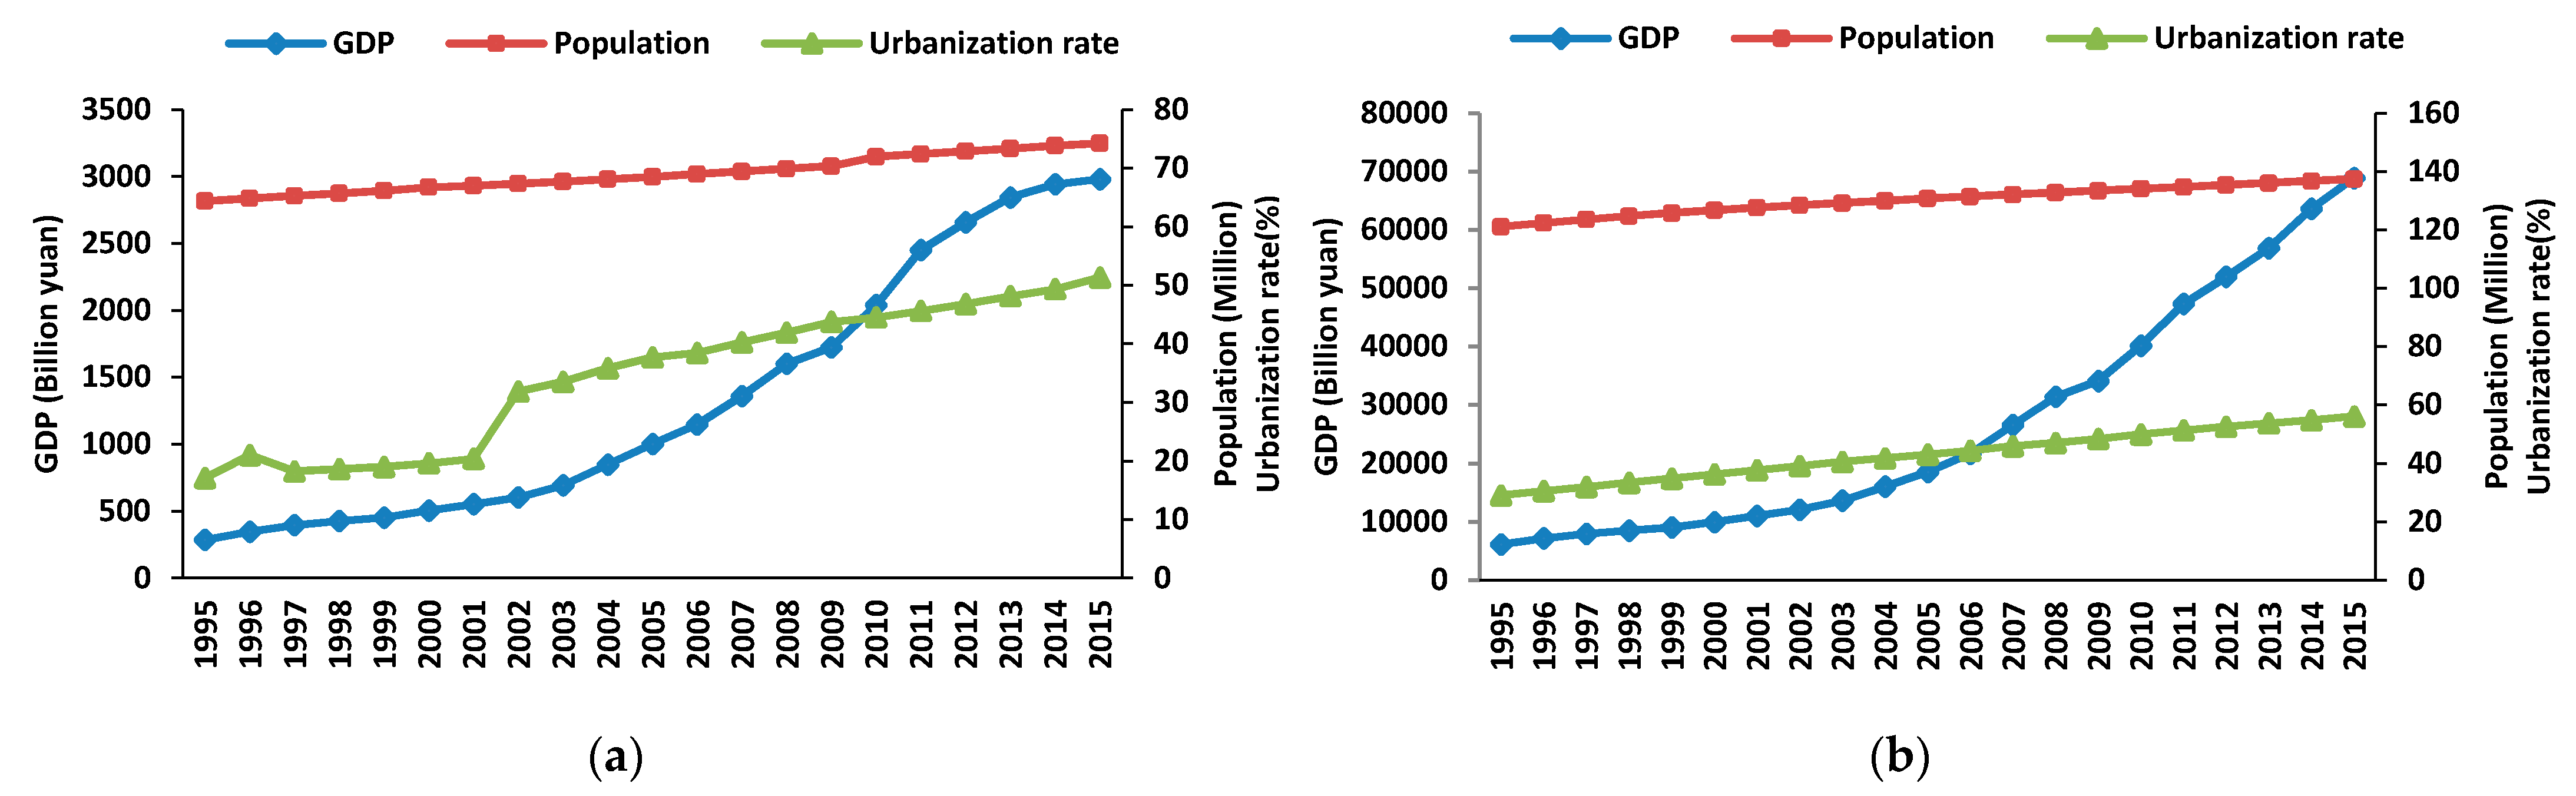
2.1. Study Area

Hebei Province covers an area of 187,700 km2, accounting for 1.95% of the total territory, 5.4% of the total population, and 4.3% of the total GDP of China in 2015 [30]. Figure 1 shows the trend of the GDP, urbanization rate, and population of Hebei Province and China over the past 20 years. Although the trends in Figure 1a,b are generally similar, the GDP and urbanization in Hebei Province have grown rapidly and at a faster rate than the nationwide one since 2000. As China’s major industrial base, the secondary industry in Hebei Province accounted for 48.3% of the total national value in 2015, forming the industrial structure dominated by seven major industries, including equipment manufacturing, iron and steel, petrochemicals, food, medicine, building materials, and textiles [31]. The pillar industries dominated by steel, coal, and cement have caused Tangshan to rank top in Hebei Province in terms of GDP and GDP per capita for many years. As the second city in Hebei Province in terms of GDP, Shijiazhuang is an important national textile base of China and also has the largest pharmaceutical industry, with its output accounting for about 35% of the total in China. Moreover, the industrial GDP in other cities, such as Cangzhou, Baoding, Handan, also accounted for a relatively large proportion of the Hebei province [32].

2.2. Methodology

The Technical Guide on Compiling Atmospheric Volatile Organic Compounds Source Inventory (hereafter referred to as the Technical Guide), issued in August 2014 [33], was employed in this study. This methodology includes four steps: the identification of major sources of VOC emissions, activity data collection, emission factor (EF) analysis, and the method of calculation of emissions. The industrial VOC emissions were calculated using the EF approach [11,32], implemented using the following equation:
E = i j A i , j E F i , j ( 1 n i , j ) ,
where i represents the city, j represents the emission source, E is the annual total emissions of the VOCs, n is the efficiency of the removal of the VOCs by control technologies, A i , j is the activity level of source j in i city, and E F i , j is the emission factor of source j in i city.
The classification of emission source is an important basis for the development of emission inventories. In this study, the sources of industrial VOCs emissions were grouped into four types—including the production of VOCs, storage and transport, the industrial processes using VOCs as raw materials, and the use of VOC products—based on the source tracing method employed in most studies [3,19,34,35,36,37,38].

2.3. Data Collection

2.3.1. Activity Data

The approach used for the collection of activity data was determined specifically for each industrial emission source. Thus, 74 samples of industrial sources were investigated in 11 cities in Hebei Province. The monthly average information for each city, including fuel consumption and product output, was gathered from the official statistics, such as the Hebei Economic Yearbook [32], the China Statistical Yearbook [30], the China Energy Statistical Yearbook [39], and the Hebei Provincial Bureau of Statistics [40]. For example, the activity data of the storage and transportation of oil were obtained through the Regional Energy Balance Table in the China Statistical Yearbook [30]. Despite this, there were still some activity data that were difficult to acquire due to missing information, including for the textile and dyeing, packaging and printing, wood processing, building decorations, furniture manufacturing, footwear, machinery and equipment manufacturing, and transportation equipment manufacturing industries. In this situation, we collected activity data or product output from national and municipal records to supplement. In addition, some data of industrial sectors were obtained by referring to the literature, websites, and industry reports. The specific types and sources of activity data obtained for Hebei Province are summarized in Table 1.

2.3.2. Emission Factors

As key indicators relating to the quantity (weight) of the pollutants emitted from a unit of activity of the source, emission factors have a direct impact on the estimation of pollutant emissions, as seen in Equation (1). Thus, it is critical to obtain the emission factors with a high accuracy for the preparation of an emission inventory. Considering factors including the representativeness and availability of EFs, localized EFs, and updates of EFs from the latest research, the EFs in this study were mainly obtained from the Technical Guide, the Taiwan Environmental Protection Agency, and other research. Specific details of the emission factors in 2015 for Hebei Province are shown in Table 2.

2.4. Scenario Designed

The future (2020–2030) industrial VOC emissions in Hebei Province were projected in this study, taking 2015 as the reference year. Three scenarios, including a Business As Usual (BAU) scenario, a moderate scenario, and a strict scenario were defined, combining economic development trends, demographic changes, and related control measures and policies in Hebei Province in future years. The trends of GDP, population, and urbanization rate during the period 2015–2030 are shown in Table 3. The population was forecasted by applying the Chinese Population Prediction Software (CPPS), while the urbanization rate was determined based on the growth rate proposed by the 13th Five-Year plan (2016–2020) [52]. Moreover, Chinese policymakers have issued specific objectives and implementation plans for the comprehensive treatment of VOCs emission in recent years, including the Air Pollution Prevention and Control Action Plan (2013–2017) [53], the 13th Five-Year Plan for the Prevention and Control of Volatile Organic Compound Pollution (2017–2020) [54], and the Volatile Organic Compounds Reduction Action Plan for Key Industries (2016–2018) [55]. The specific definitions of the emission scenarios are summarized in Table 4. Some key parameters, such as emission control technologies and removal efficiencies for each industrial sector, are defined in Table 5.

3. Results and Discussion

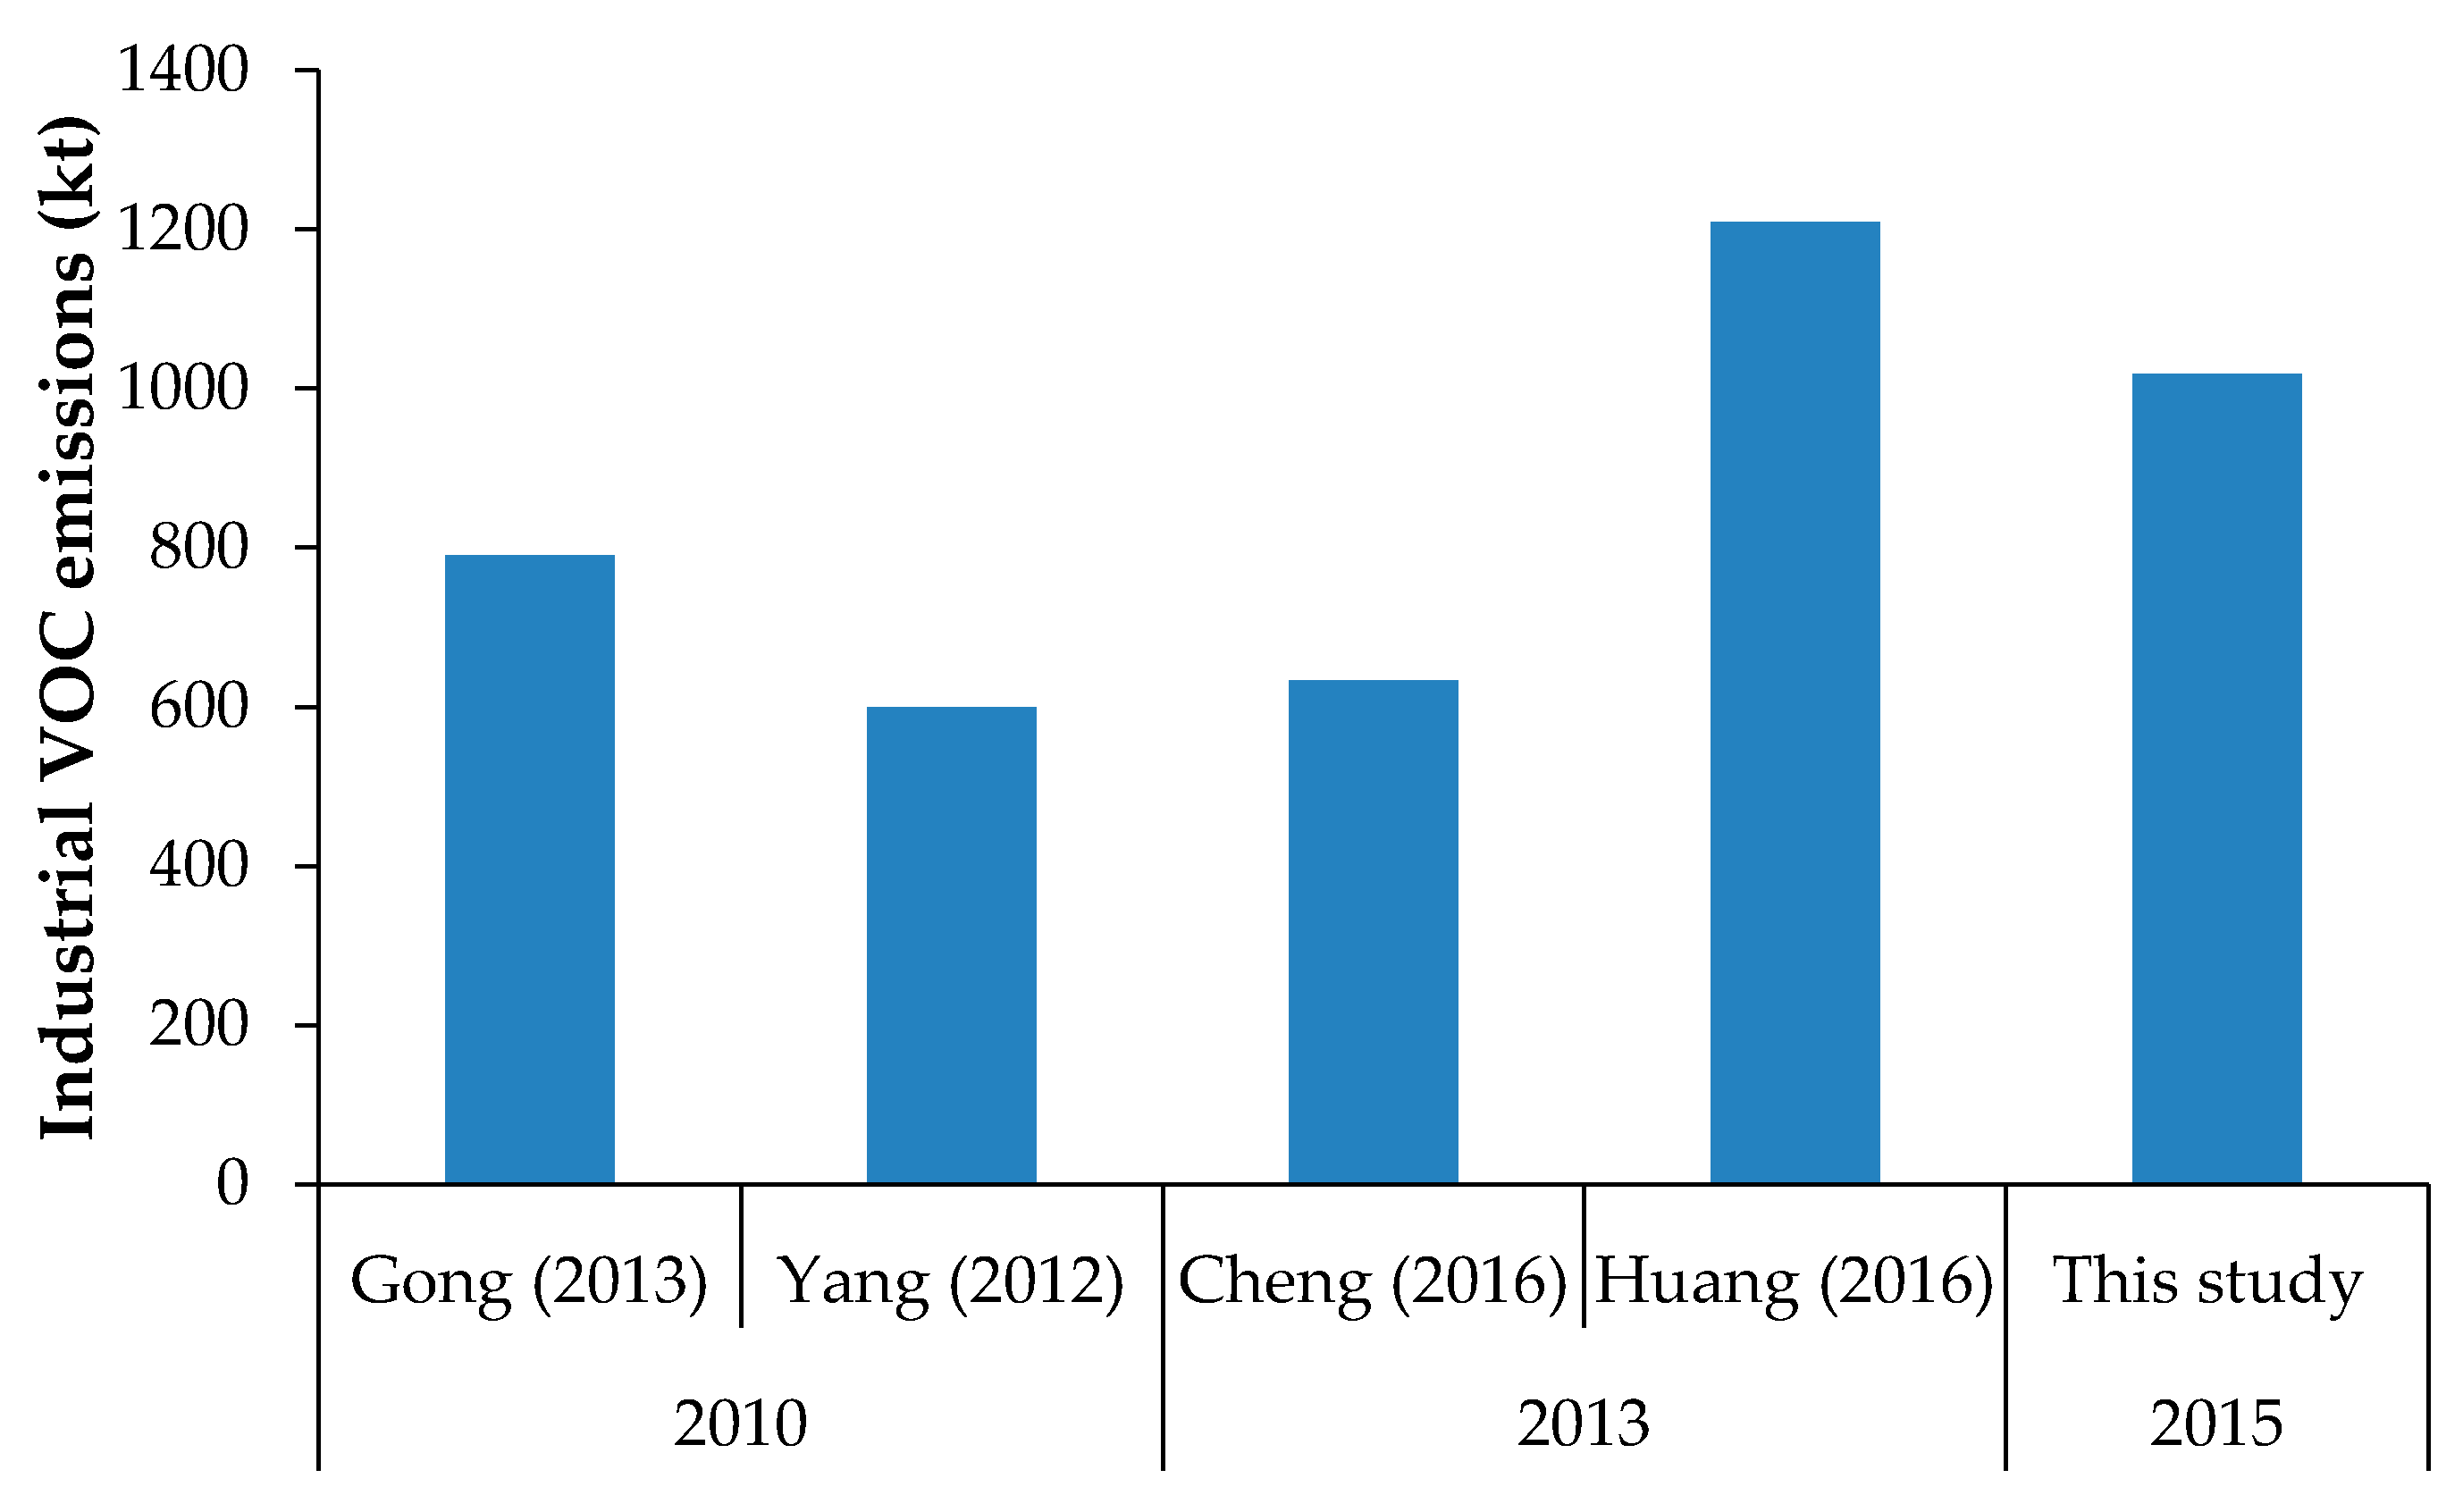
3.1. Industrial VOC Emission Inventory for 2015

The industrial VOC emissions in Hebei Province in 2015 were estimated by applying the methods described in Section 2, as shown in Table 6. The total industrial VOC emissions were 1017.795 Kt, of which the production of VOCs, the storage and transport, the industrial processes using VOCs as raw materials, and the use of VOC products accounted for 5.04%, 3.58%, 39.26%, and 52.12% of the total, respectively. Referring to the studies of Liang (2017) [56], Ye (2020) [57], and Zhang (2017) [58], the industrial VOC emissions in China were 13,389.4 Kt, 1435.6 Kt, and 10,762.9 Kt, respectively. Compared with these results, it could be concluded that the industrial VOC emissions in Hebei Province accounted for about 7–9% of the total emissions in China.
The industrial VOC emissions of Hebei Province calculated in prior studies from the past few years are summarized and compared in Figure 2. The estimated total industrial VOC emissions in this study were about 22.4–52.1% higher than those of Gong (2013) [4], Yang (2012) [26], and Cheng (2013) [45], and 18.8% lower than the results of Huang (2016) [5]. These differences may have been caused by the following: (1) The selection of activity data: activity data for 81 types of industrial sources were collected by Huang (2016) [5], and this study selected only 74 types, which caused Huang (2016) [5] to show higher emissions. For example, the crude oil processing volume in this study was considered to be activity data of petroleum refining based on technical guidelines, while the tank loss, transport loss, leakage loss, and volatile refining wastewater of Huang (2016) [5] were chosen according to references. (2) The interannual variation in activity levels: The VOC emission inventories of other studies were for periods 3–5 years earlier than that of this study. In fact, VOC emissions have been increasing yearly, owing to the increase in the scale and number of industrial enterprises in Hebei Province. (3) The selection of EFs: For crude oil exploration sources, 1.5275 g/kg crude oil in this study represented the VOC emission factor from crude oil exploration, rather than the 0.6 kg/t found by Yang (2012) [26] and Huang (2016) [5], due to the EF being derived from the latest officially published data, which was highly representative. (4) The determination of key industrial sources: Cheng (2013) [45] estimated the VOC emissions of eight key industries in Hebei Province in 2013, including the chemical medicine, coke production, organic chemical, packaging and printing, wood adhesives, industrial and construction dyes, furniture manufacturing, and crude oil processing industries. The total emissions found by Cheng (2013) [45] were 633.2 kt, while the corresponding emissions of the eight key industries in this study were found to be 677.8 kt. Therefore, the results of this study are reasonable and acceptable.

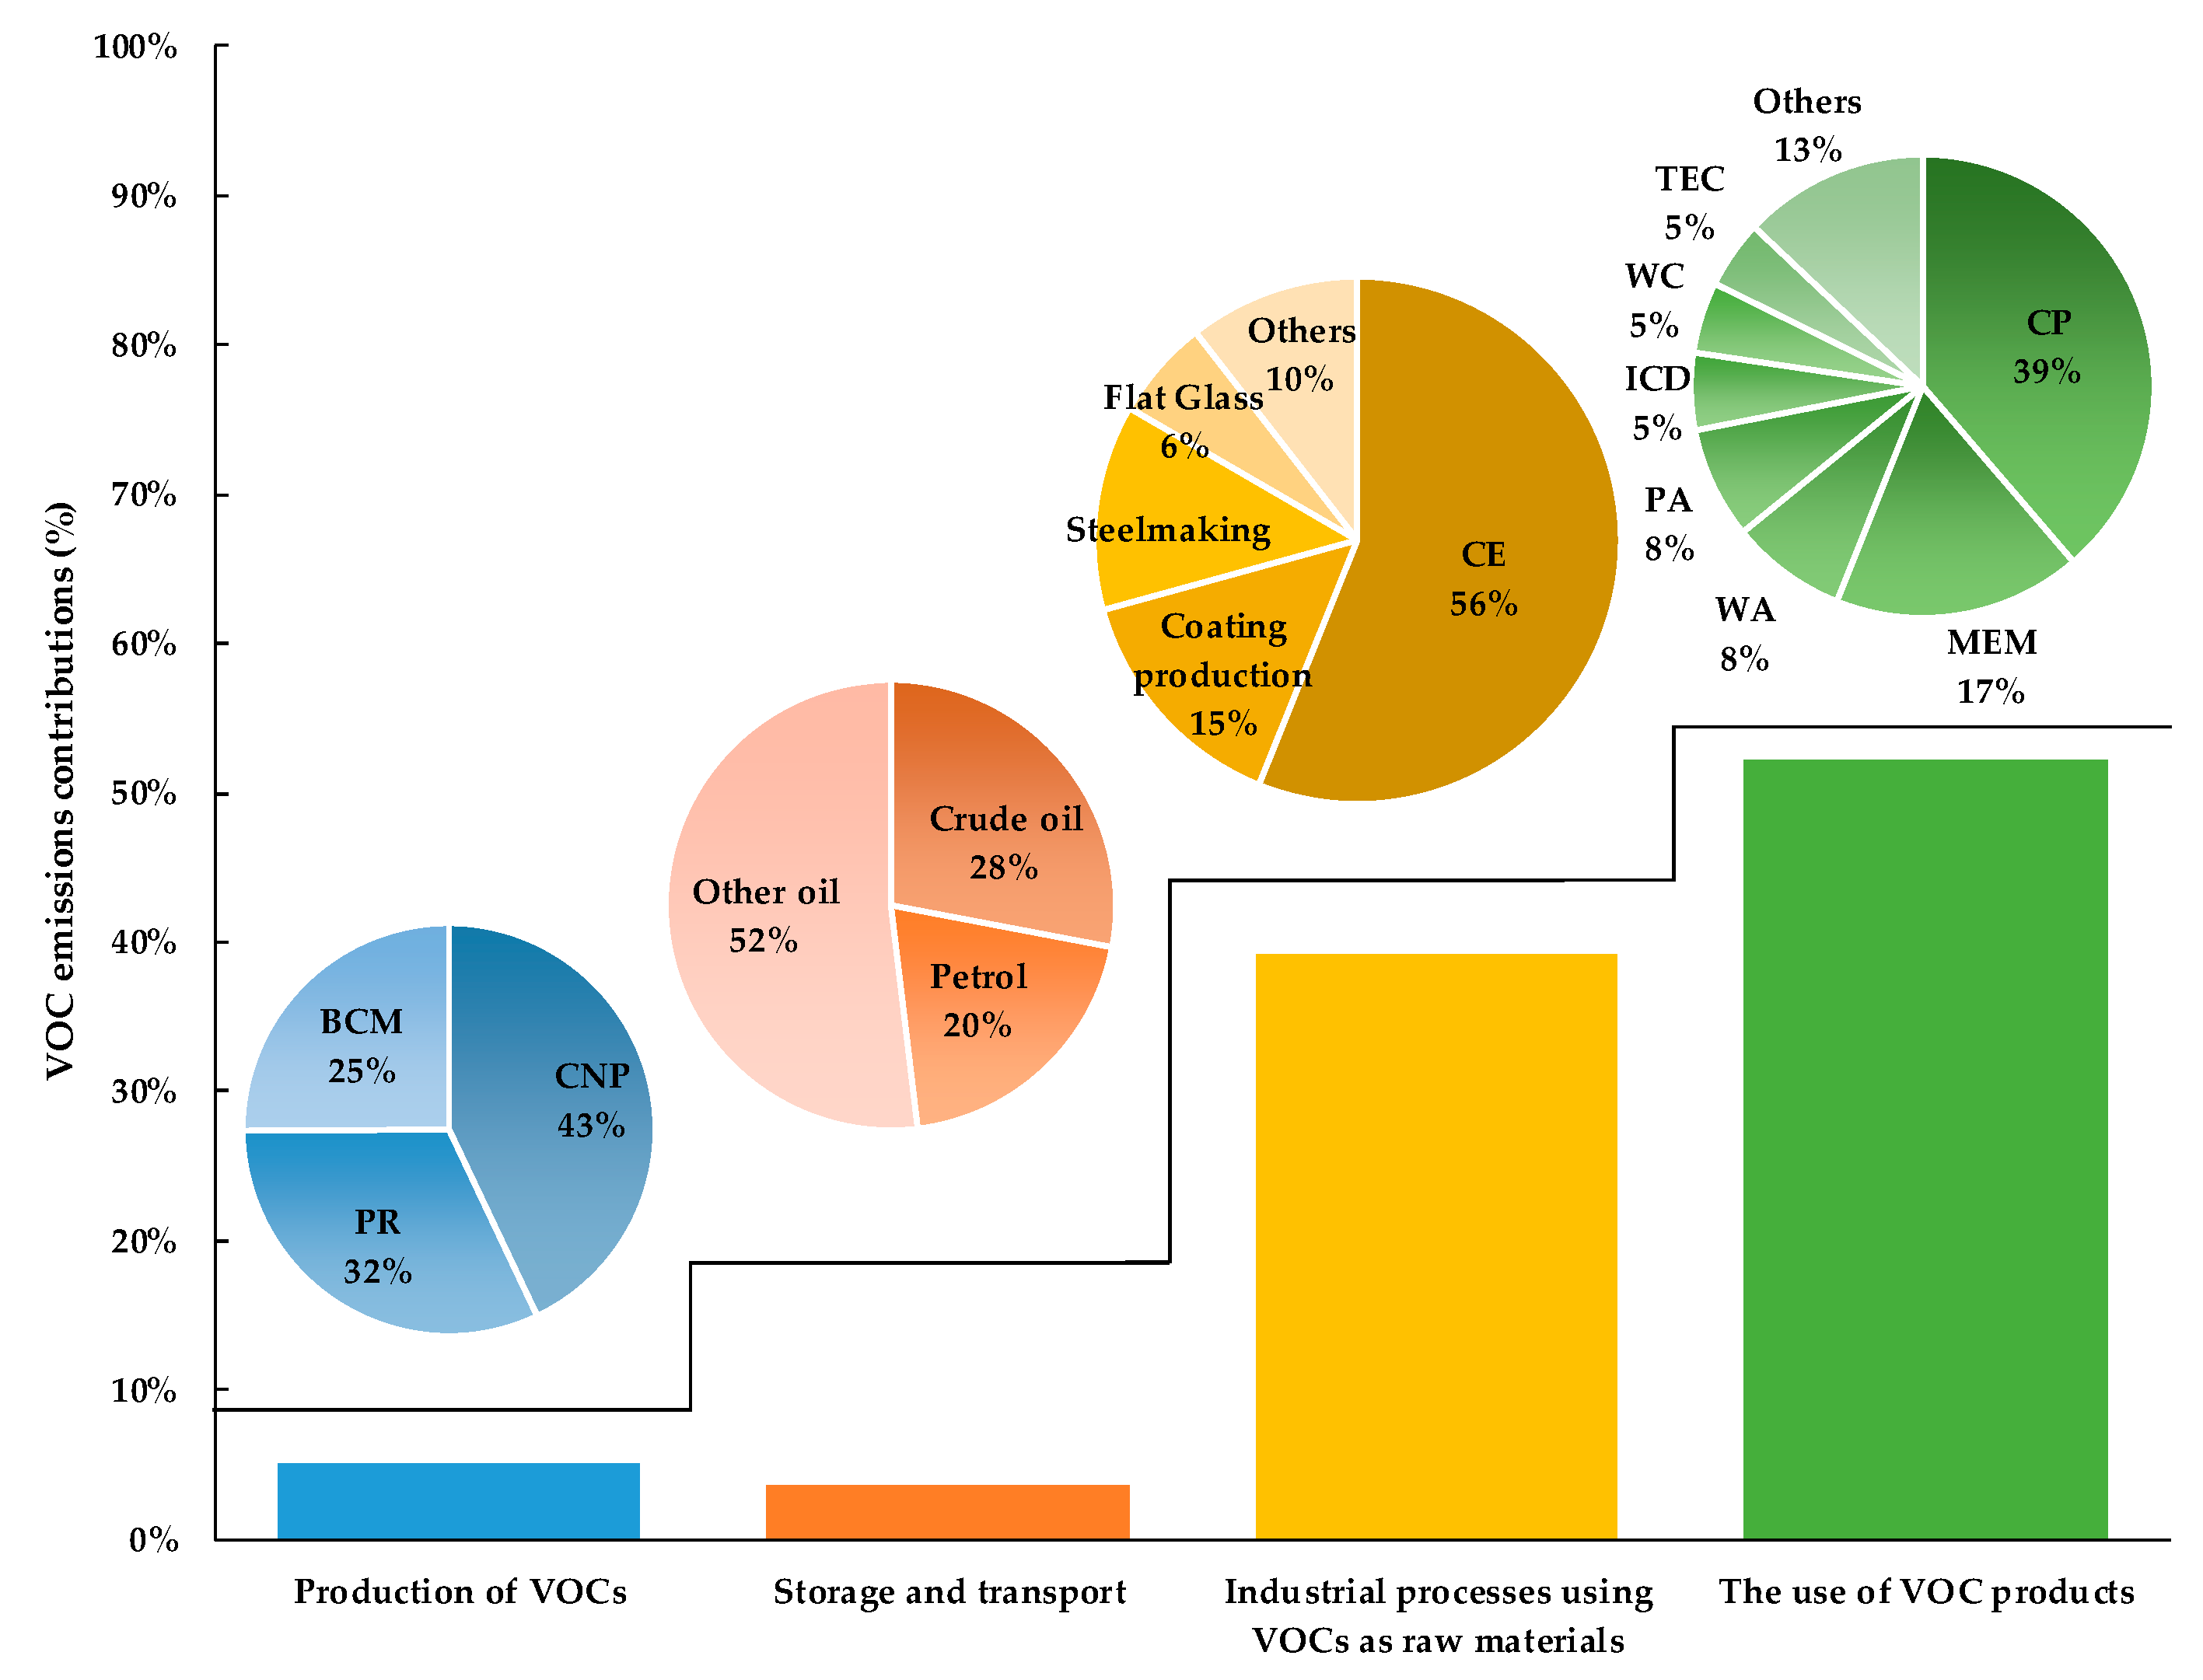
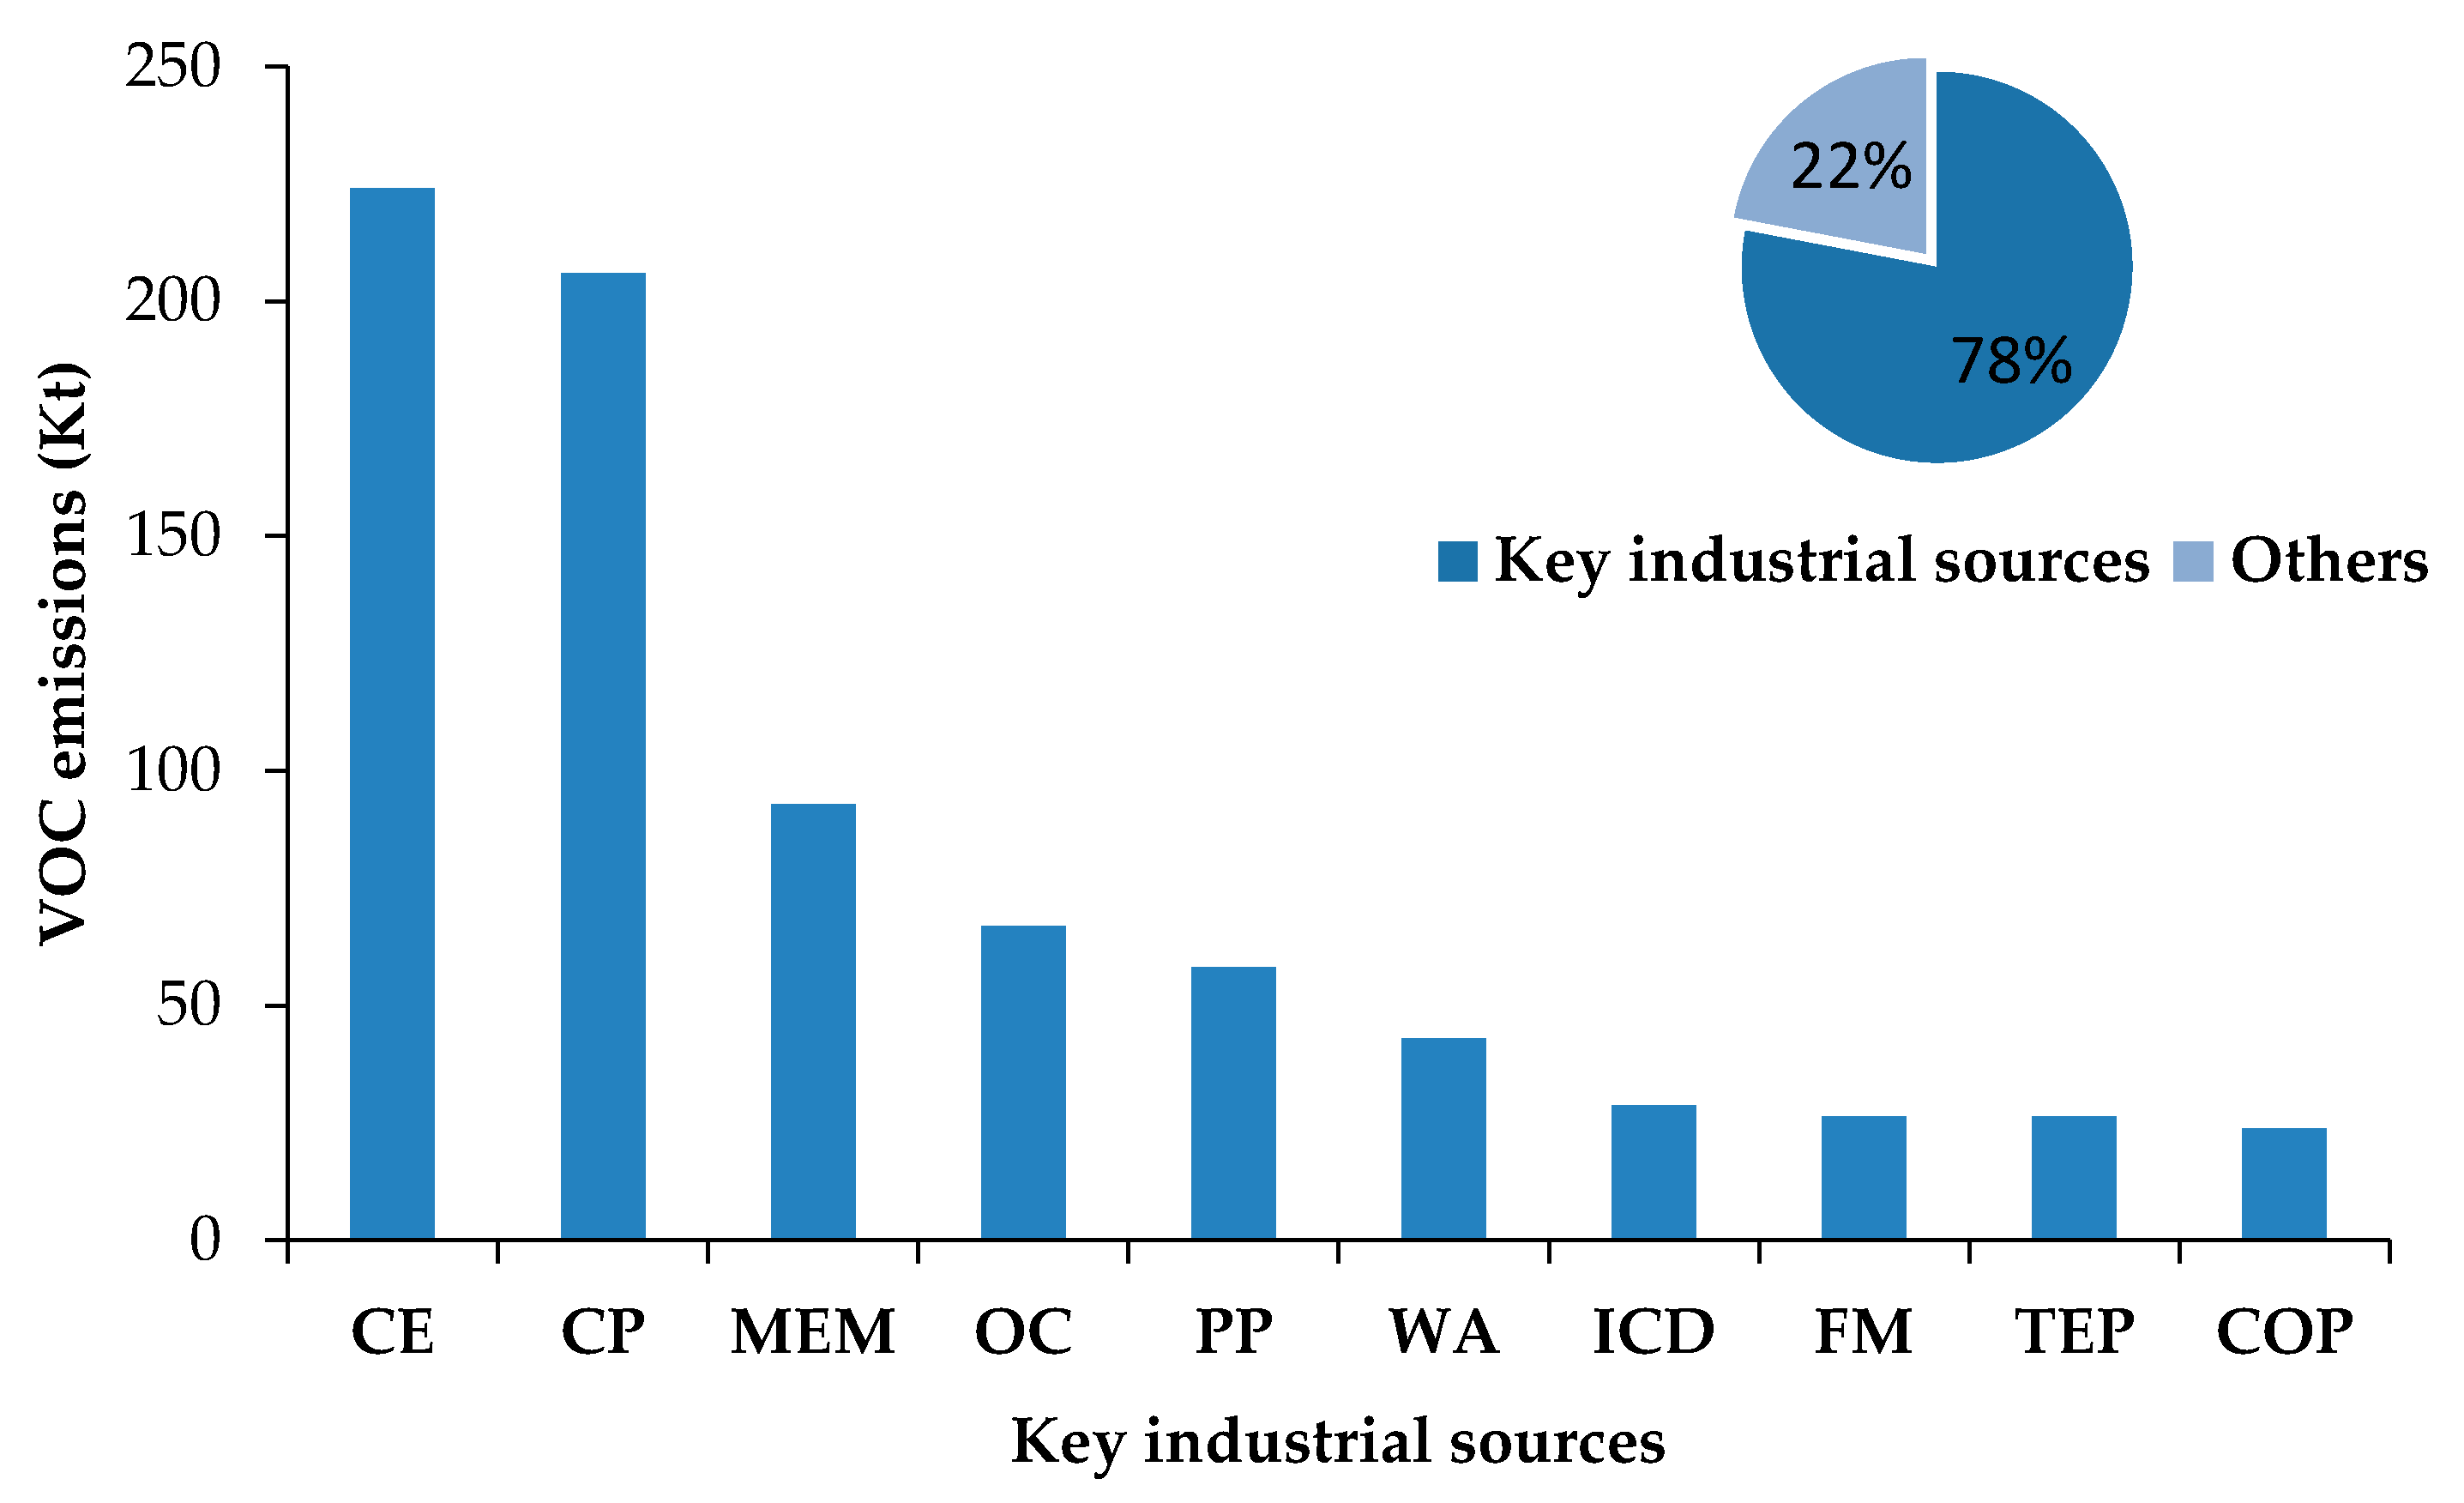
3.1.1. Emission Contributions by Source

The contributions of various sources to the total industrial VOC emissions in Hebei Province are illustrated in Figure 3. The use of VOC products was the largest contributor, due to the fact that it involves a wide range of emission sources, including emissions from 14 sectors. The main emission sectors from the use of VOC products were the coke production, mechanical equipment manufacturing coatings, wood adhesives, packing adhesive, and industrial and construction dyes industries, accounting for 38.85%, 17.53%, 8.13%, 7.83%, and 5.52% of the total emissions, respectively. As the second largest VOC contributor, the industrial processes of using VOCs as raw materials has VOC emissions of 399.582 Kt, in which the chemical medicine, coating production, steelmaking, and other industries accounted for 56.09%, 14.65%, 12.64%, and 16.62% of the emissions, respectively. Crude oil and ammonia production accounted for 46.58% and 25.23% of the production of VOCs, respectively. In terms of storage and transport, the lowest emitter sources—other oil, crude oil, and petrol storage and transportation—accounted for 51.88%, 27.98% and 20.09% of all emissions, respectively.
It could be concluded that there is a large difference in VOC emissions between the contributions from different industrial sectors. Therefore, we summarized the key industrial sources of VOCs emissions in Hebei Province for further analysis, as illustrated in Figure 4. In this study, the phrase “key industrial sources” refers to the top ten sources of industrial VOC emissions in Hebei Province, including the chemical medicine, coke production, mechanical equipment manufacturing, organic chemical, packaging and printing, wood adhesives, industrial and construction dyes, furniture manufacturing, transportation equipment manufacturing, and crude oil processing industries. The emissions from these ten sectors were estimated at 796.8 Kt, accounting for 78% of the total. Thus, it is necessary for national and local government policymakers to focus on strengthening the governance of key industries during the specific formulation of industrial VOC emission reduction policies.
The two largest sources of emissions were the chemical medicine (224.1 kt) and coke production (206.1 kt) industries, accounting for 53% of the total emissions. This may be due to the relatively rapid development of these two sectors in Hebei Province in recent years. The sectors with VOC emissions between 50 and 100 kt included the machinery equipment manufacturing (93.0 kt), organic chemicals (67.0 kt), and packaging and printing industries (58.2 kt), accounting for 9%, 7%, and 6% of the total emissions, respectively.

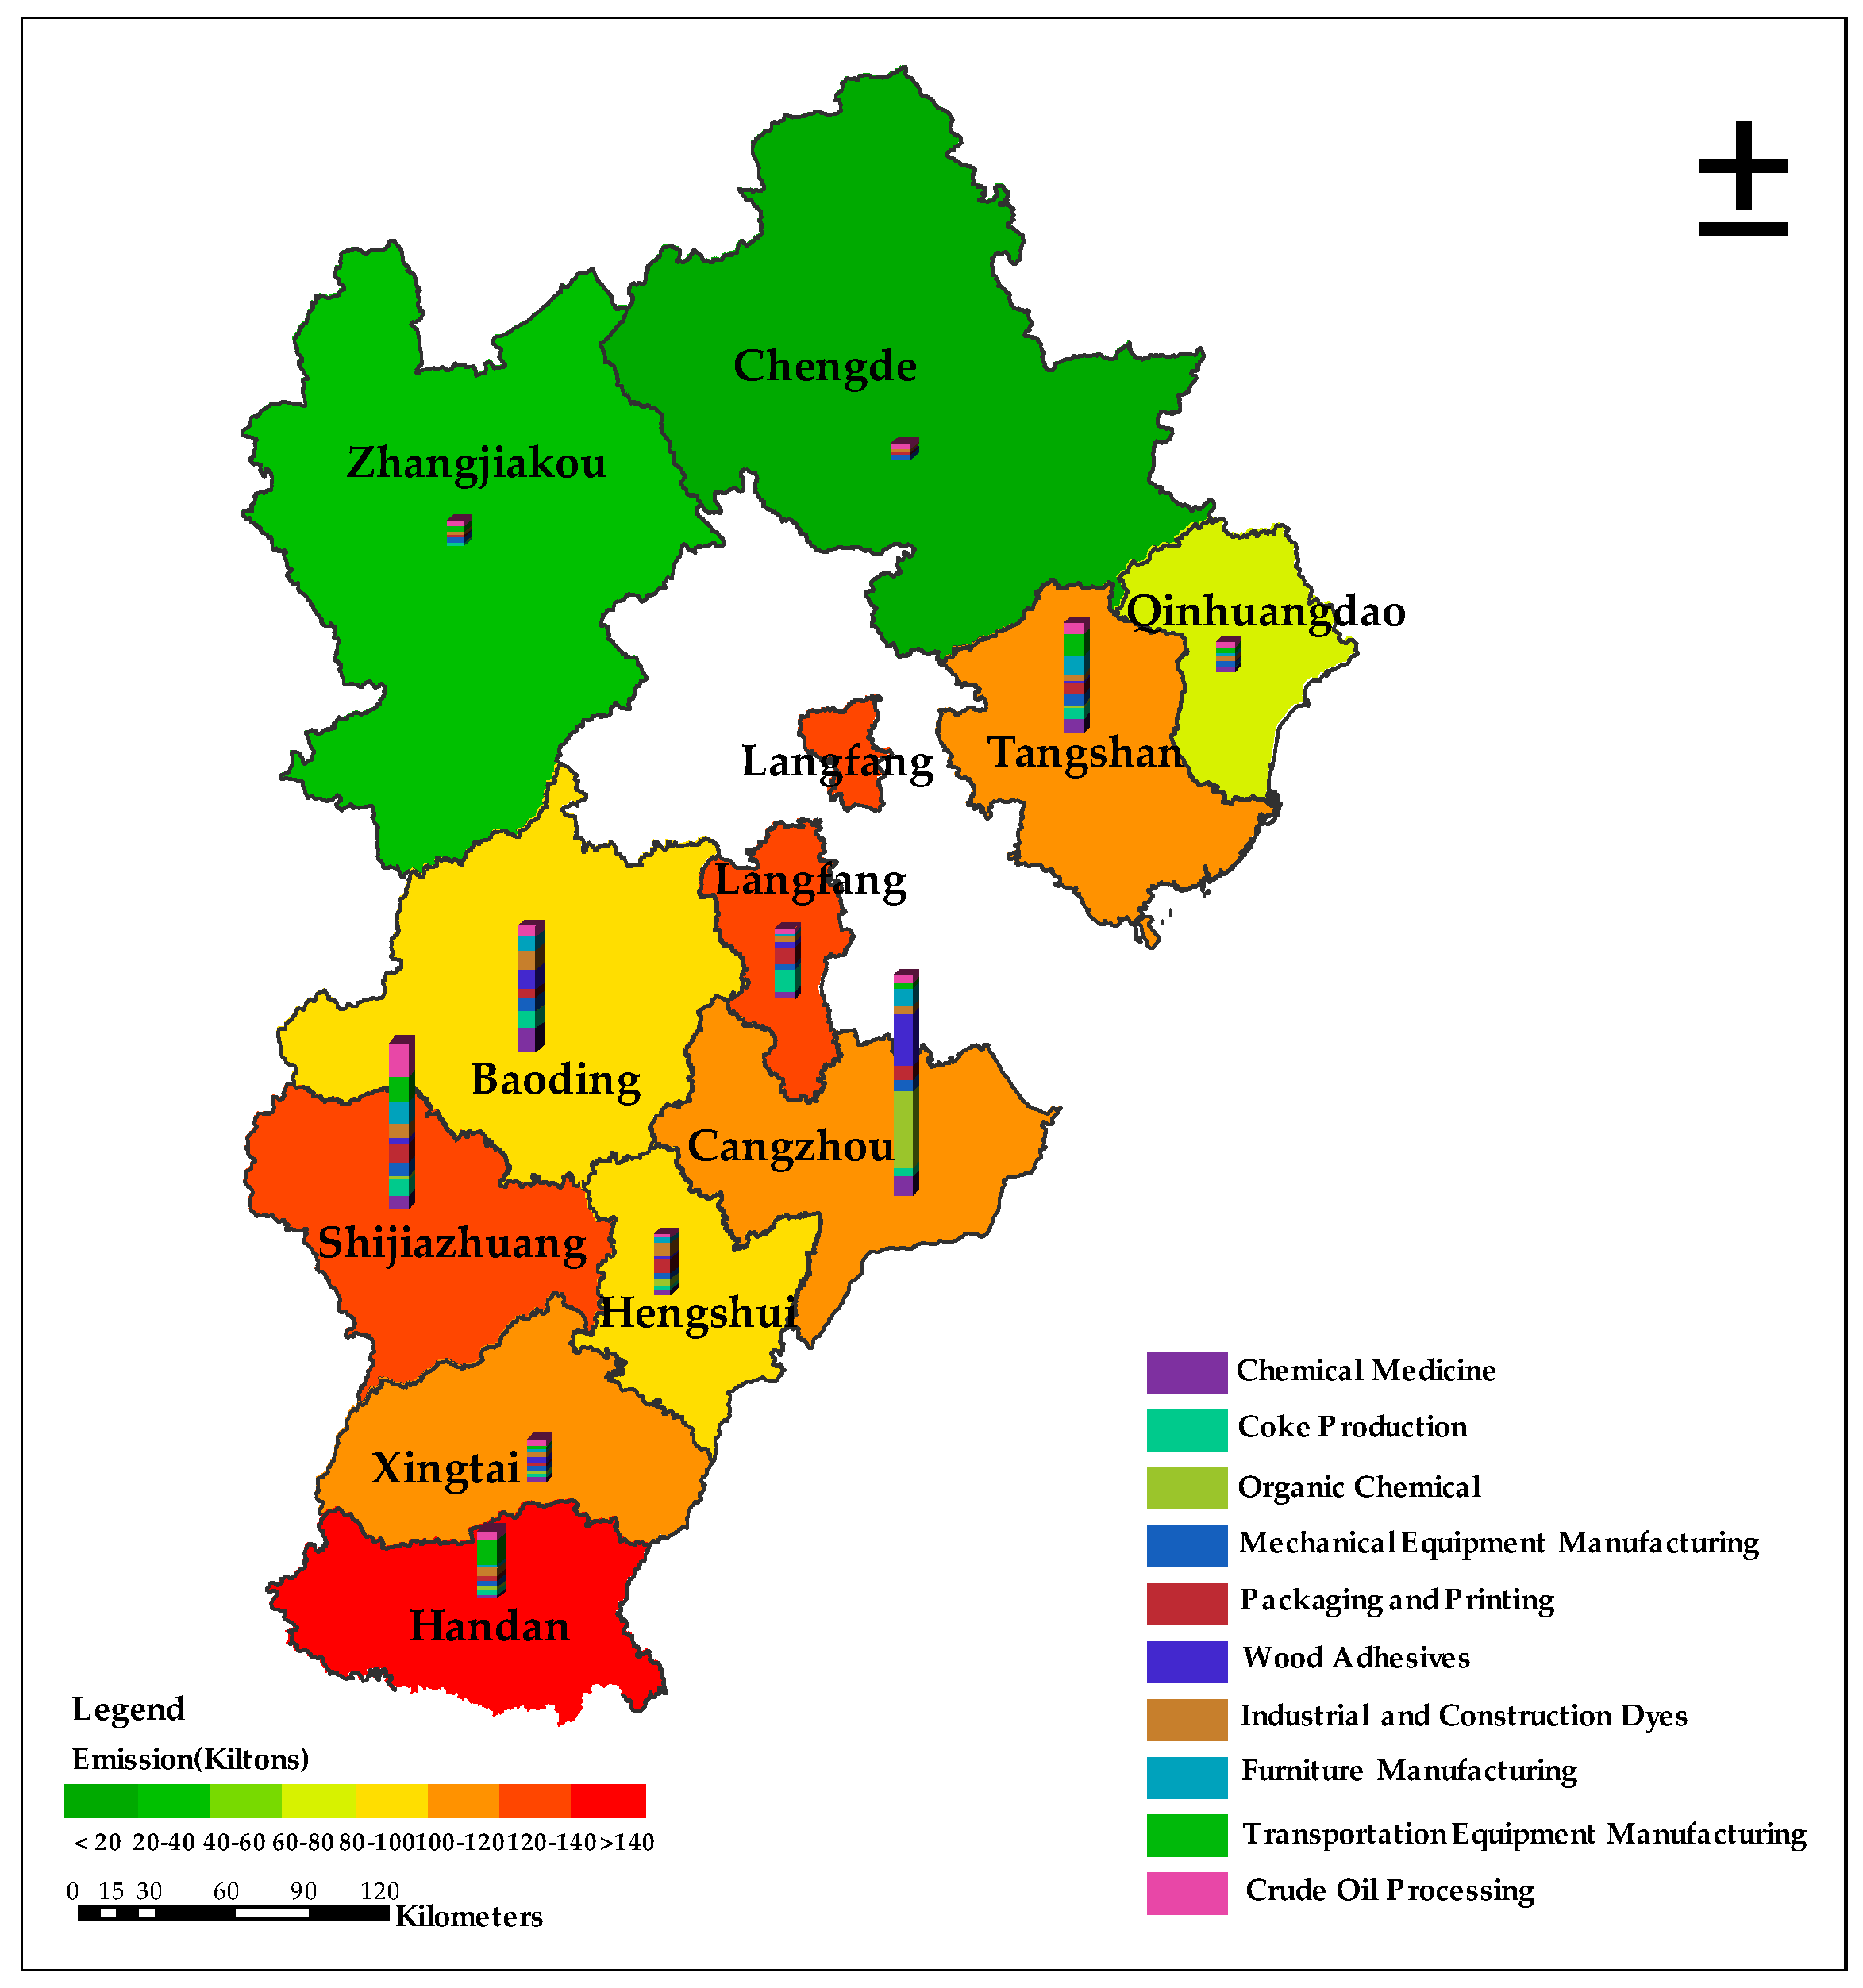
3.1.2. Spatial Distribution of Industrial VOC Emissions

The spatial distribution of industrial VOC emissions in the Hebei Province for 2015 is shown in Figure 5. Based on the industrial GDP and population density information, the VOC emissions were allocated to each city in Hebei Province using ArcGIS10.2. It can be seen from Figure 5 that the distribution of industrial VOCs in Hebei Province is spatially uneven and generally shows the characteristics of lower emissions in the north and higher emissions in the south. To further examine the characteristics of the spatial distribution of VOC emissions, we calculated the spatial autocorrelation using the global Moran’s I index putted forward by Patrick Alfred Pierce Moran [59]. The results showed that Moran’s I index is 0.5 > 0 (p < 0.01), which indicates that there is a stronger positive spatial correlation of industry VOC emissions in Hebei Province. That is to say that cities with high (or low) values of VOC emissions often had nearby cities with high (or low) values in Hebei Province, presenting a clear clustering characteristic. The industrial VOC emissions are mainly concentrated on the industrially developed, densely populated cities, such as Handan, Shijiazhuang, and Langfang. In particular, Handan, located in the southern area, was the largest VOC emitter due to its developed coking industry and pharmaceutical enterprises. The distinctive emission characteristics may be attributed to the large differences in geography, industry, economy, and population among different cities.
From the perspective of the spatial distribution of VOC emissions from key industries, the emissions of the chemical medicine sector are concentrated in Shijiazhuang, Baoding, Xingtai, Handan, and Tangshan, owing to the fact that most of the pharmaceutical companies are located in this area. In addition, more than 90% of the coking enterprises in Hebei Province are distributed in Tangshan, Handan, and Xingtai, which has caused the coke production in these cities to emit a large amount of VOCs. Similarly, Machinery and equipment manufacturers are mainly distributed at Cangzhou, Baoding, Tangshan, and Shijiazhuang. Moreover, there are more than 330 organic chemical enterprises in Hebei Province, located in Baoding (26%), Shijiazhuang (18%), Hengshui (14%), and Cangzhou (13%). For packaging and printing enterprises, the distribution is largely concentrated in the Shijiazhuang, Langfang, Baoding, and Tangshan areas. However, there is still a considerable number of small and micro factories that are widely scattered across the province, making it difficult to carry out environmental supervision. Therefore, more attention should be paid to the management of industrial enterprises in central and southern Hebei Province, strengthening technological innovation to increase production capacity, and rectifying small- and medium-sized backward production capacity enterprises.

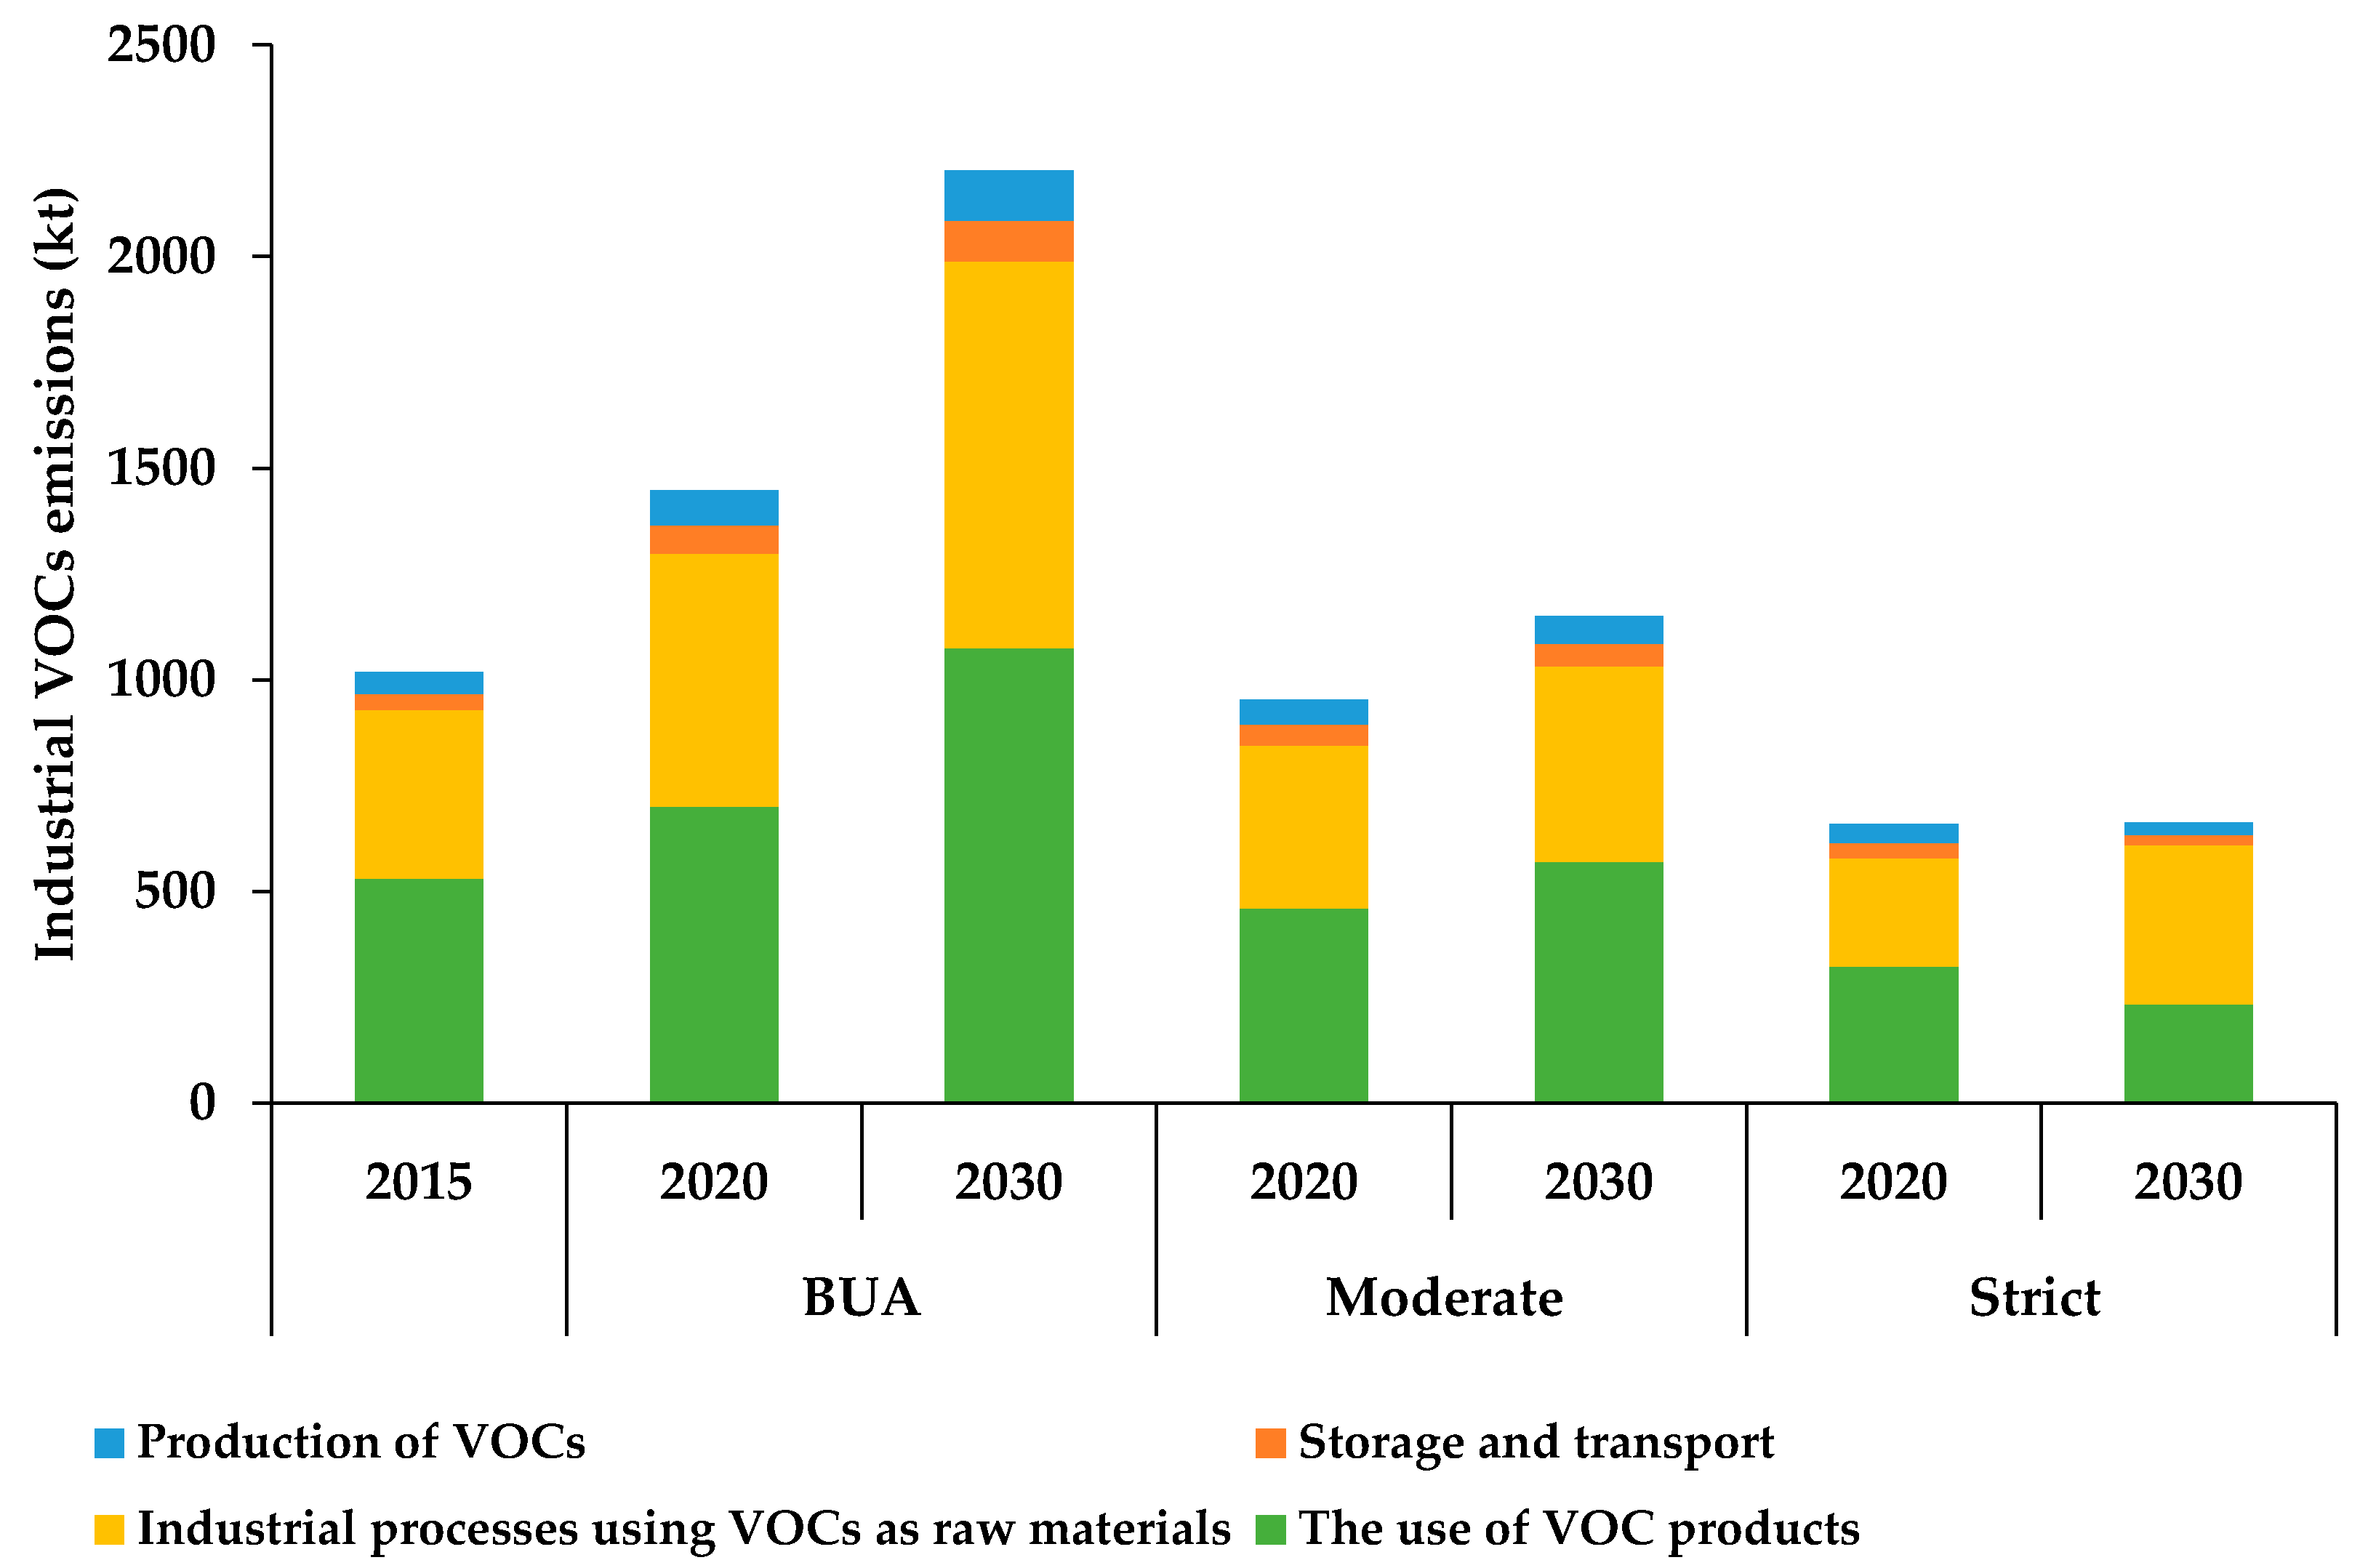
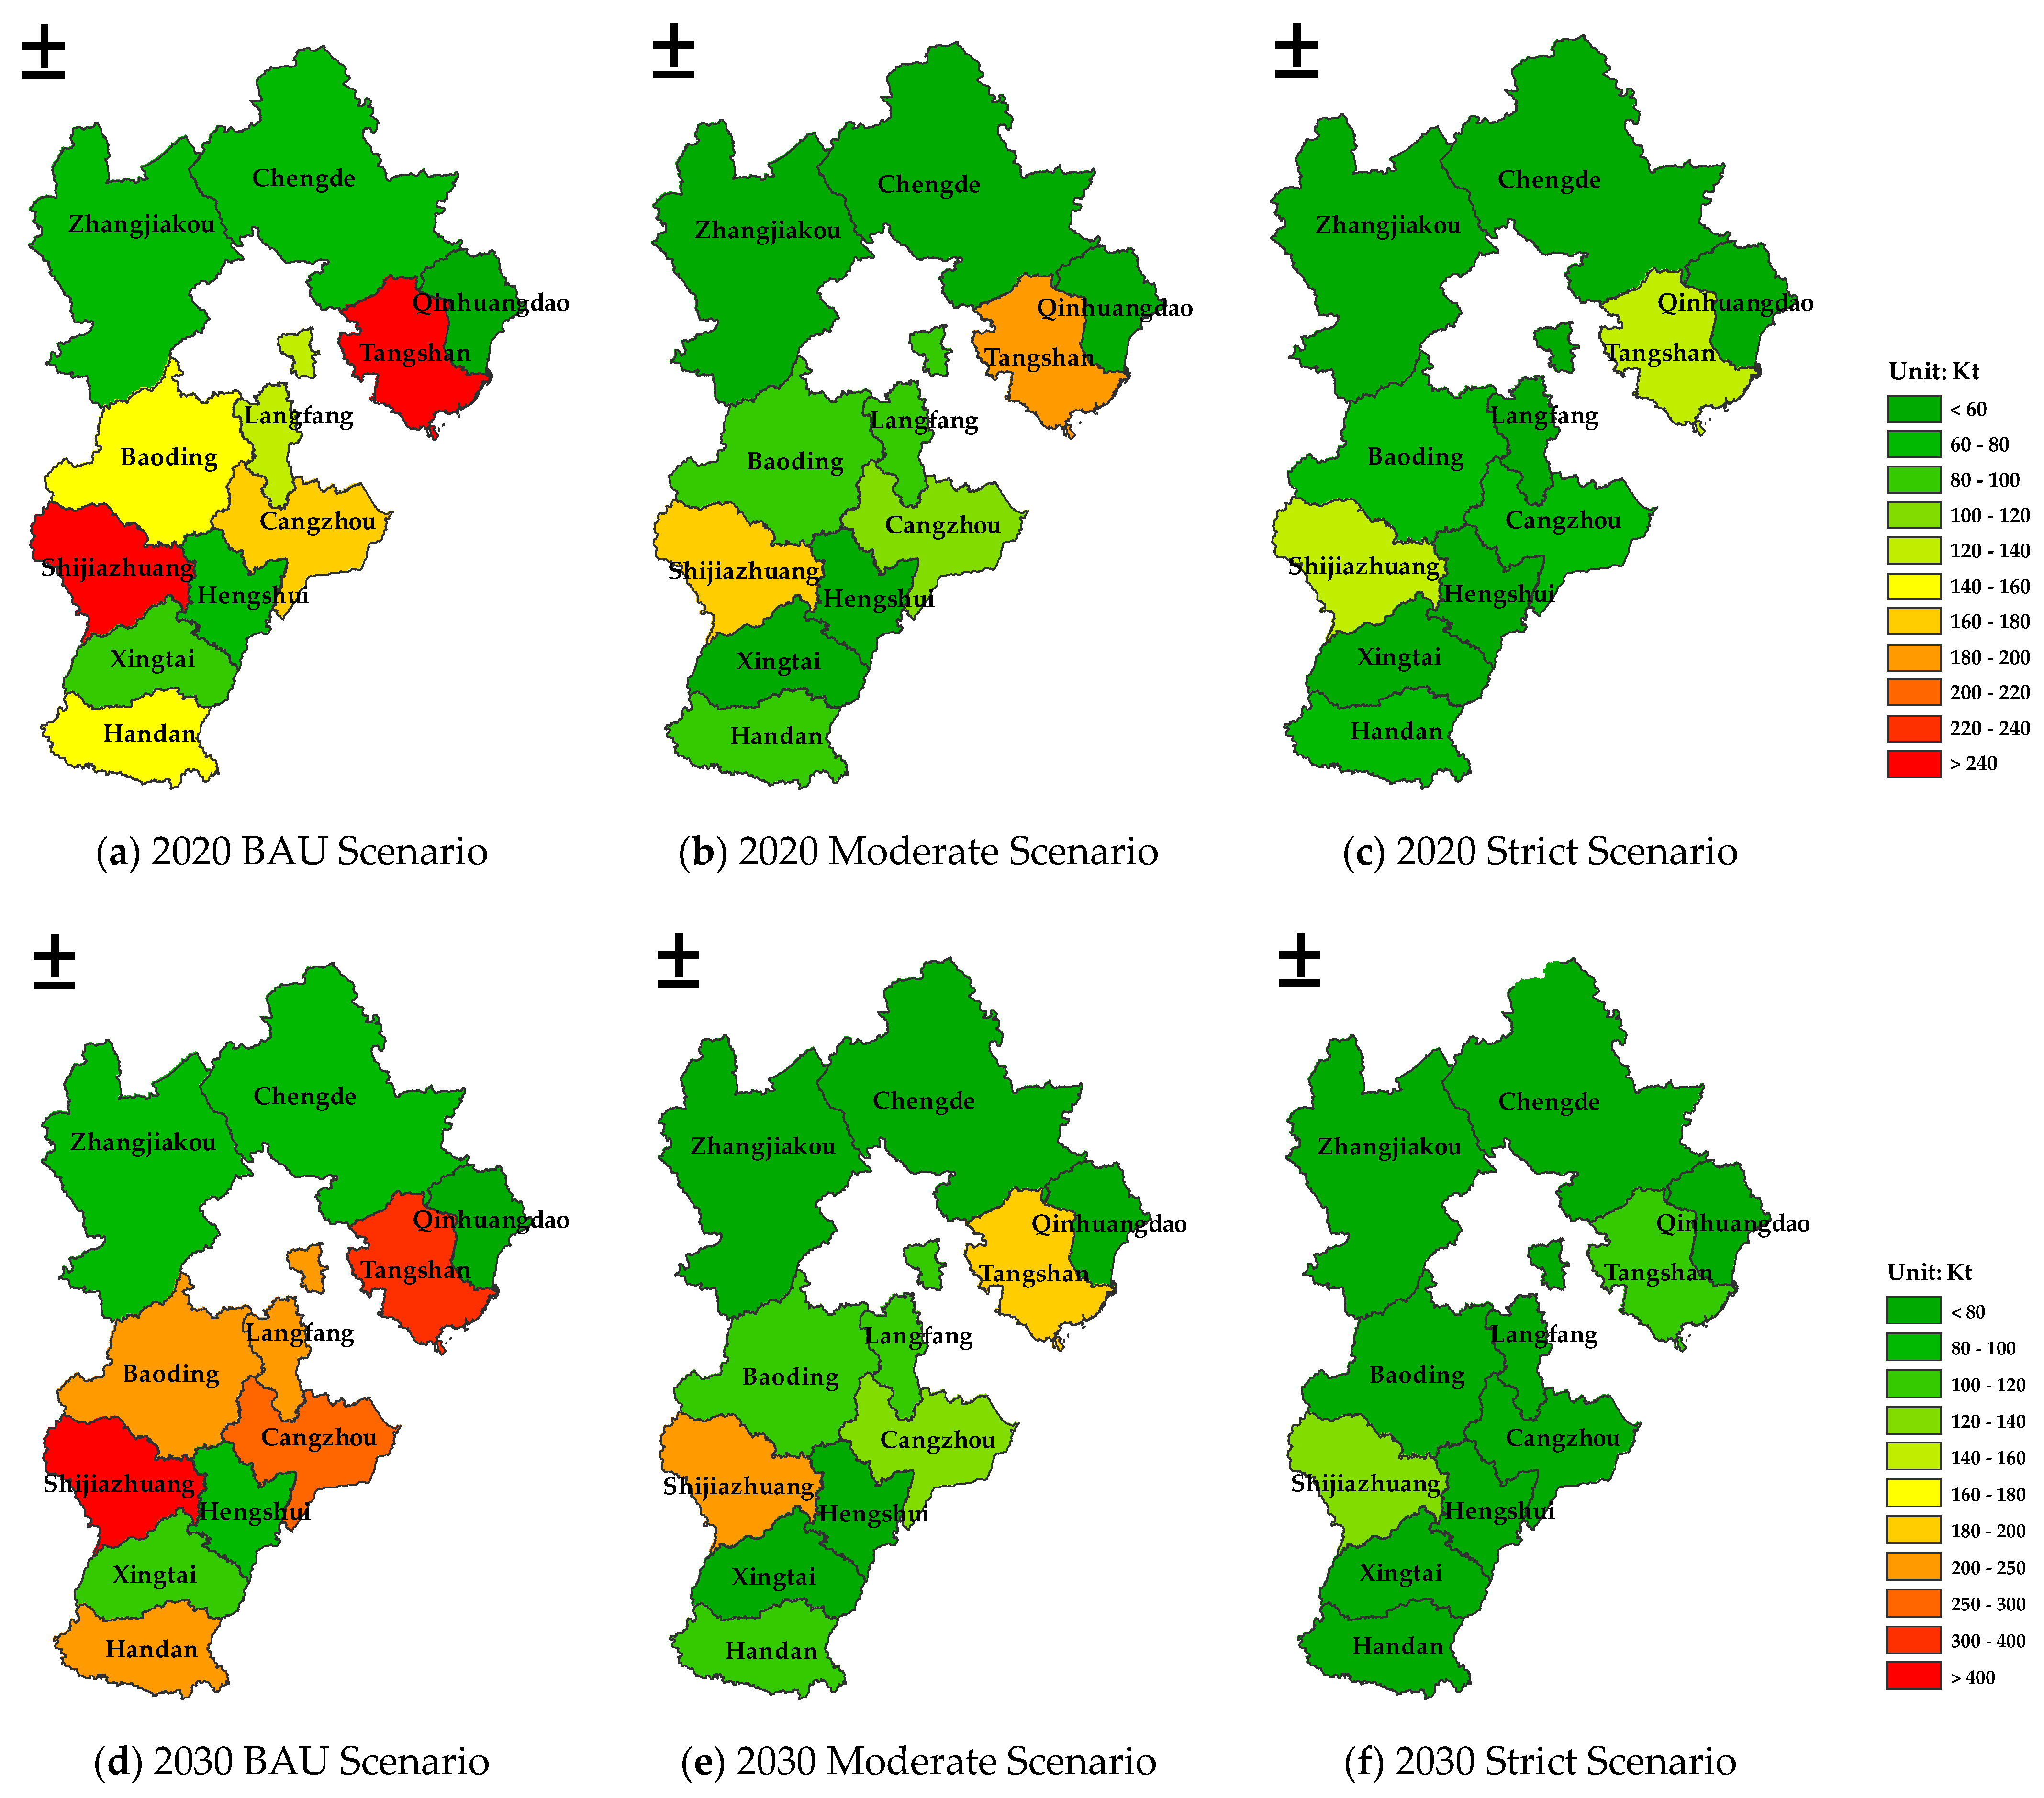
3.2. Scenario Prediction of Industrial VOC Emissions in 2020 and 2030

The trends of industrial VOC emissions and their sectoral distributions in the period 2015–2030 under different scenarios are given in Figure 6. There is an evident difference in emission trends across the three scenarios. Under the BAU scenario, the predicted total VOC emissions in Hebei Province would continue to increase with an average annual growth rate of 10.24%. The predicted total industrial VOC emissions in 2020 and 2030 under the BAU scenario are 1448.95 Kt and 2203.66 Kt, 53.36% and 116.51% higher than those in 2015, respectively. The use of VOC products, one of the most major sources of emissions, contributed greatly to this increasing trend. Moreover, the industrial VOCs emissions gradually increased during the period 2020–2030 under the moderate and strict scenarios, with a relatively lower growth rate than that in the BAU scenario. However, the total VOC emissions could be reduced by as much as 34.15% (494.78 kt) and 47.77% (1052.72 kt) by 2020 and 2030 compared with the BAU scenario, owing to the VOC emission reductions from key industrial sectors. Similarly, for the strict scenario, a greater reduction in total VOCs emissions would be achieved, with a fall of 54.45% (788.99 kt) and 69.89% (1551.29 kt) in 2020 and 2030 relative to the BAU scenario, attributed to the realization of maximum abatement potential from all industrial sectors (100%) adopting the best available control technologies and clean production.
Figure 6 also shows the reduction in VOC emissions from different industrial sectors under the different scenarios. A significant emission abatement would be achieved with the use of VOC products for all scenarios, with the exception of the strict scenario in 2030, where the emissions from industrial processes using VOCs as raw materials were greater. These two large sources collectively accounted for 87.63–89.63% and 89.73–91.97% of the total under the moderate and strict scenarios in 2020 and 2030, respectively.
Figure 7 shows the emission reductions in different cities in Hebei Province under different scenarios. Due to the unbalanced regional economic developments existing in Hebei Province, the VOC emissions projected among the 11 cities showed large differences during the period 2015–2030. These projections revealed that Shijiazhuang and Tangshan were and will continue to be the largest contributors under the BAU scenario. These two cities located in the central and southern areas are developed regions with high population densities and high GDPs. On the contrary, Zhangjiakou, Chengde, and Qinhuangdao, located in the northern area with sparse populations and slow economic growth, have relatively low emissions and growth trends. These results prove that VOC emissions will be out of control if VOC emissions are not governed immediately. A significant decrease occurred in the moderate and strict scenarios. Moreover, relatively high values of reduction were projected in cities that are major contributors to total emissions, and relatively low values were projected in cities with the more minor contributions. Therefore, it can be concluded that the measures defined in both scenarios appear to be effective in reducing industrial VOC emissions.
We tried to compare our results with the actual value in 2020 to ensure the rationality of the prediction results in this study. However, due to the fact that official statistical data are generally published one to two years later in China, we failed to find the actual results for 2020. Nevertheless, we found the latest results of the MEIC (Multi-resolution Emission Inventory of China) [60] developed by Tsinghua University, which is currently recognized as academically credible data in China. The results show that the industrial VOC emissions found for Hebei Province in 2017 in this study (974 Kt) were about 2% lower than those of MEIC (996 Kt). Therefore, it could be concluded that our prediction is reasonable. Moreover, we looked up the latest national policies on VOC control to analyze the rationality of the defined scenario in this study. The Ministry of Ecology and Environment (MEE) issued the Comprehensive Treatment Plan for Volatile Organic Compounds in Key Industries [61] in July 2019, which clearly specified that the petrochemical, chemical, industrial painting, packaging and printing, oil storage, and marketing industries are the key VOC emission sources in China. Additionally, Hebei province is defined one of the key regions of industrial VOC control in China. The present policies demonstrated that the moderate scenario in this study is more realistic.

3.3. Uncertainty Analysis

Uncertainties are unavoidable during the estimation of pollutant emissions in different scenarios generated from both activity data and emission factors. Moreover, some factors, including the degree of VOC removal by existing pollution control technologies [3], also affected the accuracy of the results in this study. The uncertainties of industrial VOC emissions in Hebei Province in 2015 were quantified by the Monte Carlo simulation method, assuming that both the activity data and emission factors obeyed lognormal distributions [51,62]. In addition, before applying the Monte Carlo simulation, the coefficients of variation (CV, the standard deviation divided by the mean) of the activity data and emission factors were determined according to the different sources of data [63]. With regard to the data from the Statistical Yearbook, the uncertainty was set as ±30% [64], which means that these statistical data have relatively less errors than the emission factors and are very reliable for emission estimation at the national and provincial levels [19]. For the data from association statistics obtained by assigning the coefficient, the uncertainty was set as ±80% or ±100% [64,65]. Based on the assumption above, the estimated range of uncertainty of VOC emissions for each sector with a 95% confidence interval is shown Table 7. It was found that the biggest uncertainty ranges for the use of VOC products were between −63% and 90%, while those for storage and transport, industrial processes using VOCs as raw materials, and the production of VOCs were −57%–85%, −39%–67%, and −38%–59%, respectively. Although the predicted results might deviate from the real situation, the values were within a reasonable range.

4. Conclusions

This study attempted to predict the emissions and mitigation potentials of industrial VOCs under different scenarios based on the industrial VOC emission inventory for Hebei Province established in 2015. We intended to provide optimized strategies for Hebei’s VOC emission abatement policy in future years.
The total industrial VOC emissions were estimated to be 1017.795 Kt, with approximately 52.12% and 39.26% originating from the use of VOC products and the industrial processes using VOCs as raw materials, with relatively low proportions of 5.04% and 3.58% caused by the production of VOCs and storage and transport, respectively. The ten largest contributors of VOC emissions in Hebei Province were the chemical medicine, coke production, mechanical equipment manufacturing, organic chemical, packaging and printing, wood adhesives, industrial and construction dyes, furniture manufacturing, transportation equipment manufacturing, and crude oil processing industries, which emitted 796.8 kt VOCs collectively, accounting for 78% of the total. Therefore, these ten sectors should be regarded as the focus for reducing VOC emissions. Moreover, the industrial VOC emissions in Hebei Province were mainly concentrated in the south-central region, with its well-developed industry and large population density, especially Shijiazhuang and Tangshan.
Under the BAU scenario, the total VOC emissions in 2020 and 2030 would increase by 53.36% and 116.51% compared to 2015, respectively. The use of VOC products would continue to dominate the VOC emissions in the future, but the proportion would decrease from 52% in 2015 to 49% in 2030. The share of the second-largest VOC emission source, the industrial processes using VOCs as raw materials, would increase from 39% in 2015 to 52% in 2030.
Compared with the BAU scenario, the total emission reduction from VOCs during the period 2020–2030 was estimated as 494.78–1052.72 kt and 788.99–1551.29 kt under the moderate and strict scenarios, with reduction ratios of 34.15–47.77% and 54.45–69.89%, respectively. Overall, the use of VOC products had the biggest mitigation potential of 78% under the strict scenario in 2030, while other industrial sources would be reduced by 59%–76%. These three scenarios pointed out the reasonable range of future VOC emissions and provided the maximum potential of industrial VOC emissions, which could provide scientific support and significant information to policymakers attempting to establish a complete VOC management system.
According to the above results, it is recommended that measures to control VOC pollution from key industrial sources should be adopted, as they could bring about a considerable reduction. Generally, there are three ways to reduce VOC emissions. The abatement of VOC emissions from industrial sources and processes has always been the most critical aspect of controlling emissions. The strict control of VOC emissions from storage, loading, and unloading processes, including the application of pressure tanks and floating roof tanks instead of fixed roof tanks, is necessary. Implementing exhaust gas collection measures and improving the collection efficiency should be considered to reduce the disorganized and fugitive emissions of exhaust gases. In addition, end-of-pipe governance measures should also be encouraged. It is appropriate for heavy sources of pollution to prioritize the use of condensation and adsorption recovery technologies for recycling. Furthermore, it is necessary to enhance the effectiveness of VOC governance through technological upgrading and innovation. Finally, an integrated VOC management and technology system should be determined specifically according to the emission features of different industrial sectors.

Author Contributions

Conceptualization, X.G. and Y.S.; methodology, X.G.; validation, D.C.; formal analysis, Y.S. and W.L.; investigation, W.L.; data curation, W.L. and J.L.; writing—original draft preparation, Y.S.; writing—review and editing, X.G. and D.C. All authors have read and agreed to the published version of the manuscript.

Funding

This research was funded by the National Key R&D Program of China (No. 2018YFC0213202).

Acknowledgments

This paper represents the perspectives of the authors and does not necessarily represent the official views of our sponsors. We would like to thank the anonymous reviewers for their valuable comments and suggestions to improve the manuscript.

Conflicts of Interest

The authors declare no conflict of interest.

References

  1. Atkinson, R.; Arey, J. Atmospheric Degradation of Volatile Organic Compounds. Chem. Rev. 2003, 103, 4605–4638. [Google Scholar] [CrossRef] [PubMed]
  2. International Agency for Research on Cancer. IARC Monographs on the Evaluation of Carcinogenic Risks to Humans; IARC: Lyon, France, 2018; Volume 120. [Google Scholar]
  3. Zheng, C.H.; Shen, J.L.; Zhang, Y.X.; Huang, W.W.; Zhu, X.B.; Wu, X.C.; Chen, L.H.; Gao, X.; Cen, K.F. Quantitative assessment of industrial VOC emissions in China: Historical trend, spatial distribution, uncertainties, and projection. Atmos. Environ. 2017, 150, 116–125. [Google Scholar] [CrossRef]
  4. Gong, F. Anthropogenic Volatile Organic Compounds Emission Inventory and Characteristics. Master’s Thesis, Xi’an University of Architecture and Technology, Xi’an, China, May 2013. (In Chinese). [Google Scholar]
  5. Huang, W.W. Characteristics of Industrial VOCs Emissions and Evaluation of Control Technology in China. Master’s Thesis, Zhejiang University, Zhejiang, China, March 2016. (In Chinese). [Google Scholar]
  6. Piccot, S.D.; Watson, J.J.; Jones, J.W. A global inventory of volatile organic compound emissions from anthropogenic sources. J. Geophys. Res. 1992, 97, 9897–9912. [Google Scholar] [CrossRef]
  7. Rajabi, H. Hadi Mosleh, M.; Mandal, P.; Lea-Langton, A.; Sedighi, M. Emissions of volatile organic compounds from crude oil processing—Global emission inventory and environmental release. Sci. Total Environ. 2020, 727, 138654. [Google Scholar] [CrossRef] [PubMed] [Green Version]
  8. Benjamin, M.T.; Mark, S.; Vorstatz, D.; Winter, A.M. A spatially and temporally resolved biogenic Hydrocarbon Emission Inventory for the California south coast air basin. Atmos. Environ. 1998, 31, 3087–3100. [Google Scholar] [CrossRef]
  9. Dommen, J.; Prevot, A.S.H.; Baertsch-Ritter, N.; Maffeis, G.; Ongoni, G.L.M.; Grüebler, F.C.; Thielmannc, A. High-resolution emission inventory of the Lombardy region: Development and comparison with measurements. Atmos. Environ. 2003, 37, 4149–4161. [Google Scholar] [CrossRef]
  10. Gallego, E.; Roca, F.J.; Perales, J.F.; Guardino, X.; Gadea, E.; Garrote, P. Impact of formaldehyde and VOCs from waste treatment plants upon the ambient air nearby an urban area (Spain). Sci. Total Environ. 2016, 568, 369–380. [Google Scholar] [CrossRef] [PubMed]
  11. Aleksandropoulou, V.; Torseth, K.; Lazaridis, M. Atmospheric Emission Inventory for Natural and Anthropogenic Sources and Spatial Emission Mapping for the Greater Athens Area. Water Air Soil Pollut. 2011, 219, 507–526. [Google Scholar] [CrossRef]
  12. Patrik, F.; Illerup, J.B. Danish emission inventory for solvents used in industries and households. Atmos. Environ. 2008, 42, 7947–7953. [Google Scholar]
  13. Singh, A.P.; Singh, R.; Usha, M.; Manesh Pratap, S.; Chandra Kumar, V. Emissions of monoterpene from tropical Indian plant species and assessment of VOC emission from the forest of Haryana state. Atmos. Pollut. Res. 2011, 2, 72–79. [Google Scholar] [CrossRef] [Green Version]
  14. Dominutti, P.; Keita, S.; Bahino, J.; Colomb, A.; Liousse, C.; Yoboué, V.; Galy-Lacaux, C.; Morris, E.; Bouvier, L.; Sauvage, S.; et al. Anthropogenic VOCs in Abidjan, southern West Africa: From source quantification to atmospheric impacts. Atmos. Chem. Phys. 2019, 19, 11721–11741. [Google Scholar] [CrossRef] [Green Version]
  15. Yang, G.H.; Jo, Y.J.; Lee, H.J.; Song, C.K.; Kim, C.H. Numerical Sensitivity Tests of Volatile Organic Compounds Emission to PM2.5 Formation during Heat Wave Period in 2018 in Two Southeast Korean Cities. Atmosphere 2020, 11, 331. [Google Scholar] [CrossRef] [Green Version]
  16. Klimont, Z.; Streets, D.G.; Gupta, S.; Cofala, J.; Fu, L.X.; Ichikawa, Y. Anthropogenic emissions of non-methane volatile organic compounds in China. Atmos. Environ. 2002, 36, 1309–1322. [Google Scholar] [CrossRef]
  17. Wei, W. Study on Current and Future Anthropogenic Emission of Volatile Organic Compounds in China. Ph.D. Thesis, Tsinghua University, Beijing, China, June 2009. (In Chinese). [Google Scholar]
  18. Liu, J.F.; Zhao, J.; Li, T.T.; Bai, Y.H.; Liu, Z.R. Establishment of Chinese Anthropogenic Source Volatile Organic Compounds Emission Inventory. China Environ. Sci. 2008, 28, 496–500. (In Chinese) [Google Scholar]
  19. Zhao, B.; Wang, P.; Ma, J.Z.; Zhu, S.; Pozzer, A.; Li, W. A high-resolution emission inventory of primary pollutants for the Huabei region, China. Atmos. Chem. Phys. 2012, 12, 481–501. [Google Scholar] [CrossRef] [Green Version]
  20. Wu, X.L. Study on Air Pollution Emission Inventory for Yangtze River Delta. Master’s Thesis, Fudan University, Shanghai, China, May 2009. (In Chinese). [Google Scholar]
  21. Zheng, J.Y.; Zheng, Z.Y.; Yu, Y.F.; Zhong, L.J. Temporal, spatial characteristics and uncertainty of biogenic VOC emission in the Pearl Delta region. Atmos. Environ. 2010, 44, 1960–1969. [Google Scholar] [CrossRef]
  22. Yu, Y.F.; Lu, Q.; Zheng, J.Y.; Zhong, L.J. VOC emission inventory and its uncertainty from the key VOC-related industries in the Pearl River Delta Region. China Environ. Sci. 2011, 31, 195–201. (In Chinese) [Google Scholar]
  23. Zheng, J.; Shao, M.; Che, W.; Zhang, L.; Zhong, L.; Zhang, Y.; Streets, D. Speciated VOC emission inventory and spatial patterns of ozone formation potential in the Pearl River Delta, China. Environ. Sci. Technol. 2009, 43, 8580–8586. [Google Scholar] [CrossRef]
  24. Fu, X.; Wang, S.X.; Zhao, B.; Xing, J.; Cheng, Z.; Huan, L.; Hao, J.M. Emission inventory of primary pollutants and chemical speciation in 2010 for the Yangtze River Delta region, China. Atmos. Environ. 2013, 70, 39–50. [Google Scholar] [CrossRef]
  25. 2016 China Ecology and Environment Status Bulletin. Available online: http://www.mee.gov.cn/hjzl/sthjzk/zghjzkgb/201706/P020170605833655914077.pdf (accessed on 15 February 2021). (In Chinese)
  26. Yang, L.X. Study on Temporal-Spatial Characteristic and Control Strategy of Industrial Emissions of Volatile Organic Compounds in China. Master’s Thesis, South China University of Technology, Guangzhou, China, June 2012. (In Chinese). [Google Scholar]
  27. Wei, W.; Wang, S.X.; Hao, J.M.; Cheng, S.Y. Projection of anthropogenic volatile organic compounds (VOCs) emissions in China for the period 2010–2020. Atmos. Environ. 2011, 45, 6863–6871. [Google Scholar] [CrossRef]
  28. Wei, W.; Cheng, S.Y.; Li, G.H.; Wang, G.; Wang, H.Y. Characteristics of volatile organic compounds (VOCs) emitted from a petroleum refinery in Beijing, China. Atmos. Environ. 2014, 89, 358–366. [Google Scholar] [CrossRef]
  29. Zhang, Y.L.; Yang, W.Q.; Simpson, I.; Huang, X.Y.; Yu, J.Z.; Huang, Z.H.; Wang, Z.Y.; Zhang, Z.; Liu, D.; Huang, Z.Z.; et al. Decadal changes in emissions of volatile organic 398 compounds (VOCs) from on-road vehicles with intensified automobile pollution control: Case study in a busy urban tunnel in 399 south China. Environ. Pollut. 2018, 233, 806–819. [Google Scholar] [CrossRef] [Green Version]
  30. 2016 China Statistical Yearbook (in Chinese). Available online: http://tongji.cnki.net.libproxy.bjut.edu.cn (accessed on 15 February 2021).
  31. General Situation of Industrial Economy in Hebei Province. Available online: http://gxt.hebei.gov.cn/hbgyhxxht/xxgk6/hbsgyjjgk82/index.html (accessed on 23 March 2021). (In Chinese)
  32. 2015 Hebei Economic Yearbook. Available online: http://tongji.cnki.net.libproxy.bjut.edu.cn (accessed on 15 February 2021). (In Chinese).
  33. Technical Guide on Compiling Atmospheric Volatile Organic Compounds Source Inventory (for Trial Implementation) (in Chinese). Available online: http://www.mee.gov.cn/gkml/hbb/bgg/201408/W020140828351293705457.pdf (accessed on 15 February 2021).
  34. Chen, S.P.; Liu, W.T.; Ou-Yang, C.F.; Chang, J.S.; Wang, J.L. Optimizing the emission inventory of volatile organic compounds (VOCs) based on network observations. Atmos. Environ. 2014, 84, 1–8. [Google Scholar] [CrossRef]
  35. Townsend-Small, A.; Marrero, J.E.; Lyon, D.R.; Simpson, I.J.; Meinardi, S.; Blake, D.R. Integrating source apportionment tracers into a bottom-up inventory of methane emissions in the barnett shale hydraulic fracturing region. Environ. Sci. Technol. 2015, 49, 8175–8182. [Google Scholar] [CrossRef] [Green Version]
  36. Wang, Y.N.; Ye, D.Q.; Lin, J.M.; Ye, C.D.; Fu, M.L. A study on emission characteristics of volatile organic compounds (VOCs) from enameled wire industry. China Environ. Sci. 2012, 32, 980–987. (In Chinese) [Google Scholar]
  37. Zhou, Y.; Cheng, S.Y.; Chen, D.S.; Lang, J.L.; Zhao, B.B.; Wei, W. A new statistical approach for establishing high-resolution emission inventory of primary gaseous air pollutants. Atmos. Environ. 2014, 94, 392–401. [Google Scholar] [CrossRef]
  38. Chen, Y. Study on Current and Future Industrial Emission of Volatile Organic Compounds in China. Master’s Thesis, South China University of Technology, Guangzhou, China, June 2011. (In Chinese). [Google Scholar]
  39. 2016 China Energy Statistical Yearbook. Available online: http://tongji.cnki.net.libproxy.bjut.edu.cn (accessed on 15 February 2021). (In Chinese).
  40. Statistical Bulletin of National Economic and Social Development in Hebei Province. Available online: http://www.hetj.gov.cn/res/uploadfile/20160229145526889.pdf (accessed on 15 February 2021). (In Chinese)
  41. The 12th Five Year Plan of petroleum and chemical industry in Hebei Province. Available online: http://www.hebei.gov.cn/hebei/14462058/14462085/14471257/14471254/14870558/index.html (accessed on 15 February 2021). (In Chinese)
  42. Refined Methanol Output of Provinces and Cities in 2015. Available online: https://wenku.baidu.com/view/93dde4c410a6f524cdbf8511.html (accessed on 15 February 2021). (In Chinese).
  43. Statistics of China’s Ink Production from January to November 2010. Available online: https://www.askci.com/news/data/viewdata207501.html (accessed on 15 February 2021). (In Chinese).
  44. 2016 China Light Industry Yearbook. Available online: http://tongji.cnki.net.libproxy.bjut.edu.cn (accessed on 15 February 2021). (In Chinese).
  45. Cheng, G.Q. Study on VOCs Emissions Research Present Situation and the Emission Reduction Potential of Key Industries in Hebei Province. Master’s Thesis, Hebei University of Science and Technology, Hebei, China, May 2016. (In Chinese). [Google Scholar]
  46. China Coated Abrasives Net. Available online: http://www.cncaa.org/ (accessed on 15 February 2021).
  47. Limit Standards of Volatile Organic Compounds of Architectural Coatings and Adhesives. Available online: http://hbepb.hebei.gov.cn/root8/auto454/202003/W020170414543929357970.pdf (accessed on 15 February 2021). (In Chinese)
  48. 2015 China Urban Construction Statistical Yearbook. Available online: http://tongji.cnki.net.libproxy.bjut.edu.cn (accessed on 15 February 2021). (In Chinese).
  49. VOC Emission Measurement Announcement Coefficient of air Pollution Control Fee Declared by Fixed Source in Public and Private Places. Available online: https://www.docin.com/p-78768491.html (accessed on 15 February 2021). (In Chinese).
  50. Chen, Y.; Ye, D.Q.; Liu, X.Z.; Wu, J.L.; Huang, B.C.; Zheng, Y.N. Source tracing and characteristics of industrial VOCs emissions in China. China Environ. Sci. 2012, 32, 48–55. (In Chinese) [Google Scholar]
  51. Wei, W.; Wang, S.X.; Chatani, S.; Klimont, Z.; Cofala, J.; Hao, J.M. Emission and speciation of non-methane volatile organic compounds from anthropogenic sources in China. Atmos. Environ. 2008, 42, 4976–4988. [Google Scholar] [CrossRef]
  52. The 13th Five-Year Plan (2016–2020). Available online: https://www.cma.org.cn/attachment/2016322/1458614099605.pdf (accessed on 15 February 2021). (In Chinese).
  53. Air Pollution Prevention and Control Action Plan. Available online: http://www.gov.cn/zwgk/2013-09/12/content_2486773.htm (accessed on 15 February 2021). (In Chinese)
  54. The 13th Five-Year Plan for the Prevention and Control of Volatile Organic Compound Pollution. Available online: http://www.mee.gov.cn/gkml/hbb/bwj/201709/W020170919373521878296.pdf (accessed on 15 February 2021). (In Chinese)
  55. Volatile Organic Compounds Reduction Action Plan for Key Industries. Available online: https://www.miit.gov.cn/cms_files/filemanager/oldfile/miit/n1146295/n1652858/n1652930/n3757016/c5137974/part/5141492.pdf (accessed on 15 February 2021). (In Chinese)
  56. Liang, X.M. Reactivity-Based Anthropogenic Volatile Organic Compounds Emission Inventory and O3 Control Strategies in China. Master’s Thesis, South China University of Technology, Guangzhou, China, June 2017. (In Chinese). [Google Scholar]
  57. Ye, D.Q.; Liu, R.Y.; Tian, J.T. Trends of volatile organic compounds emissions and research on policy in China. Environ. Prot. 2020, 48, 23–26. (In Chinese) [Google Scholar]
  58. Zhang, X.M.; Zhao, W.J.; Meng, F. Study on classification control of atmospheric volatile organic compounds emission pollution sources based on OFP. Environ. Prot. 2017, 45, 23–26. (In Chinese) [Google Scholar]
  59. Moren, P.A.P. Notes on continuous stochastic phenomena. Biometrika 1950, 37, 22–25. [Google Scholar]
  60. MEIC. Available online: http://meicmodel.org/ (accessed on 23 March 2021).
  61. Notice on the Comprehensive Treatment Plan for Volatile Organic Compounds in Key Industries. Available online: http://www.mee.gov.cn/xxgk2018/xxgk/xxgk03/201907/t20190703_708395.html (accessed on 15 February 2021). (In Chinese)
  62. El-Fadel, M.; Zeinati, M.; Ghaddar, N.; Mezher, T. Uncertainty in estimating and mitigating industrial related GHG emissions. Energy Policy 2001, 29, 1031–1043. [Google Scholar] [CrossRef]
  63. Guo, X.R.; Wu, H.K.; Chen, D.S.; Ye, Z.L.; Shen, Y.Q.; Liu, J.F.; Cheng, S.Y. Estimation and prediction of pollutant emissions from agricultural and construction diesel machinery in the Beijing-Tianjin-Hebei (BTH) region, China. Environ. Pollut. 2020, 260, 113973. [Google Scholar] [CrossRef] [PubMed]
  64. Wei, W.; Wang, S.X.; Hao, J.M. Uncertainty Analysis of Emission Inventory for Volatile Organic Compounds from Anthropogenic Sources in China. Environ. Sci. 2011, 32, 305–312. (In Chinese) [Google Scholar]
  65. Streets, D.G.; Bond, T.C.; Carmichael, G.R.; Fernandes, S.D.; Fu, Q.; He, D.; Klimont, Z.; Nelson, S.M.; Tsai, N.Y.; Wang, M.Q.; et al. An inventory of gaseous and primary aerosol emission in Asia in the year 2000. J. Geophys. Res. 2003, 108, 8809. [Google Scholar] [CrossRef]
Figure 1. The trends of GDP, population, and urbanization rate in Hebei Province (a) and China (b) from 1995 to 2015.
Atmosphere 12 00530 g001
Figure 2. Comparison of industrial VOC emissions in this study with other published results for Hebei province (2010, 2013, and 2015 on the X-axis refer to the years when the VOC emission inventory was established).
Atmosphere 12 00530 g002
Figure 3. Emission contributions of various sources to the total industrial VOC emissions in Hebei Province in 2015 (CNP: crude oil and natural gas extraction; PR: petroleum refining; BCM: basic chemical raw materials manufacturing; CE: chemical medicine; CP: coke production; MEM: mechanical equipment manufacturing; WA: wood adhesives; PA: packaging adhesive; ICD: industrial and construction dyes; WC: wood coatings; TEC: transportation equipment coating).
Atmosphere 12 00530 g003
Figure 4. VOC emissions of key industrial sources (CE: chemical medicine; CP: coke production; MEM: mechanical equipment manufacturing; OC: organic chemical; PP: packaging and printing; WA: wood adhesives; ICD: industrial and construction dyes; FM: furniture manufacturing; TEP: transportation equipment manufacturing; COP: crude oil processing).
Atmosphere 12 00530 g004
Figure 5. Spatial distribution of VOC emissions from industrial sources and key industries in Hebei Province for 2015.
Atmosphere 12 00530 g005
Figure 6. Prediction of industrial VOC emissions under the different scenarios in 2020 and 2030.
Atmosphere 12 00530 g006
Figure 7. Spatial distribution of VOC emissions from industrial sources in Hebei Province for 2020 and 2030.
Atmosphere 12 00530 g007
Table 1. Source classification and activity level of the major industrial VOC emission inventory.
SectorsSourcesReference
Production of VOCsCrude oil production[32]
Natural gas production[32]
Crude oil processing volume[41]
Methanol production[42]
Benzene production[32]
Output of synthetic ammonia[32]
Storage and transportOutput of petroleum products[39]
Import and export of oil[39]
Industrial processes using VOCs as raw materialsCoating production[32]
Ink production[43]
Production of primary form plastic[30]
Production of synthetic rubber[32]
Output of synthetic fiber[32]
Production of vegetable oil[32]
Yield of finished sugar[32]
Liquor yield[32]
Beer production[32]
Alcohol production[44]
Production of synthetic detergent[32]
Production of chemical medicine raw medicine[32]
Production of chemical pesticides[32]
Tire output[32]
Cement/lime/gypsum[32]
Flat glass[32]
Production of sanitary ceramics[32]
Steel production[32]
The use of VOC productsCoke production[30]
Textile auxiliary consumption[30]
Dye consumption[30]
Consumption of PU slurry[44]
Consumption of adhesive[30]
Pulp production[44]
Paper product output[32]
Ink consumption[32,45]
Consumption of gasoline detergent[32,45]
Adhesive consumption[32,45]
Adhesive consumption[40]
Consumption of wood coatings[40]
Paint consumption[32]
Assembly adhesive consumption[32]
Paint consumption[30,46]
Adhesive consumption[30,46]
Building paint consumption[30,47]
Construction adhesive consumption[30,46]
Landfill amount[48]
Amount of waste incineration treatment[48]
Amount of compost treatment[48]
Fossil fuel consumption[32]
Heating fuel consumption[39]
Industrial and construction fuel consumption[39]
Laundry[30]
Table 2. Emission factors used in this study.
SectorsSourcesActivity DataEmission FactorsUnitReference
Production of VOCsCrude oil and natural gas extractionCrude oil exploration1.5275g/kg Crude oil[33]
Natural gas exploration0.5g/kg Products
Petroleum refiningCrude oil processing volume1.82g/kg Products
Basic chemical raw materials manufacturingMethanol production5.55g/kg Products[49]
Benzene Production0.55g/kg Products
Synthesis ammonia4.72g/kg Products[33]
Storage and transportOil storageCrude oil0.123g/kg Products[33]
Gasoline0.156g/kg Products
Oil transportationCrude oil1.6036g/kg Products
Gasoline1.6036g/kg Products
Industrial processes using VOCs as raw materialsCoating productionPaint production81.4g/kg Products[33]
Ink productionInk production50g/kg Products
Production of synthetic materialsProduction of primary form plastic5.81g/kg Products[5]
Production of synthetic rubber7.17g/kg Products[33]
Polyester0.7g/kg Products
Nick3.3g/kg Products
Acrylic37.1g/kg Products
Other fiber13.43g/kg Products
Food and beverage productionProduction of vegetable oil2.45kg/t
Yield of finished sugar8g/kg sugar
Liquor yield16.26kg kL−1[50]
Beer production0.43kg kL−1[50]
Alcohol production32.1kg kL−1[49]
Commodity productionProduction of synthetic detergent0.025kg/t[50]
Manufacture of chemical drug raw drugsProduction of chemical drug raw drugs430g/kg Products[33]
Tire manufacturingTire production0.91Kg/a
Manufacture of cement, lime and gypsumCement/lime/gypsum0.177g/kg Products
Glass and glass product manufacturingFlat glass4.4g/kg Products
SteelmakingSteel production0.2g/kg Steel
The use of VOC productsCoke productionMechanical coking2.96g/kg Coke[33]
Indigenous coking5.36g/kg Coke
Textile Printing and dyeingTextile auxiliary consumption98kg/t[49]
Dye consumption81.4g/kg dyes
Synthetic Leather ManufacturingConsumption of PU slurry245kg/t[50]
Shoe MakingConsumption of adhesive670kg/t
Papermaking and paper ProductsPulp production3.1g/kg Pulp[33]
Paper product output0.1kg/t Products
Printing and packaging printingInk consumption(new)750g/kg Ink
Ink consumption (traditional)100g/kg Ink
Consumption of gasoline detergent1000kg/t
Adhesive consumption1385kg/t[26]
Wood processingAdhesive consumption89kg/t[50]
Furniture manufacturingConsumption of wood Coatings651kg/t[51]
Mechanical equipment manufacturingPaint consumption0.4kg/pieces[33]
Assembly Adhesive Consumption89kg/t[49]
Traffic and transportation equipment manufacturingPaint consumption (automobile)21.2kg/car[33]
Paint consumption (motorcycles)1.8kg/car
Paint consumption (Sedan)2.43kg/car
Paint consumption (bicycle)0.3kg/car
Adhesive consumption89kg/t[50]
Architectural decorationConstruction paint Consumption (water-based)120g/kg Coating[33]
Construction Paint consumption (solvent type)450g/kg Coating
Construction adhesive consumption62kg/t[50]
Waste disposalLandfill Amount0.23g/kg Rubbish[33]
Amount of waste incineration treatment0.74g/kg Rubbish
Amount of compost treatment0.74g/kg Rubbish
Clothes dry cleaningEthylene chloride consumption1000g/kg
Stationary source combustionFossil fuel (coal)0.15g/kg Coal
Thermal power (Fuel oil)0.13g/kg Fuel oil[33]
Thermal power (coal gasification)0.00044g/m3
Thermal power (liquefied petroleum gas)0.034g/m3
Thermal power (natural gas)0.045g/m3
Heating fuel (coal)0.18g/kg Coal
Heating fuel (fuel oil)0.2g/kg Fuel oil
Heating fuel (coal gasification)0.00044g/m3
Heating fuel (liquefied petroleum gas)0.5g/m3
Heating fuel (natural gas)0.088g/m3
Industrial and construction fuels (coal)0.39g/kg Coal
Industrial and construction fuels (fuel oil)0.35g/kg Fuel oil
Industrial and construction fuels (coal gasification)0.00044g/m3
Industrial and construction fuels (liquefied petroleum gas)0.48g/m3
Industrial and construction fuels (natural gas)0.088g/m3
Table 3. The predicted GDP, population, and urbanization rate in Hebei Province for the period 2015–2030.
GDP (Billion Yuan)Population (Million)Urbanization Rate (%)
20152980.674.2451.33
20205280.576.8754.2
20255863.380.4957.52
20308223.683.7660.46
Table 4. Specific descriptions of the three scenarios designed in this paper.
ScenariosScenario Description
BAU scenarioBased on the 2015 emission level to project future emissions, assuming that the control technologies maintain unchanged, with no additional measures being implemented
Moderate scenarioKey industrial sectors (large-scale enterprises of chemical medicine, coke production, mechanical equipment manufacturing, organic chemical, packaging and printing, wood adhesives, industrial and construction dyes, furniture manufacturing, transportation equipment manufacturing, and crude oil processing) adopt the best available control technologies and clean production
Strict scenarioAll industrial sectors (100%) adopt the best available control technologies and clean production
Table 5. Detailed parameters of the control measures of various industrial sources.
SourcesControl TechnologiesEmission Reduction Efficiency (%)
20202030
Chemical medicineCondensation/adsorption/catalytic combustion technology60–7080–90
Coke productionCondensation recovery/catalytic combustion/adsorption50–6570–85
Mechanical equipment manufacturingAdsorption and concentration of activated carbon + catalytic combustion/thermal combustion50–6570–85
Organic chemicalCondensation/adsorption/catalytic combustion technology/spray absorption + cooling dehumidification + activated carbon adsorption60–7080–90
Packaging and printingAdsorption recovery/catalytic combustion/environmentally friendly raw material substitution55–6575–90
Wood adhesivesSubstitution of environmental protection materials/activated carbon adsorption/low temperature plasma5575
Industrial and construction dyesAdsorption/combustion45–6070–85
Furniture manufacturingWheel concentrated combustion/adsorption/environmentally friendly raw materials 50–6575–85
Transportation equipment ManufacturingAdsorption and concentration of activated carbon + catalytic combustion/thermal combustion50–6580–90
Crude oil processingOil and gas recovery system/adsorption concentration + catalytic combustion55–7075–90
Other sourcesAdsorption/combustion/biological treatment51–5070–80
Table 6. VOC emissions from four types of industrial sources in Hebei Province in 2015.
SourceProduction of VOCs Storage and Transport Industrial Processes Using VOCs as Raw MaterialsThe Use of VOC ProductsTotal Industrial VOCs
Emissions (kt)51.286436.4872399.582530.4391017.795
Table 7. The estimated uncertainty range of industrial VOC emissions for each sector in 2015.
Sectors Uncertainty (95% Confidence Interval)
Production of VOCs[−38%, +59%]
Storage and transport[−57%, +85%]
Industrial processes using VOCs as raw materials[−39%, +67%]
The use of VOC products[−63%, +90%]
Publisher’s Note: MDPI stays neutral with regard to jurisdictional claims in published maps and institutional affiliations.

