
Effect of Air Temperature Increase on Changes in Thermal Regime of the Oder and Neman Rivers Flowing into the Baltic Sea


 ,
,
Abstract
1. Introduction
2. Experiments
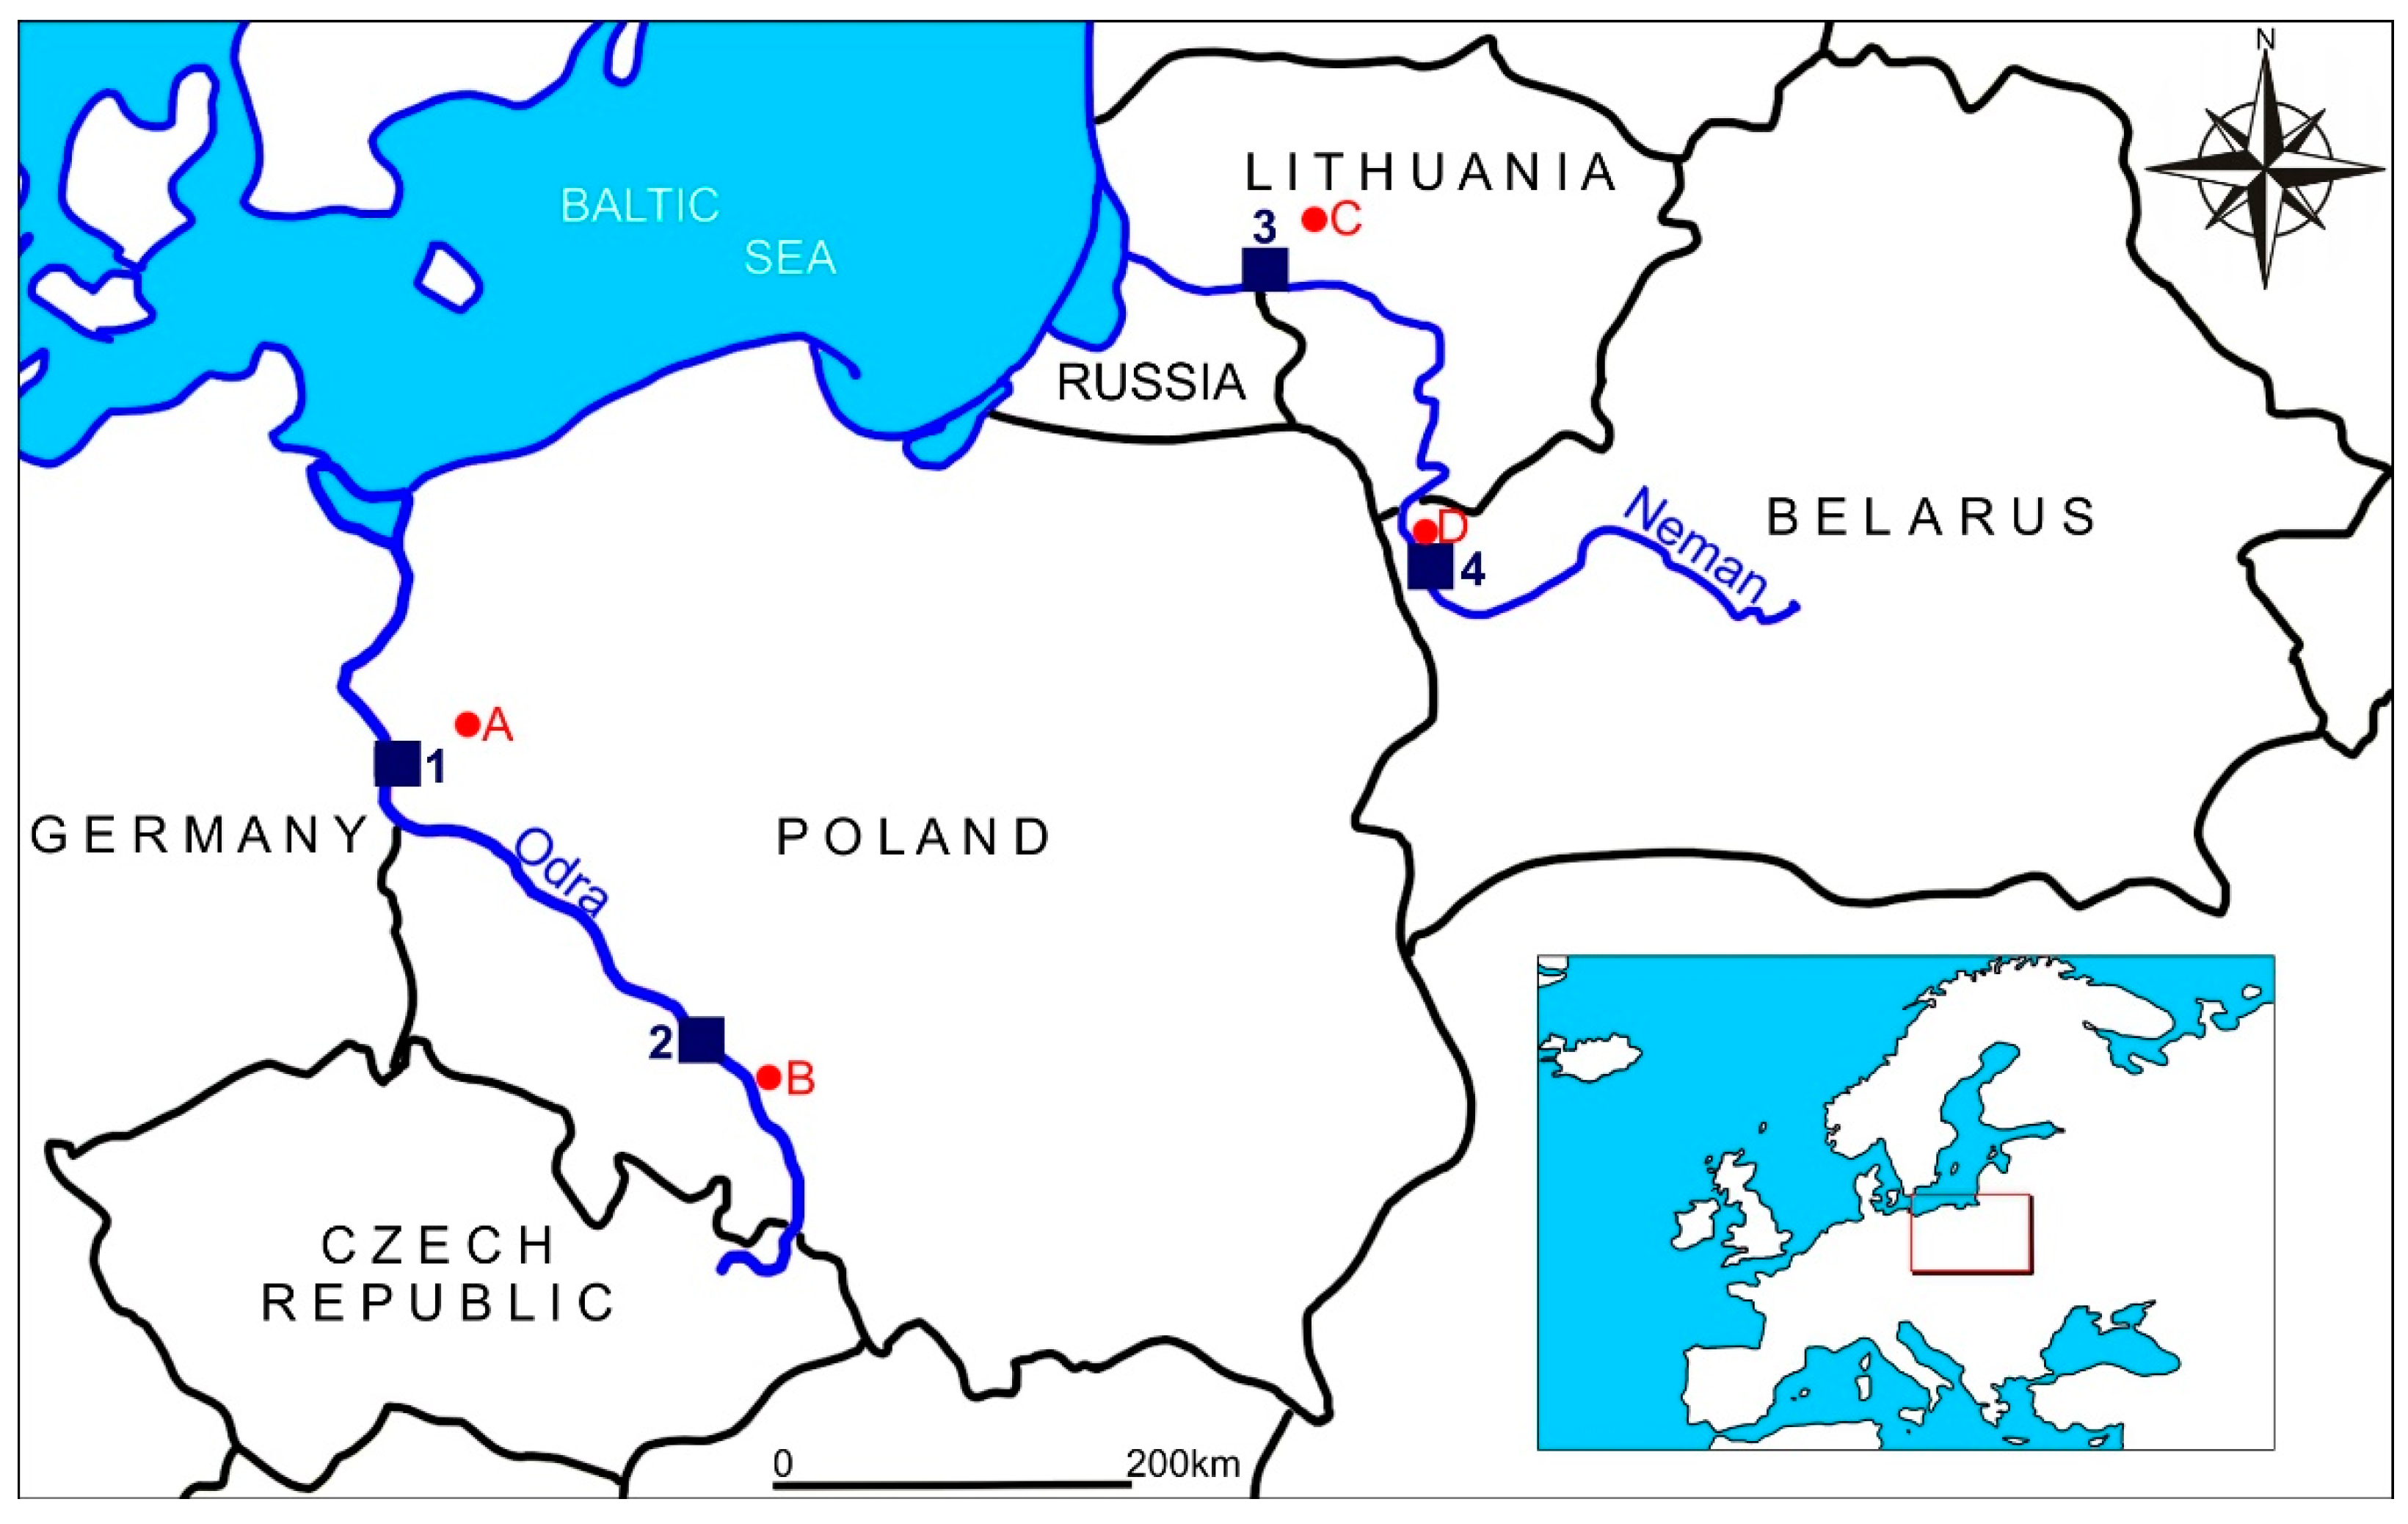
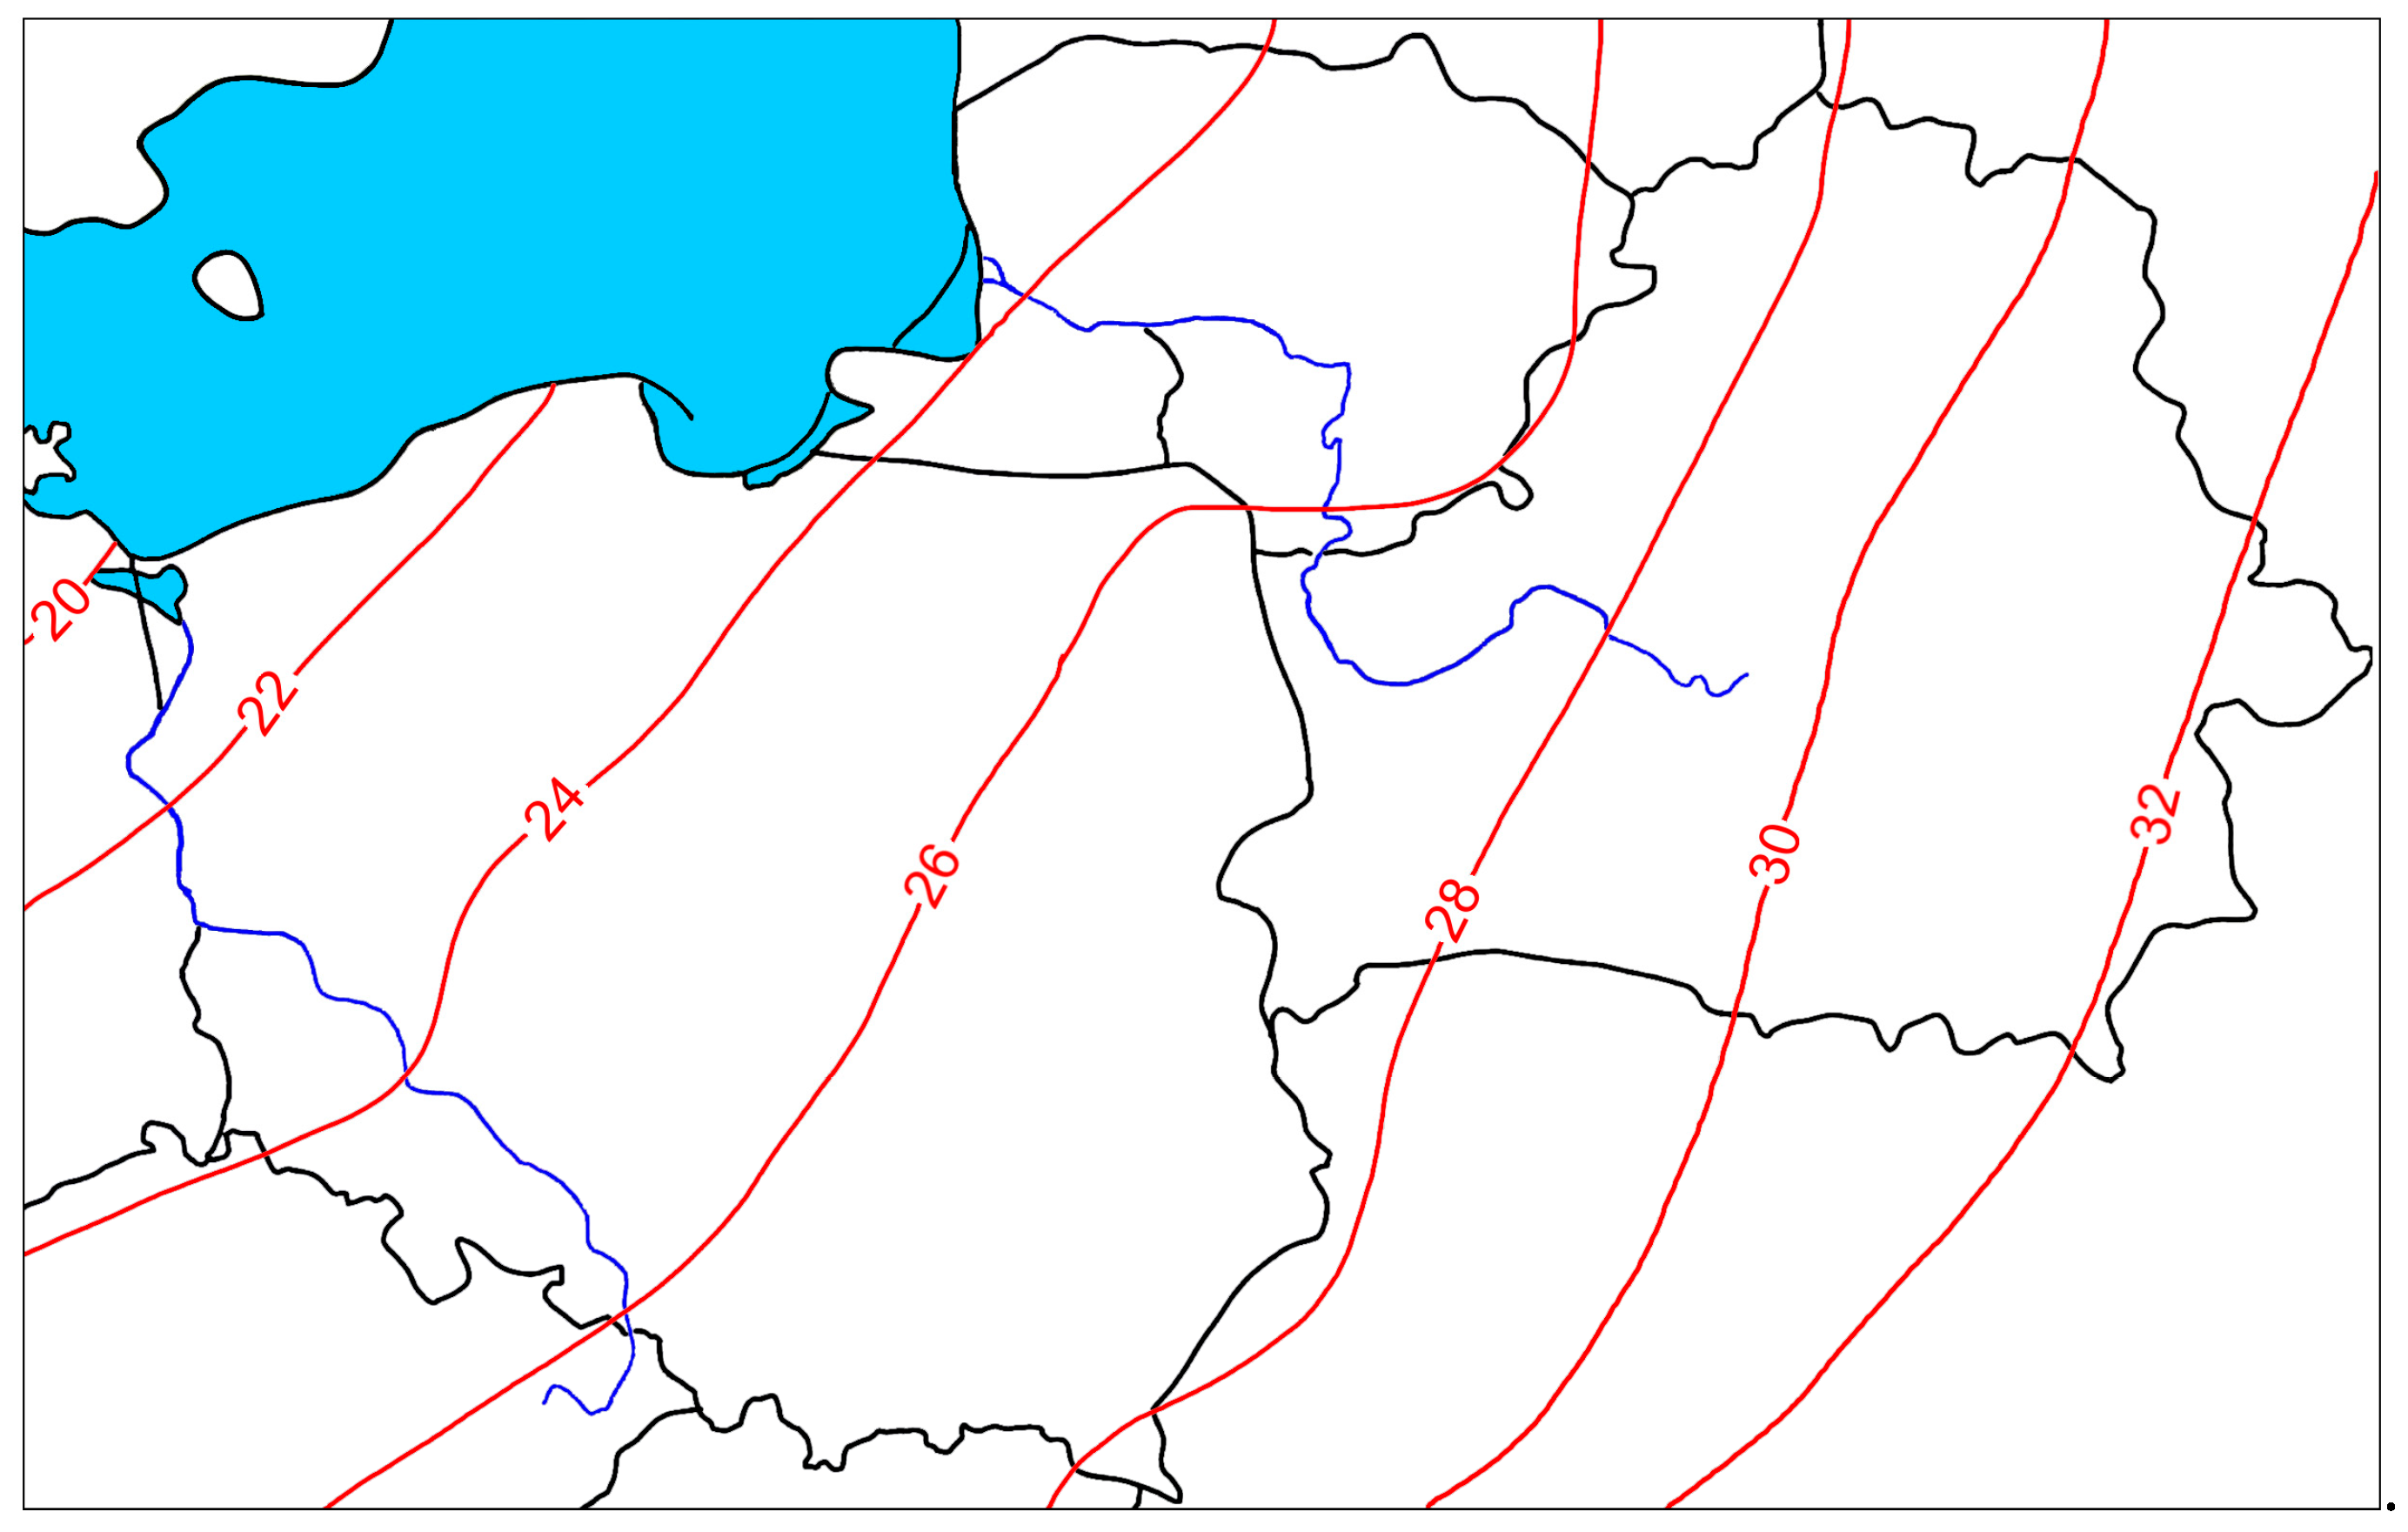
2.1. Study Area
2.2. Materials and Methods
- (a)
- Identification of the model;
- (b)
- Assessment and verification of the adequacy of the model;
- (c)
- Application of the model in forecasting.
- -
- Finding direct and (or) seasonal differences (i.e., determination of the value of parameter d);
- -
- Selection of a trend and (or) filtering seasonal (periodical) fluctuations.
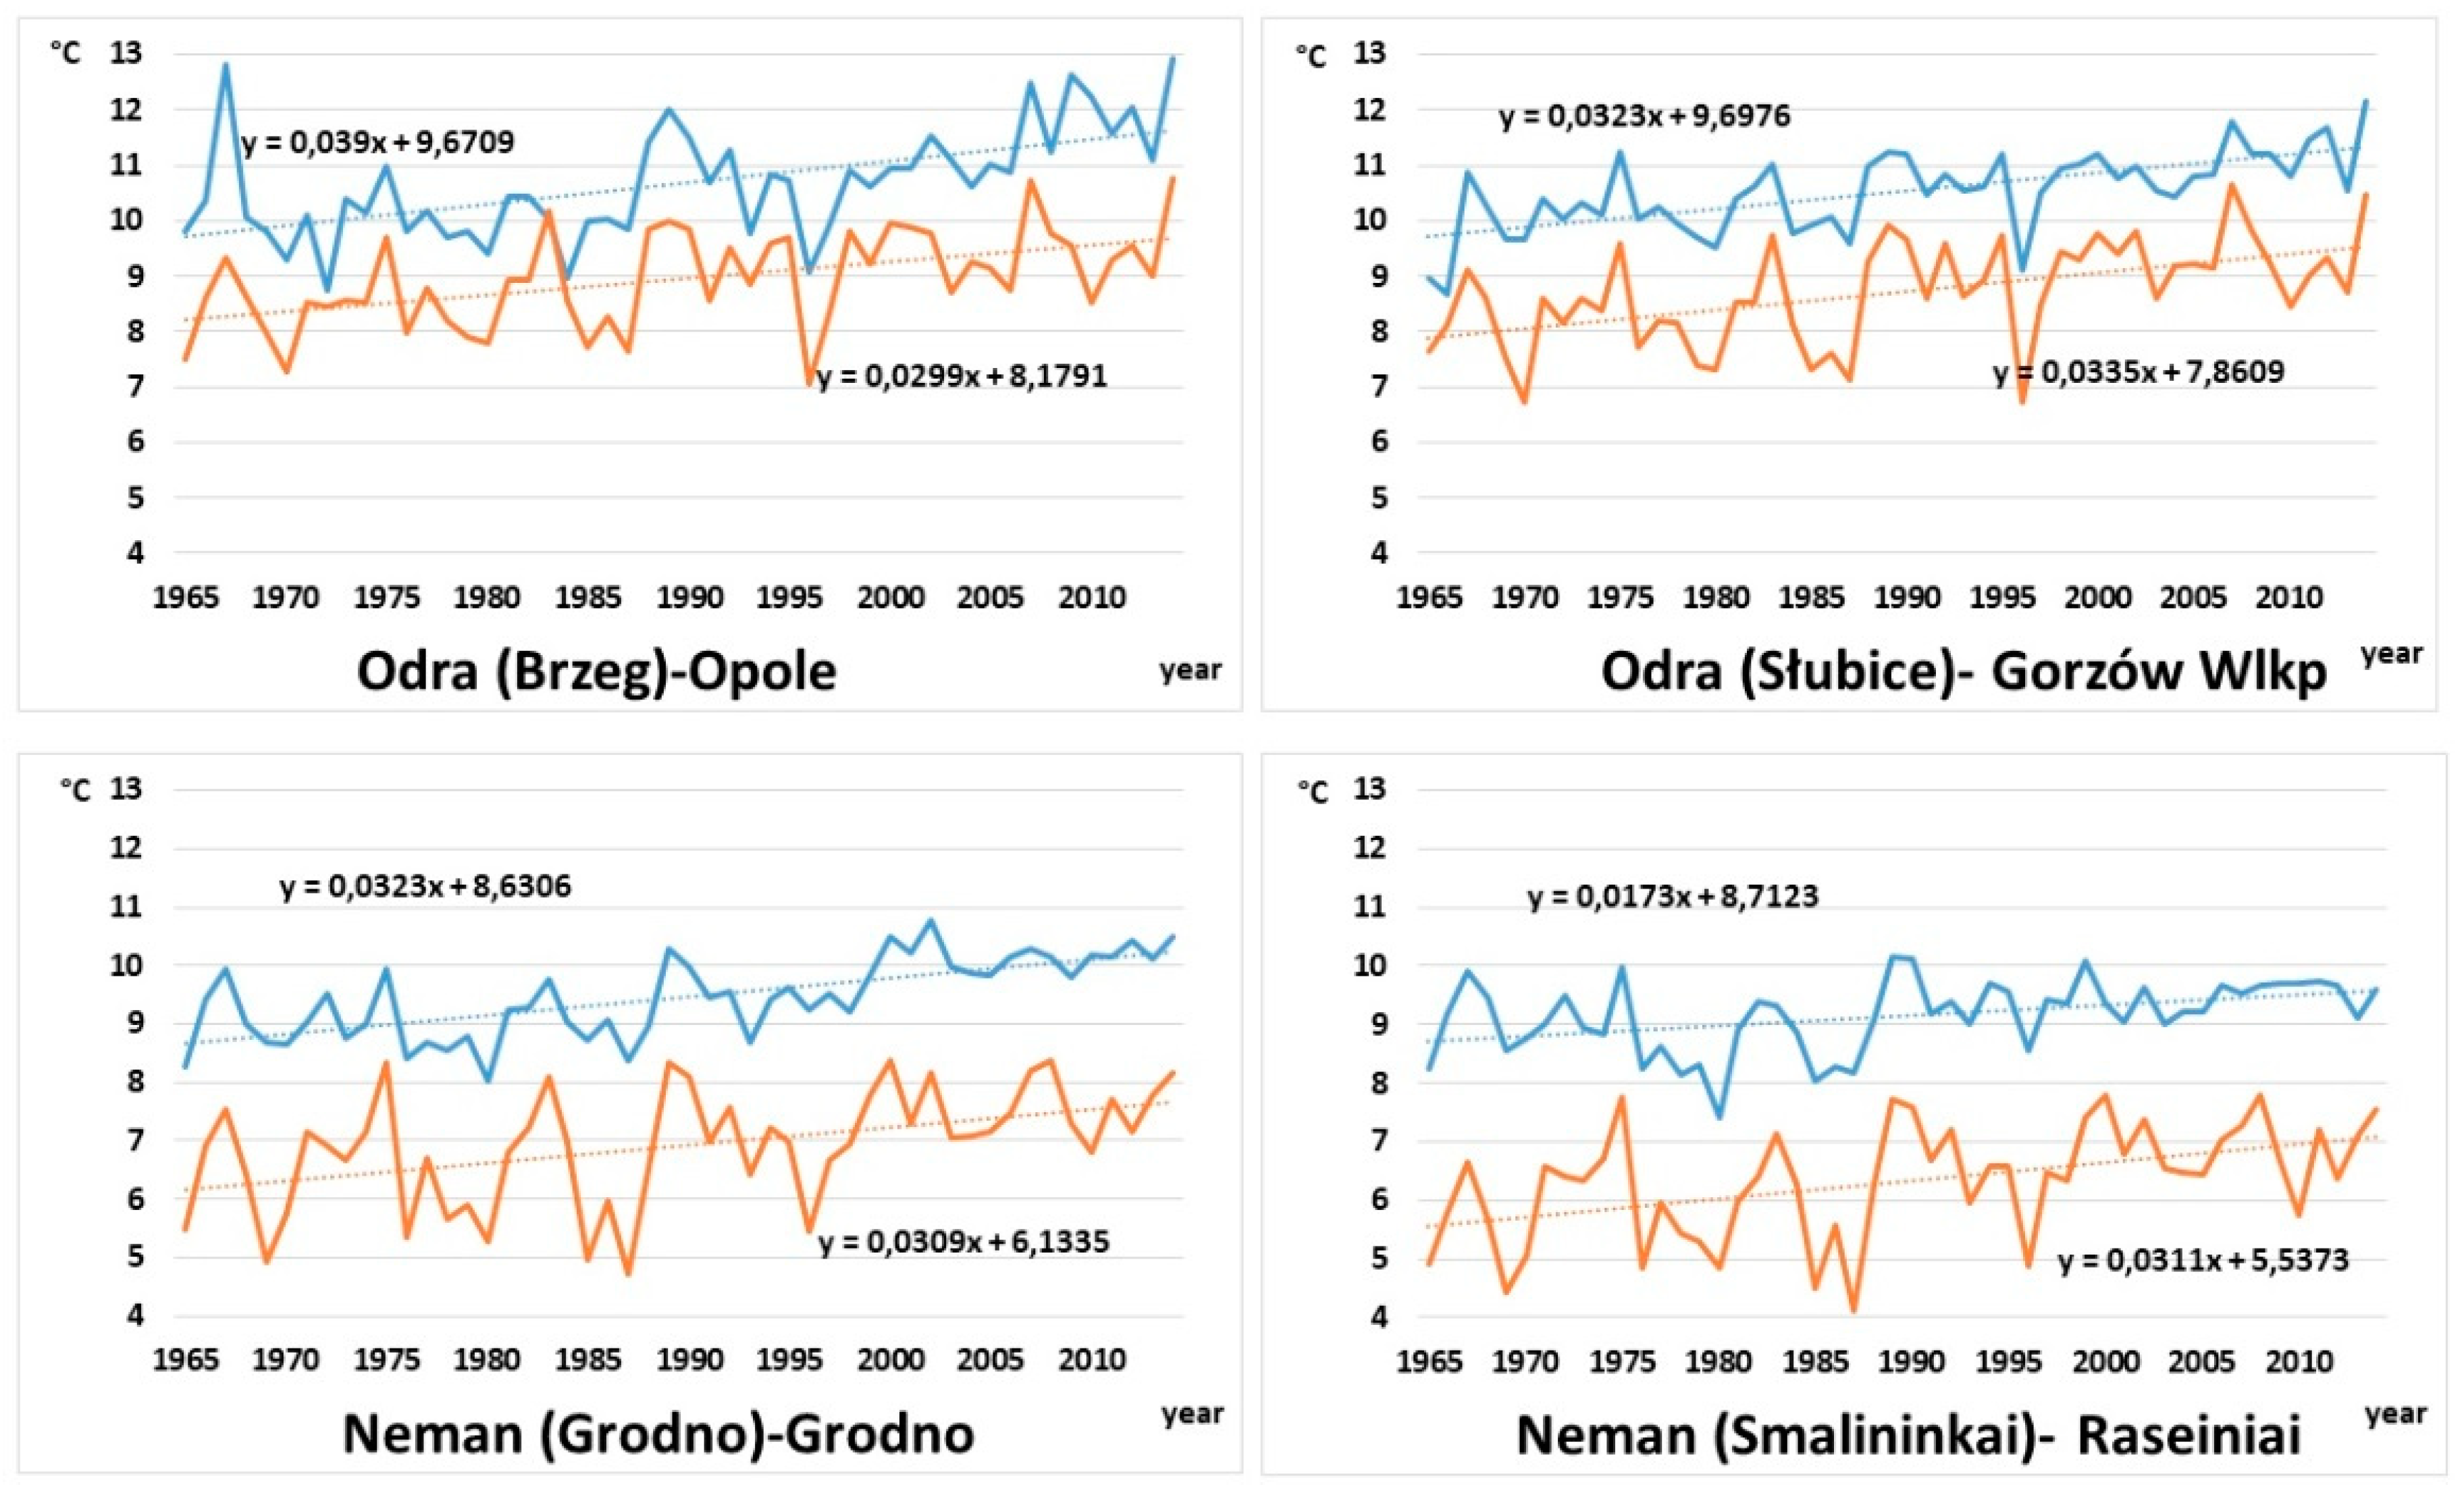
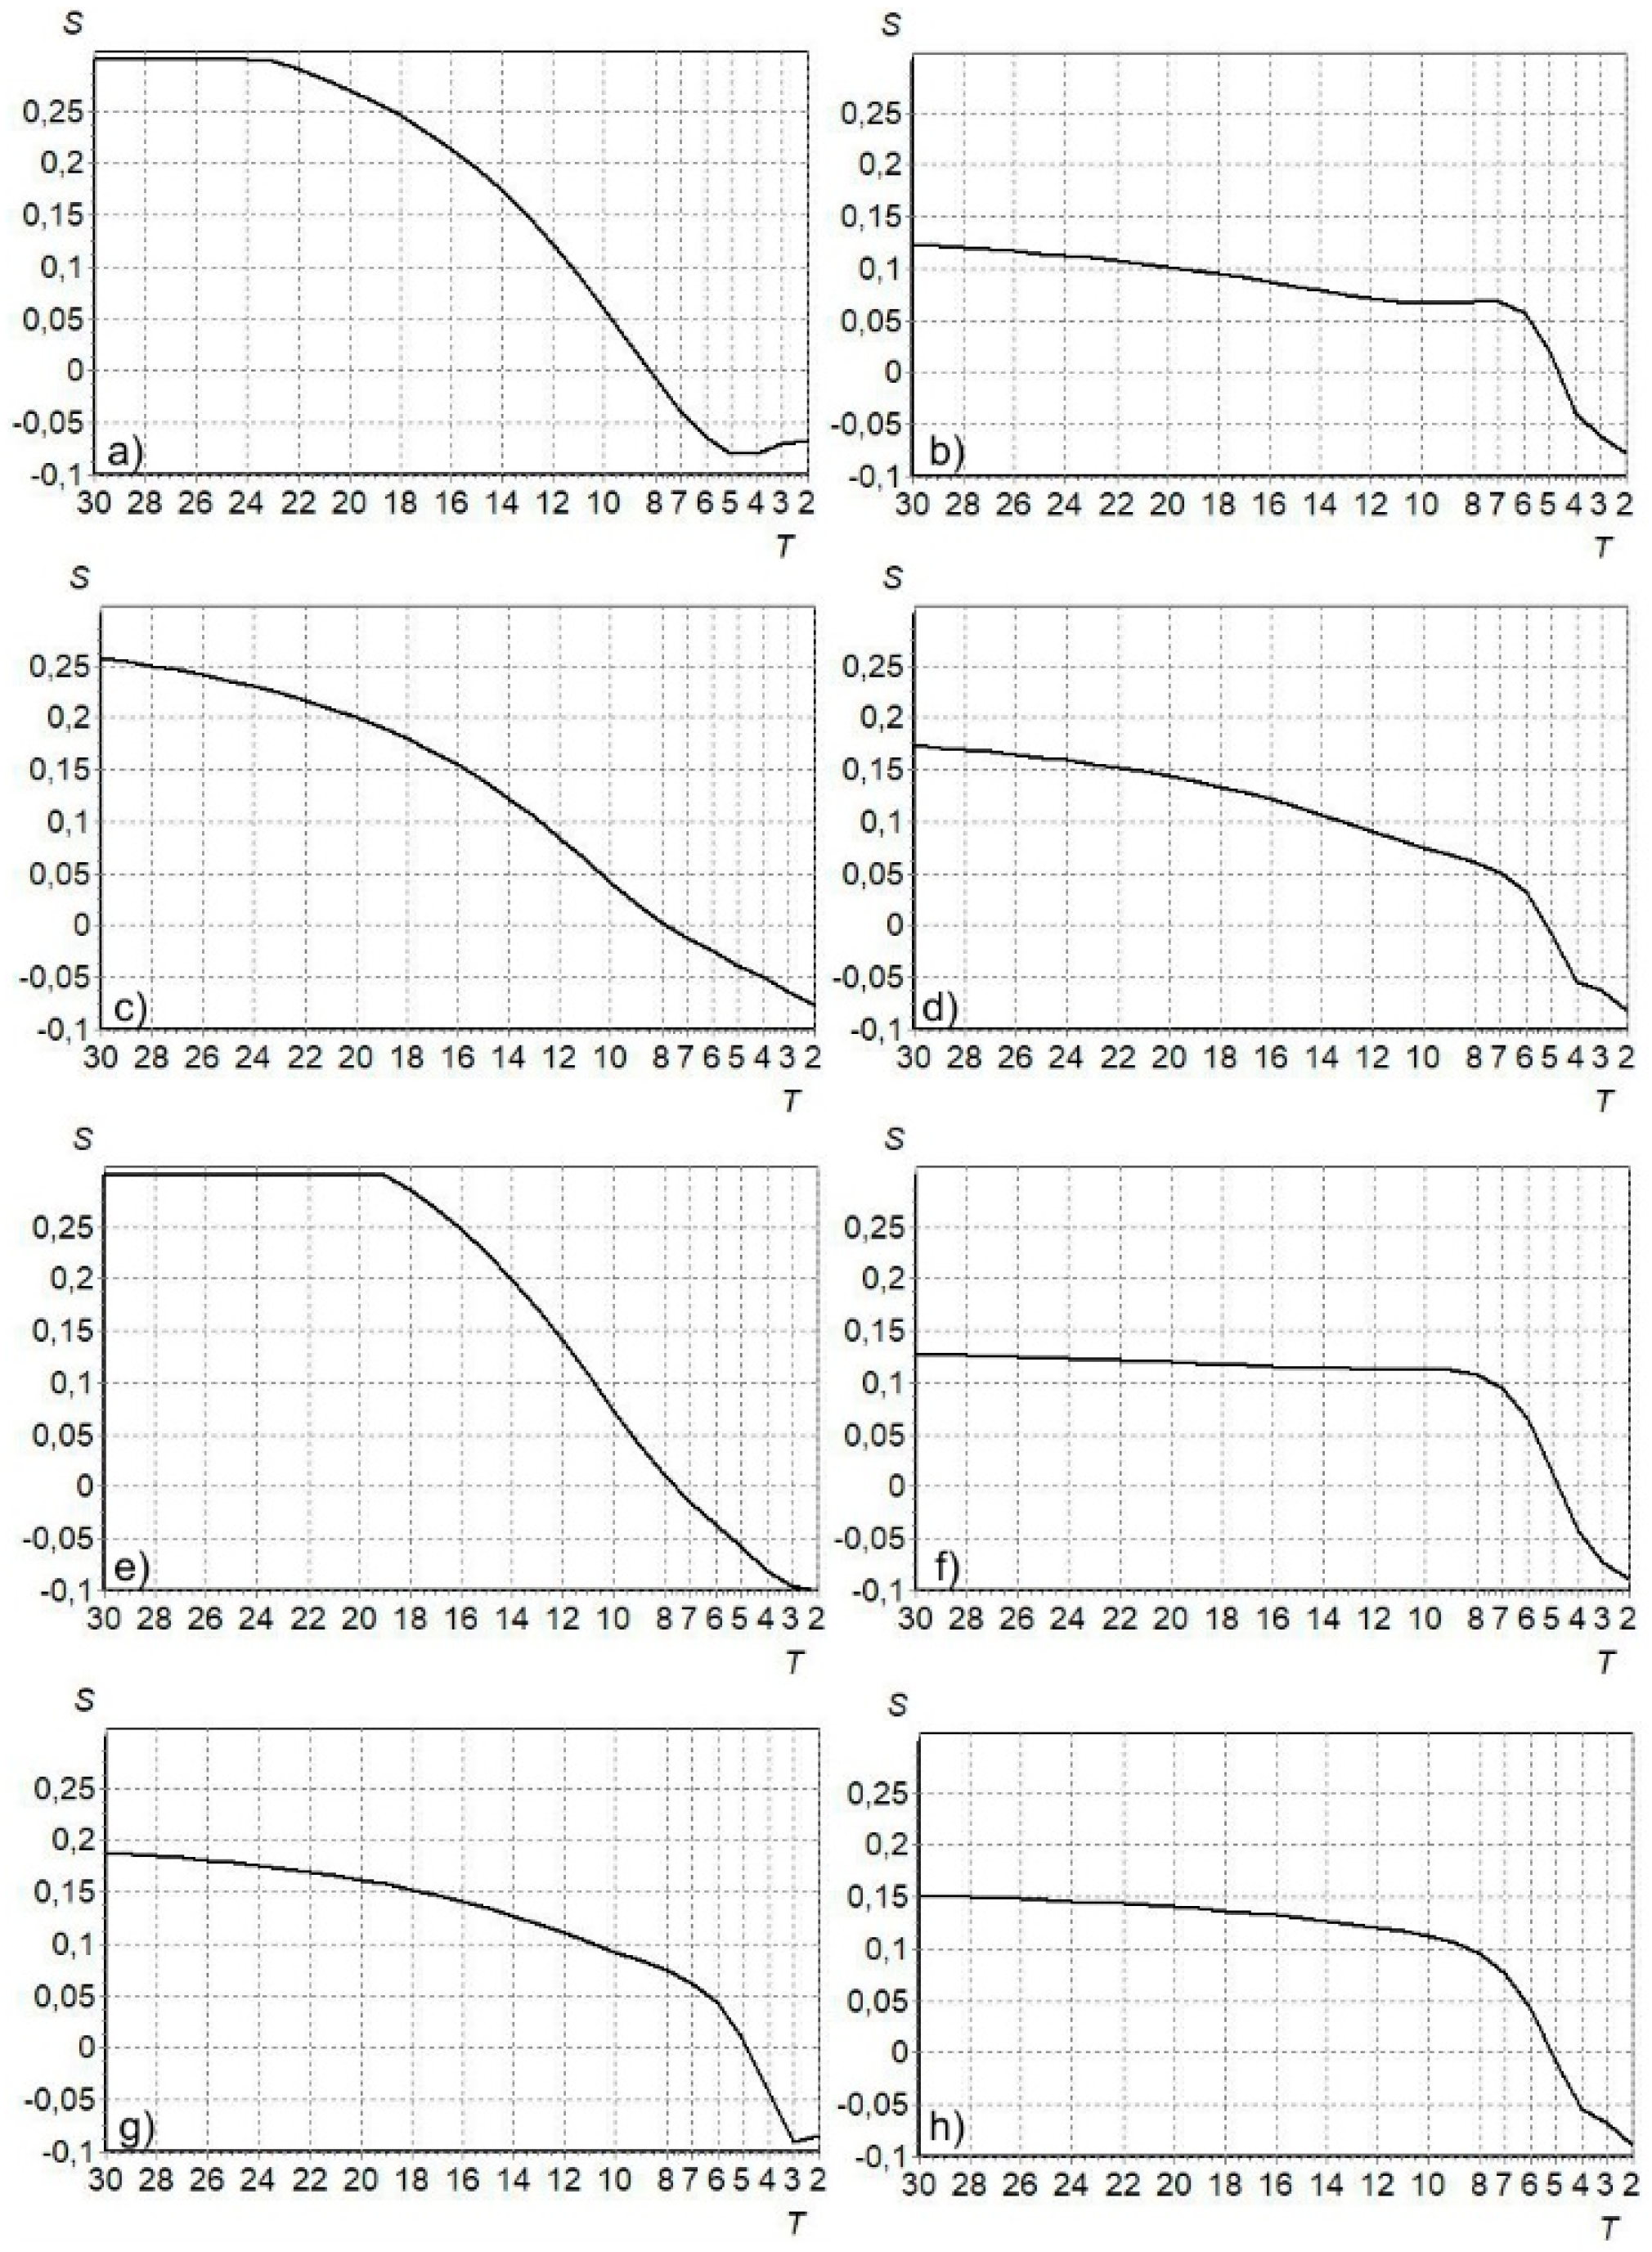
3. Results
4. Discussion
5. Conclusions
Author Contributions
Funding
Institutional Review Board Statement
Informed Consent Statement
Data Availability Statement
Acknowledgments
Conflicts of Interest
References
- Morrill, J.C.; Bales, R.C.; Conklin, M.H. Estimating stream temperature from air temperature: Implications for future water quality. J. Environ. Eng. 2005, 131, 139–146. [Google Scholar] [CrossRef]
- Harvey, R.; Lye, L.; Khan, A.; Paterson, R. The influence of air temperature on water temperaturę and the concentration of dissolved oxygen in Newfoundland Rivers. Can. Water Resour. J. 2011, 362, 171–192. [Google Scholar] [CrossRef]
- Cha, Y.; Cho, K.H.; Lee, H.; Kang, T.; Kim, J.H. The relative importance of water temperature and residence time in predicting cyanobacteria abundance in regulated rivers. Water Res. 2017, 124, 11–19. [Google Scholar] [CrossRef]
- Morales-Marín, L.A.; Sanyal, P.R.; Kadowaki, H.; Li, Z.; Rokaya, P.; Lindenschmidt, K.E. A hydrological and water temperature modelling framework to simulate the timing of river freeze-up and ice-cover breakup in large-scale catchments. Environ. Model. Softw. 2019, 114, 49–63. [Google Scholar] [CrossRef]
- Briciu, A.-E.; Mihaila, D.; Graur, A.; Oprea, D.I.; Prisacariu, A.; Bistricean, P.I. Changes in the water temperature of rivers impacted by the urban heat island: Case study of Suceava city. Water 2020, 12, 1343. [Google Scholar] [CrossRef]
- Wang, Y.; Zhang, N.; Wang, D.; Wu, J. Impacts of cascade reservoirs on Yangtze River water temperature: Assessment and ecological implications. J. Hydrol. 2020, 590, 125240. [Google Scholar] [CrossRef]
- Marszelewski, W.; Pius, B. Long-term changes in temperature of river waters in the transitional zone of the temperate climate: A case study of Polish rivers. Hydrol. Sci. J. 2016, 61, 1430–1442. [Google Scholar] [CrossRef]
- Bui, M.T.; Kuzovlev, V.V.; Zhenikov, Y.N.; Füreder, L.; Seidel, J.; Schletterer, M. Water temperatures in the headwaters of the Volga River: Trend analyses, possible future changes, and implications for a pan-European perspective. River Res. Appl. 2018, 34, 495–505. [Google Scholar] [CrossRef]
- Kaushal, S.S.; Likens, G.E.; Jaworski, N.A.; Pace, M.L.; Sides, A.M.; Seekell, D.; Belt, K.T.; Secor, D.H.; Wingate, R.L. Rising stream and river temperatures in the United States. Front. Ecol. Environ. 2010, 8, 461–466. [Google Scholar] [CrossRef]
- Basarin, B.; Lukić, T.; Pavić, D.; Wilby, R.L. Trends and multi-annual variability of water temperatures in the river Danube, Serbia. Hydrol. Process. 2016, 30, 3315–3329. [Google Scholar] [CrossRef]
- Chen, D.; Hu, M.; Guo, Y.; Dahlgren, R.A. Changes in river water temperature between 1980 and 2012 in Yongan watershed, eastern China: Magnitude, drivers and models. J. Hydrol. 2016, 533, 191–199. [Google Scholar] [CrossRef]
- Casado, A.; Hannah, D.M.; Peiry, J.-L.; Campo, A.M. Influence of dam-induced hydrological regulation on summer water temperature: Sauce Grande river, Argentina. Ecohydrology 2013, 6, 523–535. [Google Scholar] [CrossRef]
- Gallice, A.; Bavay, M.; Brauchli, T.; Comola, F.; Lehning, M.; Huwald, H. StreamFlow 1.0: An extension to the spatially distributed snow model Alpine3D for hydrological modelling and deterministic stream temperature prediction. Geosci. Model Dev. 2016, 9, 4491–4519. [Google Scholar] [CrossRef]
- Liu, H.; Sun, S.; Zheng, T.; Li, G. Prediction of water temperature regulation for spawning sites at downstream of hydropower station by artificial neural network method. Trans. Chin. Soc. Agric. Eng. 2018, 34, 185–191. [Google Scholar]
- Hari, R.E.; Livingstone, D.M.; Siber, R.; Burkhardt-Holm, P.; Güttinger, H. Consequences of climatic change for water temperature and brown trout populations in Alpine rivers and streams. Glob. Chang. Biol. 2006, 12, 10–26. [Google Scholar] [CrossRef]
- Abonyi, A.; Ács, É.; Hidas, A.; Grigorszky, I.; Várbíró, G.; Borics, G.; Kiss, K.T. Functional diversity of phytoplankton highlights long-term gradual regime shift in the middle section of the Danube River due to global warming, human impacts and oligotrophication. Freshw. Biol. 2018, 63, 456–472. [Google Scholar] [CrossRef]
- Ptak, M.; Nowak, B. Zmiany temperatury wody w Prośnie w latach 1965-2014. Woda-Środowisko-Obszary Wiejskie 2017, 17, 101–112. [Google Scholar]
- Liu, D.; Xu, Y.; Guo, S.; Xiong, L.; Liu, P.; Zhao, Q. Stream temperature response to climate change and water diversion activities. Stoch. Environ. Res. Risk Assess. 2018, 32, 1397–1413. [Google Scholar] [CrossRef]
- Soto, B. Climate-induced changes in river water temperature in North Iberian Peninsula. Theor. Appl. Climatol. 2018, 133, 101–112. [Google Scholar] [CrossRef]
- Fiziko-Gieograficzeskij Atłas Mira; Akademija Nauk SSSR i Gławnoje Uprawlenije Gieodezji i Kartografji GGK SSSR: Moskwa, Russia, 1964.
- Witek, M.; Bednorz, E.; Forycka-Łaawniczak, H. Kontynentaizm termiczny w Europie. Bad. Fizjogr. 2015, 66, 171–182. [Google Scholar]
- Anderson, T. The Statistical Analysis of Time Series; John Wiley & Sons: Hoboken, NY, USA, 2011; 704p. [Google Scholar]
- Volchak, A.; Choiński, A.; Kirviel, I.; Parfomuk, S. Spectral analysis of water level fluctuations in Belarusian and Polish lakes. Bull. Geogr. Phys. Geogr. Ser. 2017, 12, 51–58. [Google Scholar] [CrossRef]
- Družinin, V.; Sikan, A. Pajonirovanie territorii Severo-Zapada RF po uslovijam formirovanija godovogo stoka. In Vodnye Resursy Severo-Zapadnogo Regiona Rossii; Gidrometeorologicheskii Universitet: Saint Petersburg, Russia, 1999; pp. 24–29. [Google Scholar]
- Marple, S. Cifrovoj Spektral’nyj Analiz i Ego Priloženija; Mir: Moscow, Russia, 1972. [Google Scholar]
- Kajsl, Č. Analiz Vremennych Rjador Gidrologičeskich Dannych; Gidrometeoizdat: Leningrad, Russia, 1972. [Google Scholar]
- Box, G.; Jenkins, G. Time Series Analysis: Forecasting and Control; Holden-Day: San Francisco, CA, USA, 1970. [Google Scholar]
- Balyani, Y.; Niya, G.F.; Bayaat, A. A study and prediction of annual temperature in Shiraz using ARIMA model. J. Geogr. Space 2014, 12, 127–144. [Google Scholar]
- El-Mallah, E.S.; Elsharkawy, S.G. Time-series modeling and short term prediction of annual temperature trend on Coast Libya using the box-Jenkins ARIMA Model. Adv. Res. 2016, 6, 1–11. [Google Scholar] [CrossRef]
- Etuk, H.E.; Moffat, U.I.; Chims, E.B. Modelling monthly rainfall data of portharcourt, Nigeria by seasonal box-Jenkins method. Int. J. Sci. 2013, 2, 60–67. [Google Scholar]
- Akaike, H. A new look at the statistical model identificatio. IEEE Trans. Autom. Control 1974, 19, 716–723. [Google Scholar] [CrossRef]
- Schwarz, G. Estimating the dimension of a mode. Ann. Stat. 1978, 6, 461–464. [Google Scholar] [CrossRef]
- Boryczka, J.; Stopa-Boryczka, M. Cykliczne wahania temperatury i opadów w Polsce w XIX-XXI wieku. Acta Agrophys. 2004, 3, 21–33. [Google Scholar]
- Ptak, M.; Choiński, A.; Kirviel, J. Long-term water temperature fluctuations in coastal rivers (Southern Baltic) in Poland. Bull. Geogr. Phys. Geogr. Ser. 2016, 11, 35–42. [Google Scholar] [CrossRef]
- Žganec, K. The effects of water diversion and climate change on hydrological alteration and temperature regime of karst rivers in central Croatia. Environ. Monit. Assess. 2012, 184, 5705–5723. [Google Scholar] [CrossRef]
- Hrdinka, T.; Vlasák, P.; HaveL, L.; Mlejnská, E. Possible impacts of climate change on water quality in streams of the Czech Republic. Hydrol. Sci. J. 2015, 60, 192–201. [Google Scholar] [CrossRef]
- Jonkers, A.R.T.; Sharkey, K.J. The differential warming response of Britain’s rivers (1982–2011). PLoS ONE 2016, 11, 0166247. [Google Scholar] [CrossRef]
- Kędra, M. Regional response to global warming: Water temperature trends in semi-natural mountain river systems. Water 2020, 12, 283. [Google Scholar] [CrossRef]
- Morrison, J.; Quick, M.C.; Foreman, M.G.G. Climate change in the Fraser River watershed: Flow and temperature projections. J. Hydrol. 2002, 263, 230–244. [Google Scholar] [CrossRef]
- Dugdale, S.J.; Allen Curry, R.; St-Hilaire, A.; Andrews, S.N. Impact of Future Climate Change on Water Temperature and Thermal Habitat for Keystone Fishes in the Lower Saint John River. Can. Water Resour. Manag. 2018, 32, 4853–4878. [Google Scholar] [CrossRef]
- Hardenbicker, P.; Viergutz, C.; Becker, A.; Kirchesch, V.; Nilson, E.; Fischer, H. Water temperature increases in the river Rhine in response to climate change. Reg. Environ. Chang. 2017, 17, 299–308. [Google Scholar] [CrossRef]
- Arora, R.; Tockner, K.; Venohr, M. Changing river temperatures in northern Germany: Trends and drivers of change. Hydrol. Process. 2016, 30, 3084–3096. [Google Scholar] [CrossRef]
- Ptak, M. Long-term temperature fluctuations in rivers of the Fore-Sudetic region in Poland. Geografie 2018, 123, 279–294. [Google Scholar] [CrossRef]
- Jurgelenaite, A.; Kriaučiuniene, J.; Šarauskiene, D. Spatial and temporal variation in the water temperature of Lithuanian rivers. Baltica 2012, 25, 65–76. [Google Scholar] [CrossRef]
- Latkovska, I.; Apsite, E. Long-term changes in the water temperature of rivers in Latvia. Proc. Latv. Acad. Sci. Sect. B Nat. Exactand Appl. Sci. 2016, 70, 78–87. [Google Scholar] [CrossRef]
- Riđanović, L.; Riđanović, S.; Jurica, D.; Spasojević, P.; Bijedić, D. Evaluation of Water Temperature and Dissolved Oxygen Regimes in River Neretva. BALWOIS 2 Ohrid 2010, 25, 29. [Google Scholar]
- Rajwa-Kuligiewicz, A.; Bialik, R.J.; Rowiński, P.M. Dissolved oxygen and water temperature dynamics in lowland rivers over various timescales. J. Hydrol. Hydromech. 2015, 63, 353–363. [Google Scholar] [CrossRef]
- Leuven, R.S.E.W.; Hendriks, A.J.; Huijbregts, M.A.J.; Lenders, H.J.R.; Matthews, J.; van der Velde, G. Differences in sensitivity of native and exotic fish species to changes in river temperature. Curr. Zool. 2011, 57, 852–862. [Google Scholar] [CrossRef]
- Kriaučiūnienė, J.; Virbickas, T.; Šarauskienė, D.; Jakimavičius, D.; Kažys, J.; Bukantis, A.; Kesminas, V.; Povilaitis, A.; Dainys, J.; Akstinas, V.; et al. Fish assemblages under climate change in Lithuanian rivers. Sci. Total Environ. 2019, 661, 563–574. [Google Scholar] [CrossRef]


| Values of the Model Parameters | ACF | PACF |
|---|---|---|
| p = 1 | Exponential, decaying to zero | Sharply distinguished value for lag 1, there are no correlations on other lags |
| p= 2 | Alternating positive and negative, decaying to zero | Sharply distinguished value for lags 1 and 2, there are no correlations on other lags |
| q = 1 | Sharply distinguished value for lag 1, there are no correlations on other lags | Exponential, decaying to zero |
| q = 2 | Sharply distinguished value for lags 1 and 2, there are no correlations on other lags | Alternating positive and negative, decaying to zero |
| p = 1, q = 1 | Exponential, decaying to zero from lag 1 | Exponential, decaying to zero from lag 1 |
| Month/Year Station | 11 | 12 | 1 | 2 | 3 | 4 | 5 | 6 | 7 | 8 | 9 | 10 | Year |
|---|---|---|---|---|---|---|---|---|---|---|---|---|---|
| Water Temperature | |||||||||||||
| Oder–Brzeg | 6.2 | 2.9 | 1.9 | 2.4 | 4.9 | 9.4 | 15.4 | 17.8 | 20.1 | 19.7 | 16.0 | 11.3 | 10.7 |
| Oder–Słubice | 5.6 | 2.3 | 1.4 | 1.6 | 4.4 | 9.5 | 15.5 | 19.0 | 20.2 | 20.1 | 15.9 | 10.8 | 10.5 |
| Neman–Grodno | 3.4 | 0.8 | 0.3 | 0.3 | 1.6 | 8.3 | 15.5 | 19.3 | 20.8 | 19.9 | 14.5 | 8.6 | 9.4 |
| Neman–Smalininkai | 3.9 | 1.1 | 0.4 | 0.3 | 1.3 | 6.7 | 14.2 | 18.4 | 20.3 | 19.6 | 14.7 | 8.9 | 9.2 |
| Air Temperature | |||||||||||||
| Opole | 4.2 | 0.3 | −1.1 | 0.3 | 3.8 | 8.7 | 13.9 | 16.8 | 18.7 | 18.2 | 14.1 | 9.4 | 8.9 |
| Gorzow Wlkp | 3.8 | 0.5 | −1.0 | 0.0 | 3.5 | 8.4 | 13.5 | 16.6 | 18.5 | 18.0 | 13.8 | 9.0 | 8.7 |
| Grodno | 2.0 | −2.2 | −4.3 | −3.6 | 0.6 | 7.0 | 12.9 | 16.1 | 18.0 | 17.1 | 12.4 | 7.1 | 6.9 |
| Raseiniai | 1.7 | −2.3 | −4.4 | −4.0 | −0.1 | 6.0 | 11.9 | 15.2 | 17.2 | 16.4 | 11.8 | 6.7 | 6.3 |
Publisher’s Note: MDPI stays neutral with regard to jurisdictional claims in published maps and institutional affiliations. |
© 2021 by the authors. Licensee MDPI, Basel, Switzerland. This article is an open access article distributed under the terms and conditions of the Creative Commons Attribution (CC BY) license (https://creativecommons.org/licenses/by/4.0/).
Share and Cite
Choiński, A.; Ptak, M.; Volchak, A.; Kirvel, I.; Valiuškevičius, G.; Parfomuk, S.; Kirvel, P.; Sidak, S. Effect of Air Temperature Increase on Changes in Thermal Regime of the Oder and Neman Rivers Flowing into the Baltic Sea. Atmosphere 2021, 12, 498. https://doi.org/10.3390/atmos12040498
Choiński A, Ptak M, Volchak A, Kirvel I, Valiuškevičius G, Parfomuk S, Kirvel P, Sidak S. Effect of Air Temperature Increase on Changes in Thermal Regime of the Oder and Neman Rivers Flowing into the Baltic Sea. Atmosphere. 2021; 12(4):498. https://doi.org/10.3390/atmos12040498
Chicago/Turabian StyleChoiński, Adam, Mariusz Ptak, Alexander Volchak, Ivan Kirvel, Gintaras Valiuškevičius, Sergey Parfomuk, Pavel Kirvel, and Svetlana Sidak. 2021. "Effect of Air Temperature Increase on Changes in Thermal Regime of the Oder and Neman Rivers Flowing into the Baltic Sea" Atmosphere 12, no. 4: 498. https://doi.org/10.3390/atmos12040498
APA StyleChoiński, A., Ptak, M., Volchak, A., Kirvel, I., Valiuškevičius, G., Parfomuk, S., Kirvel, P., & Sidak, S. (2021). Effect of Air Temperature Increase on Changes in Thermal Regime of the Oder and Neman Rivers Flowing into the Baltic Sea. Atmosphere, 12(4), 498. https://doi.org/10.3390/atmos12040498