Article

Aircraft Observations of Characteristics and Growth of Ice Particles of Two Different Snowfall Clouds in Shanxi Province, China

1
Key Laboratory for Aerosol-Cloud-Precipitation of China Meteorological Administration, Nanjing University of Information Science & Technology, Nanjing 210044, China
2
Shanxi Artificial Precipitation Enhancement and Lightning Protection Technical Center, Taiyuan 030032, China
3
Key Laboratory for Cloud Physics of China Meteorological Administration, Beijing 100029, China
4
Laboratory of Cloud-Precipitation Physics and Severe Storms, Institute of Atmospheric Physics, Chinese Academy of Sciences, Beijing 100029, China
5
Shanxi Weather Modifification Office, Xi’an 710014, China
*
Author to whom correspondence should be addressed.
Atmosphere 2021, 12(4), 477; https://doi.org/10.3390/atmos12040477
Submission received: 10 March 2021 / Revised: 4 April 2021 / Accepted: 6 April 2021 / Published: 9 April 2021
(This article belongs to the Section Meteorology)

Abstract

:
The ice crystal habits, distributions and growth processes in two snowfall cloud cases on 29 November 2009 and 3 March 2012 in northern China were compared and analyzed with aircraft data. The results showed that ice crystal habits were affected by the height of ice clouds. Ice crystals in clouds with cloud top temperatures of −12.6 °C were predominantly needle, plate, dendrite and irregular. When the cloud top temperature was lower than −19.5 °C, plates, dendrites and irregular ice crystals were observed in addition to needles, capped-column crystals were observed in the lower and middle layers of clouds, and column crystals were observed in the upper layer of clouds. The liquid water content of the two snowfall processes was lower than 0.1 g·m−3. Ice particles grew mainly via deposition, riming and aggregation processes. On 29 November, the liquid water content of the stratospheric mixed snowfall cloud was distributed in the lower part of the cloud. The maximum values of particle concentration and ice water content detected by a cloud imaging probe were 187 L−1 and 1.05 g·m−3, which were at −8.7 °C, and the ice water content was higher. On 3 March, the liquid water content of snowfall in stratiform clouds was located in the middle layer, and the maximum ice water was low, which was only 0.052 g m−3. The ice water value on 29 November was higher, which was mainly due to the convective zone embedded in the cumulus mixed cloud containing a large number of riming and aggregated snow crystals. Using an exponential function to fit the crystal spectrum of the two snowfall processes, N0 and λ were 109−1011 m−4 and 108−1010 m−4 and 103−104 m−1 and 104 m−1, respectively. Compared with 3 March, N0 on 29 November was larger and the variation range of λ was one more order of magnitude. N0 and λ conformed to a power function distribution. By analyzing the scatter plot of the correlation coefficient and slope, it was found that the exponential function can accurately express the crystal spectrum of snow clouds.

1. Introduction

It is very important to research the size, shape and concentration of ice crystals to better understand the physical process of snow cloud formation and the radiation effects of global climate change [1]. Different shapes of ice crystal particles have different scattering characteristics, which correspond to different microphysical and radiation characteristics [2,3]. The study of ice crystal shape can promote ice cloud remote sensing and radiation transfer simulations.
In nature, ice crystal particles show many different shapes. Laboratory studies show that ice crystals take on different shapes based on the temperature and humidity of the environment [4]. With the development of microparticle observation instruments, ice crystal particles are divided into various types [5,6,7,8,9,10,11,12]. Under different temperature and humidity conditions, the growth rate of ice crystals differs along the vertical surface and prism surface [10,13]. When the supersaturation is high, the shapes of ice crystals change from flake to needle, column, plate and dendrite and then back to flake and finally column sheath. The critical temperatures of change are −4 °C, −9 °C and −22 °C. When the supersaturation is low, shapes change from short columns and thick plates to short columns, and the change temperatures are −9 °C and −22 °C [14,15].
The shape of the snow crystal spectrum distribution is very important for the prediction of precipitation and radiation processes. The accurate distribution of the snow crystal spectrum can also be used for the prediction of radiation and radar processes. Many scholars worldwide have investigated snow crystal spectrum distributions by aircraft [16,17,18]. McFarquhar et al. [19] and Heymsfield et al. [20] confirmed that most of the spectral distributions of snow crystals can be well expressed in exponential form. Field and Heymsfield [21] proved that the variation in fitting parameters with temperature in the exponential form of the snow crystal spectrum may be caused by many microphysical processes, such as sublimation, deposition and collision of ice particles. McFarquhar and Black [17] pointed out that there was a correlation between temperature and the fitting parameters N0 and λ of the exponential distribution of the snow crystal spectrum.
Some aircraft observations of snowfall cloud structures have been carried out [22,23,24]. China carried out aircraft observations on the microstructure of winter snowfall clouds in Xinjiang and studied the nucleation of ice crystals, the impact of snow crystals on supercooled cloud droplets, and the collision and climbing of dendritic snow crystals [25,26,27].
Snowfall is the main weather process and precipitation source in winter in northern China. Shanxi is located on the Loess Plateau of North China. Due to the special geography and topography, the spatial and temporal distribution of snowfall is extremely uneven, which makes the occurrence mechanisms, development processes and microphysical structures of snowfall more complex and unique. In this paper, the vertical distribution characteristics of ice and snow crystals in different regions of different weather conditions are analyzed by combining the cloud particles detected by aircraft with radar data along the flight path. We analyzed the vertical distribution of ice and snow crystal morphology with temperature, the microphysical process of the formation and growth of ice and snow crystal morphology, and the distribution and corresponding spectral type parameters of ice and snow crystals under different weather conditions and combined these findings with the detection data, including particle spectra and liquid water and ice water content data and images. The results provide a scientific basis for further understanding the snow formation mechanism and improving the parameterization process of clouds in models.

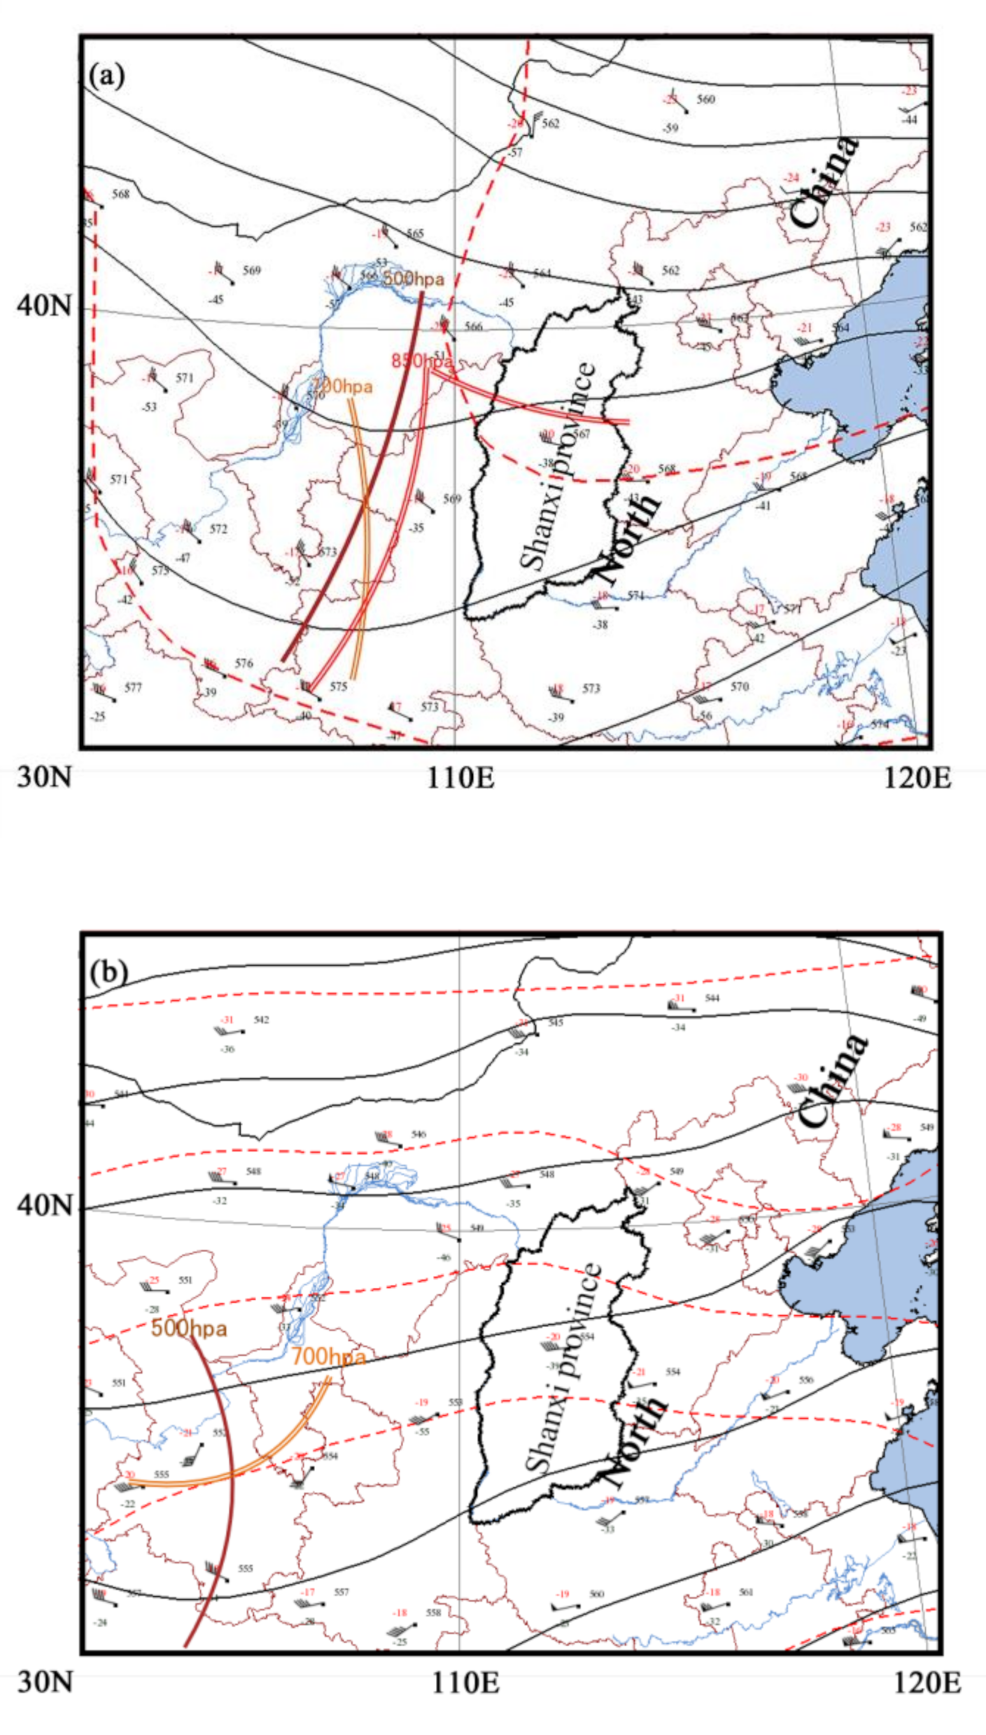
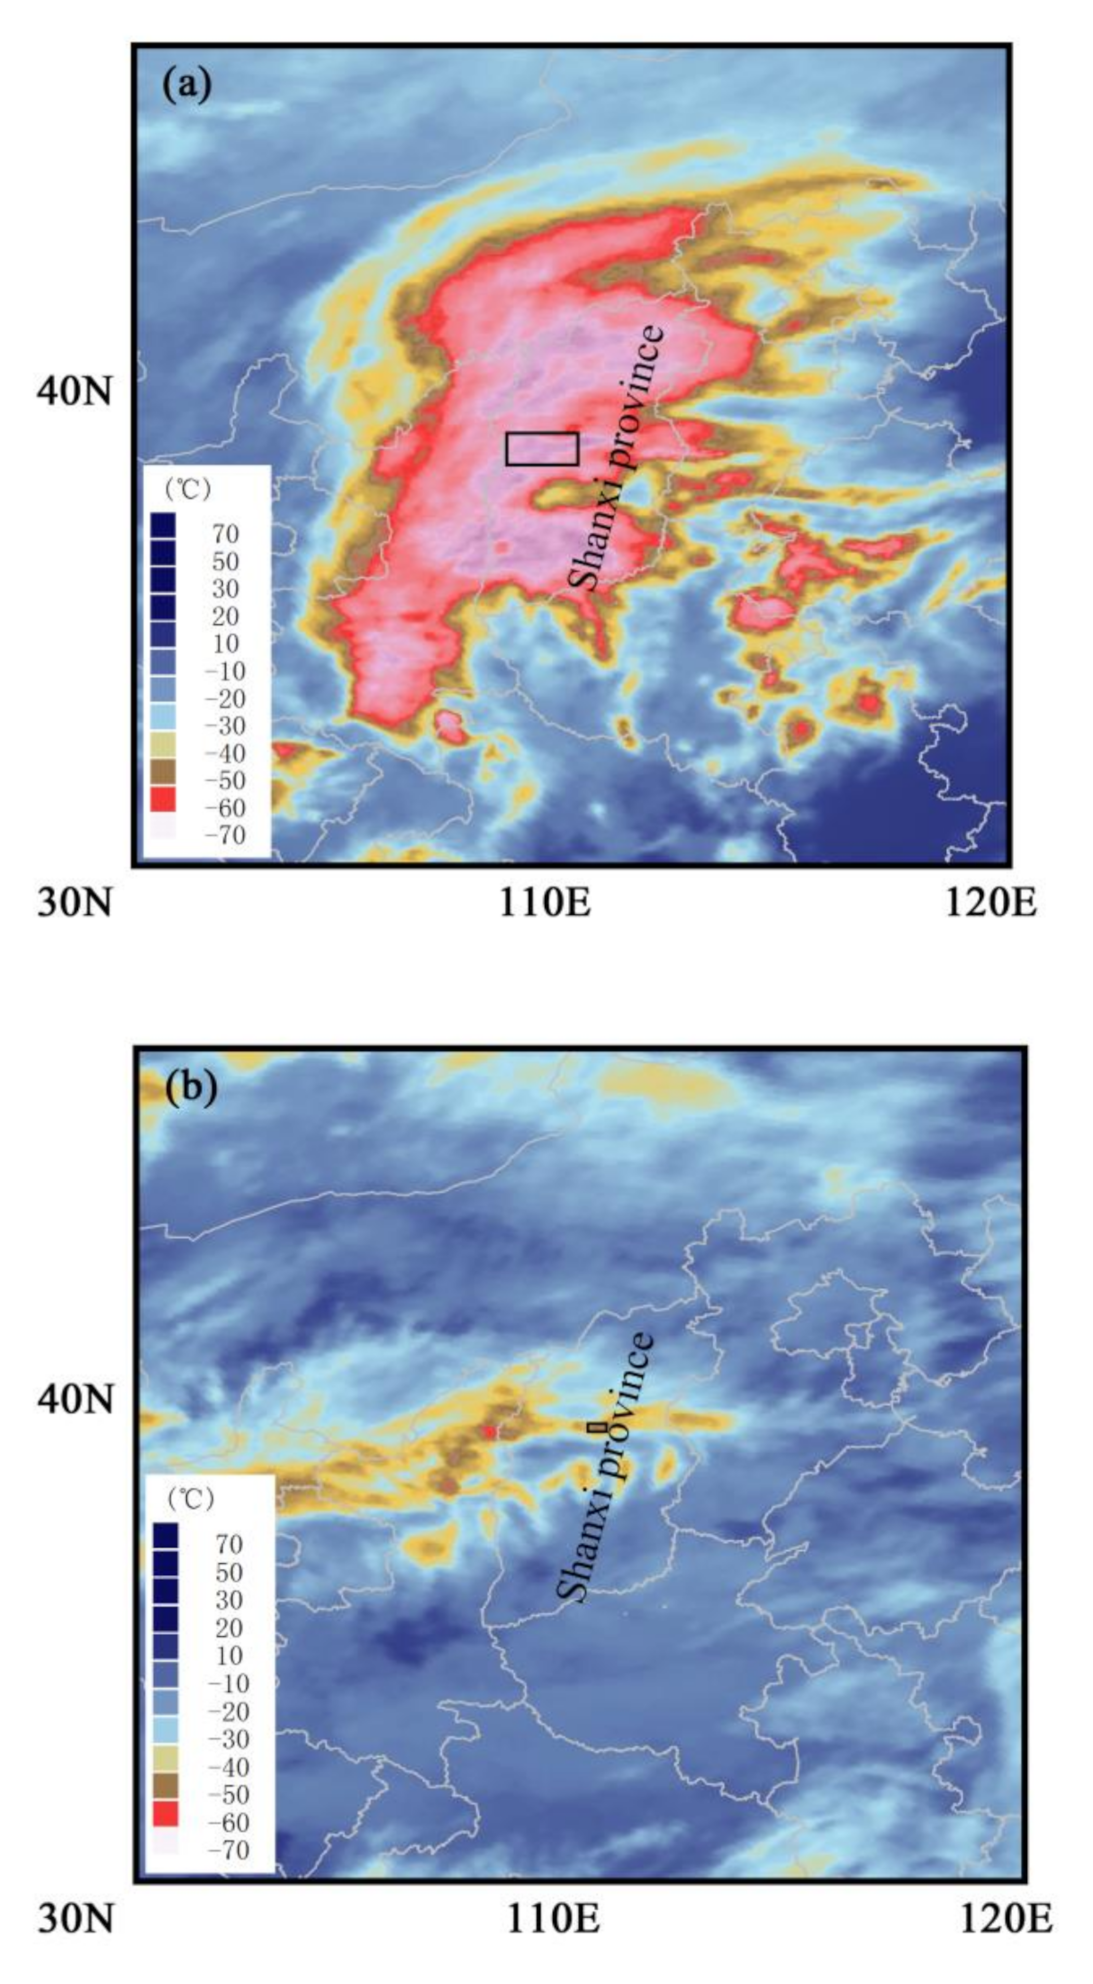
2. Synoptic Situation

The observation data used in this section mainly involve synoptic situations, FY-2C infrared cloud images and radar reflectivity. The synoptic situation on 29 November 2011 over Shanxi Province was primarily influenced by the combination of a high trough, low-level shear and ground cold front. For 08:00 LST (Local Standard Time, which is 8 h later than UTC; all times are listed in LST), the 500 hPa low trough was located in the Hetao area. At 700 hPa and 850 hPa, one shear line was located in the eastern part of Hetao to the west of Shanxi Province and a convergence of easterly cold and southwest warm airflow was observed from the Bohai Sea and south of the Yangtze River to Shanxi Province in the vicinity of the shear line. The surface cold front was located in the central part of Inner Mongolia. From 08:00 on 29 November to 08:00 on 30 November, a wide range of snowfall occurred in Shanxi, with snowfall of 0.0 to 22.2 mm over 24 h and snow depths from 1 to 18 cm. The snowfall was mainly light to moderate snow, with heavy snow occurring in some areas (Figure 1a). Affected by the high-altitude shortwave trough and low-level warm shear, a sustained light snow process occurred in Shanxi Province on 3 March. The snowfall amount ranged from 0.0 to 2.4 mm from 08:00 on 3 March to 08:00 on 4 March, and the snow depth ranged from 0 to 1.2 cm (Figure 1b).
The FY-2C infrared cloud image at 08:30 on 29 November shows that Shanxi Province was covered with large and dense cloud clusters with a deep cloud system. The cloud top brightness temperature was low, indicating that the cloud top height was high (Figure 2a). At 10:30 on 3 March, the central part of Shanxi Province was covered by a southwest northeast zonal cloud system. The infrared cloud image was yellow, and the cloud top height was lower than that on 29 November. According to the visible light cloud map, medium and low clouds were dominant. The cloud was scattered and the cloud thickness was uneven. (Figure 2b).
Figure 3 reveals the observed plan position indicator (PPI) of radar intensity from the C-band. A Doppler weather radar is located in Taiyuan City (the capital of Shanxi Province, located in the middle of Shanxi Province). On 29 November, the snow echo was relatively uniform and continuous in the range of 150 km. The snowfall echo was flake, and the main echo strength was below 25 dBZ, accompanied by a strong echo center of 35 dBZ. At 09:02, the aircraft passed through a strong echo area. On 3 March, the echo was mainly distributed near Taiyuan, showing a block inhomogeneous structure. The maximum echo intensity was below 20 dBZ.

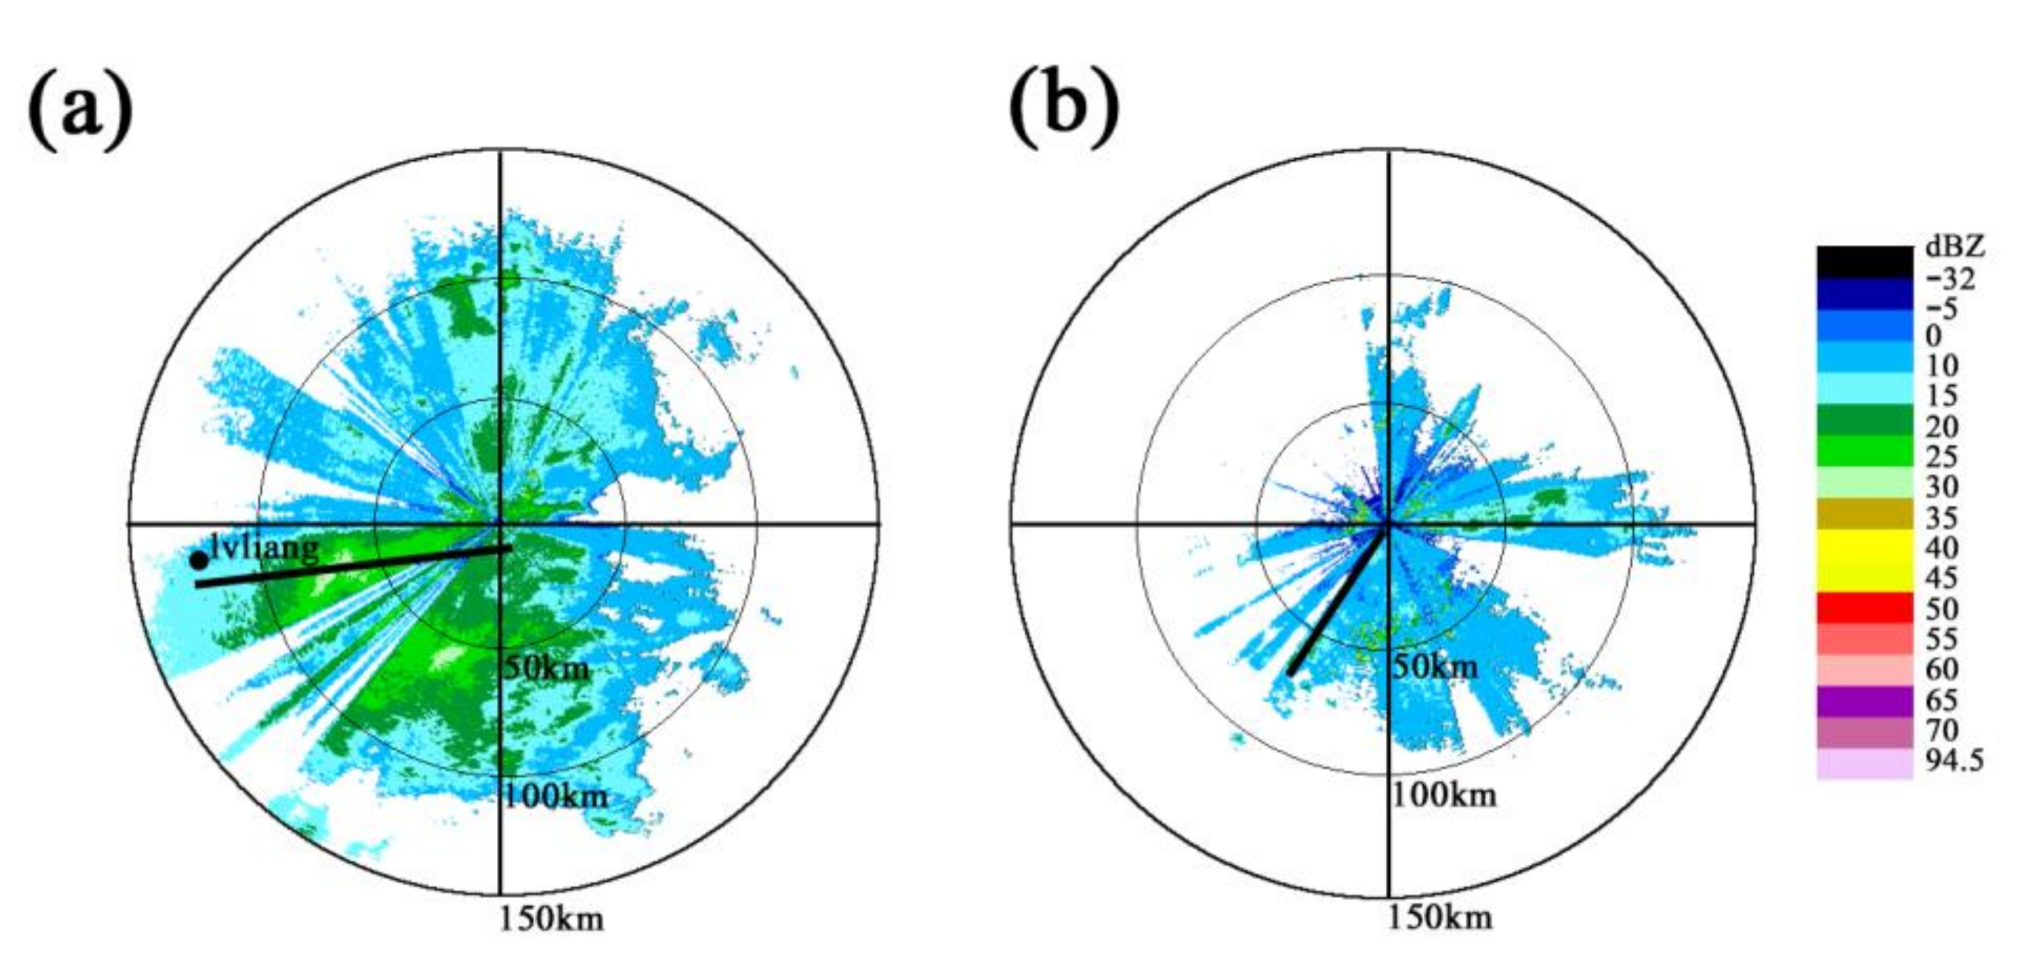
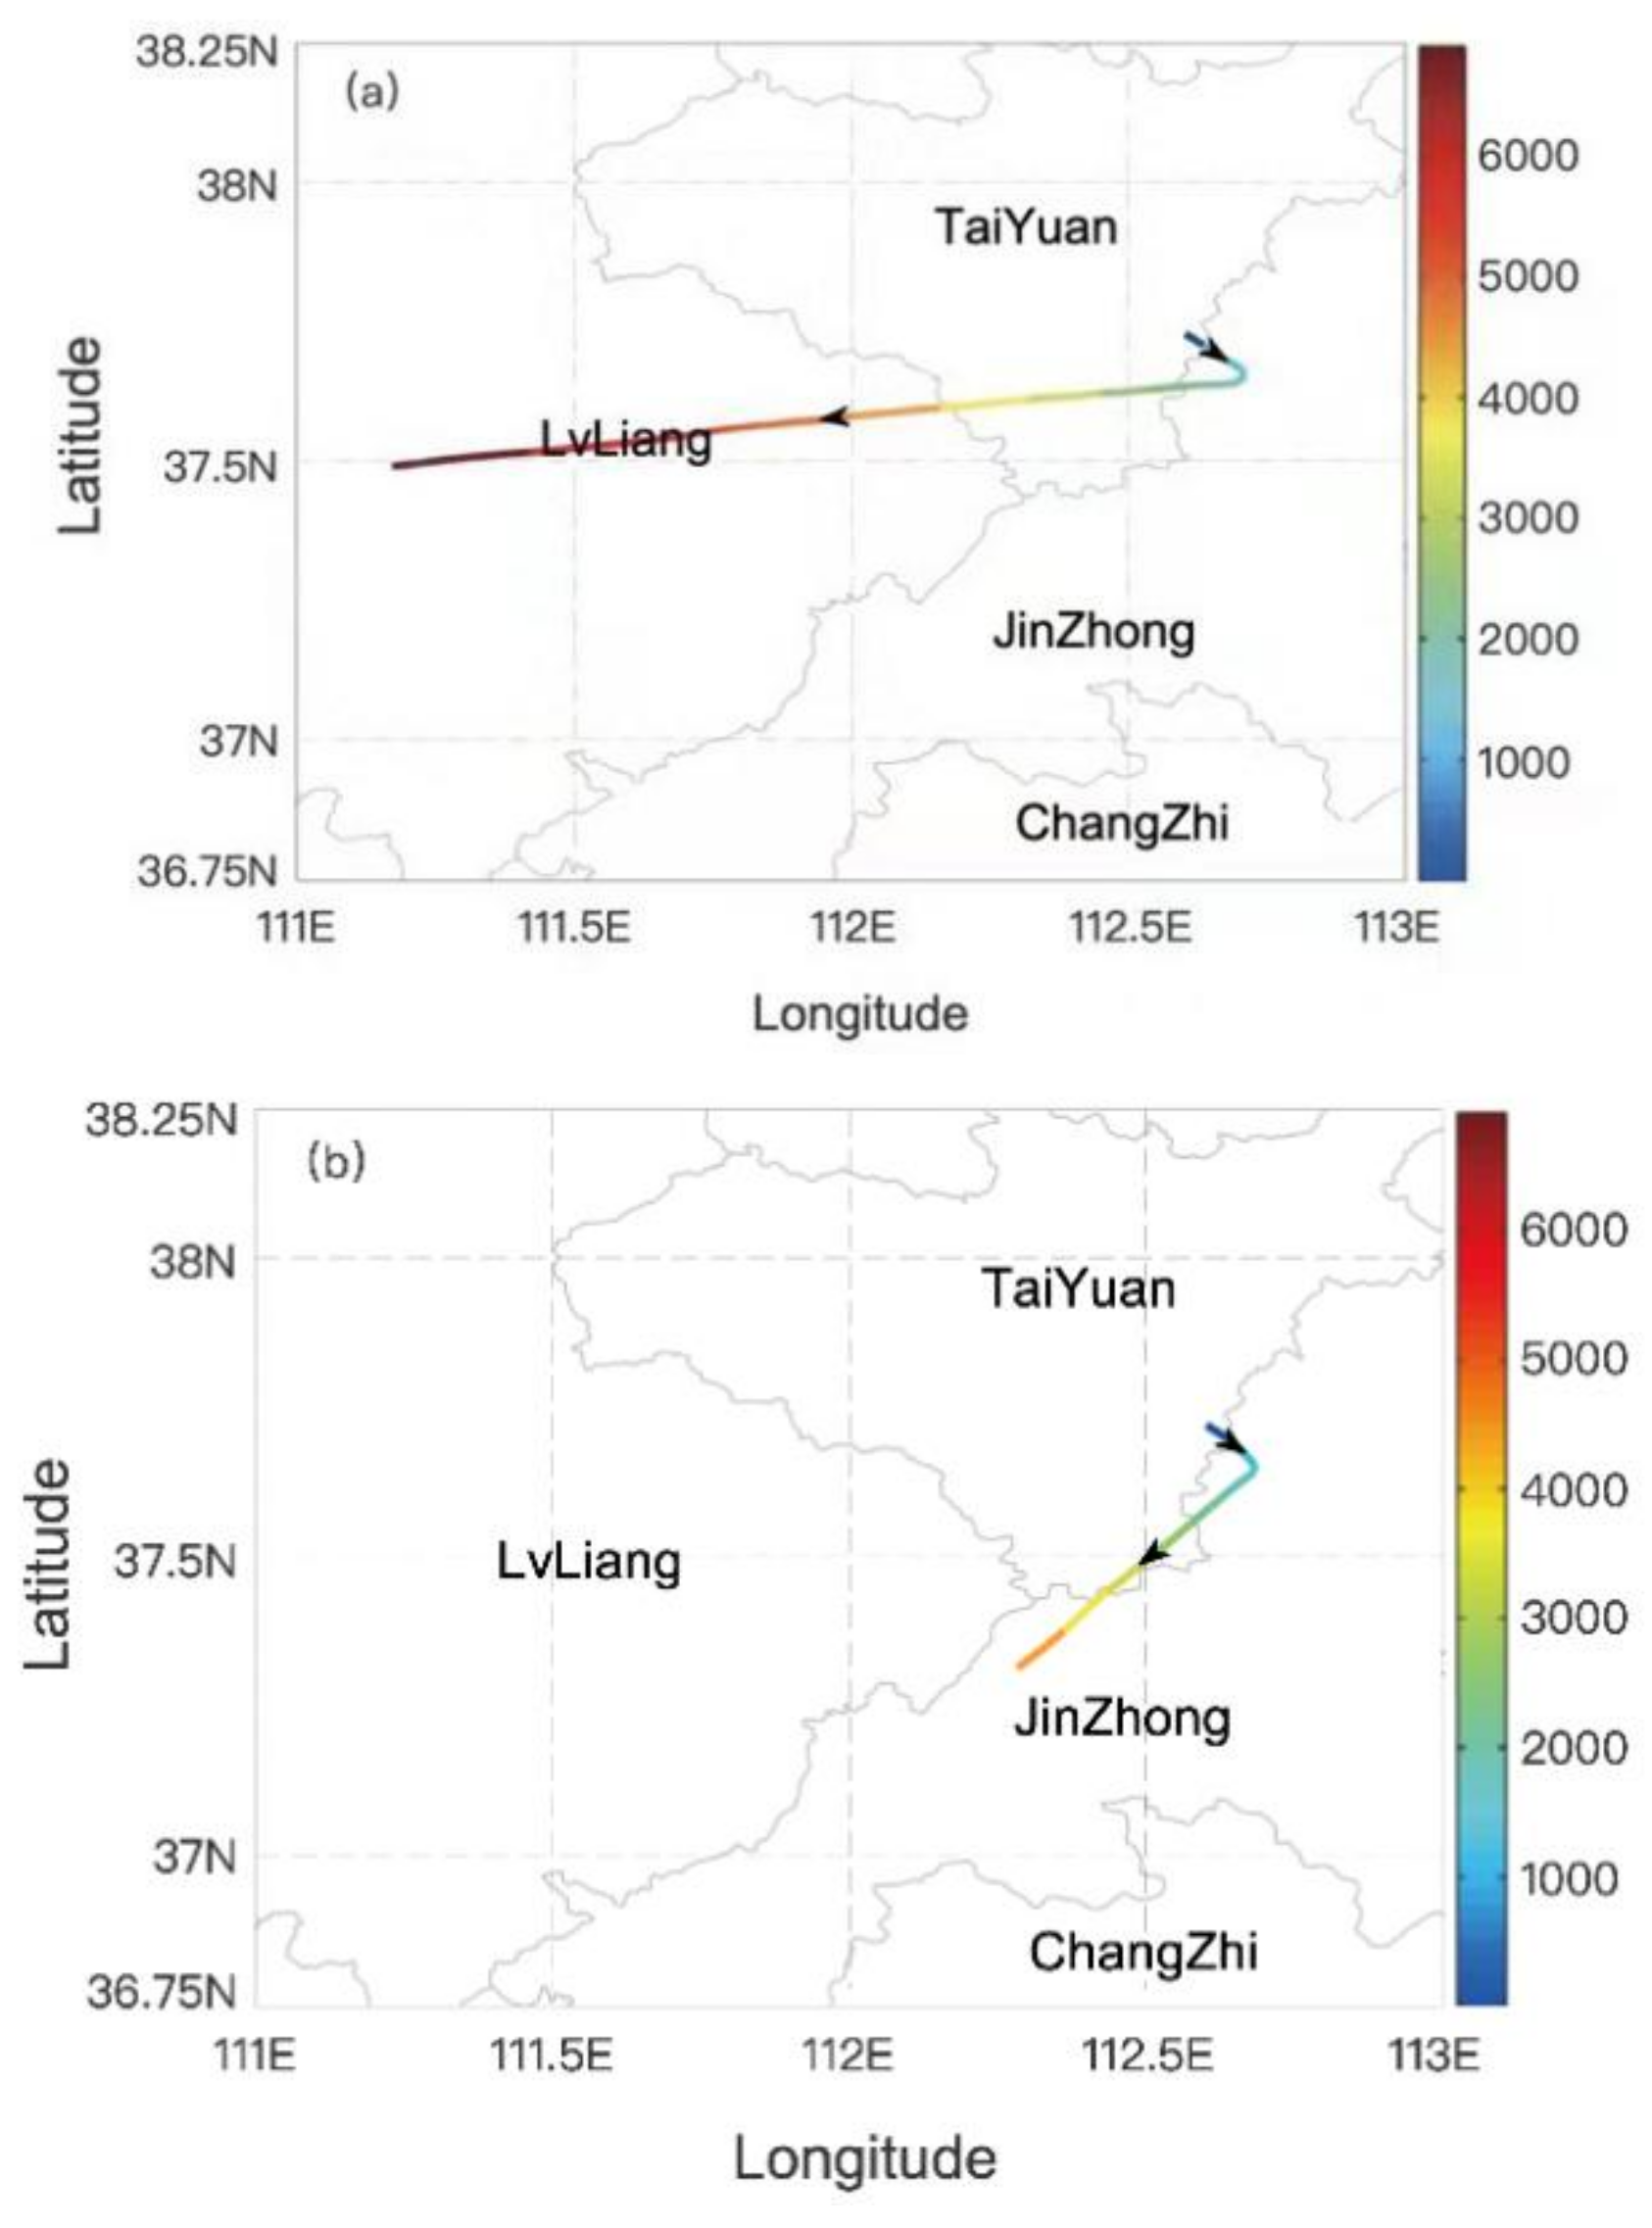
3. Field Study and Instrumentation

In this study, the Shanxi Y-12 carried a Droplet Measurement Technologies (DMT) Inc. AIMMS-20 Air-Data Probe, liquid water content, cloud imaging probe (CIP: 25 to 1550 μm, bin: 62) and precipitation imaging probe (PIP: 100 to 6200 μm, bin: 62) to provide 2D images and a cloud droplet probe (CDP: 2 to 50 μm, bin: 30) to sample cloud droplets. The aircraft was equipped with a temperature and humidity probe, pitot and global positioning system.
On 29 November (Figure 4a) at 08:37, the plane took off from Taiyuan, which is located in the middle of Shanxi Province. There was light snow when the plane took off and climbed. At 10:21, it reached Lvliang, which is located in western Shanxi Province, and then climbed to 6395 m (T = −19.5 °C), but it did not reach the cloud top. On 3 March (Figure 4b), the plane took off from Taiyuan at 09:53. There was light snow when taking off and as it kept climbing after taking off. At 10:14, it reached Jinzhong near Taiyuan at an altitude of 4523 m (T = −12.6 °C), and the cloud top height was 4200 m.
The first level data from the CIP and PIP are eliminated because of an error of the laser beam, which leads to errors in the sampling area and concentration. The ice water content and liquid water content are calculated based on aircraft observations. According to Mitchell et al. [28], the ice water content is calculated using the mass diameter relationship from the particle spectrum data detected by the CIP. The calculation formula is as follows:
M = 0.022D2.0
where M (mg) is the mass of a single ice phase particle and D (mm) is the maximum diameter (range 0.20–7.7 mm). The formula is applicable to the calculation of ice particles with and without riming.
The liquid water content is calculated from the particle number concentration detected by CDP in our study, which requires a summation in the following form:
LWC   =   π / 6 × ρ × D i 3 × n D i / V
where i is the number of discrete size bins in the particle size spectrum, n(Di) is the particle count in the ith bin (/m3), Di is the mean diameter for each bin (mm) and ρ is the density of water (g/m3). Particles with 2 < D < 50 μm were considered spherical liquid water. Sample volume is defined as follows:
V   =   SE × TAS × T
where TAS is the true air speed, T is the sample time and SE is the sample area.

4. Microphysical Structure of Clouds

4.1. Ice Particle Image Analysis

In this study, CIP and PIP particle images were classified into five types via visual inspection: needle columnar, dendritic, plate-shaped, capped-column and irregular. Figure 5 shows the vertical distribution of typical ice and snow crystal particle images with temperature and relative humidity collected on 29 November 2011 and 3 March 2012.
The shape of ice crystals depends on the temperature inside the cloud [7,29]. Figure 5a shows that the temperature range of the flight on 29 November is approximately −19.5 to 1 °C and the relative humidity range is approximately 69% to 90%. The observed particle imageries mainly include needle columnar, dendritic, plate-shaped, capped-column and irregular types. Above 5.7 km (−16 °C), types are dominated by irregular single particles. From 5.7 km to 4.9 km (−16 to −11 °C), irregular and columnar particles are dominant and dendritic particles appear. Columnar ice crystals are observed in relatively high ice clouds [30]. From 4.9 km to 2.9 km (−11 to −3 °C), the number of dendritic particles begins to increase and aggregation begins to dominate. A number of riming particles also appears. In addition, there are capped-column, columnar and irregular particles. The relative humidity in the clouds below 2.9 km (−3 to 1 °C) is approximately 89%, which is dominated by aggregation, and the riming particles continue to increase. A large number of needles and a small amount of capped-column particles appear at 2.9−1.7 km (−3 to −2 °C). Because the ground temperature is slightly higher than 0 °C, the ice and snow crystals near the ground (below 1.7 km) partially melt. Korolev et al. [31] found that the distribution of particle imagery observed in natural clouds does not conform to the Magono‒Lee map and the distribution of ice crystal imagery with temperature in this snowfall does not completely conform to the Magono‒Lee map [7]. Laboratory studies have proven that dendritic ice and snow crystals should be formed in the −15 to −10 °C layer. In this process, a large number of dendritic ice and snow crystals appear at −10 to −2 °C, which indicates that these particles should fall down from a higher level. The capped-column ice crystals appeared at −11 to −2 °C on 29 November. Previous studies showed that capped-column ice crystals cannot be formed in this temperature range [32] and that the capped-column ice crystals in this layer may be formed from higher clouds (−18 to −25 °C); moreover, columnar ice crystals falling through clouds (−13 to −18 °C) are suitable for the formation of plate ice crystals, and plate ice crystals are formed at both ends of columnar ice crystals.
The temperature range of the flight on 3 March 2012 was approximately −12.6 to −1.4 °C, and the relative humidity range was approximately 49% to 80%. The observed particle imageries mainly include needle, dendritic, plate-shaped and irregular. The morphology of ice and snow crystals observed above 3.6 km (−12 °C) is mainly dendritic and plate-shaped, with a small amount of needle ice and snow crystals. There are a large number of dendritic and aggregating ice and snow crystals and a small amount of plate-shaped ice and snow crystals observed at 3.6–2.6 km (−12 to −10 °C). The morphology of ice and snow crystals observed at 2.6−1.9 km (−10 to −7 °C) is mainly plate-shaped, with a small amount of dendritic ice and snow crystals. From 1.9 km to the ground (−7 to −1.4 °C), the results show that the morphology of ice and snow crystals is mainly dendrites and aggregates.

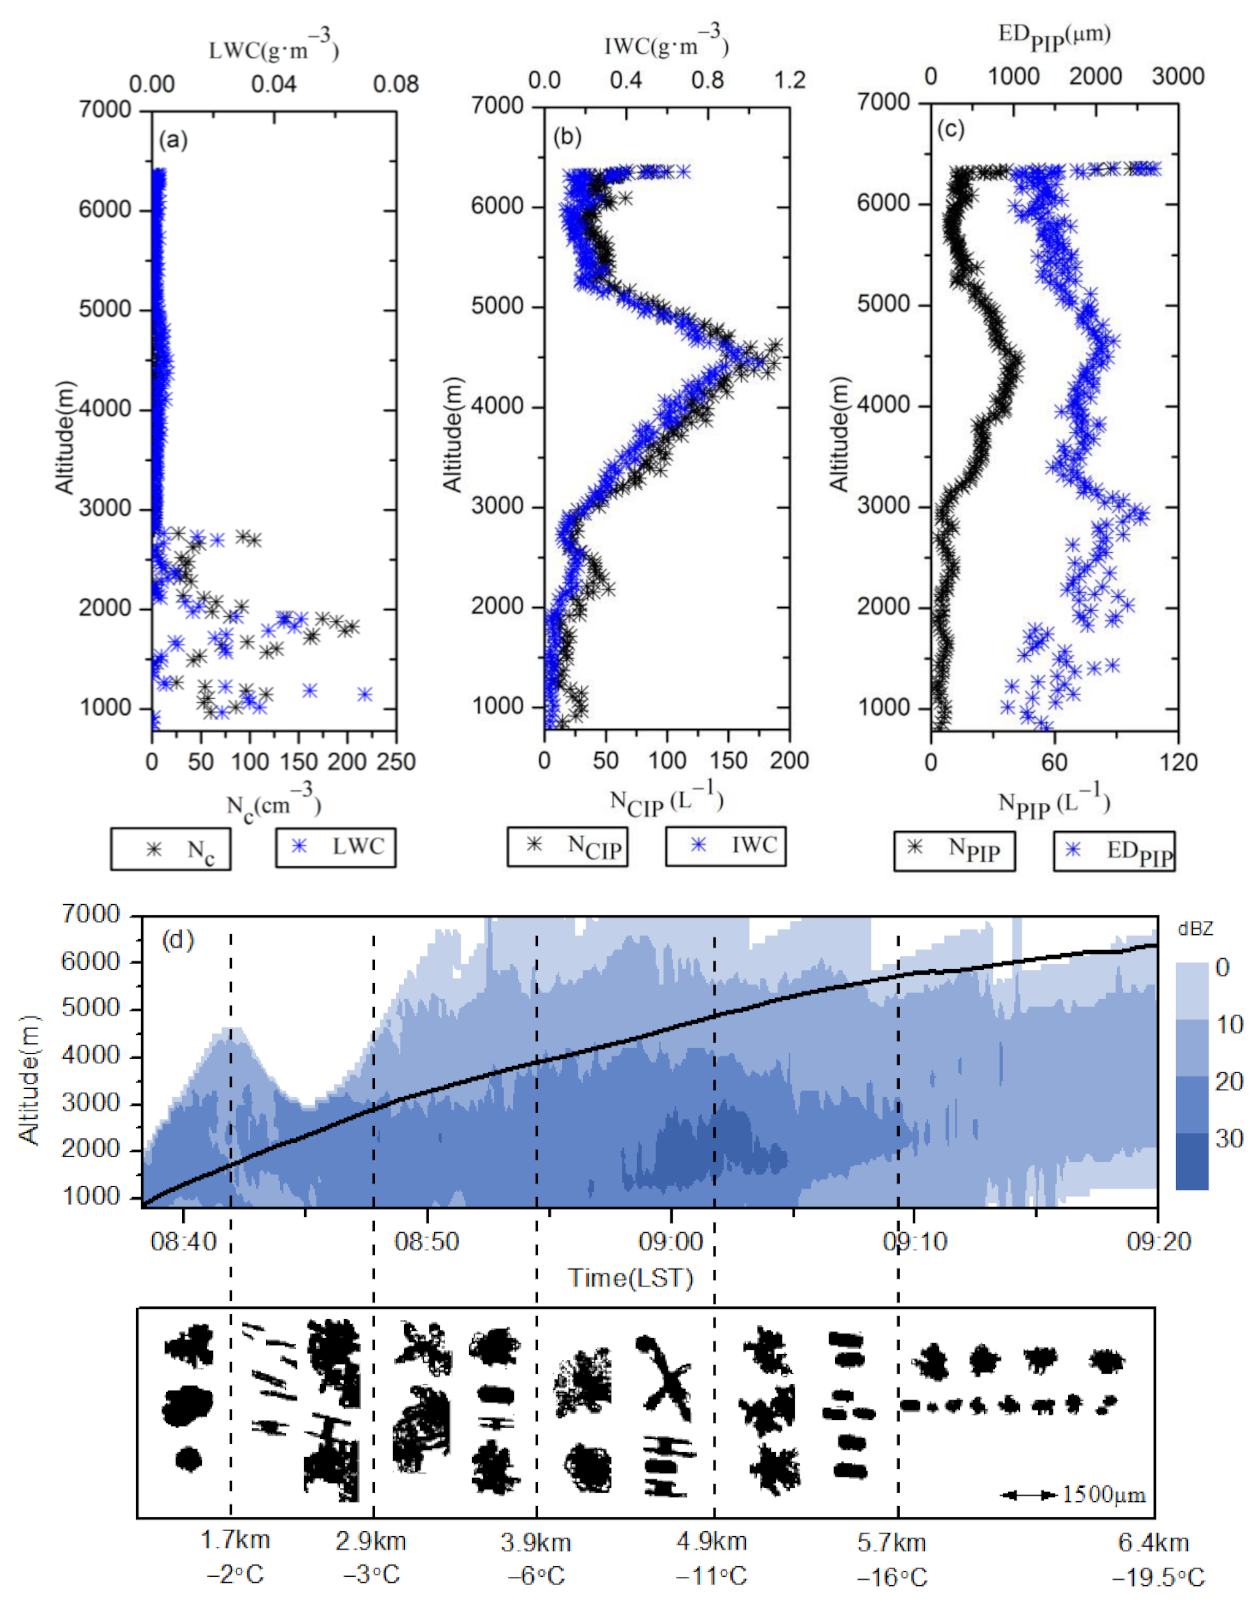
4.2. Vertical Distribution of Microphysical Characteristics of Snowfall Clouds

By analyzing the vertical distribution of microphysical characteristics of ice and snow crystals, we can understand the formation mechanism and growth process of snowfall clouds. In this paper, according to the intensity of the radar echo of snowfall clouds, the flight area is divided by altitude.

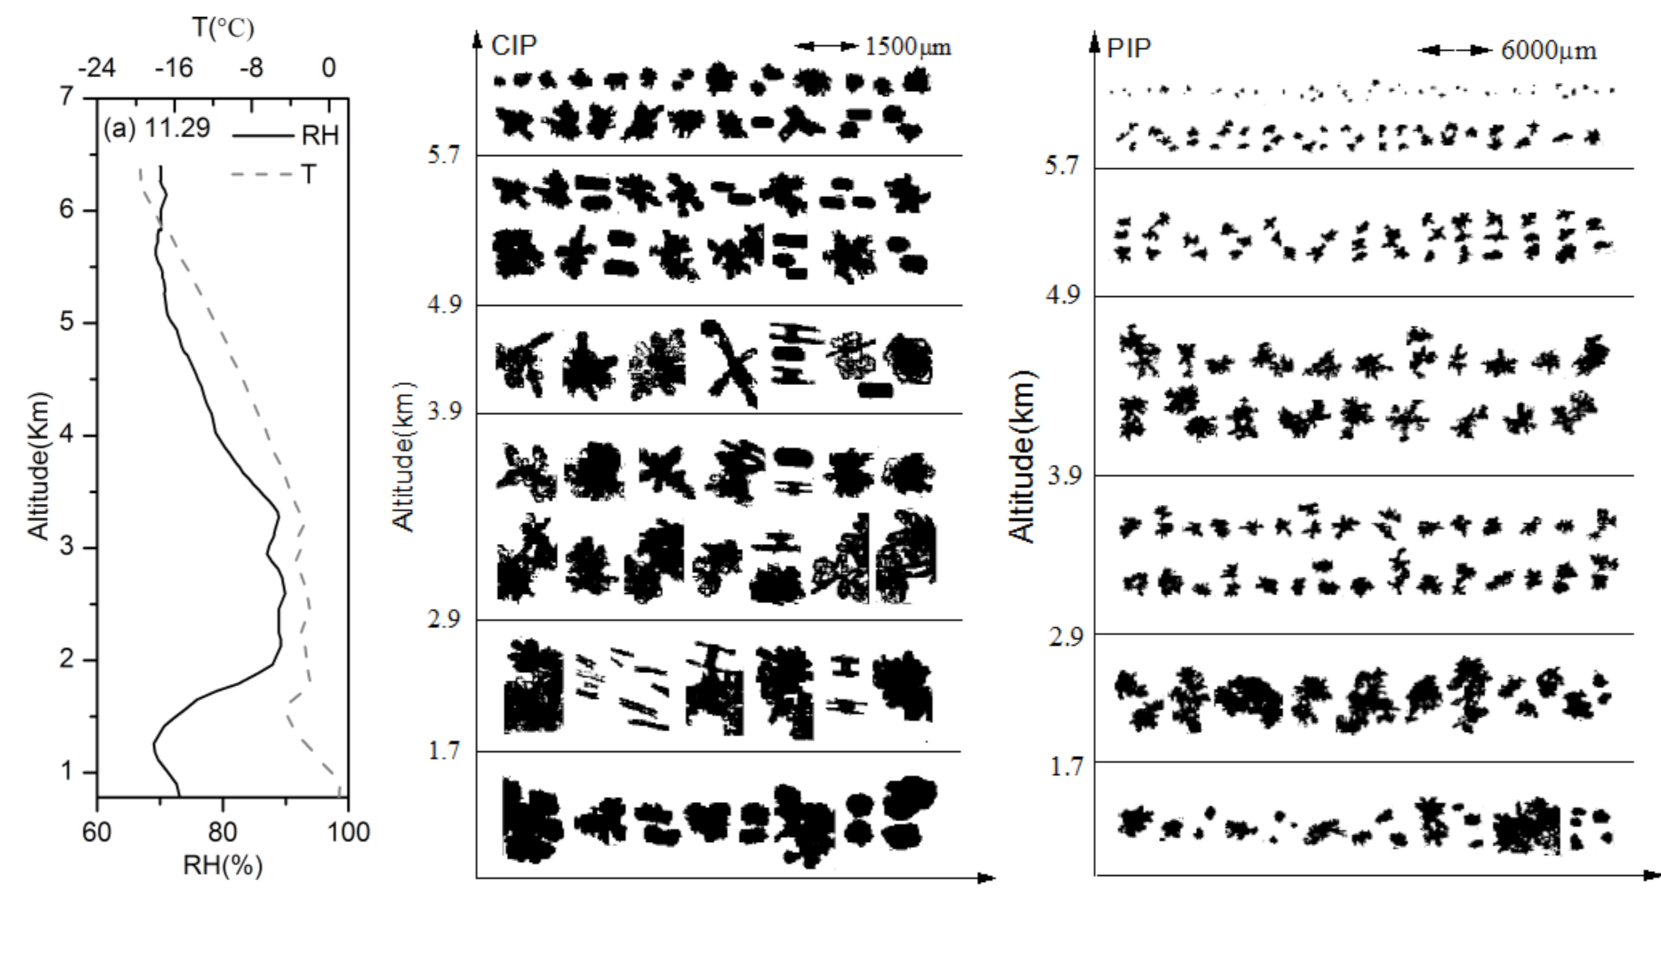
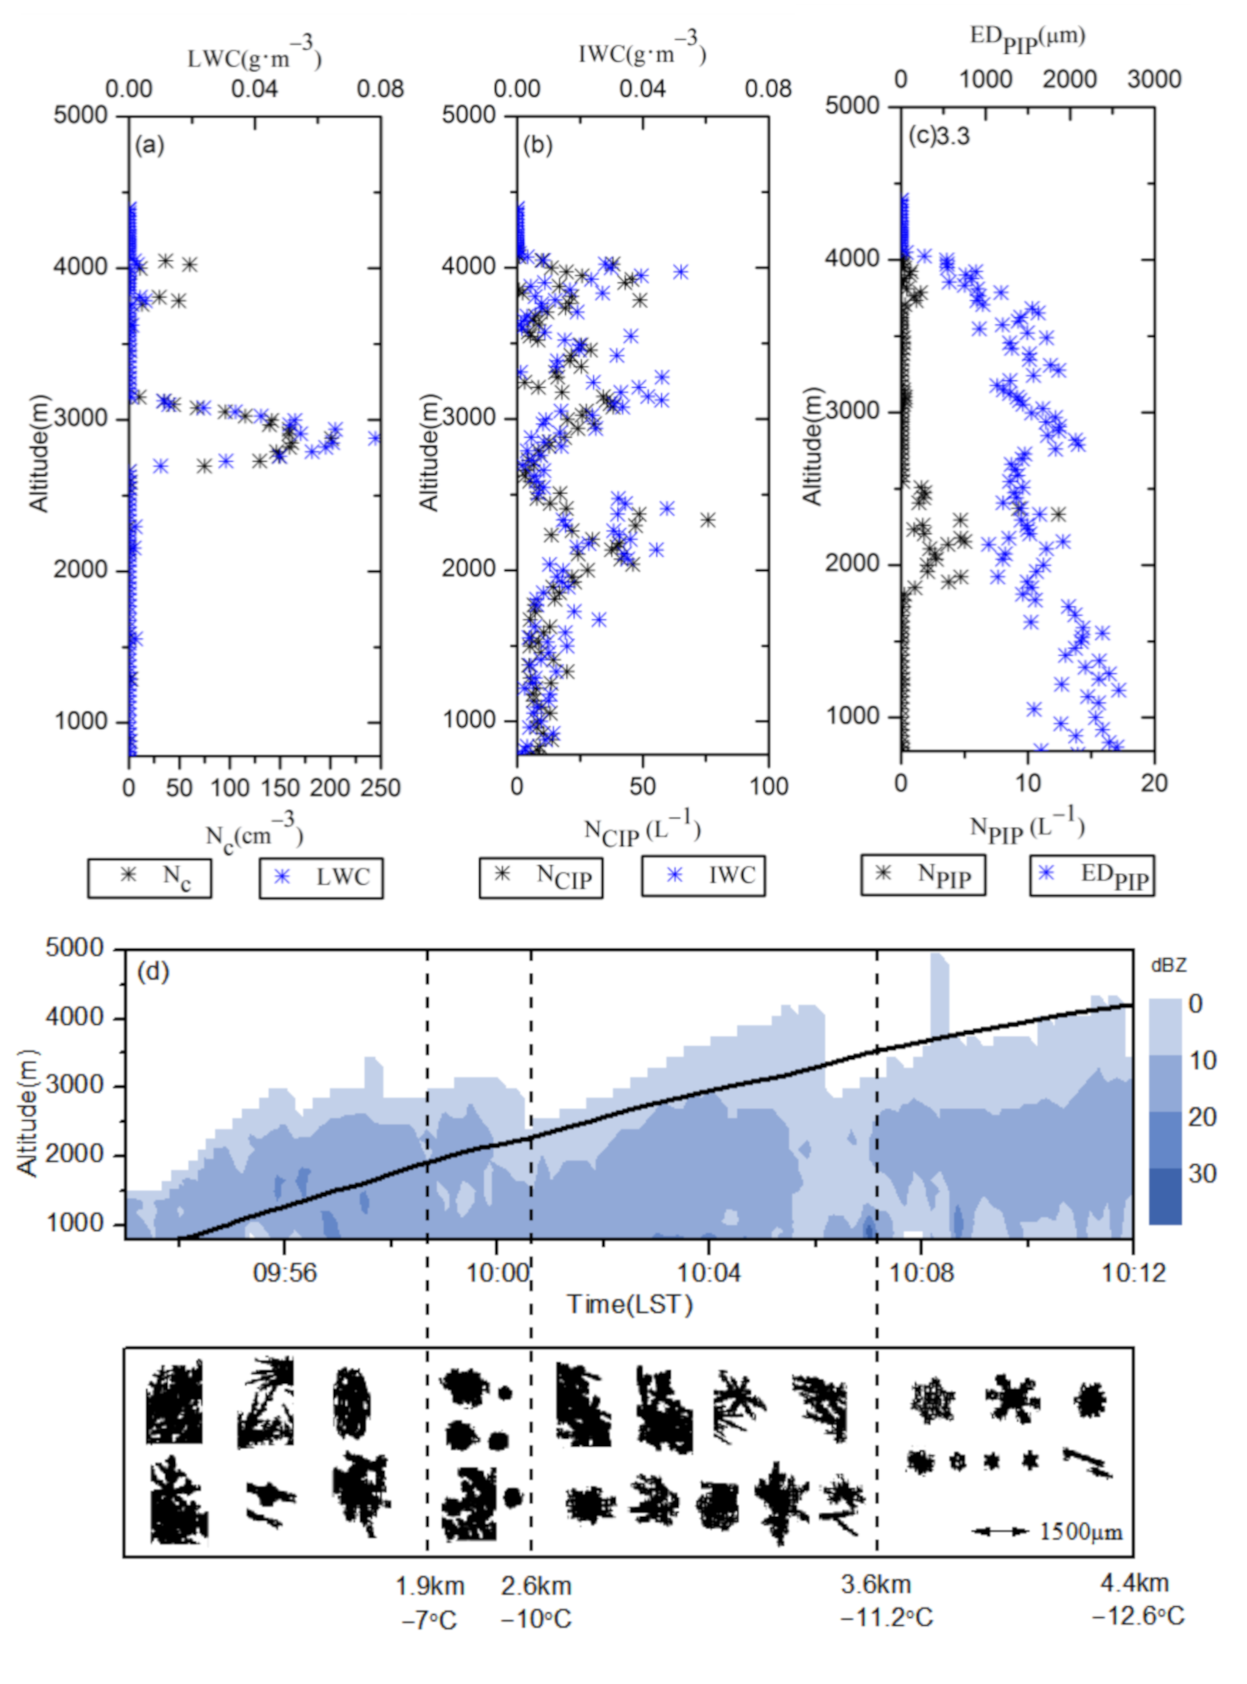
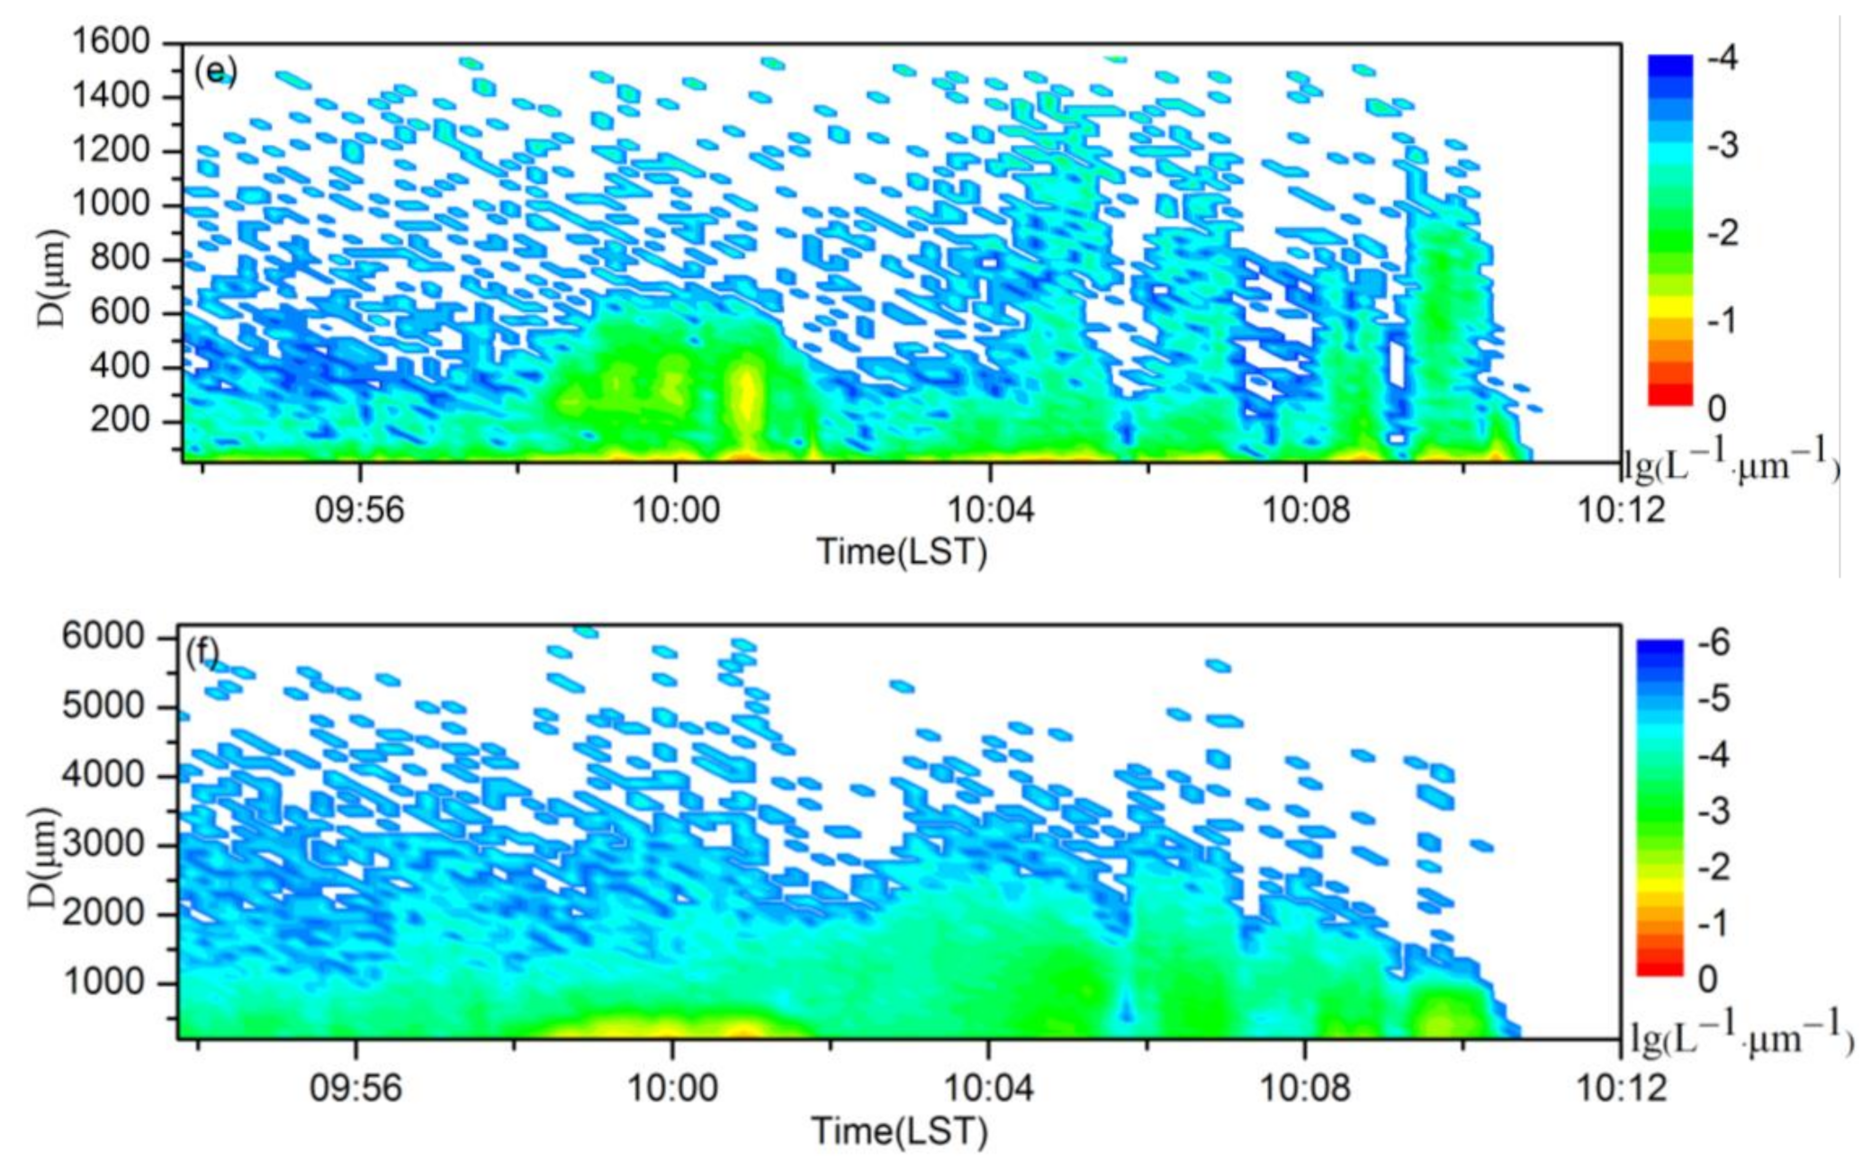
4.2.1. Cumulus Mixed Cloud Snowfall on 29 November 2011

Figure 6 shows the distribution of radar echo, cloud microphysical characteristics and ice and snow crystal morphology corresponding to the process of the aircraft penetrating clouds on 29 November 2011. At 6.4–5.7 km (−19.5 to −16 °C), an aircraft passes through the upper part of the deep stratiform clouds, the echo intensity passing through the cloud is approximately 10 dBZ, and the cloud top height is higher than 6.4 km (−19.5 °C). Most of the observed ice and snow crystal images are irregular. According to the particle spectra of the CIP and PIP, most of the particles are smaller than 200 μm. The main growth is via deposition.
At 5.7−3.9 km (−16 to −6 °C), the aircraft passes through the upper part of the deep stratocumulus clouds, the echo intensity is from 10 to 20 dBZ, and the cloud top height is higher than 6.4 km (−19.5 °C). The liquid water content is lower, and the ice and snow crystal number concentration and ice water content initially increase and then decrease with increasing height. Due to the existence of convective bubbles in the clouds, the peak values of ice and snow crystal number concentration and ice water content are 187 L−1, 42 L−1 and 1.05 g·m−3 at 4442 m (−8.7 °C), which are much higher than those at other altitudes. The particle images collected by the PIP indicated that the process of ice crystal aggregation is one of the main processes of particle growth. From the particle image collected by the CIP shown in Figure 5a, it can be seen that the ice crystals in the cloud have riming growth, but due to the low content of liquid water, the degree of riming is small. The instantaneous spectra observed by the CIP and PIP shows that the particle spectra are gradually broadened. Over 4.9 km, the relative humidity in the clouds dropped to approximately 70% and a large number of columnar ice crystals appeared.
At 3.9–2.9 km (−6 to −3.2 °C), the aircraft passes through deep stratiform clouds. The echo intensity is approximately 20 dBZ, and the cloud top height is higher than 6.4 km (−19.5 °C). The observed particle morphology includes plate, column, dendrite and capped-column shapes, with plate-shaped ice and snow crystals dominating. According to the particle image in Figure 5a, aggregation has occurred. The liquid water content is reduced in the range of 103 to 104 g·m3, and the ice and snow crystal number concentration and ice water content increase with increasing altitude. The relative humidity from 2.9 to 3.5 km is higher than 85% (see Figure 5a), and the relative humidity from 3.5 to 3.9 km decreases gradually. With the decrease in relative humidity, the effective diameter of ice and snow crystals in clouds decreases significantly (see Figure 6c).
The echo intensity is between 20 and 30 dBZ when passing through the relatively shallow stratiform cloud below 2.9 km, and the height of the echo top varies between 3 and 4.5 km (−3 to −9 °C). The distribution of liquid water is uneven, with a low value of less than 0.01 g·m−3 and a peak value of 0.07 g·m−3. The areas with high liquid water contents are shown in Figure 6g at 08:39:03 and 08:42:33, which have liquid water contents of 0.07 g m−3 and 0.05 g m−3, respectively. The maximum diameters of cloud droplets are 46 μm and 22 μm, respectively. The riming of ice crystals is obvious and stronger than 3.9 to 2.9 km. Due to the influence of relative humidity, temperature and updraft, the distribution of high ice water content and high liquid water content with height is inconsistent. The peak value of ice water content is 0.18 g·m−3 at 2.75 km (−2.9 °C). A large number of needle ice and snow crystals are formed in this temperature layer and then mature as deposition.
The radar echo intensity is in good agreement with the distribution of the cloud particle spectrum. With the broadening of the particle spectrum, the radar echo is also enhanced.

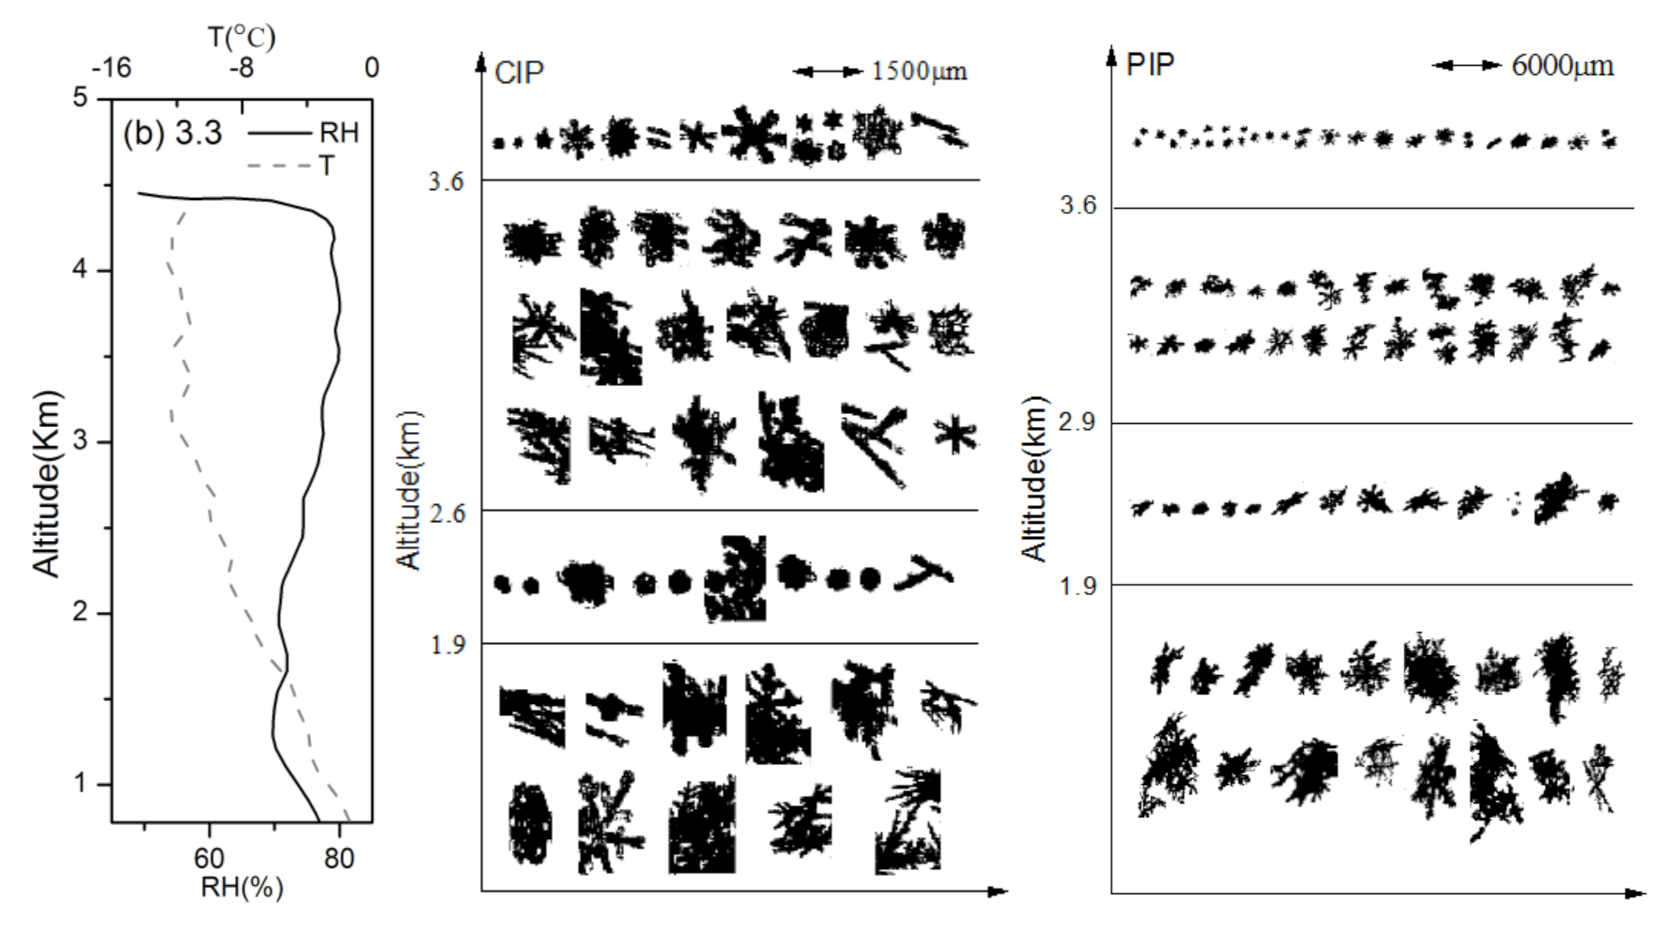
4.2.2. Stratiform Cloud Snowfall on 3 March 2012

Figure 7 shows the distribution of radar echo, cloud microphysical characteristics and ice and snow crystal morphology corresponding to the process of aircraft penetrating clouds on 3 March. According to the radar profile along the aircraft trajectory in Figure 7d, the horizontal distribution of echoes is uneven. The main echo intensity is below 20 dBZ, and the echo top height is from 3 to 4.2 km. The observation reaches the cloud top. The echo top height of 10 to 20 dBZ is mainly distributed in 2.5−3 km. According to the vertical distribution of cloud microphysical characteristics with height in Figure 7a, liquid water is mainly concentrated at 2650 to 3150 m and a small amount of liquid water is distributed at the cloud top. The particle number concentration and ice water content detected by the CIP are mainly distributed from 1850 to 4100 m and fluctuate with height. The particle number concentrations larger than 10 L−1, detected using the PIP, are mainly distributed from 1850 to 2500 m and near the cloud top. The effective diameter of the particles gradually increases with decreasing height, and the diameter of the particles reaching the ground is approximately 2500 μm.
The echo intensity of 4.4 to 3.6 km is less than 10 dBZ, and the height of the cloud top is 4.2 km. In the vicinity of the cloud top (4150 m, −12.6 °C), there are round, plate-shaped ice and snow crystals. With decreasing height (4150 to 3850 m, −12.6 to −11.7 °C), a large number of star-shaped and plate-shaped ice and snow crystals are formed. With the height decreasing further (3850 to 3600 m, −11.7 to −11.2 °C), the star-shaped and plate-shaped ice and snow crystals grow further, with some growing into dendritic ice and snow crystals and needle ice and snow crystals appearing at the same time. With increasing deposition, the maximum particle number concentrations obtained by the CIP and PIP are 49 L−1 and 1.2 L−1 at 400 m below the cloud top. The particle diameter is less than 2000 μm, and the maximum ice water content is 0.052 g·m−3, which is low.
The echo intensity of 3.6 to 2.6 km (−11.2 to −10 °C) is less than 10 dBZ, and the distribution of echo top height is uneven. Depths from 3.6 to 2.6 km contain liquid water, which is suitable for the growth of dendritic ice crystals. Dendritic and aggregating ice and snow crystals are primarily observed. In the region of 3.1 to 2.7 km with liquid water, ice crystals grow by both riming and aggregation. The peak particle number concentration detected by the CIP is 37 L−1, and that detected by the PIP is less than 1 L−1. The particle spectrum observed by the CIP and PIP is wider than that observed from 4.4 to 3.6 km (see Figure 7e,f 10:02 to 10:07).
The echo intensity of 2.6 to 1.9 km (−10 to −7 °C) is less than 20 dBZ, and the echo top height is 3 km (−10.5 °C). A large number of plate-shaped ice and snow crystals (09:58 to 10:12, see Figure 7e) with diameters less than 600 μm and a small number of large dendritic snowflakes and aggregates are observed. The concentration of ice crystals detected by the CIP varies from 13 to 76 L−1, and the maximum concentration of particles detected by the PIP is 9 L−1, which may be due to entering another cloud.
Below 1.9 km, the echo intensity is between 10 and 20 dBZ. The echo top height is 3 km. The morphology of ice and snow crystals is mainly dendritic and aggregate. Since the suitable temperature for the formation of dendritic ice and snow crystals is −12 to −18 °C [9] and the temperature below 1.9 km is between −7 and −1.4 °C, dendritic ice and snow crystals at this altitude mainly fall from the lower temperature. Needle ice and snow crystals appear at 1.9 to 1.6 km (−7 to −5 °C). The temperature range of 0 to −8 °C is suitable for the formation of plate and needle ice and snow crystals [15]. These needle and column particles begin at this temperature layer and then grow as deposition.
There is a good correlation between radar echo intensity and particle spectrum width detected by the PIP, although the radar echo is stronger at the same particle spectrum width at 10:04, which is related to the riming growth of ice crystals.
During the process of stratiform cloud snowfall on 3 March, the cloud top temperature was −12.6 °C, and the ice and snow crystal images were dendritic, plate and needle. Compared with 3 March, the cloud top temperature on 29 November was lower than −19.5 °C, and the types of ice and snow crystals observed were greater than those on 3 March. In addition to dendritic, plate and needle ice and snow crystals, columnar cap, columnar and more irregular ice and snow crystals were also observed, which is why the ice water content on 29 November is higher than that on 3 March. In both processes, the peak area of ice and snow crystal number concentration was observed in the upper part of the snowfall cloud, which was dominated by deposition growth, and the peak area of ice and snow crystal number concentration was formed in the middle part of the cloud, which was dominated by aggregation and riming growth. The dendritic snow ice crystals in the lower part of the cloud are formed by falling from the lower temperature part of the cloud. On 29 November, liquid water of the cumulus mixed snowfall was mainly distributed in the lower part of the cloud. The maximum values of particle number concentration and ice water content detected by the CIP and PIP appeared at −8.7 °C, which was located in the upper part of the strong echo center. On 3 March, liquid water of stratiform snowfall was mainly distributed in the middle of the cloud. The CIP and PIP detected the peak particle number concentration in the middle and lower parts of the cloud, respectively.

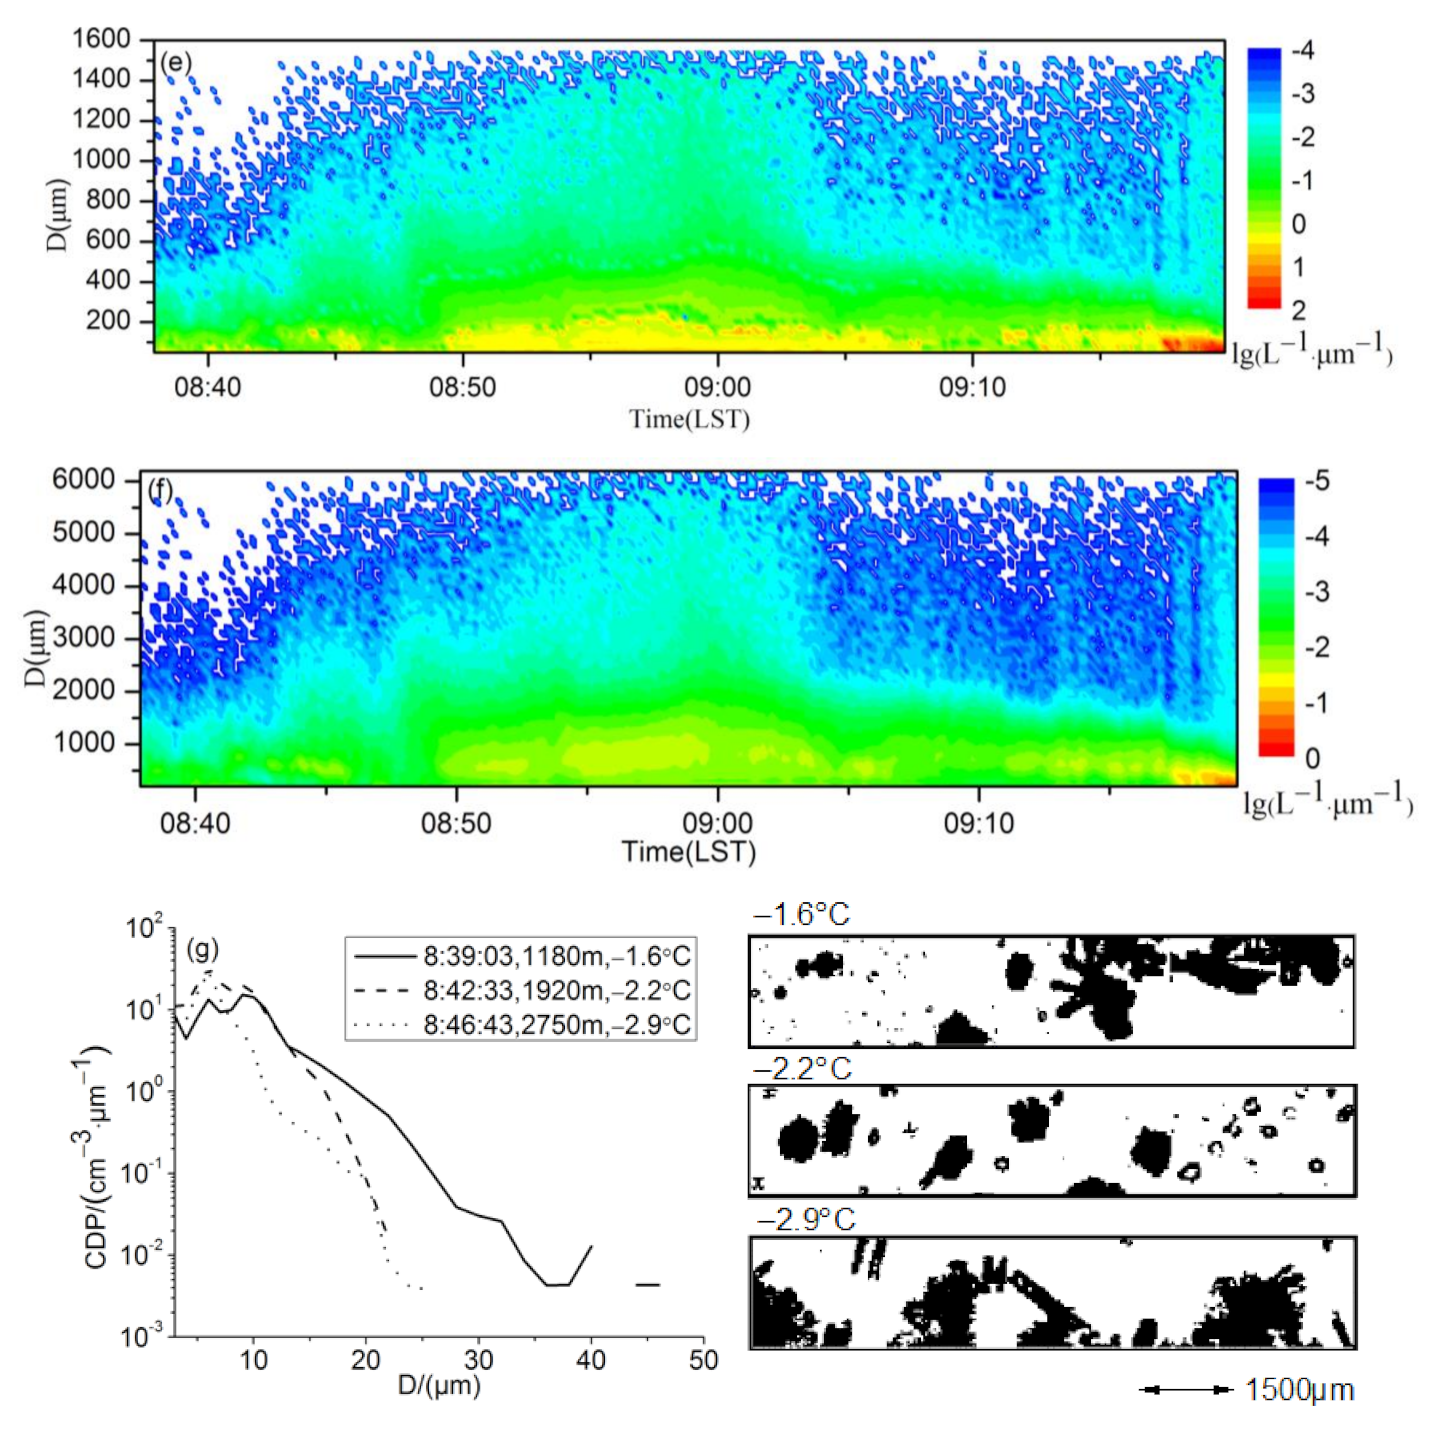
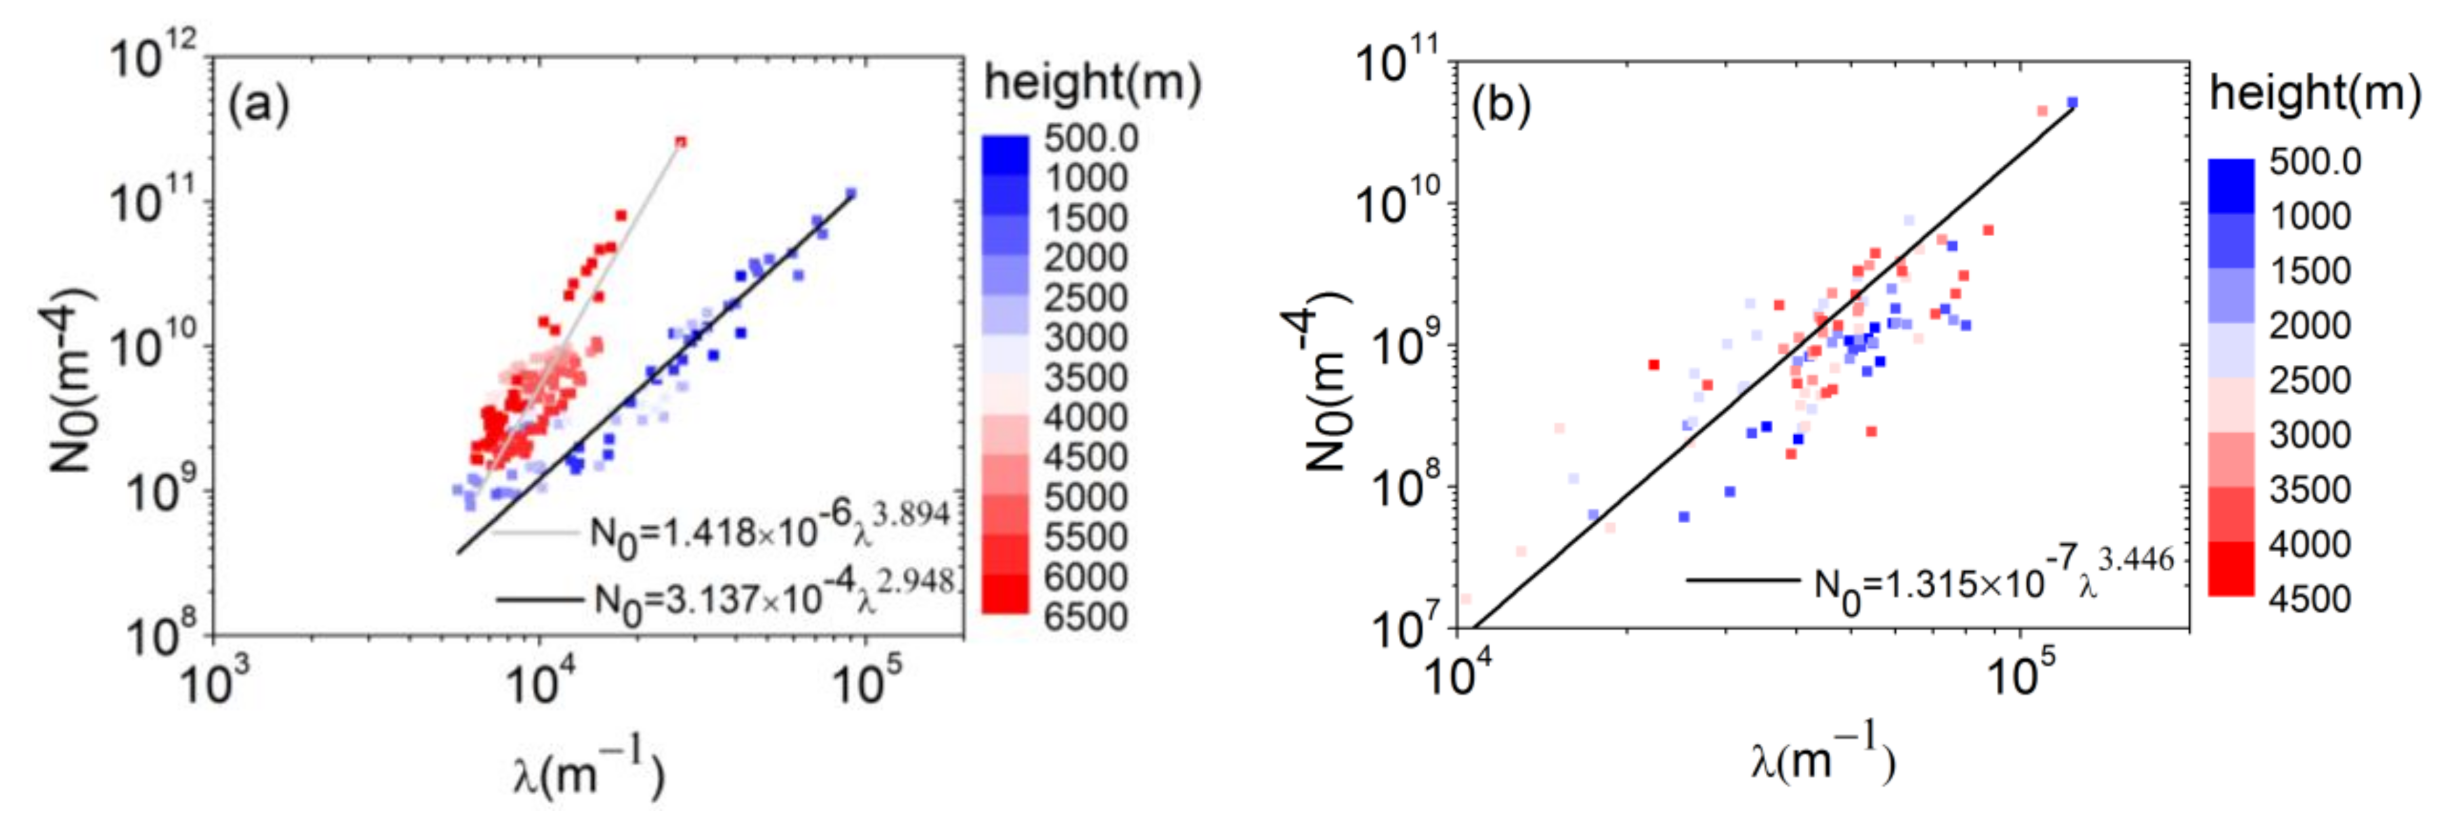
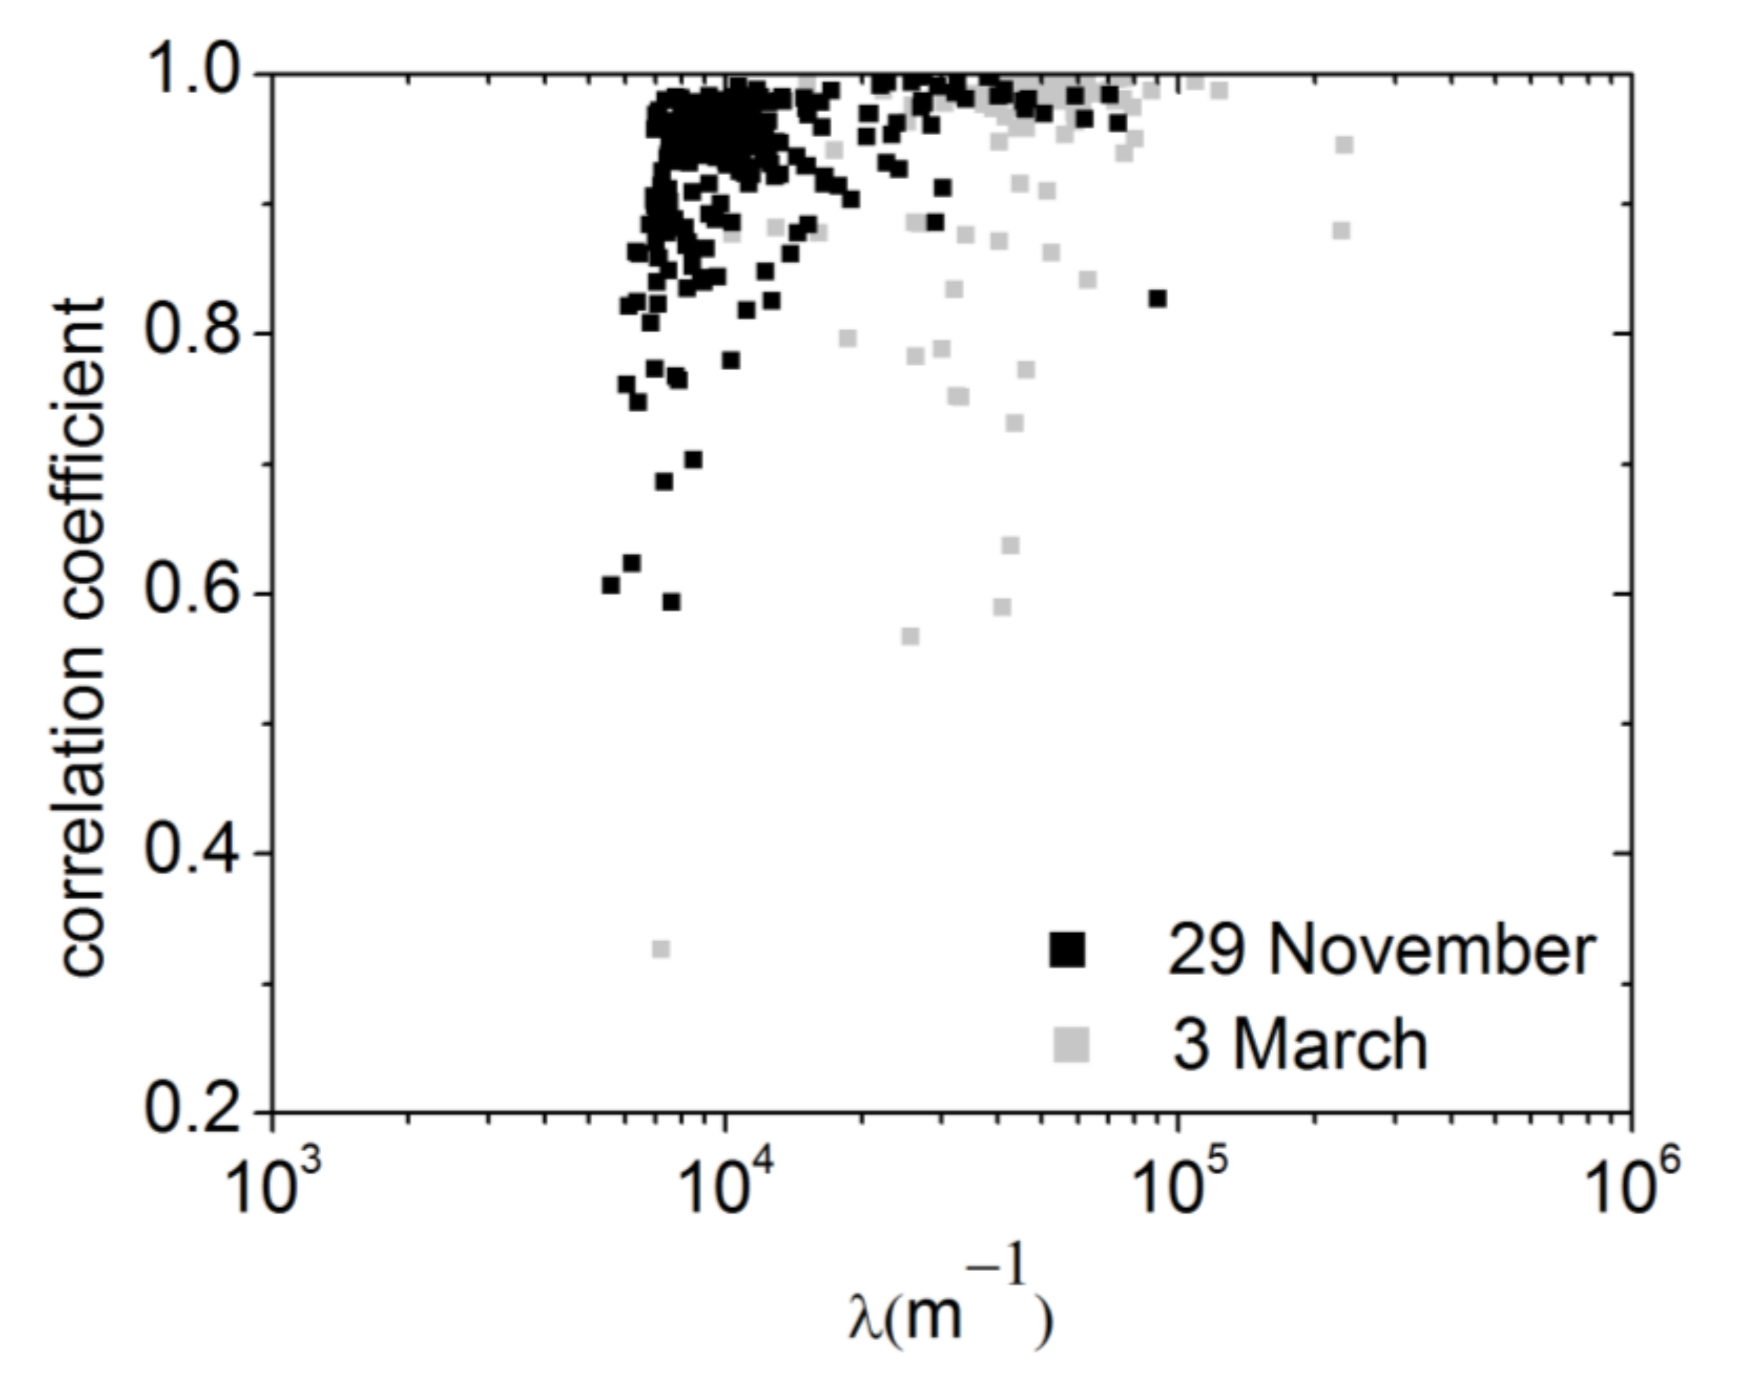
4.3. Spectral Parameters of the Ice Snow Crystal Spectrum

In this paper, the M-P exponential distribution is used to fit the ice and snow crystal patterns of two snowfall processes. The ice and snow crystal patterns are the combination data from the CIP and PIP (CIP: 50 to 600 μm, PIP: 600 to 6200 μm). Figure 8 shows the distribution of spectral parameters with height fitted by the M-P exponential function. During the snowfall process on 3 March (Figure 8b), the order of magnitude of N0 is 108−1010 m−4, and the range of λ is 104 m−1. In contrast, for the snowfall process on 29 November (see Figure 8a), the N0 value is larger and the order of magnitude of N0 is mainly between 109 and 1011 m−4. The variation range of λ is wider at two orders of magnitude 103−104 m−1, which may be caused by more complex microphysical processes caused by cumulus mixed clouds. Woods et al. [24] found that the variation range of N0 is less than three orders of magnitude, while the variation range of slope λ is one order of magnitude.
Some studies have pointed out that the correlation between N0 and λ can be expressed as a power function. For example, Sekhon and Srivastava [22] used the following formula to fit the spectral parameters of ice and snow collected on the ground:
N 0 = a λ b
Parameters a and b are 3.61 × 10⁵ and 2.09, respectively. In this paper, the power function is also used to fit the correlation of N0 and λ, and the fitting results are shown in Figure 8. Due to the different performances of snowflake particle spectrum distributions in different climatic backgrounds, snowfall processes N0 and λ on 29 November were fitted with 3500 m height as the interval. Below 3500 m, stratiform snowfall clouds were observed, and the fitting parameters a and b were 3.12 × 10⁻⁴ and 2.95, respectively. Above 3500 m, cumulus mixed snowfall clouds were observed, and the fitting parameters a and b were 1.42 × 10⁻⁶ and 3.89, respectively. The fitting correlation coefficients were 0.87 and 0.94, respectively. The fitting parameters of N0 and λ on 3 March were 1.32 × 10⁻⁷ and 3.45, respectively, and the correlation coefficient was 0.84. The fitting parameters of the M-P distribution of the ice snow crystal spectrum are consistent with the power function distribution.
To further study the fitting accuracy of the M-P distribution to the ice and snow crystal spectra, the distribution of the fitting correlation coefficient with λ in the two snowfall processes is shown in Figure 9. λ is the linear correlation coefficient between the fitting data and the original data. The larger λ is, the higher the fitting accuracy is. The correlation coefficients λ are mainly between 0.8 and 1.0, and there are some scattered low values, which indicates that the fitting accuracy of the M-P exponential distribution is high.

5. Conclusions

The cloud characteristics of the two snowfall processes on 29 November 2011 and 3 March 2012 are analyzed via aircraft observations. The two processes have different microphysical characteristics and growth processes under different weather conditions.
According to the macro characteristics, affected by the high trough, low-level shear and cold front on 29 November, the water vapor supply is sufficient. At the ground is light to moderate snow. The cloud system is deep, and the cloud top is high. Scattered strong echo areas are embedded in the large area of sheet radar echo, and the strongest echo is approximately 35 dBZ. On 3 March, affected by the weak shortwave trough at high altitudes and the weak warm shear at low altitudes, the high- and low-altitude systems and water vapor conditions are generally coordinated. The ground is covered with light snow, the cloud system is scattered, the cloud thickness is uneven, and the cloud top height is obviously lower than that on 29 November. The radar echo is a block inhomogeneous structure, and the maximum echo intensity is below 20 dBZ.
The change in ice and snow crystal shape with height shows that the type of ice and snow crystal shape is related to the temperature of the cloud top. The cloud top temperature was −12.6 °C on 3 March, and the ice and snow crystal morphology included needle, dendritic, plate and irregular shapes. The cloud top temperature was lower than −19.5 °C on 29 November. Except for needle, dendritic, plate and irregular ice and snow crystals, columnar cap ice and snow crystals were observed in the middle and lower layers of the cloud and columnar ice and snow crystals were observed in the upper layer of the cloud. The dendritic ice and snow crystals observed in the lower layer were formed by falling from the lower temperature clouds.
From the vertical distribution of microphysical characteristics and the growth process of particles, the snowfall mechanism in the upper part of the snowfall cloud was dominated by deposition growth while that in the middle part of the cloud was dominated by aggregation and riming growth, thus forming the peak area of ice and snow crystal number concentration. On 29 November, the mechanism was a cumulus mixed snowfall cloud and the liquid water content was distributed in the lower part of the cloud. The ice water content and ice crystal concentration were relatively high, and the maximum values were 1.05 g·m−3 and 187 L−1, respectively, at −8.7 °C, which are located in the upper part of the convective bubble. On 3 March, the mechanism was a stratiform snowfall cloud with liquid water content in the middle of the cloud. The maximum ice water content was only 0.052 g·m−3, which is low. A comparison of two different snowfall processes showed that the degree of riming is related to the content of liquid water. On 29 November, the liquid water content was high and the degree of riming was obvious. In the embedded convective bubble snowfall cloud, the aggregation growth of ice and snow crystals was relatively strong.
The ice and snow crystal spectra of the two snowfall processes can well fit the M-P exponential distribution, and the fitting correlation coefficient was mainly between 0.8 and 1.0. The fitting parameters N0 and λ fit the power function distribution. On 3 March, the order of magnitude of N0 was 108 to 1010 m−4 and λ was 104 m−1. On 29 November, the order of magnitude of N0 was mainly between 109 and 1011 m−4 and the value of N0 was larger. The variation range of λ was wider at two orders of magnitude from 103 to 104 m−1. This difference may have been caused by more complex microphysical processes caused by cumulus mixed clouds.

Author Contributions

Data curation, Q.F.; Formal analysis, Q.F., T.H., D.S., and Z.Y.; Funding acquisition, Q.F.; Methodology, T.H. and D.S.; Resource, Q.F., D.S., and Z.Y.; Supervision, S.N.; Writing—Original draft, Q.F.; Writing-Review— editing, Q.F. All authors have read and agreed to the published version of the manuscript.

Funding

This research was funded by the Innovative Project of Postgraduates in Jiangsu Province (KYLX16_0938), the Key Laboratory for Cloud Physics of China Meteorological Administration (2017Z016), the Key projects of Shanxi Meteorological Bureau (SXKZDRY20165205) and the National Key R&D Program of China (2019YFC1510301).

Data Availability Statement

The data presented in this study are available on request from the corresponding author.

Conflicts of Interest

The authors declare no conflict of interest.

References

  1. Baker, B.A.; Lawson, R.P. In situ observations of the microphysical properties of wave, cirrus, and anvil clouds. Part I: Wave clouds. J. Atmos. Sci. 2006, 63, 3160–3185. [Google Scholar] [CrossRef]
  2. Letu, H.; Ishimoto, H.; Riedi, J.; Nakajima, T.Y.; Labonnote, L.C.; Baran, A.J.; Nagao, T.M.; Sekiguchi, M. Investigation of ice particle habits to be used for ice cloud remote sensing for the GCOM-C satellite mission. Atmos. Chem. Phys. 2015, 15, 31665–31703. [Google Scholar]
  3. Letu, H.; Nagao, T.M.; Nakajima, T.Y.; Jerome, R.; Ishimoto, H.; Bran, A.J.; Shang, H.; Sekiguchi, M.; Kikuchi, M. Ice cloud properties from Himawari-8/AHI next-generation geostationary satellite: Capability of the AHI to monitor the DC cloud generation process. IEEE Trans. Geosci. Remote Sens. 2019, 57, 3229–3239. [Google Scholar] [CrossRef]
  4. Rottner, D.; Vali, G. Snow crystal habit at small excesses of vapor density over ice saturation. J. Atmos. Sci. 1974, 31, 560–569. [Google Scholar] [CrossRef] [Green Version]
  5. Korolev, A.V.; Isaac, G.A.; Hallett, J. Ice particle habits in stratiform clouds. Q. J. R. Meteorol. Soc. 2000, 126, 2873–2902. [Google Scholar] [CrossRef]
  6. Field, P.R. Aircraft Observations of Ice Crystal Evolution in an Altostratus Cloud. J. Atmos. Sci. 1999, 56, 1925–1941. [Google Scholar] [CrossRef]
  7. Magono, C.; Lee, C.W. Meteorological classification of natural snow crystals. J. Fac. Sci. 1966, 2, 321–335. [Google Scholar]
  8. Holroyd, E.W. Some techniques and uses of 2D-C habit classification software for snow particles. J. Atmos. Ocean. Technol. 1987, 4, 498–511. [Google Scholar] [CrossRef] [Green Version]
  9. Bailey, M.; Hallett, J. Growth rates and habits of ice crystals between −20 and −70 °C. J. Atmos. Sci. 2004, 61, 514–544. [Google Scholar] [CrossRef]
  10. Bailey, M.P.; Hallett, J. A comprehensive habit diagram for atmospheric ice crystals: Confirmation from the laboratory, AIRS II, and other field studies. J. Atmos. Sci. 2009, 66, 2888–2899. [Google Scholar] [CrossRef] [Green Version]
  11. Heymsfield, A.J.; Bansemer, A.; Poellot, M.R.; Wood, N. Observations of ice microphysics through the melting layer. J. Atmos. Sci. 2015, 72, 2902–2928. [Google Scholar] [CrossRef]
  12. Erfani, E.; Mitchell, D.L. Growth of ice particle mass and projected area during riming. Atmos. Chem. Phys. 2017, 17, 1241–1257. [Google Scholar] [CrossRef] [Green Version]
  13. Heymsfield, A.J. Laboratory and Field Observations of the Growth of Columnar and Plate Crystals from Frozen Droplets. J. Atmos. Sci. 1973, 30, 1650–1656. [Google Scholar] [CrossRef] [Green Version]
  14. Fukuta, N.; Takahashi, T. The Growth of Atmospheric Ice Crystals: A Summary of Findings in Vertical Supercooled Cloud Tunnel Studies. J. Atmos. Sci. 1999, 56, 1963–1979. [Google Scholar] [CrossRef] [Green Version]
  15. Takahashi, T.; Fukuta, N. Super cooled cloud tunnel studies on the growth of snow crystals between −4 °C and −20 °C. J. Meteorol. Soc. Jpn. 1988, 66, 841–855. [Google Scholar] [CrossRef]
  16. Hobbs, P.V.; Matejka, T.J.; Herzegh, P.H.; Locatelli, J.D.; Houze, R.A. The mesoscale and microscale structure and organization of clouds and precipitation in midlatitude cyclones. I: A case study of a cold front. J. Atmos. Sci. 1980, 37, 568–596. [Google Scholar] [CrossRef] [Green Version]
  17. McFarquhar, G.M.; Black, R.A. Observations of particle size and phase in tropical cyclones: Implications for mesoscale modeling of microphysical processes. J. Atmos. Sci. 2004, 61, 422–439. [Google Scholar] [CrossRef] [Green Version]
  18. Field, P.R.; Hogan, R.J.; Brown, P.R.A.; Llingworth, A.J.; Choularton, T.W.; Cotton, R.J. Parametrization of ice-particle size distributions for mid-latitude stratiform cloud. Q. J. R. Meteor. Soc. 2005, 131, 1997–2017. [Google Scholar] [CrossRef]
  19. McFarquhar, G.M.; Timlin, M.S.; Rauber, R.M.; Jewett, B.F.; Grim, J.A.; Jorgensen, D.P. Vertical variablility of cloud Hydrometeors in the stratiform region of mesoscale convective systems and bow echoes. Mon. Weak. Rev. 2007, 135, 3405–3428. [Google Scholar] [CrossRef]
  20. Heymsfield, A.J.; Bansemer, A.; Field, P.R.; Durden, S.L.; Stith, J.L.; Dye, J.E.; Hall, W.; Grainger, C.A. Observations and parameterizations of Particle size distributions in deep tropical cirrus and stratiform precipitating clouds: Results from in situ observations in TRMM field campaigns. J. Atmos. Sci. 2002, 59, 3457–3491. [Google Scholar] [CrossRef]
  21. Field, P.R.; Heymsfield, A.J. Aggregation and scaling of ice crystal size distributions. J. Atmos. Sci. 2003, 60, 544–560. [Google Scholar] [CrossRef]
  22. Sekhon, R.S.; Srivastava, R.C. Snow size spectra and radar reflectivity. J. Atmos. Sci. 1970, 27, 299–307. [Google Scholar] [CrossRef] [Green Version]
  23. Lo, K.; Passarelli, R.E. The growth of snow in winter storms: An airborne observational study. J. Atmos. Sci. 1982, 39, 697–706. [Google Scholar] [CrossRef] [Green Version]
  24. Woods, C.P.; Stoelinga, M.T.; Locatelli, J.D. Size Spectra of Snow Particles Measured in Wintertime Precipitation in the Pacific Northwest. J. Atmos. Sci. 2008, 65, 189–205. [Google Scholar] [CrossRef]
  25. You, L.; Wang, S.; Wang, D.; Chi, Y. The microphysical structure of snow cloud and the growth processs of snow in winter in Xinjiang. Acta Meteorol. Sin. 1989, 47, 73–81. [Google Scholar]
  26. You, L.; Li, Y.; Liu, Y. On the nucleation processes of ice crystal and the collision efficiency between dendritic snow crystal and droplets in natural clouds. Acta Meteorol. Sin. 1992, 50, 232–238. [Google Scholar]
  27. Chen, W. The multipliation cenerated by dendritic snow crystals collision and aggregation. J. Acad. Meteorol. Sci. 1987, 2, 74–80. [Google Scholar]
  28. Mitchell, D.L.; Zhang, R.R.; Pitter, L. Mass-Dimensional Relationships for Ice Particles and the Influence of Riming on Snowfall Rates. J. Appl. Meteor. 1990, 29, 153–163. [Google Scholar] [CrossRef] [Green Version]
  29. Pruppacher, H.R.; Klett, J.D. Microphysics of clouds and precipitation. Kluwer Acad. Publ. Lond. 1997, 18, 687–689. [Google Scholar]
  30. Lawson, R.P.; Stewart, R.E.; Strapp, J.W.; Isaac, G.A. Aircraft observations of the origin and growth of very large snowflakes. Geophys. Res. Lett. 1993, 20, 53–56. [Google Scholar] [CrossRef]
  31. Korolev, A.; Sussman, B. A technique for habit classification of cloud particles. J. Atmos. Ocean. Technol. 2000, 17, 1048–1057. [Google Scholar] [CrossRef]
  32. Zhu, S.; Guo, X.; Lu, G.; Guo, L. Ice Crystal Habits and Growth Processes in Stratiform Clouds with Embedded Convection Examined through Aircraft Observation in Northern China. J. Atmos. Sci. 2015, 72, 2011–2032. [Google Scholar] [CrossRef]
Figure 1. Synoptic conditions over North China: (a) 29 November 2011 at 08:00 LST and (b) 3 March 2012 for 08:00 LST.
Atmosphere 12 00477 g001
Figure 2. FY2C infrared cloud image: (a) 29 November 2011 for 08:30 LST and (b) 3 March 2012 for 10:30 LST (black box for the flight area).
Atmosphere 12 00477 g002
Figure 3. Plan position indicator (PPI) radar scan of reflectivity (dBZ) from C band Doppler weather radar located in Taiyuan City (in the middle of Shanxi Province): (a) 29 November 2011 for 09:02 LST and (b) 3 March 2012 for 10:12 LST (thick black solid line for the flight track).
Atmosphere 12 00477 g003
Figure 4. Flight track of observations: (a) 29 November 2011 and (b) 3 March 2012.
Atmosphere 12 00477 g004
Figure 5. Vertical distribution of temperature, humidity and typical ice and snow crystal images observed by aircraft: (a) 29 November 2011 and (b) 3 March 2012.
Atmosphere 12 00477 g005aAtmosphere 12 00477 g005b
Figure 6. Vertical distribution of microphysical characteristics on 29 November 2011: (a) cloud droplet concentration and liquid water content, (b) particle number concentration and ice water content from the cloud imaging probe (CIP), (c) particle number concentration and effective diameter from the precipitation imaging probe (PIP), (d) radar echo on flight path and particle image from the CIP, (e) particle spectrum from the CIP, (f) particle spectrum from the PIP, and (g) cloud drop spectrum and particle image from the CIP.
Atmosphere 12 00477 g006aAtmosphere 12 00477 g006b
Figure 7. Vertical distribution of microphysical characteristics on 3 March 2012: (a) cloud droplet concentration and liquid water content, (b) particle number concentration and ice water content from the CIP, (c) particle number concentration and effective diameter from the PIP, (d) radar echo on flight path and particle image from the CIP, (e) particle spectrum from the CIP, and (f) particle spectrum from the PIP.
Atmosphere 12 00477 g007aAtmosphere 12 00477 g007b
Figure 8. Correlations between N0 and λ of the M-P distribution: (a) 29 November 2011 and (b) 3 March 2012.
Atmosphere 12 00477 g008
Figure 9. Correlation coefficients of the M-P distribution.
Atmosphere 12 00477 g009
Publisher’s Note: MDPI stays neutral with regard to jurisdictional claims in published maps and institutional affiliations.

