Abstract
Rainfall and air temperature variability pose the greatest risk to environmental change. Past trends in rainfall and air temperature facilitate projecting future climate changes for informed policy responses. We used a combination of the normalised difference vegetation index (NDVI) and observed data from 1968 to 2017 to assess changes in rainfall, moisture stress, and air temperature variability over time on bioclimatic regions of KwaZulu-Natal (KZN) Province, South Africa. Indicators used included consecutive dry days (CDDs), consecutive wet days (CWDs), very heavy rainfall days (R20), monthly maximum daily maximum air temperature (TXx), monthly minimum daily minimum air temperature (TNn), the total number of rainfall days, and monthly air temperature averages. Trends in rainfall and moisture stress are notable in different bioclimatic regions across the province. However, these trends are diverse, in general, and spatially different across and within the bioclimatic regions. Further, related rainfall indicators do not respond in the same way as would be expected. Air temperature trends were consistent with global trends and land–air temperature anomalies. Although daytime air temperatures showed a positive trend, extreme air temperature events and increases are predominant in inland regions. Night-time air temperatures showed an upward trend in most stations across KZN. Local weather-and-climate related characteristics are evolving due to climatic variability and change. The study shows that changes in climatic activities are detectable at a local level from existing historical weather data; therefore, adaptation strategies should be contextualised to respond to local and area-specific challenges.
1. Introduction
In recent years, weather extremes such as heatwaves, droughts, floods, and cyclones have accounted for significant and undesirable impacts on society and the environment [1,2,3]. Efforts are being made to implement strategies to manage climate change-related risks and enhance adaptive capacity at a local level [4,5]. However, most of these strategies lack detailed contextualisation at a local scale [5]. Consequently, marginalised communities mostly in developing countries still lack proactive approaches to risk management and have low adaptive capacities [4,6,7].
Drought periods and heatwaves are generally associated with oceanic–atmospheric interactions such as changes in sea surface temperatures and warm phases of the El Niño Southern Oscillation (ENSO) over southern Africa [8,9,10]. These other drought-associated atmospheric interactions over oceans range from typical anticyclonic conditions, cut-off low-pressure systems and tropical, temperate troughs [10]. However, studies by Richard et al. [11], Moeletsi et al. [12], Kane [13] and Rouault et al. [14] specifically relate South Africa’s rainfall variability to the ENSO, which is an indicator of climate variability. Further, Richard et al. [11] directly link more intense and longer-lasting drought and interrelated extreme weather events to such atmospheric–oceanic interactions, particularly the ENSO. Due to the influences of ENSO, a semi-arid climate, as well as climate-change-induced climatic variability and change, dryness is becoming devastating in South Africa [5,12].
Apart from the ENSO, increased climate-change-induced weather variability has been witnessed throughout South Africa since 1970, characterised by high inter- and-intra-seasonal rainfall variability and increasing dryness [14,15]. Drought and heatwaves, and related hydro-meteorological extremes are among the most predominant natural extremes experienced in South Africa [15]. These natural extremes are increasing in frequency and intensity, aggravating water, and food insecurity challenges in the country [14,15,16]. Owing to variability and inconsistencies in intra-annual, intra-seasonal, inter-annual and inter-seasonal rainfall, specific drought occurrences have become more frequent, intense, persistent, causing significant socio-economic interruptions, particularly in the austral summer rainfall region, on the eastern seaboard, where KwaZulu-Natal (KZN) is located [11,15]. Over the years, the number of consecutive dry days has been increasing together with the number of daily extreme rainfall events [14,15,17]. Late season rainfall onset and early seasonal rainfall cessations are also characteristic for most of South Africa [17]. MacKellar et al. [17] note that this is magnified by the increased rainfall variability associated with climate change. These adverse changes threaten the livelihoods of mostly rural people who rely on natural resources for a living [18].
The KwaZulu Natal (KZN) province is predominantly rural, where most of the population rely on government provisions and is characterised by high-density poverty [19]. The province has the highest number of agricultural households, accounting for up to 25% of all the farming households in South Africa [19]. This population of farming households relies on climate-sensitive agriculture as their core livelihood strategy and are especially exposed to climate variability and change risks. This is primarily due to their low adaptive capacity and numerous other socio-economic stresses already prevailing within local communities [19,20]. Further, six out of ten of the poorest districts in South Africa are in KZN and are made up of predominantly marginalised rural communities [20].
Drought is characterised by water imbalances, failing water supplies, below average relative humidity, livestock deaths, and crop failure [20,21]. In most cases, drought is characterised by crop failure, hunger and starvation, spiking food prices, conflicts over natural resources such as water, livestock deaths and many conditions that go against the principles of human security and demand humanitarian interference [4,15,22]. As such, many attempts have been made to improve the understanding of drought and related natural disasters for drought assessment, adaptation, and drought preparedness through research studies [4,21,22]. However, most of such studies, especially impact studies, usually look at drought from a broader scale, ignoring localised characteristics and impacts of droughts and related extreme air temperature events [5].
This study assessed the spatial trends of drought, rainfall and heatwaves and related disasters over time to guide the formulation of context-specific adaptation strategies in KZN. This developed knowledge is critical for sustainable development at the local level as the hydro-meteorological processes sustain socio-ecological systems [23]. The generated knowledge and approach are relevant for rural livelihoods as they generally rely on natural resources and agriculture for their livelihoods, which makes them highly vulnerable to climate change. This new information is critical for understanding the potential impacts so that mitigation and adaptation strategies can be tailored and timeously implemented according to local and specific drought and air temperature characteristics. The proposed policy response strategies are critical for achieving the Sustainable Development Goals (SDGs), particularly Goals 1 (no poverty), 2 (zero hunger), 6 (clean water and sanitation), 10 (reduced inequality), and 13 (climate action).
2. Materials and Methods
2.1. Climate of KwaZulu-Natal Province
South Africa’s 24 climatic regions are characterised by distinct annual rainfall patterns that give rise to different vegetation types [17,22,24]. Of the 24 climatic regions, KZN is dominantly covered by three of these regions, which are region 6, 7, and 12 [17,24] (Table 1). The mean annual rainfall in KZN ranges from 650 mm in the eastern Grasslands to 1400 mm in the eastern Coastal Bushveld with the KZN Central Bushveld (900 mm) falling between the two [15]. The province receives most of its rainfall in the austral summer period, between October and March and with the climate change and rainfall variability, the contribution of the austral summer rains to the total annual rainfall is increasing compared to autumn–winter showers [11,15].

Table 1.
Dominant climatic regions of KwaZulu-Natal (KZN) (adapted from Kruger [15].
This study focused on six meteorological stations located in KZN, on the eastern seaboard of South Africa, mainly Newcastle, Ladysmith, Estcourt, Cedara, Durban South, and Cape St Lucia (Figure 1). The province has an area of 94 361 km2 and is South Africa’s second-most populated province [25]. The climate in KZN varies with a topography that ranges in elevation from sea level to 3451 m in the mountainous interior [25].
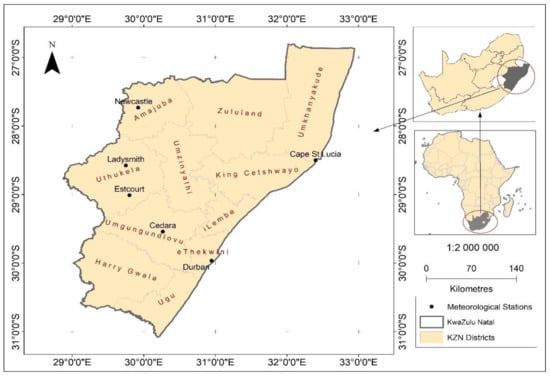
Figure 1.
Location of KwaZulu-Natal Province and the six weather stations used in the study.
2.2. Data Sources
2.2.1. Data Acquisition
Determination of the nature and trends of drought occurrence and extreme air temperature events was performed through an analysis of daily, monthly, and annual rainfall data from six different stations, which was supplemented by air temperature data also from the six different stations (Table 2). The data were extracted by the South African Weather Service (SAWS) based on the quality and duration of daily data available per station. Kruger and Nxumalo [15] and Alexander [26] emphasise the importance of quality data when conducting a study that uses climatic data. Kruger and Nxumalo [15], however, further highlight that due to topography and the nature of South African rainfall, it is challenging to control the quality of data especially rainfall data for each of the different climatic regions. The raw data were used to conduct statistical and inter-comparative analyses and draw graphs, to address the research question.

Table 2.
Characteristics of the six KZN weather stations.
Rainfall and air temperature data from weather stations across KZN, covering three of the 24 South African climate regions were used for this study [15]. The climatic data used covers 49 years, 33 years, and 23 years per station, depending on the quality and duration of data available. The data were extracted from two meteorological stations per region, across the three regions of the province of KZN. The six stations are located at Cape St Lucia, Cedara, Durban, Estcourt, Ladysmith, and Newcastle (Table 2 and Figure 1).
The Moderate Resolution Imaging Spectroradiometer (MODIS) time series normalised difference vegetation index (NDVI) data (2000–2017) were accessed and processed through the Google Earth Engine (GEE), a big data management platform. The NDVI data were extracted from the Terra Sensor (MOD13Q1) with a spatial resolution of 250 m and a temporal resolution of 16 days. The Mann–Kendall Trend Test, a non-parametric statistical test, was used to analyse the NDVI time series data to assess the increasing or decreasing consistency on moisture stress over time.
2.2.2. Data Processing, Analysis, and Statistical Significance
Daily rainfall and air temperature data records for 1968, 1984, 1993, and 2017 were obtained from three climatic regions in KZN and provided by the SAWS. Two durable stations per region trusted to capture rainfall, and air temperature data accurately were selected. The data were first manually checked for any temporal inconsistency, errors and outliers using Microsoft Excel as well as INSTAT V3.36. For convenience, the data were then divided into main climatic regions. Files were then created with data from each weather station from the main file and again, checked for any temporal inconsistency.
Microsoft Excel was used as the primary tool for data analysis to test and understand the statistical relationship, correlations, deviances, regressions, and the changes of climate data over the province in the given different climatic regions and INSTAT V3.36 was used for validation and to sort and group the data for analysis. Daily data were analysed as they are for consecutive dry days (CDDs), consecutive wet days (CWDs), the number of very heavy rainfall days (R20), the total number of rainfall days, MaxTmax (TXx) and MinTmin (TNn) and then integrated into monthly and annual data for other analyses. The main indicators for drought, extreme rainfall events and extreme air temperature events in this study were CDDs, CWDs, R20, TXx, and TNn (Table 3). More information on the indicators and relevant references are given by Donat et al. [16] and Alexander [26]. Understanding the cyclical nature of the dry seasons was assessed through understanding rainfall characteristics over the long-term, depending on the spatial resolution of data available in each region to ensure that the results of the study and reports were of good quality. Dry spells in this study are defined as periods of 10, 20, and 30 days or more with less than 1 mm rain that can lead to the initial stage of drought (meteorological).

Table 3.
Extreme rainfall and air temperature indicators used in the study (adapted from Donat et al. [16] and Alexander [26].
Normal regression statistics, available in Microsoft Excel were used in this study for trend analysis and significance of these trends (see Supplementary Materials Table S1). The statistical outputs for all our trends will be briefly discussed in-text but the tables will not be included in the main text; these can be found separately as Supplementary Materials.
2.2.3. Time Series Analysis Using MODIS NDVI Data
The NDVI data were used to extract phenological profiles (browning and greening trends) in the areas around the weather stations. The NDVI is a slope-based vegetation index used to assess vegetation health based on the reflection of vegetation to the visible and near infra-red portion of the electromagnetic spectrum [27]. It was used as a proxy for moisture stress.
The NDVI values range between −1 and 1, where 1 represent healthy vegetation and −1 is for non-vegetated environments [27]. The NDVI data used was for a 15 km radius (or buffer) around each weather station from February 2000 to December 2017. The Google Earth Engine was used to process the time series analysis in conjunction with Microsoft Excel that generated the trend line and used to extract the R-squared value for each weather station. The Mann–Kendall monotonic trend test was run using R programming to assess the NDVI trend from 2000 to 2017.
3. Results and Discussion
3.1. Annual Rainfall Trends
The KZN province has a high annual, seasonal, and monthly rainfall variability across and within the different climatic regions. Rainfall in the province varies spatially from coastal areas to inland areas. The coastal areas (Region 6) had the highest mean annual rainfall, followed by the Midlands (Region 12) and the more inland areas (Region 7) have the lowest mean annual rainfall (Figure 2). The high variability in inter-seasonal and intra-seasonal rainfall, especially within region 7 and 12, exposes the inland areas to dry spells during the autumn–winter seasons and more especially during the climatologically dry months compared to coastal areas. Conversely, during the spring–summer months, torrential downpours, flash flooding and wet spells are prevalent within the inland areas compared to the coastal regions which have a steady rainfall throughout the year.
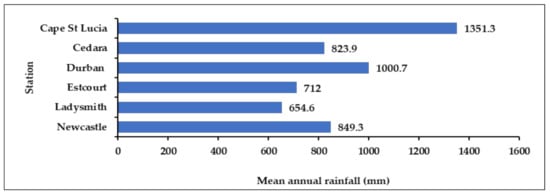
Figure 2.
Mean annual rainfall for the weather stations within the three climatic regions.
The mean annual rainfall over KZN from 1968 to 2017 ranged from 1351 mm for Cape St Lucia (Region 6), which is described as a grassland type region in the updated version of climatic regions of South Africa; to a low of 655 mm for the Ladysmith area (Region 7), which is also described as a grassland type region (Figure 2). The Midlands (Region 12) falls in between Regions 6 and 7 with a mean annual rainfall amount of 824 mm for Cedara.
Among the three climatic regions, the highest recorded mean annual rainfall over the data period per region occurred in Region 6 (Cape St Lucia), followed by Region 12 (Cedara) and then Region 7 (Newcastle) (Table 4). The lowest recorded annual rainfall occurred in Region 12 (Estcourt). The difference between the highest and lowest recorded mean annual rainfall in Cape St Lucia was 1563 mm. Cape St Lucia has double the average mean annual rainfall of other stations especially in Regions 7 and 12.

Table 4.
Outliers from the standard annual rainfall quantities.
In region 7, using Ladysmith as an example, the difference between the highest and lowest recorded mean annual rainfall is 689 mm which is a little over the average annual rainfall in this area, and the same trend is seen in region 12, using Cedara as an example. This shows great spatial rainfall variability within a single province and significant fluctuations in rainfall between and within different climatic zones (Figure 2) (Table 4). Some of these rainfall deviations are linked to typical ENSO events and some to hydro-meteorological extremes such as the late 1984 Demoina floods [28].
3.2. Monthly Rainfall Trend-Cycles
Monthly rainfall trends-cycles show a distinct steady decrease from January–February to June–July and a steady increase from thereon approaching the spring–summer seasons (Figure 3). These trend-cycles are seen across five of the six meteorological stations. Cape St Lucia shows well-distributed rainfall throughout the year, even during climatologically dry months with a low monthly rainfall amount in August (Figure 3) while other stations have their lowest around June and July (Figure 3). The lack of rainfall during autumn–winter months exposes the different regions to dry spells and drought periods between rainfall cessation and onsets, especially in Regions 7 and 12.
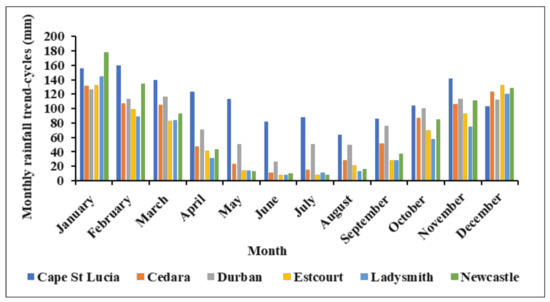
Figure 3.
Monthly rainfall totals (trend-cycles) for the six weather stations.
General cycles and trends in rainfall patterns are notably inconsistent due to climate variability as supported by previous research [25]. However, these trends are skewed towards drier than normal conditions in KZN, especially during the April–September period. Transitorily ENSO could not be as accountable for rainfall variability as previously seen by Richard et al. [11]; Moeletsi et al. [12]; Kane [13]; and Rouault et al. [14], in KZN but climate change might be accountable for this gradual aridification.
Inland locations such as Estcourt, Cedara, Newcastle, and Ladysmith (Figure 3) experience the most distinct changes in inter-seasonal rainfall and intra-seasonal rainfall fluctuations. For example, January, December, February, November, and March, respectively, have higher monthly averages ranging between the highest monthly record in a year (100%) and 50% of the highest recorded monthly rainfall, together accounting for up to 80% of the area’s annual rainfall. On the other hand, May, August, June, and July show monthly averages of 0.8% to 20% of the highest recorded monthly rainfall, accounting for about 20% of the area’s annual rainfall.
3.3. Annual Number of Rainy Days
The total number of rainfall days per annum across KwaZulu-Natal was found to be variable. Within Region 6, Cape St Lucia experienced a steady decrease in annual rainfall days from 1968 to 2004 (Figure 4), the period for which high-quality data was available. However, within the same region, Durban shows no significant trends except for the outliers shown by the above-average rainfall days between 1995 and 1997. 1995 was a La Niña year [28], which could explain the above-average rainfall days experienced during this year in this region (Figure 4).
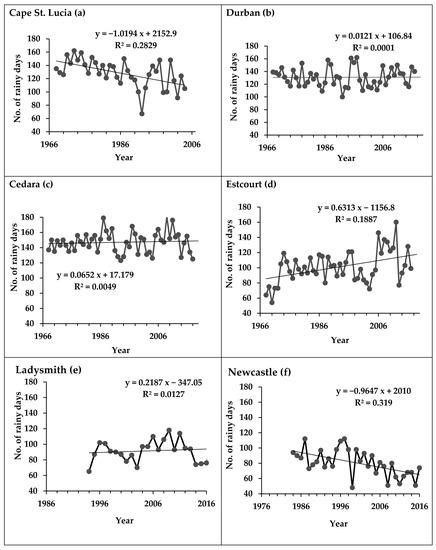
Figure 4.
Trends in the total number of rainy days per annum for the weather stations. (a) Cape St. Lucia; (b) Durban; (c) Cedara; (d) Estcourt; (e) Ladysmith; (f) Newcastle.
For Region 12, the average number of rainfall days at Cedara between 1968 and 2017 was 147 days per year. For these years, the trend in annual rainfall days at the Cedara station did not show any significant trend except for a weak upward trend supported by an increase of 12.33% of the total in 1968 (137) in 2015 (146) (Figure 4). The highest number of rainfall days in one year at Cedara was 181 in 2009. Estcourt had cases of missing data in March 2012 and March 2013; however, the region experienced an upward trend in annual rainfall days (Figure 4). This upward trend is supported by an increase in the number of rainfall days between 1968 (64) and 2016 (128) by up to 50%. The highest number of rainfall days experienced in Estcourt was 160 in 2012, and the lowest was 54 in 1970 with an average of 100 a year.
There were data available for Region 7 between 1984 and 2017 for Newcastle and 1994 to 2017 for Ladysmith. Over this period, Ladysmith experienced no significant distinct trend in the total number of rainfall days per year. The average number of rainfall days in the Ladysmith area was 92 per annum with a distinct outlier indicating that the highest number of rainfall days observed in this area was 118 in 2009 (January, February, March, October, November, and December), which was a La Niña year. The lowest was in 1994 with 65 rainfall days in a year, which was associated with an El Niño. This shows annual variability in rainfall days and the impacts of ENSO phases on the total rainfall days in this region. Newcastle experienced an average of 80 rainfall days per year.
The highest number of annual rainfall days in Newcastle was observed in 1997 totalling 112, and the lowest was 49 in 1999, indicating extreme annual variability. Between 1984 and 2017 the number of rainfall days in Newcastle has been decreasing steadily. Of all the meteorological stations investigated across the three different regions, Newcastle has experienced the most distinct downward trend in annual rainfall days. The correlation coefficients between the variables being evaluated for this query were positive and indicating a positive relationship between the variables. Durban and Ladysmith had correlation coefficients values that were closer to 0, indicating a weakness in the relationship between X and Y variables (see Figure 4). The Significance F values, which can be used as a measure of the probability that the model is not applicable were low throughout 4/6 stations for this query, ranging from 0.000 for the Cape St Lucia station: 0.001 for the station in Estcourt and 0.000 for the station in Newcastle. Durban and Ladysmith showed higher values of the Significance F (0.945 and 0.704 respectively) indicating a higher probability of reduced significance.
3.4. Consecutive Dry Days (CDDs)
Three stations were used, depending on the consistency of daily data that were available for better representation and statistical accuracy. Consecutive dry days are the number of days, following each other, with less than 1 mm of rainfall per day. Between 1980 and 2015, based on the data analysed from three meteorological stations that had the most consistent data, Estcourt demonstrated the highest percentage of CDDs compared to Cedara and Cape St Lucia over the three and two time periods successively.
No significant trend in CDDs was seen over one of the three weather data stations (Cedara) across the three-time period used to yield data on CDDs. Cape St Lucia, on the other hand, had experienced a minor increase in CDDs over one time period, while Estcourt shows a slight decrease in CDDs during 1980–1990 and 1994–2004 and a slight increase between 2005 and 2017. The Multiple R values for each station per sub-period varied distinctly, showing different levels of correlations between the dependent and independent variables (Figure 5). Significance F values also varied and were mostly high between the 1980–1990 and 1994–2004 periods and lower, especially for the Estcourt station between 2005 and 2017. The R-squared values, however, remained mostly low for most stations for all the sub-periods. Using a continuous dataset instead of having to divide the data into sub-periods could increase the level of statistical insignificance in our regression. The higher prevalence of CDDs was observed mainly between late April and mid-September, which allows for a period of the dry season, dry spells and in some instances winter meteorological drought during that time in South Africa (Figure 5). Further, CDDs are a regular feature of a typical winter period for all three regions, and their distribution is centred around such periods due to seasonally biased rainfall patterns, see Figure 3. However, CDDs are more intense in inland regions such as Estcourt where even meteorological drought could be said to be a regular feature of the winter season.
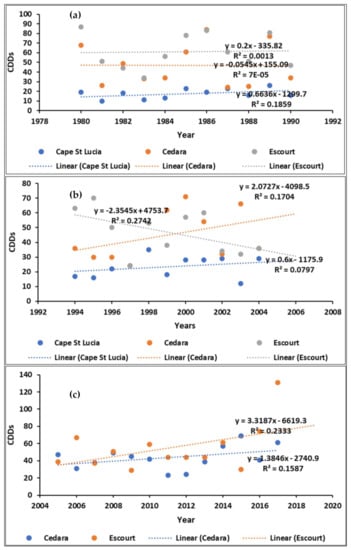
Figure 5.
Trends in the highest number of CDDs per year for different timelines for three weather stations within three climatic regions in KZN. (a) 1980–1990; (b) 1994–2004;(c) 2004–2017.
3.5. Consecutive Dry Days (CDDs) and Dry Spells
Consecutive dry days of 1–10 days indicate a weak, dry spell period; between 11 and 20 CDDs, a medium-strength dry spell; and over 21 days a strong dry spell. Consecutive dry days of over 31 days, as seen in Estcourt and Cedara (Figure 6), represent high strength or longer length dry spell periods which could lead to a meteorological drought period within a season (Figure 6). Dry spell seasons across the three meteorological stations occurred mainly between April and early September which is a dry season across all the regions studied, excluding Cape St Lucia. Within this dry season and based on the average number of CDDs across the three stations used for this section, meteorological drought can be said to be a regular feature of dry seasons in the upper inland areas of KwaZulu-Natal such as Estcourt. Up to 70 CDDs can be seen in KZN towards the northern parts of the province (Figure 6).
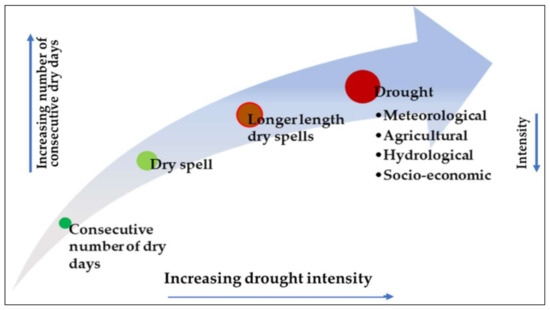
Figure 6.
Progression of consecutive dry days to dry spells and possible drought.
3.6. Consecutive Wet Days (CWDs)
Cape St Lucia (Region 6) had the highest total annual rainfall compared to the other stations. However, this rainfall occurs throughout the year and is not as seasonal as in the other stations. The three stations used to observe trends in CDDs were those used to study trends in CWDs (Cape St. Lucia, Cedara, and Estcourt) as they have the most comprehensive daily data sets.
Cedara experienced the highest overall average number of CWDs compared to Cape St Lucia and Estcourt, which could indicate more potent seasonal wet spells for this area, though a slight downward trend in CWDs is observed in this area (Figure 7). In the case of Cape St Lucia, the number of CWDs had a non-significant increasing trend over one-time measurement period from 1980 to 1990 and a slightly decreasing trend between 1994 and 2004. Estcourt showed a very slight upward trend from 1980 to 1989 and a non-significant downward trend was observed thereafter, until 2006 where we start to see a slightly more visible downward trend. The non-significant trends especially during the 1980–1990 period are accompanied by weak correlation coefficients of the variables being studied and higher Significance F values more especially for the Cape St Lucia and Estcourt stations. The correlation improves during the 1994–2004 sub-period for all stations, however, the Significance F values remain higher, except in Cedara where a good correlation between variables as well as a low Significance F value is noted. A low Significance F value was also seen in Estcourt during the 2005–2017 time period, highlighting reduced significance. The trends have, therefore, been variable across the three stations examined, and trends seem to be localised.
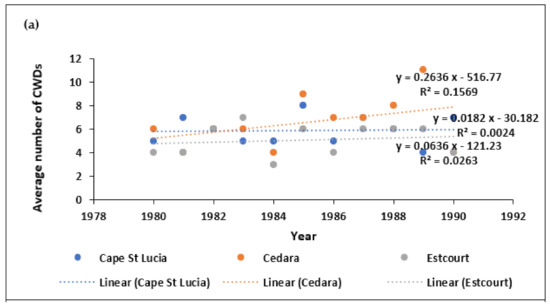
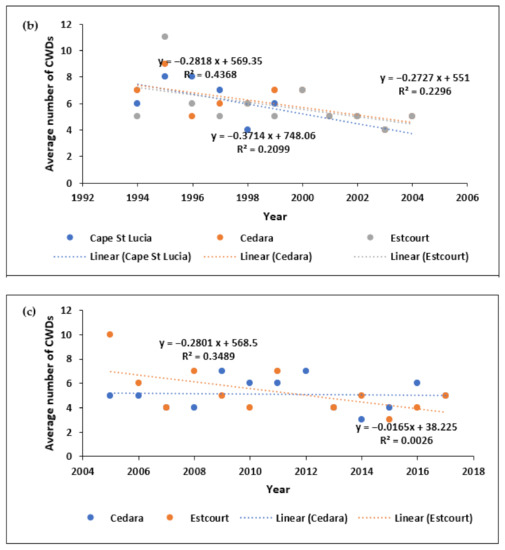
Figure 7.
Trends in the highest number of CWDs per year for different timelines for three weather stations within three climatic regions in KZN. (a) 1980–1990; (b) 1994–2004;(c) 2004–2017.
The most CWDs observed for Cedara was 11 (1989), 9 (1995), and 7 (2009, and 2012), while Cape St Lucia had 8 (1985, 1995, and 1996), and Estcourt had 7 (1983), 11(1995), and 10 (2005) (Figure 7). These CWDs are seasonally biased, like CDDs, and they highlight high spatial variability in rainfall behaviour between different stations and the nature of rainfall during wet seasons. The data also shows variations in CWDs over the years as well as outliers highlighting inconsistency of CWDs from year to year. From the actual total number of CWDs, the association of ENSO and rainfall behaviour over the different regions was highlighted, and most CWDs were observed during the cool phase of ENSO. Cool phases of ENSO (La Niña) are known to bring about wetter than normal conditions and flooding in many parts of South Africa, including KZN. For example, the late 1984 Demoina floods were linked to a cool phase of ENSO, the La Niña phase of 1983–1984. Studies by Richard et al. [11], Moeletsi et al. [12], Kane [13], and Rouault et al. [14] just to name a few relate South Africa’s precipitation variability to ENSO.
3.7. Extreme Rainfall Days (R20)
An assessment of extreme rainfall days is necessary because extreme rainfall events affect several human activities as well as different sectors ranging from agriculture to infrastructure. The number of years used to study extreme rainfall days per area was determined by the availability of relevant, high resolution data per region. A general linear trend shows that extreme rainfall days (days with 20 mm or more rainfall) gradually increased between 1980–2005 in Cape St Lucia and 1980–2011 in Estcourt, the opposite is seen over Cedara, where a downward trend is observed between 1980 and 2017 (Figure 7). A stronger correlation between the dependent and independent variables being evaluated for the R20 is seen in Estcourt and Cedara for the 1980–2017 study period. A weak correlation and a higher Significance F value are seen over the Cape St Lucia Station for the 1980–2006 time period. Differing significance levels and correlation variables are seen across all stations (Figure 8). The average number of extreme rainfall days in Cape St Lucia was 18 days per year, while Cedara and Estcourt only experienced an average of 10 extreme rainfall days per year. From this study, it was recognised that in most parts of KZN, extreme one-day rainfall (mm) events are gradually increasing. However, Cedara was an exception to this. This agrees with previous studies by Kruger and Nxumalo [15] and Nel [29], which recognised that extreme rainfall events have increased across most of KZN.
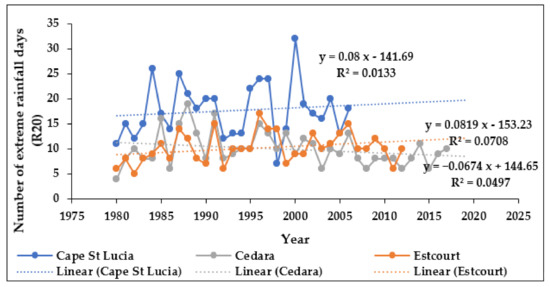
Figure 8.
The number of extreme rainfall days (R20) per annum for three weather stations across KZN (1980–2017).
The total number of extreme rainfall days is increasingly contributing to the total annual rainfall more than CWDs events, and this will likely be the future, particularly for areas that also experienced an overall downward trend in CWDs such as Cedara (Figure 7 and Figure 8). A decrease in R20, CWDs and a reduction in overall annual rainfall mean that parts of Region 12 are likely to be more susceptible to drought in future. Further, extreme one-day rainfall events are more likely to increase throughout KZN, giving false onsets, flash flooding and leading to issues such as increased runoff and soil erosion. False rainfall onsets have been experienced in most parts of southern Africa [12,15].
3.8. Air Temperature Trends
The Earth is progressively getting warmer. From 1880, a steady upward trend in land air temperature anomalies has been noted globally [30]. However, a more defined upward trend is recognised globally, in the northern hemisphere (NH) and the southern hemisphere (SH) after 1976 and the hottest years on record were found after the year 1976. The impacts of this steady upward trend along with the air temperature extremes are experienced globally, but the implications are likely to be greater in marginalised, poor, farming, and less resilient communities.
The province is typically warm with sunny sub-tropical climate features. Air temperatures in KZN are more extreme inland compared to coastal areas where the ocean breezes, low water vapour pressure deficits, high specific heat capacity of water compared to soil, moderate air temperatures, allowing for temperate inter-seasonal, intra-seasonal, and intra-day air temperature (maximum and minimum air temperatures) variations. Region 6 (Cape St Lucia and Durban), for example, experiences higher winter daily minimum (night-time) air temperatures compared to Region 7 and 12 (Figure 9 and Figure 10) due to moderating factors from ocean breezes.
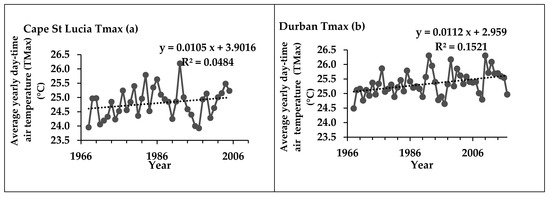
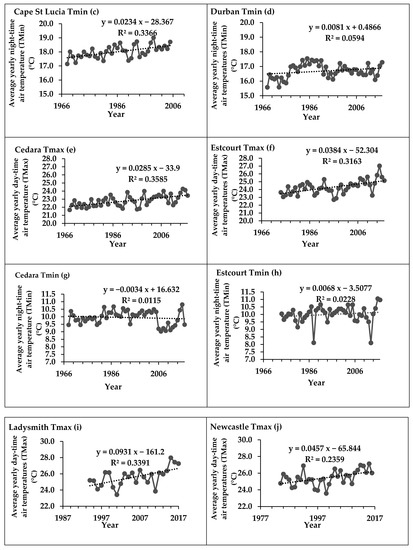
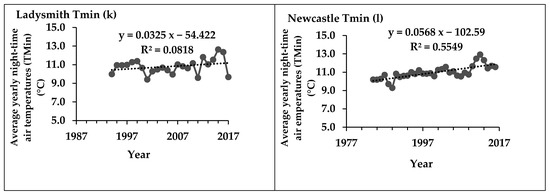
Figure 9.
Trends in air day-time and night-time air temperature averages for the six weather stations representing three climatic regions in KZN over the years. (a) Cape St Lucia Tmax; (b) Durban Tmax; (c) Cape St Lucia Tmin; (d) Durban Tmin; (e) Cedara Tmax; (f) Estcourt Tmax; (g) Cedara Tmin; (h) Estcourt Tmin; (i) Ladysmith Tmax; (j) Newcastle Tmax; (k) Ladysmith Tmin; (l) Newcastle Tmin.
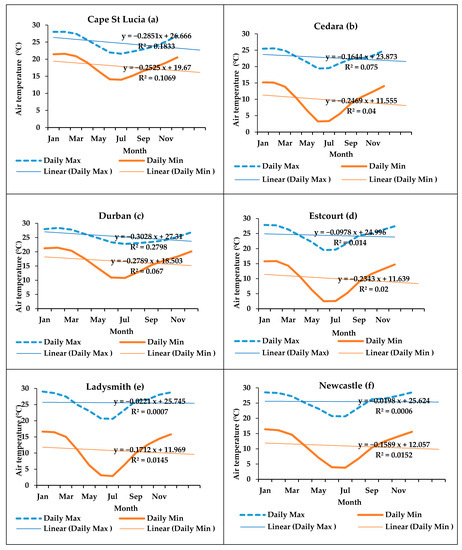
Figure 10.
Maximum and minimum average air temperature (°C) yearly routine (s) (1968–2017) for six weather stations across three climatic regions in KZN. (a) Cape St. Lucia; (b) Cedara; (c) Durban; (d) Estcourt; (e) Ladysmith; (f) Newcastle.
More extreme intra-day, intra-seasonal and inter-seasonal air temperature variations in the province’s interior (Cedara, Estcourt, Ladysmith, and Newcastle) were observed, with extreme heat dominant during spring–summer and extreme cold during autumn–winter seasons (Figure 9 and Figure 10). Cedara in Region 12 is the only area, amid the five other areas within the three different regions that displayed a slight downward trend in night-time air temperature averages through the years as demonstrated by a low Significance F value for the regression (Figure 9). The decrease in night-time air temperatures and the increase in day-time air temperatures observed over the years within this area highlight distinct air temperature variations between day and night-time air temperatures due to, for example, the low specific heat capacity of the soil. These changes, together with decreased CWDs and mean annual rainfall, are exposing the region to more dryness, dry spells, and drought. Our regression trends for Tmin showed a high correlation between the variables being evaluated with the exception of the Estcourt and Newcastle stations where the correlation coefficients were lower. Correlation coefficients were good in most stations and statistically, the Tmax regressions were significant for most stations especially the Durban, Ladysmith, and Newcastle stations.
Stations in Ladysmith and Newcastle of Region 7 both showed upward trends in daily minimum air temperatures (night-time air temperature). The upward trend in night-time air temperatures alongside the upward trend in day-time air temperatures confirms increased warming in this region, which is in line with the widely recognized increase in air temperatures in the Southern Hemisphere and globally (Figure 9). Given that this is a dry region already compared to the other two regions, increased heat due to rising air temperatures will expose the region to more dryness and drought-like conditions. Newcastle is expected to be more affected because, in addition to the air temperature variations, this area also experienced a decrease in the annual number of rainfall days.
The province of KZN is characterised by warm to scorching summers, heatwaves, wildfires, and moderate winters. The maximum daily air temperatures during summer months are as high as 40.2 °C in Cedara and Estcourt (Region 12), 40.1 °C in Durban and Cape St Lucia (Region 6), and 40.1 °C in Newcastle and Ladysmith (Region 7). In winter of the same year, the minimum daily air temperatures as low as −3.5 °C in region 12, 6.4 °C in region 6, and 1.2 °C in Region 7 were observed. Both minimum and maximum daily air temperatures are usually at their lowest during winter seasons and most extreme, in terms of heat, during December–January (Figure 10). Extreme cold is seen in the central KZN (regions 7 and 12) during winter where air temperatures decrease to below freezing point. In contrast, the air temperatures around coastal areas are moderated even during winter (Figure 9 and Figure 10).
The number of warm days and nights are increasing while cold days and nights are decreasing and minimum air temperatures are increasing throughout KZN except for Cedara, where daily minimum air temperatures show a slight downward trend. In addition, warm spell durations are likely to increase in KZN and heatwaves may continue to become more prevalent. This may have impacts on the number of frost days in the winter season to which natural habitats may respond negatively. The increase in air temperatures is in line with the global trends, [16,26] and is not necessarily unique to KZN.
3.9. Moisture Stress as a Proxy of NDVI
An assessment of moisture stress or hydrological drought over long periods also indicates how a place is getting dry and is an important indicator for drought [31]. The maps are shown in Figure 11 present changes in NDVI, a proxy of moisture stress, in KZN in 2000, 2010, and 2020. The overall moisture stress variation is an indicator of declining water presence in the province over the years, an indicator of worsening water scarcity, a situation which is projected to evolve from bad to worse in the near future.
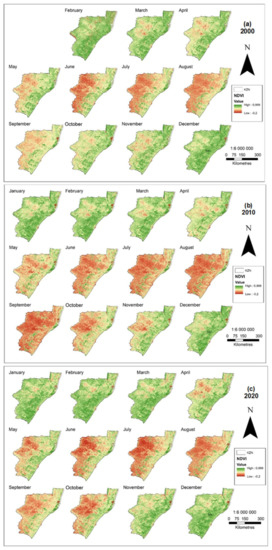
Figure 11.
Annual variations in moisture stress as a proxy of normalised difference vegetation index (NDVI) in 2000 (a), 2010 (b) and 2020 (c) in KZN.
A Mann–Kendall Test was used for the NDVI data from 2000 to 2020 and the time series data showed a statistically significant downward trend indicating constantly increasing drying conditions. The test results correspond with the other analyses done in the paper which indicates drying conditions across most stations, except the Durban station where no significant trends were detected. A more distinct and statistically significant trend at a 95% confidence level was observed in the Cape St Lucia station. The Mann–Kendall Test results are shown in Supplementary Materials Figure S1. Although NDVI variation could be insignificant on the given maps and the SI, water stress in the province is gradually worsening over the years and is compounded by intra-seasonal droughts. This is evidenced by the increasing frequency of droughts in the country [4].
Evolving rainfall and air temperature variations as a result of climate change have significant scale-specific impacts on societies. Understanding such features is essential for planning as well as formulating strategies for area-specific adaptation. Table 5 presents a summary of key results, their link to the United Nation’s Sustainable Development Goals (SDGs) as well as recommendations that could be implemented when formulating local adaptation strategies. These results demonstrate the impact of climate change on various sectors of society which have repercussions on the environment and numerous activities that are directly linked to local livelihoods. Although there are measures that could be taken to help local communities, for example in rural KZN absorb the shocks, most of the time these communities lack the capacity to implement these measures correctly and timely.

Table 5.
Key results, repercussions, and recommendations for adaptation.
4. Conclusions
Local climate-change-induced rainfall and air temperature variability and characteristics are often neglected or generalised. However, rainfall together with air temperature regimes poses a significant threat to different sectors of society. Recent drought periods and gradual area-specific aridification due to changes in rainfall regimes, CDDs, changes in the number of annual rainfall days as well as mean annual rainfall demonstrate climate change at a local scale which will have significant repercussions in the future, especially for small-scale farmers. Dynamic trends and characteristics of both rainfall and air temperature regimes must be understood from context-specific perspectives for improved planning, local livelihood security, adaptation strategies, and overall paths towards contextualised resilience. The study used climate data extracted from six meteorological stations across KZN obtained through the South African Weather Service, we supplemented this data with MODIS NDVI Data. Relevant indicators were used to understand the characteristics, variability, trends, and risks associated with rainfall periods and air temperature trends, which may threaten livelihood strategies and human activities. Correlation coefficients and significance levels of the different climatic trends and variabilities were analysed using the Microsoft Excel platform. The information allowed for an improved understanding of regional climatological rainfall and air temperature trends which are essential when formulating contextualised climate change adaptation strategies. The nature of rainfall, drought periods, and extreme air temperature events was found to be more indistinct and more variable than the study had initially expected. However, trends in rainfall and air temperature, which may lead to more distinct dryness and drought in ENSO neutral years, were observed. A decrease in the number of rainy days for example, in conjunction with an increase in Tmin and Tmax between 1968–2004 and 1968–2017, respectively, were seen over some stations such as Cape St Lucia and Newcastle, which serves as an indication of possible drier conditions in the near future. With the unpredictable and highly variable rainfall in KZN, it is essential to keep up-to-date with current trends to better prepare for risks and disasters, especially since KZN has extensive agricultural areas, most of which are interlinked with local people’s livelihood strategies. This is because the state of rainfall and air temperatures determine the state of agricultural production and productivity. In rural communities, for example, displaced agrarian activities due to rainfall or air temperature variations mean displaced household livelihood strategies. Context-specific, multi-disciplinary adaptation research, for risk assessments, impact response and future adaptation, and resilience to climate variability and change is vital. These would be more suitable compared to generalised large scale national or provincial adaptation research and response strategies.
Supplementary Materials
The following are available online at https://www.mdpi.com/article/10.3390/atmos12040427/s1, Figure S1: Mann–Kendall Test, Table S1: Statistical outputs: Linear.
Author Contributions
Conceptualization, A.D.C., M.J.S., and T.M.; methodology, M.N., A.D.C., M.J.S., L.N., J.M., and T.M.; data collection, M.N.; resources, A.D.C. and T.M.; data curation and analyses, M.N., A.D.C., and M.J.S.; writing—original draft preparation, M.N.; writing—review and editing, M.N., A.D.C., M.J.S., L.N., J.M., and T.M.; project administration, T.M.; funding acquisition, T.M.; critical review and redrafting, A.D.C., M.J.S., L.N., J.M., and T.M. All authors have read and agreed to the published version of the manuscript.
Funding
The uMngeni Resilience Project, which is funded by the Adaptation Fund, is acknowledged for supporting the community engagements and practical contextualization of impacts of drought and air temperature events from a local scale. The Sustainable and Healthy Food Systems (SHEFS) programme supported by the Wellcome Trust’s Our Planet, Our Health programme [grant number: 205200/Z/16/Z] for supporting the writing of this manuscript, and MN and TM are supported by this grant.
Institutional Review Board Statement
Not applicable.
Data Availability Statement
Publicly available datasets were analysed in this study. This data can be found here: https://developers.google.com/earth-engine/datasets/catalog/ (accessed on 23 March 2021).
Acknowledgments
The South African Weather Service (SAWS) is acknowledged for providing the rainfall and air temperature datasets that were used in this research. Sithabile Hlahla is acknowledged for assisting with the English language editing and formatting of the manuscript.
Conflicts of Interest
The authors declare no conflict of interest.
References
- Bell, J.E.; Brown, C.L.; Conlon, K.; Herring, S.; Kunkel, K.E.; Lawrimore, J.; Luber, G.; Schreck, C.; Smith, A.; Uejio, C. Changes in extreme events and the potential impacts on human health. J. Air Waste Manag. Assoc. 2018, 68, 265–287. [Google Scholar] [CrossRef]
- Arora, N.K. Impact of climate change on agriculture production and its sustainable solutions. Environ. Sustain. 2019, 2. [Google Scholar] [CrossRef]
- Patz, J.A.; Grabow, M.L.; Limaye, V.S. When it rains, it pours: Future climate extremes and health. Ann. Glob. Health 2014, 80, 332–344. [Google Scholar] [CrossRef]
- Nhamo, L.; Mabhaudhi, T.; Modi, A. Preparedness or repeated short-term relief aid? Building drought resilience through early warning in southern Africa. Water SA 2019, 45, 75–85. [Google Scholar] [CrossRef]
- Mpandeli, S.; Nhamo, L.; Moeletsi, M.; Masupha, T.; Magidi, J.; Tshikolomo, K.; Liphadzi, S.; Naidoo, D.; Mabhaudhi, T. Assessing climate change and adaptive capacity at local scale using observed and remotely sensed data. Weather Clim. Extrem. 2019, 26, 100240. [Google Scholar] [CrossRef]
- Satterthwaite, D.; Archer, D.; Colenbrander, S.; Dodman, D.; Hardoy, J.; Mitlin, D.; Patel, S. Building resilience to climate change in informal settlements. One Earth 2020, 2, 143–156. [Google Scholar] [CrossRef]
- Sujakhu, N.M.; Ranjitkar, S.; He, J.; Schmidt-Vogt, D.; Su, Y.; Xu, J. Assessing the livelihood vulnerability of rural indigenous households to climate changes in Central Nepal, Himalaya. Sustainability 2019, 11, 2977. [Google Scholar] [CrossRef]
- Miralles, D.G.; Gentine, P.; Seneviratne, S.I.; Teuling, A.J. Land–atmospheric feedbacks during droughts and heatwaves: State of the science and current challenges. Ann. N. Y. Acad. Sci. 2019, 1436, 19. [Google Scholar] [CrossRef] [PubMed]
- McCabe, M.F.; Rodell, M.; Alsdorf, D.E.; Miralles, D.G.; Uijlenhoet, R.; Wagner, W.; Lucieer, A.; Houborg, R.; Verhoest, N.E.; Franz, T.E. The future of Earth observation in hydrology. Hydrol. Earth Syst. Sci. 2017, 21, 3879. [Google Scholar] [CrossRef]
- Wehrli, K.; Guillod, B.P.; Hauser, M.; Leclair, M.; Seneviratne, S.I. Identifying key driving processes of major recent heat waves. J. Geophys. Res. Atmos. 2019, 124, 11746–11765. [Google Scholar] [CrossRef]
- Richard, Y.; Fauchereau, N.; Poccard, I.; Rouault, M.; Trzaska, S. 20th century droughts in southern Africa: Spatial and temporal variability, teleconnections with oceanic and atmospheric conditions. Int. J. Climatol. 2001, 21, 873–885. [Google Scholar] [CrossRef]
- Moeletsi, M.E.; Walker, S.; Landman, W.A. ENSO and implications on rainfall characteristics with reference to maize production in the Free State Province of South Africa. Phys. Chem. Earth Parts A/B/C 2011, 36, 715–726. [Google Scholar] [CrossRef]
- Kane, R. Periodicities, ENSO effects and trends of some South African rainfall series: An update. S. Afr. J. Sci. 2009, 105, 199–207. [Google Scholar] [CrossRef]
- Rouault, M.; Roy, S.S.; Balling, R.C., Jr. The diurnal cycle of rainfall in South Africa in the austral summer. Int. J. Climatol. 2013, 33, 770–777. [Google Scholar] [CrossRef]
- Kruger, A.C.; Nxumalo, M. Historical rainfall trends in South Africa: 1921–2015. Water SA 2017, 43, 285–297. [Google Scholar] [CrossRef]
- Donat, M.; Alexander, L.; Yang, H.; Durre, I.; Vose, R.; Dunn, R.; Willett, K.; Aguilar, E.; Brunet, M.; Caesar, J. Updated analyses of temperature and precipitation extreme indices since the beginning of the twentieth century: The HadEX2 dataset. J. Geophys. Res. Atmos. 2013, 118, 2098–2118. [Google Scholar] [CrossRef]
- MacKellar, N.; New, M.; Jack, C. Observed and modelled trends in rainfall and temperature for South Africa: 1960–2010. S. Afr. J. Sci. 2014, 110, 1–13. [Google Scholar] [CrossRef]
- Connolly-Boutin, L.; Smit, B. Climate change, food security, and livelihoods in sub-Saharan Africa. Reg. Environ. Change 2016, 16, 385–399. [Google Scholar] [CrossRef]
- David, A.; Guilbert, N.; Hamaguchi, N.; Higashi, Y.; Hino, H.; Leibbrandt, M.; Shifa, M. Spatial Poverty and Inequality in South Africa: A Municipality Level Analysis; Southern Africa Labour and Development Research Unit, Uiveristy of Cape Town (UCT): Cape Town, South Africa, 2018; p. 39. [Google Scholar]
- Mosoetsa, S. Compromised communities and re-emerging civic engagement in Mpumalanga Township, Durban, KwaZulu-Natal. J. South. Afr. Stud. 2005, 31, 857–873. [Google Scholar] [CrossRef]
- Bhaga, T.D.; Dube, T.; Shekede, M.D.; Shoko, C. Impacts of Climate Variability and Drought on Surface Water Resources in Sub-Saharan Africa Using Remote Sensing: A Review. Remote Sens. 2020, 12, 4184. [Google Scholar] [CrossRef]
- Davis, C.L.; Vincent, K. Climate Risk and Vulnerability: A Handbook for Southern Africa, 2nd ed.; Council for Scientific and Industrial Research (CSIR): Pretoria, South Africa, 2017; p. 202. [Google Scholar]
- Sahani, J.; Kumar, P.; Debele, S.; Spyrou, C.; Loupis, M.; Aragão, L.; Porcù, F.; Shah, M.A.R.; Di Sabatino, S. Hydro-meteorological risk assessment methods and management by nature-based solutions. Sci. Total Environ. 2019, 696, 133936. [Google Scholar] [CrossRef]
- Kruger, A. Climate of South Africa: Climate Regions; South African Weather Service: Pretoria, South Africa, 2004; p. 19.
- Ndlovu, M.S.; Demlie, M. Assessment of meteorological drought and wet conditions using two drought indices across KwaZulu-Natal Province, South Africa. Atmosphere 2020, 11, 623. [Google Scholar] [CrossRef]
- Alexander, L.V. Global observed long-term changes in temperature and precipitation extremes: A review of progress and limitations in IPCC assessments and beyond. Weather Clim. Extrem. 2016, 11, 4–16. [Google Scholar] [CrossRef]
- Zoungrana, B.J.; Conrad, C.; Thiel, M.; Amekudzi, L.K.; Da, E.D. MODIS NDVI trends and fractional land cover change for improved assessments of vegetation degradation in Burkina Faso, West Africa. J. Arid Environ. 2018, 153, 66–75. [Google Scholar] [CrossRef]
- De Waal, J.H.; Chapman, A.; Kemp, J. Extreme 1-day rainfall distributions: Analysing change in the Western Cape. S. Afr. J. Sci. 2017, 113, 1–8. [Google Scholar] [CrossRef]
- Nel, W. Observations on daily rainfall events in the KwaZulu-Natal Drakensberg. Water SA 2008, 34, 271–274. [Google Scholar] [CrossRef][Green Version]
- Wang, J.; Xu, C.; Hu, M.; Li, Q.; Yan, Z.; Jones, P. Global land surface air temperature dynamics since 1880. Int. J. Climatol. 2018, 38, e466–e474. [Google Scholar] [CrossRef]
- Van Loon, A.F. Hydrological drought explained. Wiley Interdiscip. Rev. Water 2015, 2, 359–392. [Google Scholar] [CrossRef]
Publisher’s Note: MDPI stays neutral with regard to jurisdictional claims in published maps and institutional affiliations. |
© 2021 by the authors. Licensee MDPI, Basel, Switzerland. This article is an open access article distributed under the terms and conditions of the Creative Commons Attribution (CC BY) license (http://creativecommons.org/licenses/by/4.0/).