
June–July Temperature Reconstruction of Kashmir Valley from Tree Rings of Himalayan Pindrow Fir


Abstract
1. Introduction
2. Materials and Methods
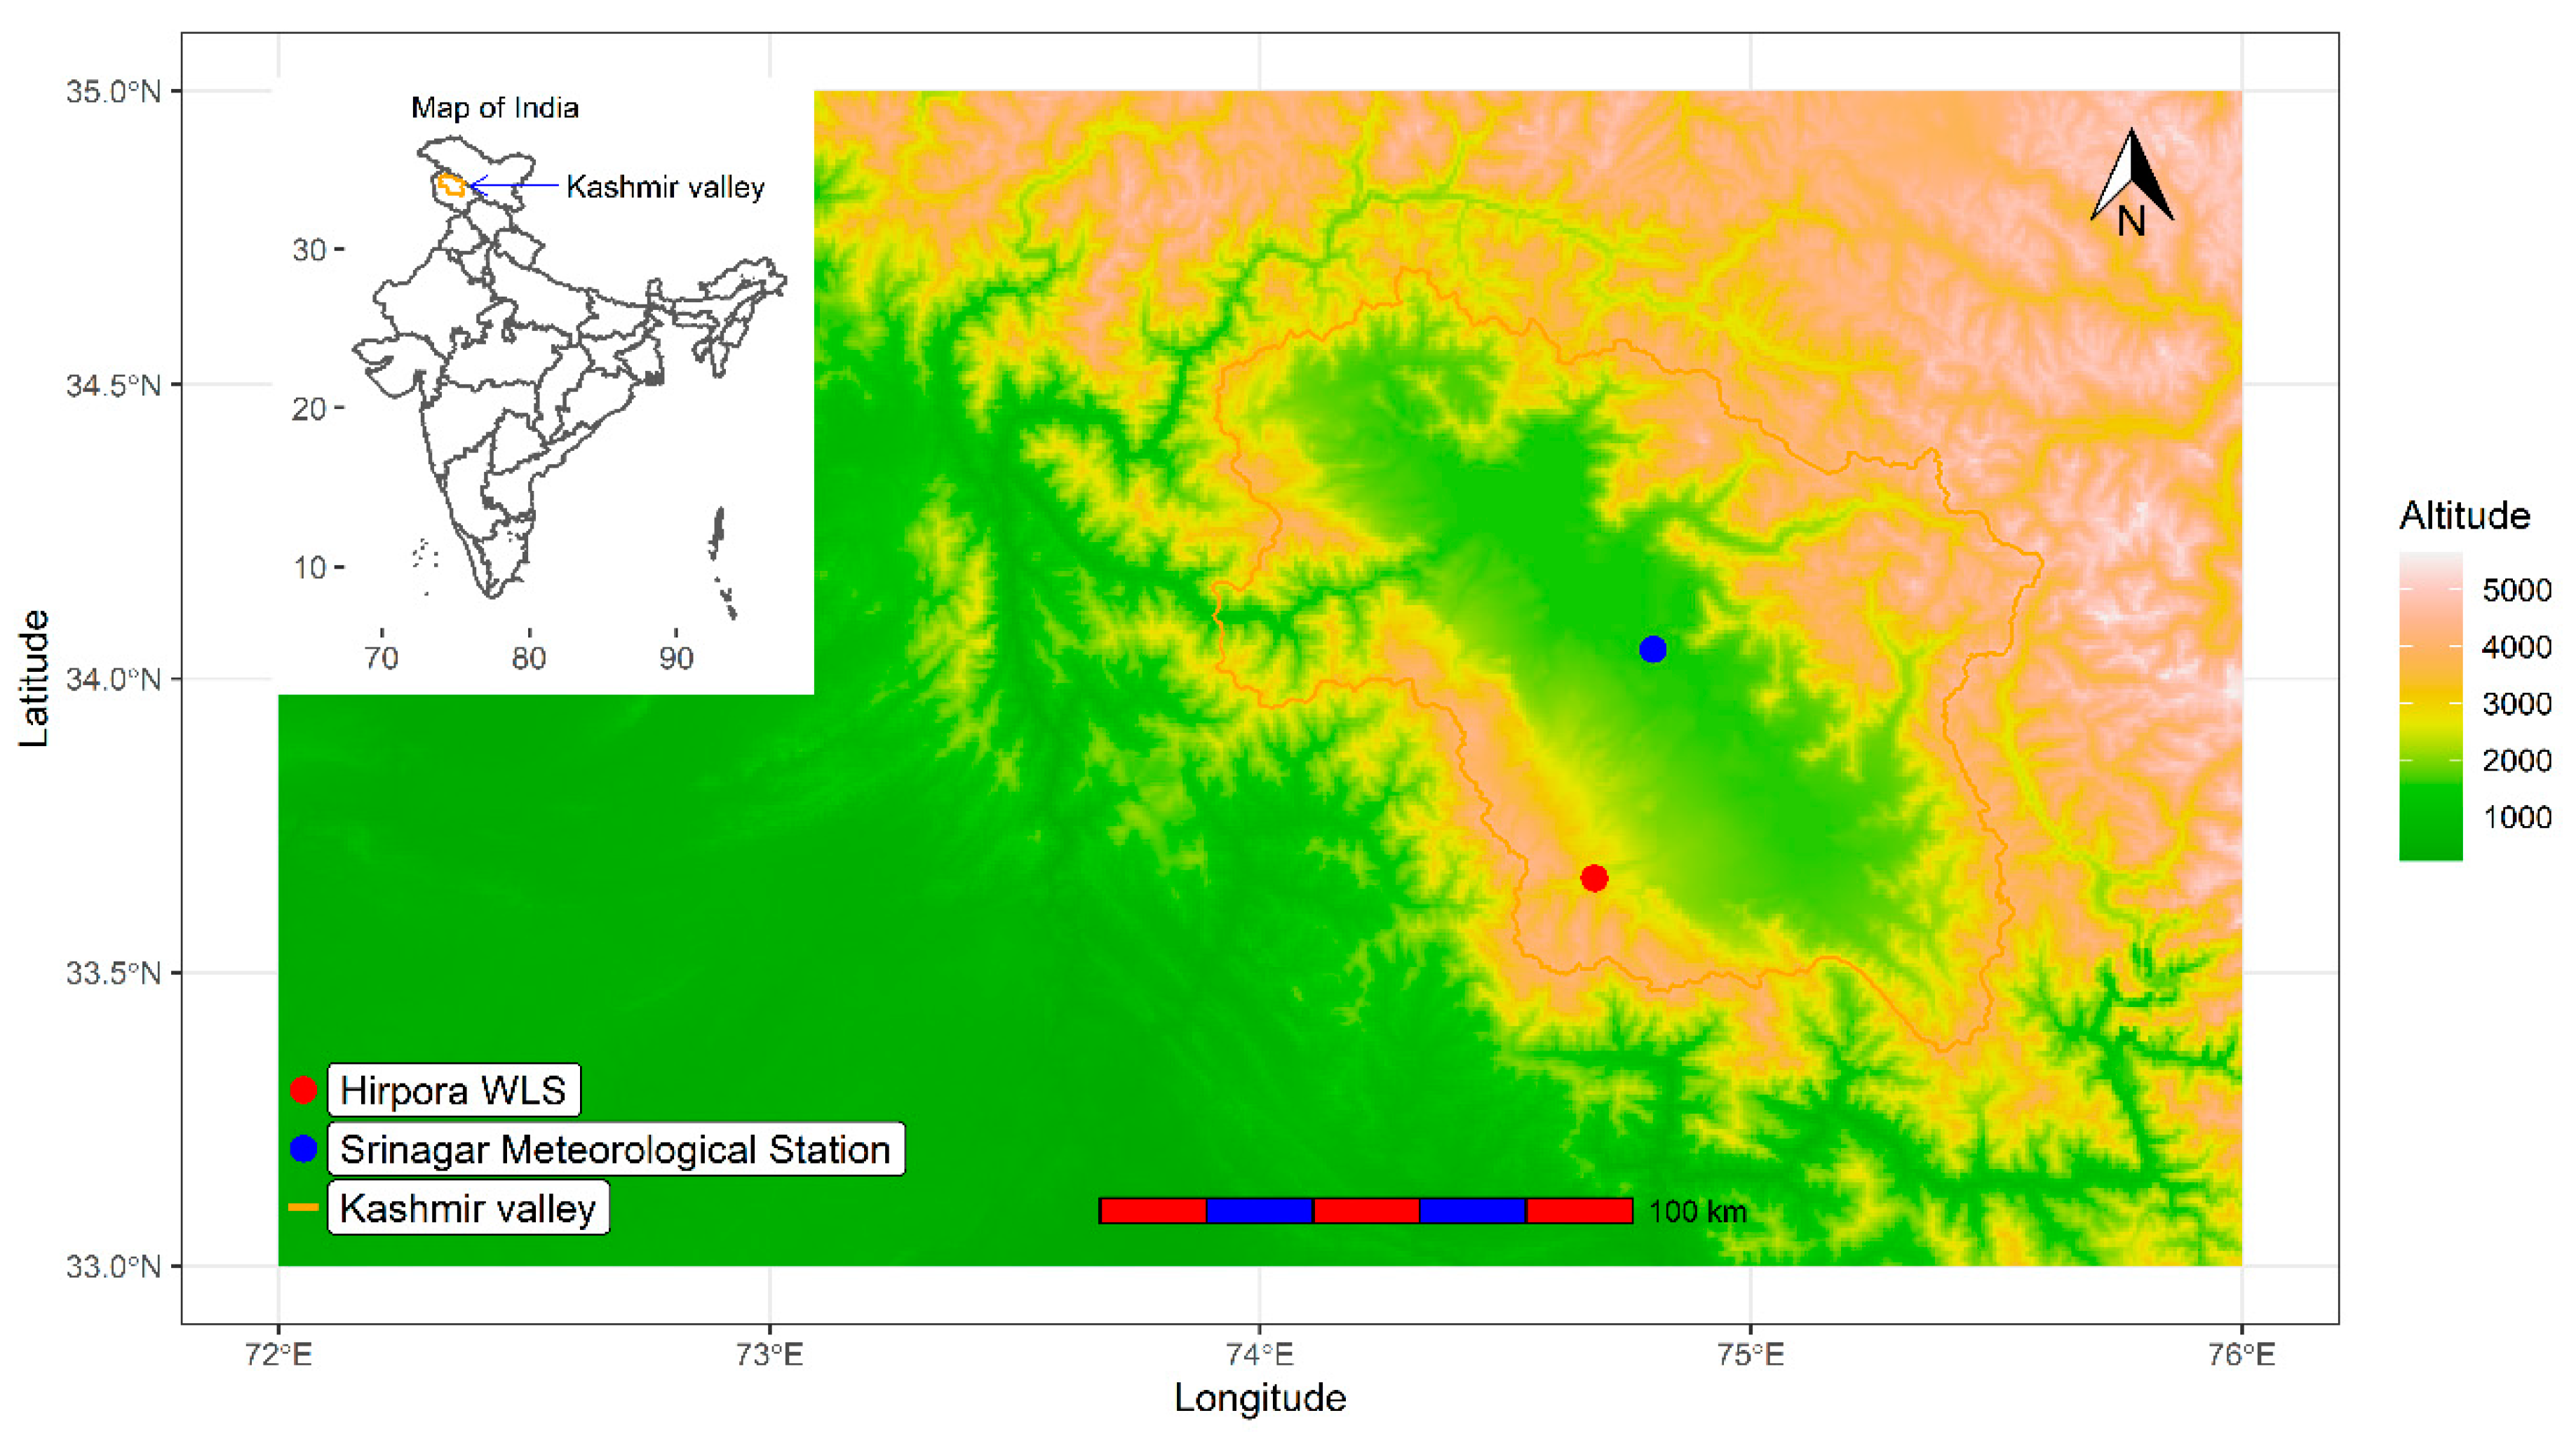
2.1. Study Area
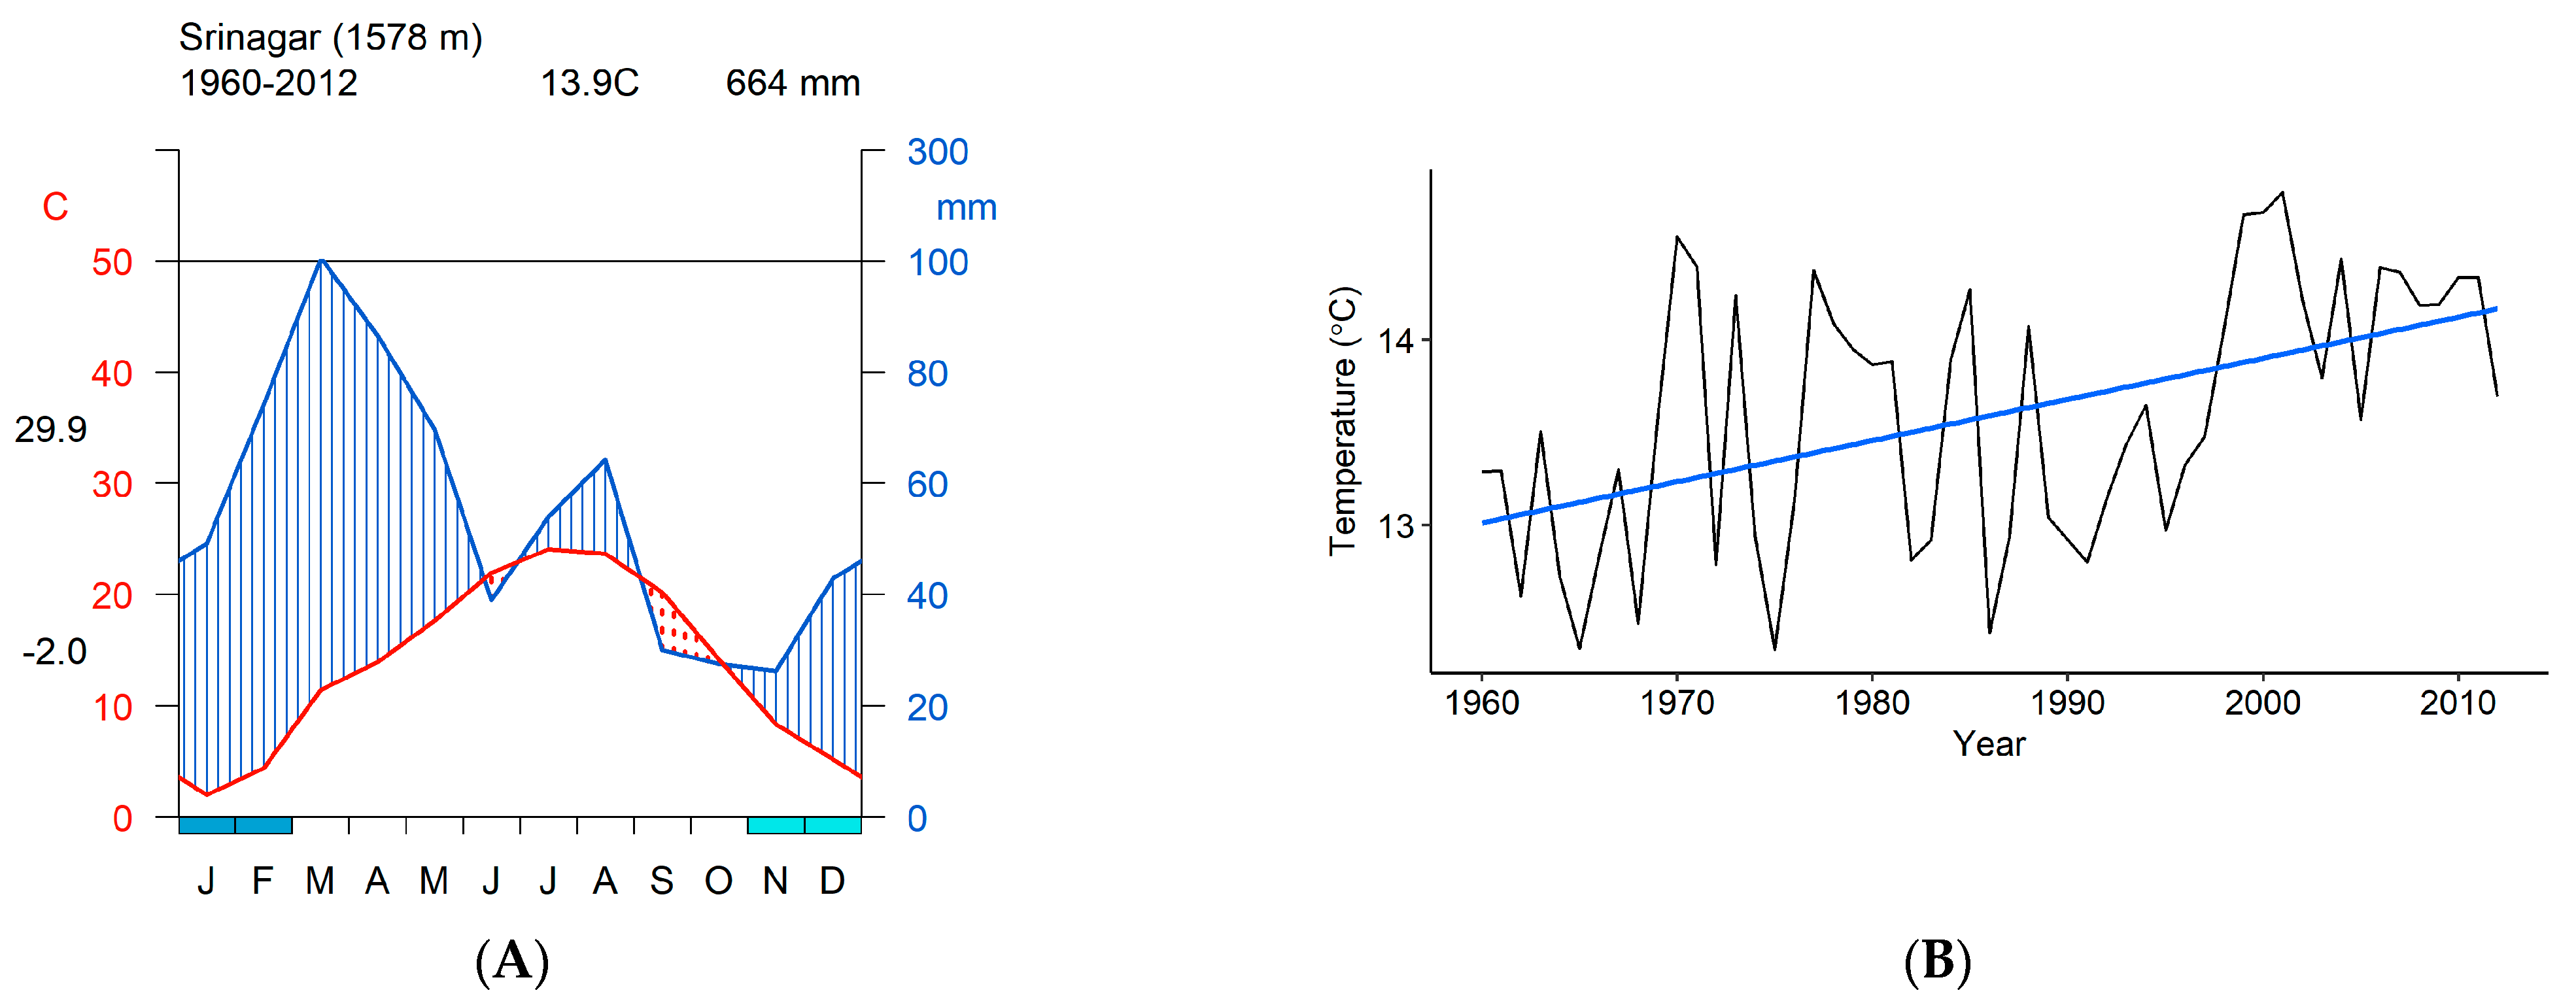
2.2. Climate of the Study Area
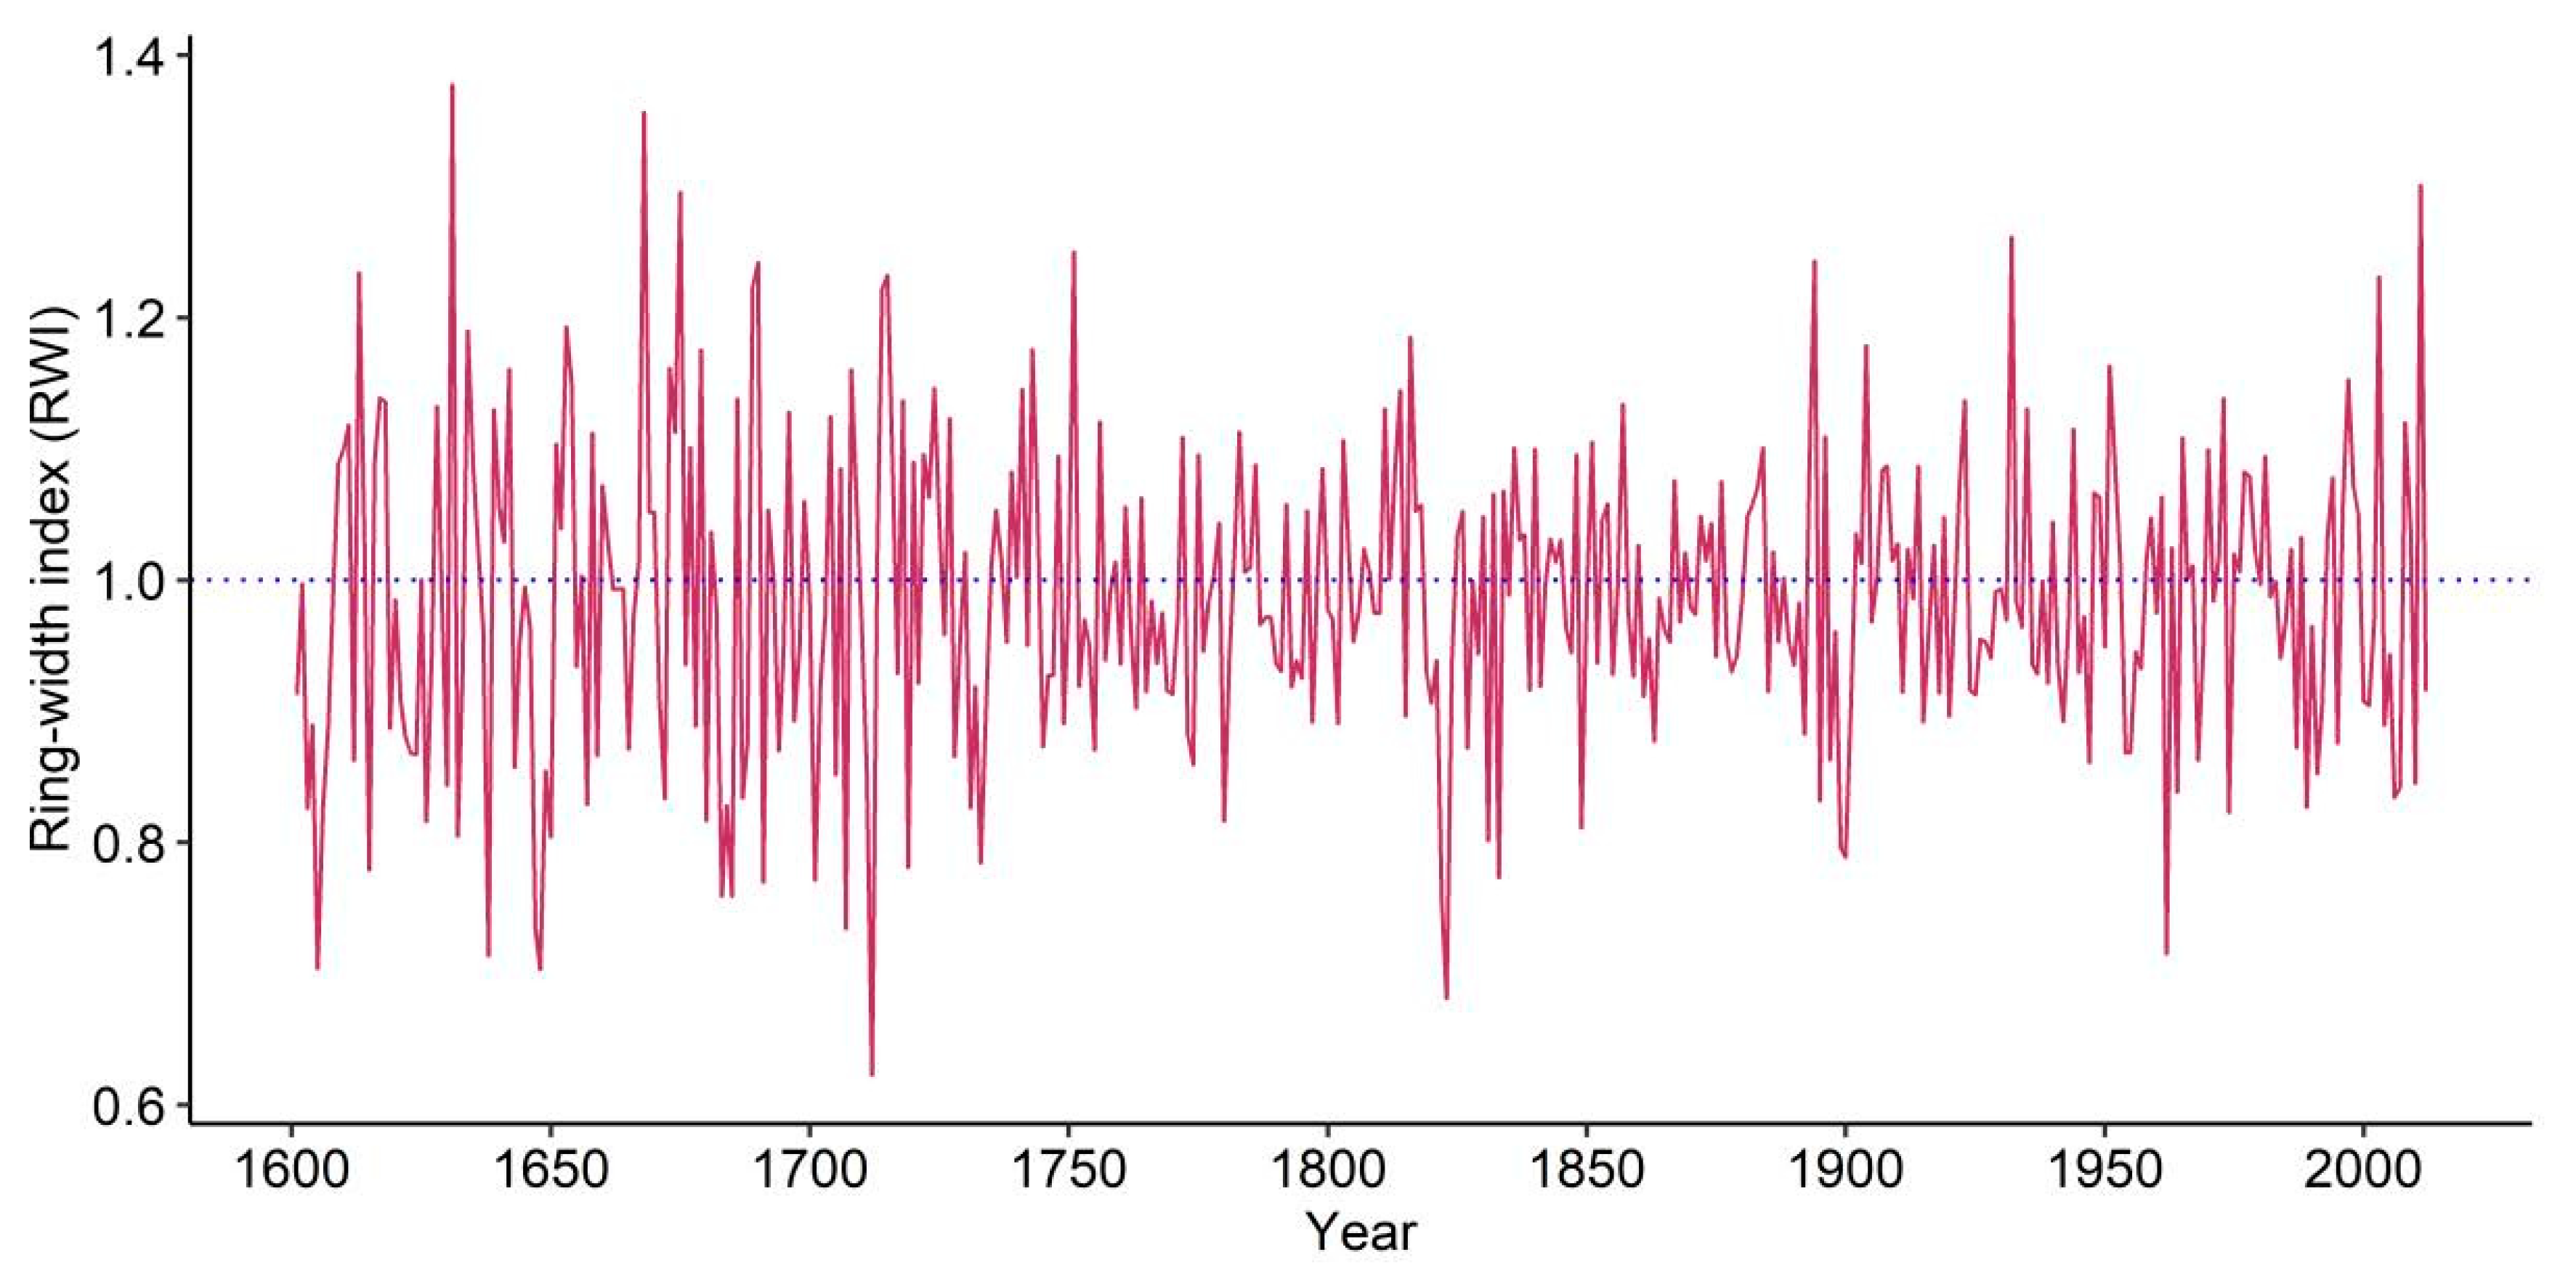
2.3. Chronology Development and Statistical Analysis
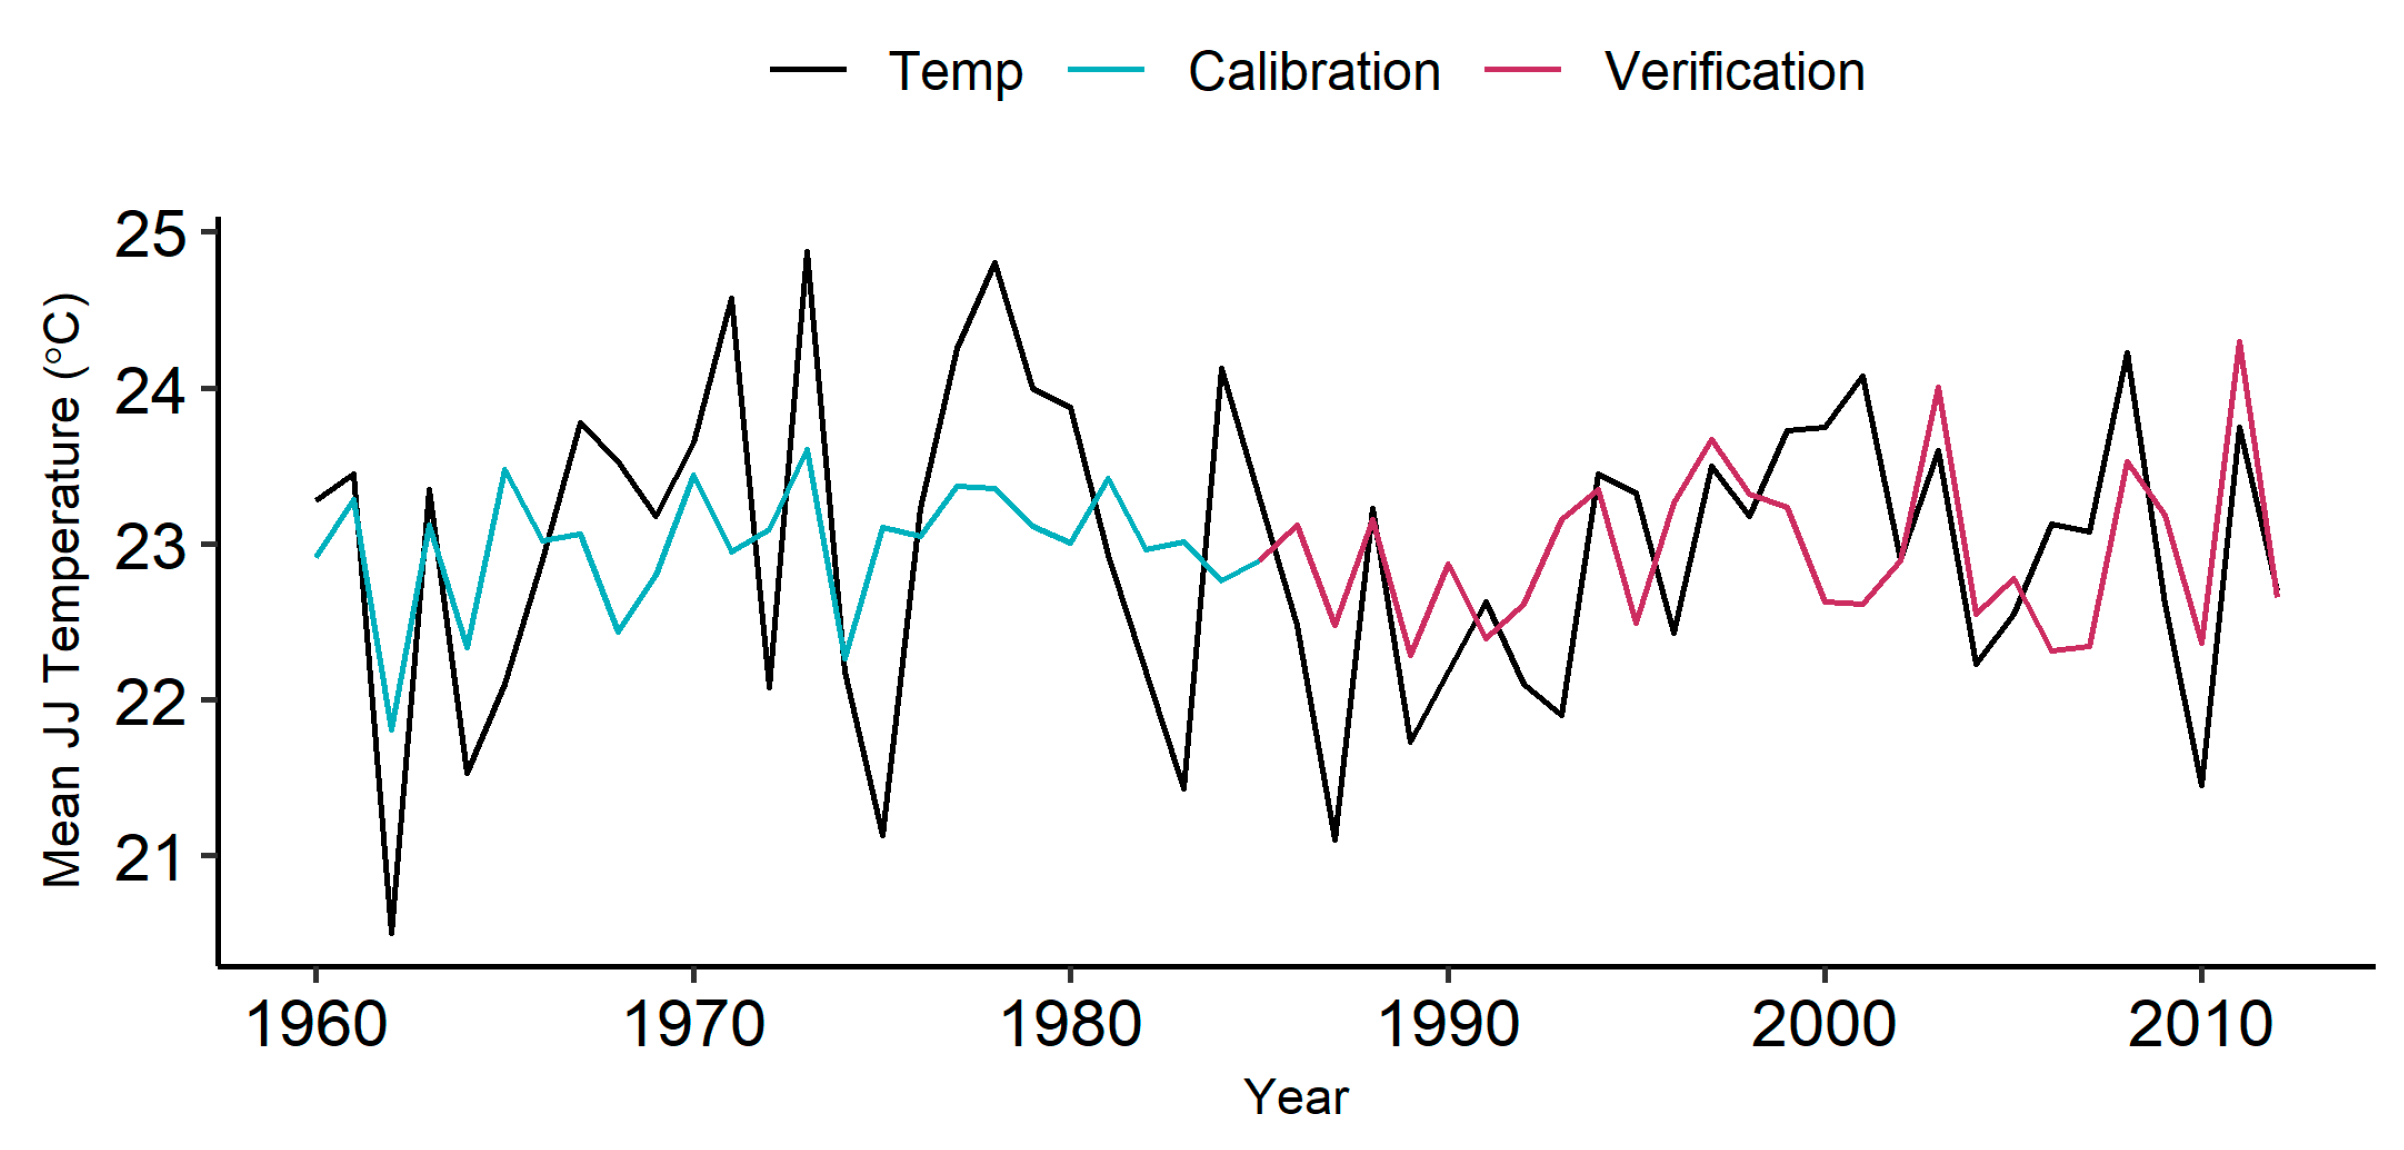
3. Result
4. Discussion
5. Conclusions
Author Contributions
Funding
Institutional Review Board Statement
Informed Consent Statement
Data Availability Statement
Acknowledgments
Conflicts of Interest
Submission Declaration and Verification
References
- Shepherd, A.; Wingham, D. Recent Sea-Level Contributions of the Antarctic and Greenland Ice Sheets. Science 2007, 315, 1529–1532. [Google Scholar] [CrossRef] [PubMed]
- Webster, P.J. Changes in Tropical Cyclone Number, Duration, and Intensity in a Warming Environment. Science 2005, 309, 1844–1846. [Google Scholar] [CrossRef] [PubMed]
- Shrestha, U.B.; Gautam, S.; Bawa, K.S. Widespread Climate Change in the Himalayas and Associated Changes in Local Ecosystems. PLoS ONE 2012, 7, e36741. [Google Scholar] [CrossRef]
- Immerzeel, W.W.; van Beek, L.P.H.; Bierkens, M.F.P. Climate Change Will Affect the Asian Water Towers. Scienc. 2010, 328, 1382–1385. [Google Scholar] [CrossRef] [PubMed]
- Bhutiyani, M.R. Climate Change in the Northwestern Himalayas. In Dynamics of Climate Change and Water Resources of Northwestern Himalaya; Society of Earth Scientists Series; Joshi, R., Kumar, K., Palni, L., Eds.; Springer: Cham, Switzerland, 2015; pp. 85–96. ISBN 978-3-319-13742-1. [Google Scholar] [CrossRef]
- Bhutiyani, M.R.; Kale, V.S.; Pawar, N.J. Climate change and the precipitation variations in the northwestern Himalaya: 1866–2006. Int. J. Climatol. 2010, 30, 535–548. [Google Scholar] [CrossRef]
- Cook, E.R.; Anchukaitis, K.J.; Buckley, B.M.; D’Arrigo, R.D.; Jacoby, G.C.; Wright, W.E. Asian Monsoon Failure and Megadrought During the Last Millennium. Science 2010, 328, 486–489. [Google Scholar] [CrossRef]
- Wilson, R.; Miles, D.; Loader, N.J.; Melvin, T.; Cunningham, L.; Cooper, R.; Briffa, K. A millennial long March–July precipitation reconstruction for southern-central England. Clim. Dyn. 2013, 40, 997–1017. [Google Scholar] [CrossRef]
- Fritts, H.C. Tree Rings and Climate; Elsevier: Cambridge, MA, USA, 1976. [Google Scholar]
- Bradley, R.S.; Fritts, H.C. Tree Rings and Climate. Arct. Alp. Res. 1978, 10, 144. [Google Scholar] [CrossRef]
- Bhattacharyya, A.; LaMarche, V.C., Jr.; Telewski, F.W.; Lamarche, V.; Telewski, F.W.; LaMarche, V.C., Jr.; Telewski, F.W. Dendrochronological Reconnaissance of the Conifers of Northwest India. Tree Ring Bull. 1988, 48, 21–30. [Google Scholar]
- Borgaonkar, H.P.; Sikder, A.B.; Ram, S. High altitude forest sensitivity to the recent warming: A tree-ring analysis of conifers from Western Himalaya, India. Quat. Int. 2011, 236, 158–166. [Google Scholar] [CrossRef]
- Gaire, N.P.; Bhuju, D.R.; Koirala, M.; Shah, S.K.; Carrer, M.; Timilsena, R. Tree-ring based spring precipitation reconstruction in western Nepal Himalaya since AD 1840. Dendrochronologia 2017, 42, 21–30. [Google Scholar] [CrossRef]
- Chaudhary, V.; Bhattacharyya, A.; Guiot, J.; Shah, S.K.; Srivastava, S.K.; Edouard, J.-L.; Thomas, A. Reconstruction of Auguts-September temperature in North-Western Himalaya since AD 1773, based on tree-ring data of Pinus Wallichiana and Abies Pindrow. In Holocene: Perspectives, Environmental Dynamics and Impact Events; Nova Science Publishers: New York, NY, USA, 2013; pp. 145–156. [Google Scholar]
- Treydte, K.S.; Schleser, G.H.; Helle, G.; Frank, D.C.; Winiger, M.; Haug, G.H.; Esper, J. The twentieth century was the wettest period in northern Pakistan over the past millennium. Nature 2006, 440, 1179–1182. [Google Scholar] [CrossRef] [PubMed]
- Singh, J.; Yadav, R.R.; Wilmking, M. A 694-year tree-ring based rainfall reconstruction from Himachal Pradesh, India. Clim. Dyn. 2009, 33, 1149–1158. [Google Scholar] [CrossRef]
- Hughes, M.K.; Davies, A. Dendroclimatology in Kashmir Using Tree-Ring Widths and Densities in Subalpine Conifers. In Methods of Dendrochronology: East-West Approaches; Kairiukstis, L.A., Bednarz, Z., Feliksik, E., Eds.; Polish Academy of Sciences: Warsaw, Poland, 1987; pp. 163–176. [Google Scholar]
- Hughes, M.K. Dendroclimatic evidence from the western Himalaya. In Climate Since AD 1500; Bradley, R.S., Jones, P.D., Eds.; Routledge Press: London, UK, 1992; pp. 415–431. [Google Scholar]
- Hughes, M.K. An improved reconstruction of summer temperature at Srinagar, Kashmir since 1660 AD, based on tree-ring width and maximum latewood density of Abies pindrow [Royle] Spach. Palaeobotanist 2001, 50, 13–19. [Google Scholar]
- Ramesh, R.; Bhattacharya, S.K.; Gopalan, K. Climatic correlations in the stable isotope records of silver fir (Abies pindrow) trees from Kashmir, India. Earth Planet. Sci. Lett. 1986, 79, 66–74. [Google Scholar] [CrossRef]
- Ramesh, R.; Bhattacharya, S.K.; Gopalan, K. Dendroclimatological implications of isotope coherence in trees from Kashmir Valley, India. Nature 1985, 317, 802–804. [Google Scholar] [CrossRef]
- Ram, S.; Borgaonkar, H.P. Climatic response of various tree ring parameters of fir (Abies pindrow) from Chandanwadi in Jammu and Kashmir, western Himalaya, India. Curr. Sci. 2014, 106, 1568–1576. [Google Scholar]
- Borgaonkar, H.P.; Pant, G.B.; Rupa Kumar, K. Dendroclimatic reconstruction of summer precipitation at Srinagar, Kashmir, India, since the late-eighteenth century. Holocene 1994, 4, 299–306. [Google Scholar] [CrossRef]
- Shah, S.K.; Pandey, U.; Mehrotra, N. Precipitation reconstruction for the Lidder Valley, Kashmir Himalaya using tree-rings of Cedrus deodara. Int. J. Climatol. 2018, 38, e758–e773. [Google Scholar] [CrossRef]
- Ram, S. Tree growth–climate relationships of conifer trees and reconstruction of summer season Palmer Drought Severity Index (PDSI) at Pahalgam in Srinagar, India. Quat. Int. 2012, 254, 152–158. [Google Scholar] [CrossRef]
- Dimri, A.P.; Niyogi, D.; Barros, A.P.; Ridley, J.; Mohanty, U.C.; Yasunari, T.; Sikka, D.R. Western Disturbances: A review. Rev. Geophys. 2015, 53, 225–246. [Google Scholar] [CrossRef]
- Pandey, S.; Carrer, M.; Castagneri, D.; Petit, G. Xylem anatomical responses to climate variability in Himalayan birch trees at one of the world’s highest forest limit. Perspect. Plant Ecol. Evol. Syst. 2018, 33, 34–41. [Google Scholar] [CrossRef]
- Qin, C.; Yang, B.; Melvin, T.M.; Fan, Z.; Zhao, Y.; Briffa, K.R. Radial growth of qilian juniper on the northeast tibetan plateau and potential climate associations. PLoS ONE 2013. [Google Scholar] [CrossRef]
- Bhutiyani, M.R.; Kale, V.S.; Pawar, N.J. Long-term trends in maximum, minimum and mean annual air temperatures across the Northwestern Himalaya during the twentieth century. Clim. Chang. 2007, 85, 159–177. [Google Scholar] [CrossRef]
- Cybis Elektronik CDendro and CooRecorder. Available online: http://www.cybis.se/forfun/dendro/ (accessed on 1 August 2018).
- Holmes, R.L. Computer-assisted quality control in tree-ring dating and measurement. Tree Ring Bull. 1983. [Google Scholar] [CrossRef]
- Bunn, A.G. Statistical and visual crossdating in R using the dplR library. Dendrochronologia 2010, 28, 251–258. [Google Scholar] [CrossRef]
- Grissino-Mayer, H.D. Evaluating crossdating accuracy: A manual and tutorial for the computer program COFECHA. Tree Ring Res. 2001, 57, 205–221. [Google Scholar]
- Wigley, T.M.L.; Briffa, K.L.; Jones, P.D. On the average value of correlated time series, with applications in dendroclimatology and hydrometeorology. Am. Meteorol. Soc. 1984, 23, 201–213. [Google Scholar] [CrossRef]
- Bunn, A.G. A dendrochronology program library in R (dplR). Dendrochronologia 2008, 26, 115–124. [Google Scholar] [CrossRef]
- R Core Team. R: A Language and Environment for Statistical Computing; R Foundation for Statistical Computing: Vienna, Austria, 2017; Available online: http://www.R-project.org/ (accessed on 17 March 2021).
- Cook, E.R. A Time Series Analysis Approach to Tree Ring Standardization. Ph.D Thesis, University of Arizona, Tucson, Arizona, 1995. [Google Scholar]
- Malik, R.; Rossi, S.; Sukumar, R. Cambial phenology in Abies pindrow (Pinaceae) along an altitudinal gradient in northwestern Himalaya. IAWA J. 2020, 41, 186–201. [Google Scholar] [CrossRef]
- Malik, R.; Rossi, S.; Sukumar, R. Variations in the timing of different phenological stages of cambial activity in Abies pindrow (Royle) along an elevation gradient in the north-western Himalaya. Dendrochronologia 2020, 59, 125660. [Google Scholar] [CrossRef]
- Fritts, H.C.C.; Guiot, J.; Gordon, G.A.A.; Schweingruber, F. Methods of Calibration, Verification, and Reconstruction. In Methods of Dendrochronology; Springer: Dordrecht, The Netherlands, 1990; pp. 163–217. [Google Scholar]
- Torrence, C.; Compo, G.P. A Practical Guide to Wavelet Analysis. Bull. Am. Meteorol. Soc. 1998, 79, 61–78. [Google Scholar] [CrossRef]
- Takahashi, K.; Azuma, H.; Yasue, K. Effects of climate on the radial growth of tree species in the upper and lower distribution limits of an altitudinal ecotone on Mount Norikura, central Japan. Ecol. Res. 2003, 18, 549–558. [Google Scholar] [CrossRef]
- Schweingruber, F.H. Tree Rings and Environment Dendrochronology; Paul Haupt AG, Bern: Bern, Switzerland, 1996. [Google Scholar]
- Zhang, Q.-B.; Hebda, R.J. Variation in radial growth patterns of Pseudotsuga menziesii on the central coast of British Columbia, Canada. Can. J. For. Res. 2004, 34, 1946–1954. [Google Scholar] [CrossRef]
- Fan, Z.-X.; Bräuning, A.; Cao, K.-F.; Zhu, S.-D. Growth–climate responses of high-elevation conifers in the central Hengduan Mountains, southwestern China. For. Ecol. Manag. 2009, 258, 306–313. [Google Scholar] [CrossRef]
- Dang, H.; Zhang, Y.; Zhang, K.; Jiang, M.; Zhang, Q. Climate-growth relationships of subalpine fir (Abies fargesii) across the altitudinal range in the Shennongjia Mountains, central China. Clim. Chang. 2013, 117, 903–917. [Google Scholar] [CrossRef]


| Time Span | No. of Trees | No. of Cores | Mean Sensitivity | Series Inter-Correlation | 1st Order Auto-Correlation | EPS > 0.85 |
|---|---|---|---|---|---|---|
| 1578–2012 | 44 | 60 | 0.18 | 0.47 | 0.54 | 1773–2012 |
| Whole Period (1960–2012) | Calibration Period (1960–1985) | Verification Period (1986–2012) | ||||
|---|---|---|---|---|---|---|
| R | p-Value | R | p-Value | RE | CE | RMSE |
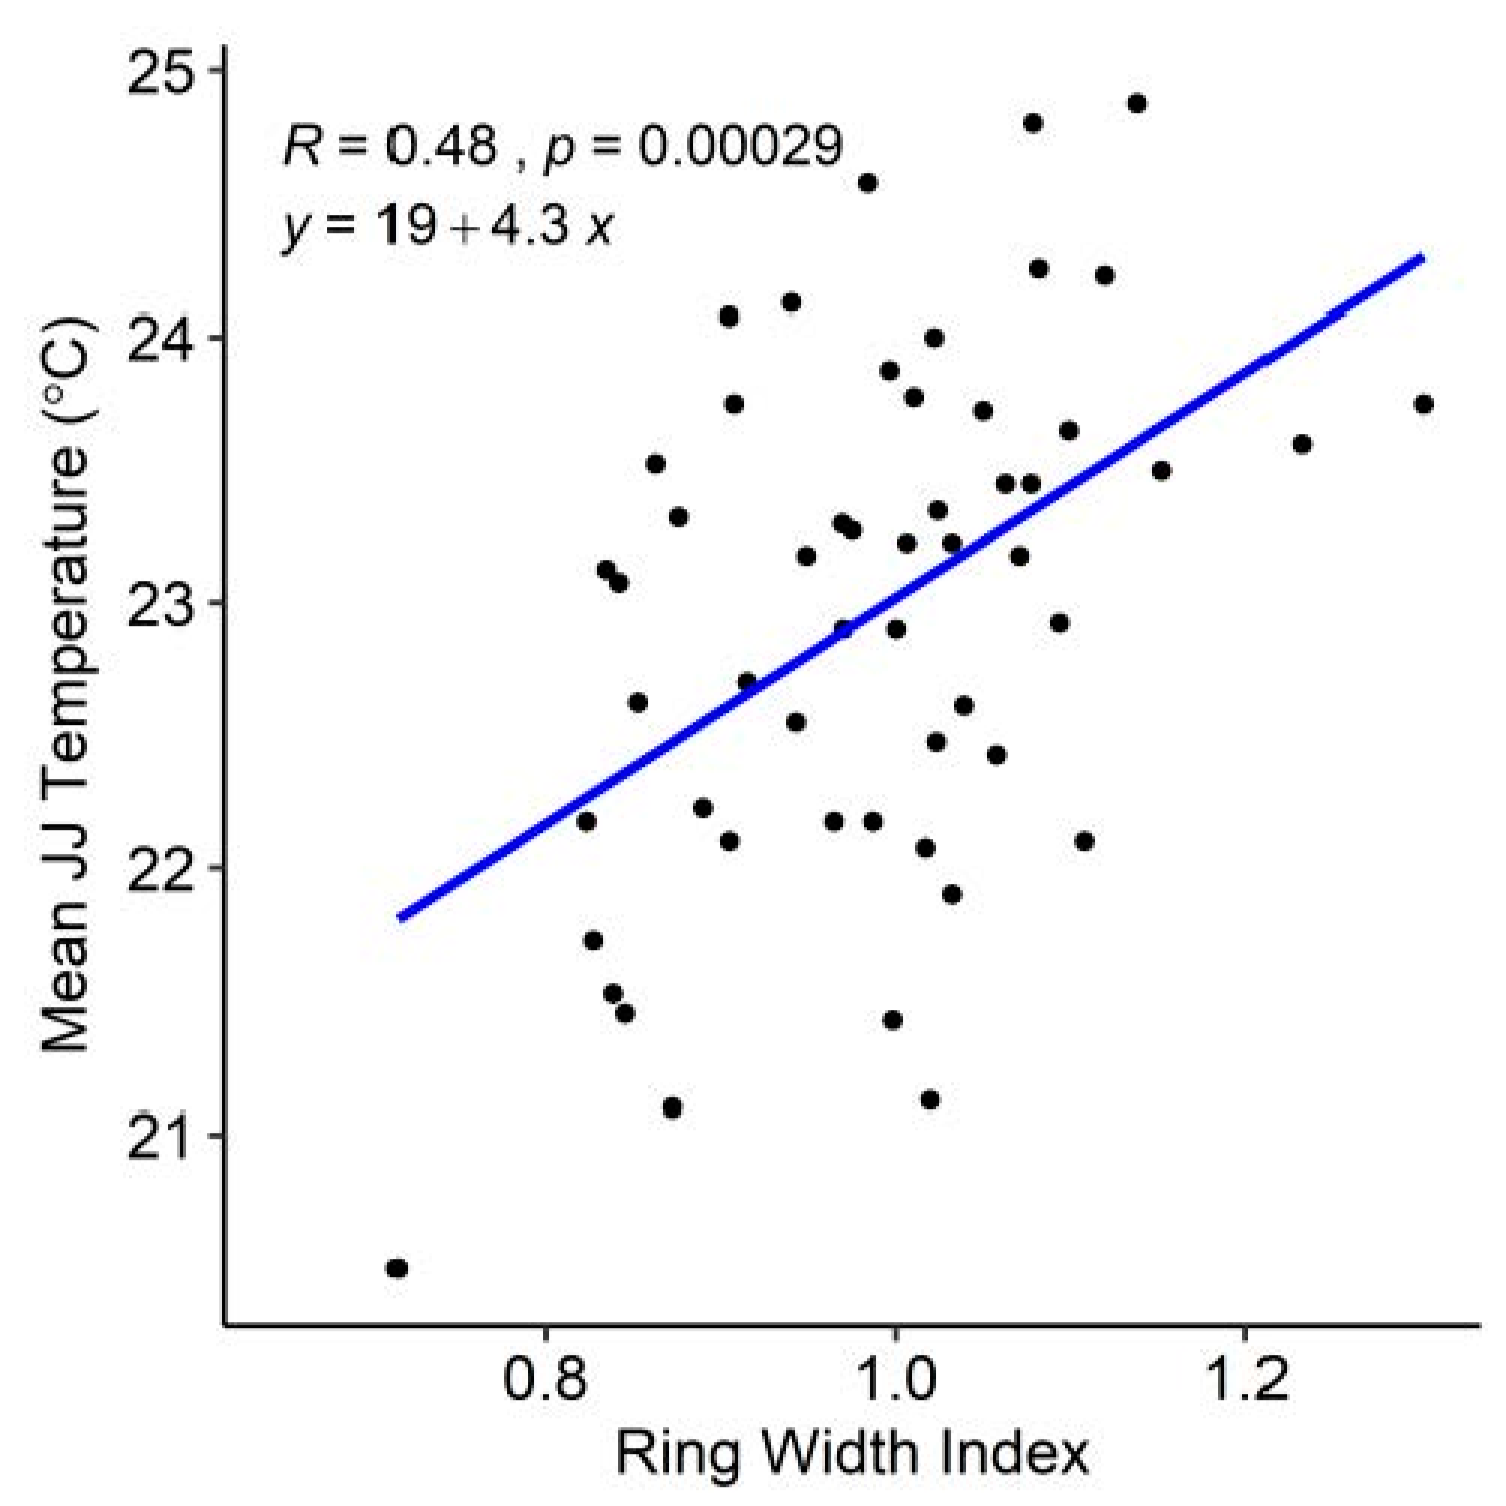
| 0.48 | <0.001 | 0.51 | <0.001 | 0.29 | 0.26 | 0.98 |
| Warm Periods (Duration in Years) | Cold Periods (Duration in Years) |
|---|---|
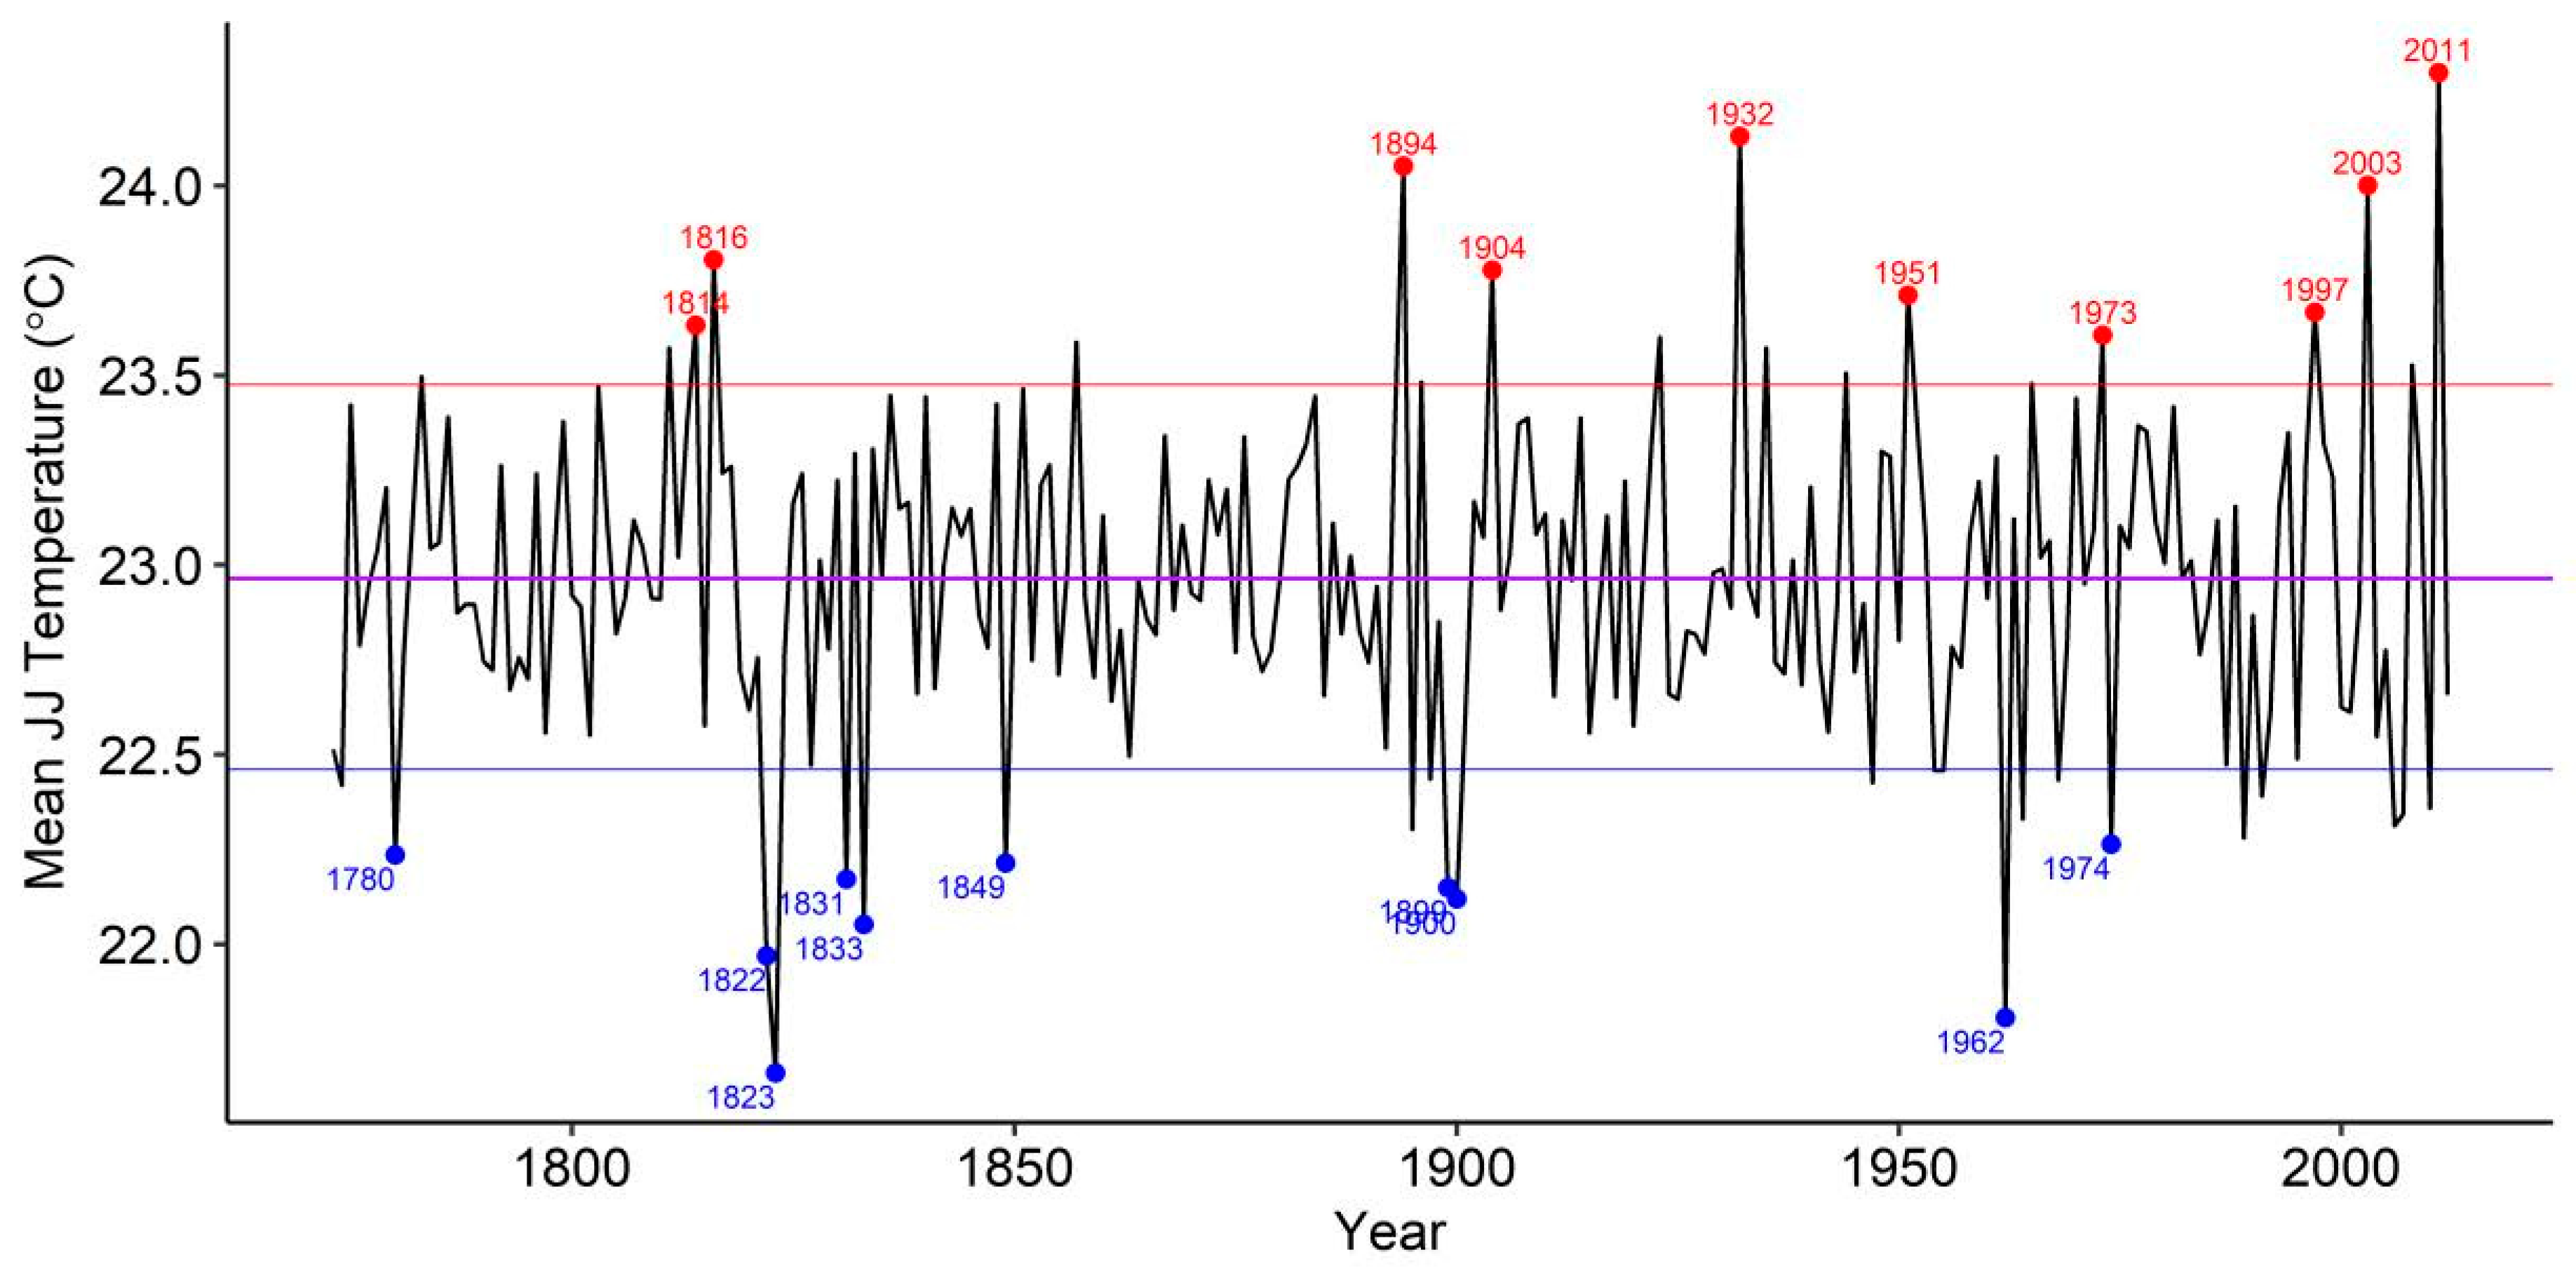
| 1782–1786 (5) | 1787–1791 (5) |
| 1811–1814 (4) | 1793–1795 (3) |
| 1816–1818 (3) | 1800–1802 (3) |
| 1836–1838 (3) | 1819–1824 (6) |
| 1842–1845 (4) | 1861–1866 (6) |
| 1872–1874 (3) | 1877–1880 (4) |
| 1881–1884 (4) | 1889–1892 (4) |
| 1902–1904 (3) | 1897–1901 (5) |
| 1906–1910 (5) | 1924–1929 (6) |
| 1951–1953 (3) | 1941–1943 (3) |
| 1965–1967 (3) | 1945–1947 (3) |
| 1975–1981 (7) | 1954–1957 (4) |
| 1996–1999 (4) | 1989–1992 (4) |
| 2000–2002 (3) | |
| 2004–2007 (4) |
Publisher’s Note: MDPI stays neutral with regard to jurisdictional claims in published maps and institutional affiliations. |
© 2021 by the authors. Licensee MDPI, Basel, Switzerland. This article is an open access article distributed under the terms and conditions of the Creative Commons Attribution (CC BY) license (http://creativecommons.org/licenses/by/4.0/).
Share and Cite
Malik, R.; Sukumar, R. June–July Temperature Reconstruction of Kashmir Valley from Tree Rings of Himalayan Pindrow Fir. Atmosphere 2021, 12, 410. https://doi.org/10.3390/atmos12030410
Malik R, Sukumar R. June–July Temperature Reconstruction of Kashmir Valley from Tree Rings of Himalayan Pindrow Fir. Atmosphere. 2021; 12(3):410. https://doi.org/10.3390/atmos12030410
Chicago/Turabian StyleMalik, Rayees, and Raman Sukumar. 2021. "June–July Temperature Reconstruction of Kashmir Valley from Tree Rings of Himalayan Pindrow Fir" Atmosphere 12, no. 3: 410. https://doi.org/10.3390/atmos12030410
APA StyleMalik, R., & Sukumar, R. (2021). June–July Temperature Reconstruction of Kashmir Valley from Tree Rings of Himalayan Pindrow Fir. Atmosphere, 12(3), 410. https://doi.org/10.3390/atmos12030410