Article

High Energy Parametric Laser Source and Frequency-Comb-Based Wavelength Reference for CO2 and Water Vapor DIAL in the 2 µm Region: Design and Pre-Development Experimentations

by
Jonas Hamperl
1,
Jan Fabian Geus
2,
Kjell M. Mølster
3,
Andrius Zukauskas
3,
Jean-Baptiste Dherbecourt
1,
Valdas Pasiskevicius
3,
Lukas Nagy
4,
Oliver Pitz
4,
David Fehrenbacher
4,
Hanjo Schaefer
4,
Dirk Heinecke
4,
Michael Strotkamp
2,
Stephan Rapp
5,
Paul Denk
5,
Norbert Graf
5,
Marine Dalin
1,
Vincent Lebat
1,
Rosa Santagata
1,
Jean-Michel Melkonian
1,
Antoine Godard
1,
Myriam Raybaut
1,* and
Cyrille Flamant
6
add Show full author list remove Hide full author list
1
DPHY, ONERA, Université Paris-Saclay, 91123 Palaiseau, France
2
Fraunhofer Institute for Laser Technology ILT, Steinbachstr. 15, 52074 Aachen, Germany
3
KTH, Royal Institute of Technology, Roslagstullsbacken 21, 10691 Stockholm, Sweden
4
Spacetech GmbH, Seelbachstraße 13, 88090 Immenstaad, Germany
5
InnoLas Laser, Justus-von Liebig-Ring 8, 82152 Krailling, Germany
6
LATMOS/IPSL, CNRS, Sorbonne Université, Université Paris-Saclay, 91190 Saint-Aubin, France
*
Author to whom correspondence should be addressed.
Atmosphere 2021, 12(3), 402; https://doi.org/10.3390/atmos12030402
Submission received: 2 February 2021 / Revised: 6 March 2021 / Accepted: 10 March 2021 / Published: 20 March 2021
(This article belongs to the Special Issue Remote Sensing of Atmospheric Carbon Dioxide)

Abstract

:
We present a differential absorption lidar (DIAL) laser transmitter concept designed around a Nested Cavity Optical Parametric Oscillator (NesCOPO) based Master Oscillator Power Amplifier (MOPA). The spectral bands are located around 2051 nm for CO2 probing and 1982 nm for H216O and HD16O water vapor isotopes. This laser is aimed at being integrated into an airborne lidar, intended to demonstrate future spaceborne instrument characteristics: high-energy (several tens of mJ nanosecond pulses) and high optical frequency stability (less than a few hundreds of kHz long term drift). For integration and efficiency purposes, the proposed design is oriented toward the use of state-of-the-art high aperture periodically poled nonlinear materials. This approach is supported by numerical calculations and preliminary experimental validations, showing that it is possible to achieve energies in the 40–50 mJ range, reaching the requirement levels for spaceborne Integrated Path Differential Absorption (IPDA) measurements. We also propose a frequency referencing technique based on beat note measurement of the laser signal with a self-stabilized optical frequency comb, which is expected to enable frequency measurement precisions better than a few 100 kHz over tens of seconds integration time, and will then be used to feed the cavity locking of the NesCOPO.

1. Introduction

In the context of global climate monitoring and modeling, measuring the concentration of greenhouse gases (GHG) and water vapor in the lower troposphere, ultimately from space, with an objective to expose the links with anthropogenic activities is an important but extremely challenging scientific and technological task. Satellite missions are indeed expected to provide atmosphere observations with better coverage than ground-based observatory networks in order to feed the transport models with complementary data, especially in remote regions hardly accessible for scientific activities [1]. Most of the challenge arises from the high sensitivity required in concentration measurement since the emitted fluxes of GHG from the surface will result in relatively small changes in their spatial distribution and will essentially occur in the low troposphere layers. For instance, to be able to identify these small changes for the carbon dioxide (CO2) fluxes, it has been estimated that the uncertainty level on the concentration measurement should be typically better than 1 ppm [2,3,4], corresponding to a relative accuracy better than 0.25%, hard to achieve from space.
So far, there are few space missions aiming at carbon dioxide or methane observation, and among ongoing or planned programs, most well-established measurement concepts for space are based on passive instruments such as spectrometers or spectro-imagers. Passive sounders have the drawbacks of low coverage at high latitudes during winter and reduced sensitivity during nocturnal operation. They can suffer from biases due to multiple scattering when aerosols and clouds are present, and they are less sensitive in the lower troposphere—exactly where most biogeochemical processes and anthropogenic influences occur. In parallel with increasing development efforts for passive instruments, a different approach based on active gas sensing by differential absorption lidar (DIAL) has also attracted a lot of attention in view of its potential benefits and complementarity with current passive instrumentation already established for earth observation. Indeed, since the integrated-path DIAL (IPDA) technique uses the direct illumination of the earth’s surface with a narrow-linewidth laser, it is expected to provide observation capabilities that could significantly reduce the contribution of multiple scattering from clouds, which alter the accuracy of passive instruments. Additionally, the technique has the potential to deliver global coverage during all seasons, night and day, with increased sensitivity in the lower troposphere thanks to proper wavelength and absorption line selection for the different species of interest [1,2,3,4,5,6,7,8,9,10].
In this context, technology studies have been carried out by several groups and space agencies in order to refine technical requirements and IPDA mission concepts. For instance, the ASCEND program from NASA [2] or the A-SCOPE study from ESA [4] have driven technological developments and mission concepts for CO2 probing. Space-based lidar concepts of other GHG have also been investigated: with proposals such as LiVE or WALES for water vapor [11,12] and the French–German lidar mission MERLIN dedicated to methane (CH4), that will be the first GHG DIAL mission in space [1]. Despite the foreseen breakthroughs for space-based active GHG monitoring, significant technological hurdles in the development of stable, robust, and powerful laser sources in the relevant wavelength windows still need to be tackled in the prospect for future missions. This is essentially true for CO2, the most of all important GHG in regards to human activities, for which the IPDA measurement concepts translate into high-power and high-frequency stability performance needs for the laser. These concepts require the emission of at least two wavelengths in the 1.6 or 2.0 µm spectral windows [5,6,7,8]: λON located in the vicinity of an absorption line, and λOFF closely located in an absorption-free window for the reference. These wavelengths should be emitted with a short delay, which implies double pulse operation (>50 Hz pulse pair repetition rate is generally considered as compatible with the ground resolution requirements [8]). High energy nanosecond pulses—several tens of mJ depending on the configurations and the optoelectronic assumptions—are required to produce a sufficient signal-to-noise ratio. Concerning the spectral quality of the laser transmitter radiation, the main driving characteristic is the central frequency stability derived from the targeted concentration uncertainty mentioned earlier, which brings long-term spectral drift requirements smaller than a few 100 kHz [7]. To meet one or several of these requirements, different approaches have been proposed and developed either with direct laser emission, when applicable, or with parametric frequency conversion [13,14,15,16,17,18,19,20,21,22,23,24,25,26,27,28,29,30].
In this context, a parametric conversion is an interesting approach when LIDAR measurement concepts are faced with scarce availability or tunability limitations of direct laser emission technologies, since it allows the extension of the spectral coverage further in the mid-infrared of mature 1 µm laser sources, including those already specifically developed for space applications [31,32]. It also opens the path for generic architectures that could be transferred from one spectral window to another while keeping the same core components [29,30] or for multiple wavelength approaches [12,21]. Following this path, the Nested Cavity Optical Parametric Oscillator (NesCOPO) based master-oscillator power amplifier (MOPA) architecture has been developed at Onera as an injection-seeding-free laser transmitter with wide spectral coverage capability. It has been used in the 2 µm range where the three main GHG CO2, CH4, and H2O display absorption lines potentially suitable for space-based measurements at 2.05, 2.29, and 2.06 µm, respectively [29]. More recently, an original measurement concept for water vapor isotopic ratio measurement has been proposed, enabled by the existence of suitable absorption lines for HD16O isotope and H216O main isotope in the 1.98 µm spectral window [33], which could open new observation capabilities to improve the description of water vapor cycles in general circulation models [34]. Finally, a major step forward for this technological approach is currently being taken with the realization of an airborne demonstrator in the framework of the EU H2020 LEMON project (Lidar Emitter and Multispecies greenhouse gases Observation instrument) [35]. Such intensive airborne campaigns were also implemented for several DIAL instruments [12,14,17,18]; they allow both scientific validation of the measurement concept and can constitute a first step towards a ruggedized system since the aircraft environment conditions require robust setups.
In this paper, we present the design aspects for this demonstrator with an emphasis on the following expected achievements:
-
Demonstrate high-energy operation of a 2 µm laser transmitter based on the NesCOPO-MOPA approach in a relevant environment. For this, our goal is set in line with the requirements for CO2 IPDA measurement from space previously mentioned while keeping a fairly compact footprint for airborne operation. For this purpose, the design is fully oriented around quasi-phase-matched nonlinear materials, including state-of-the-art periodically-poled nonlinear materials, such as high aperture periodically poled Potassium Titanyle Phosphate crystals (PPKTP).
-
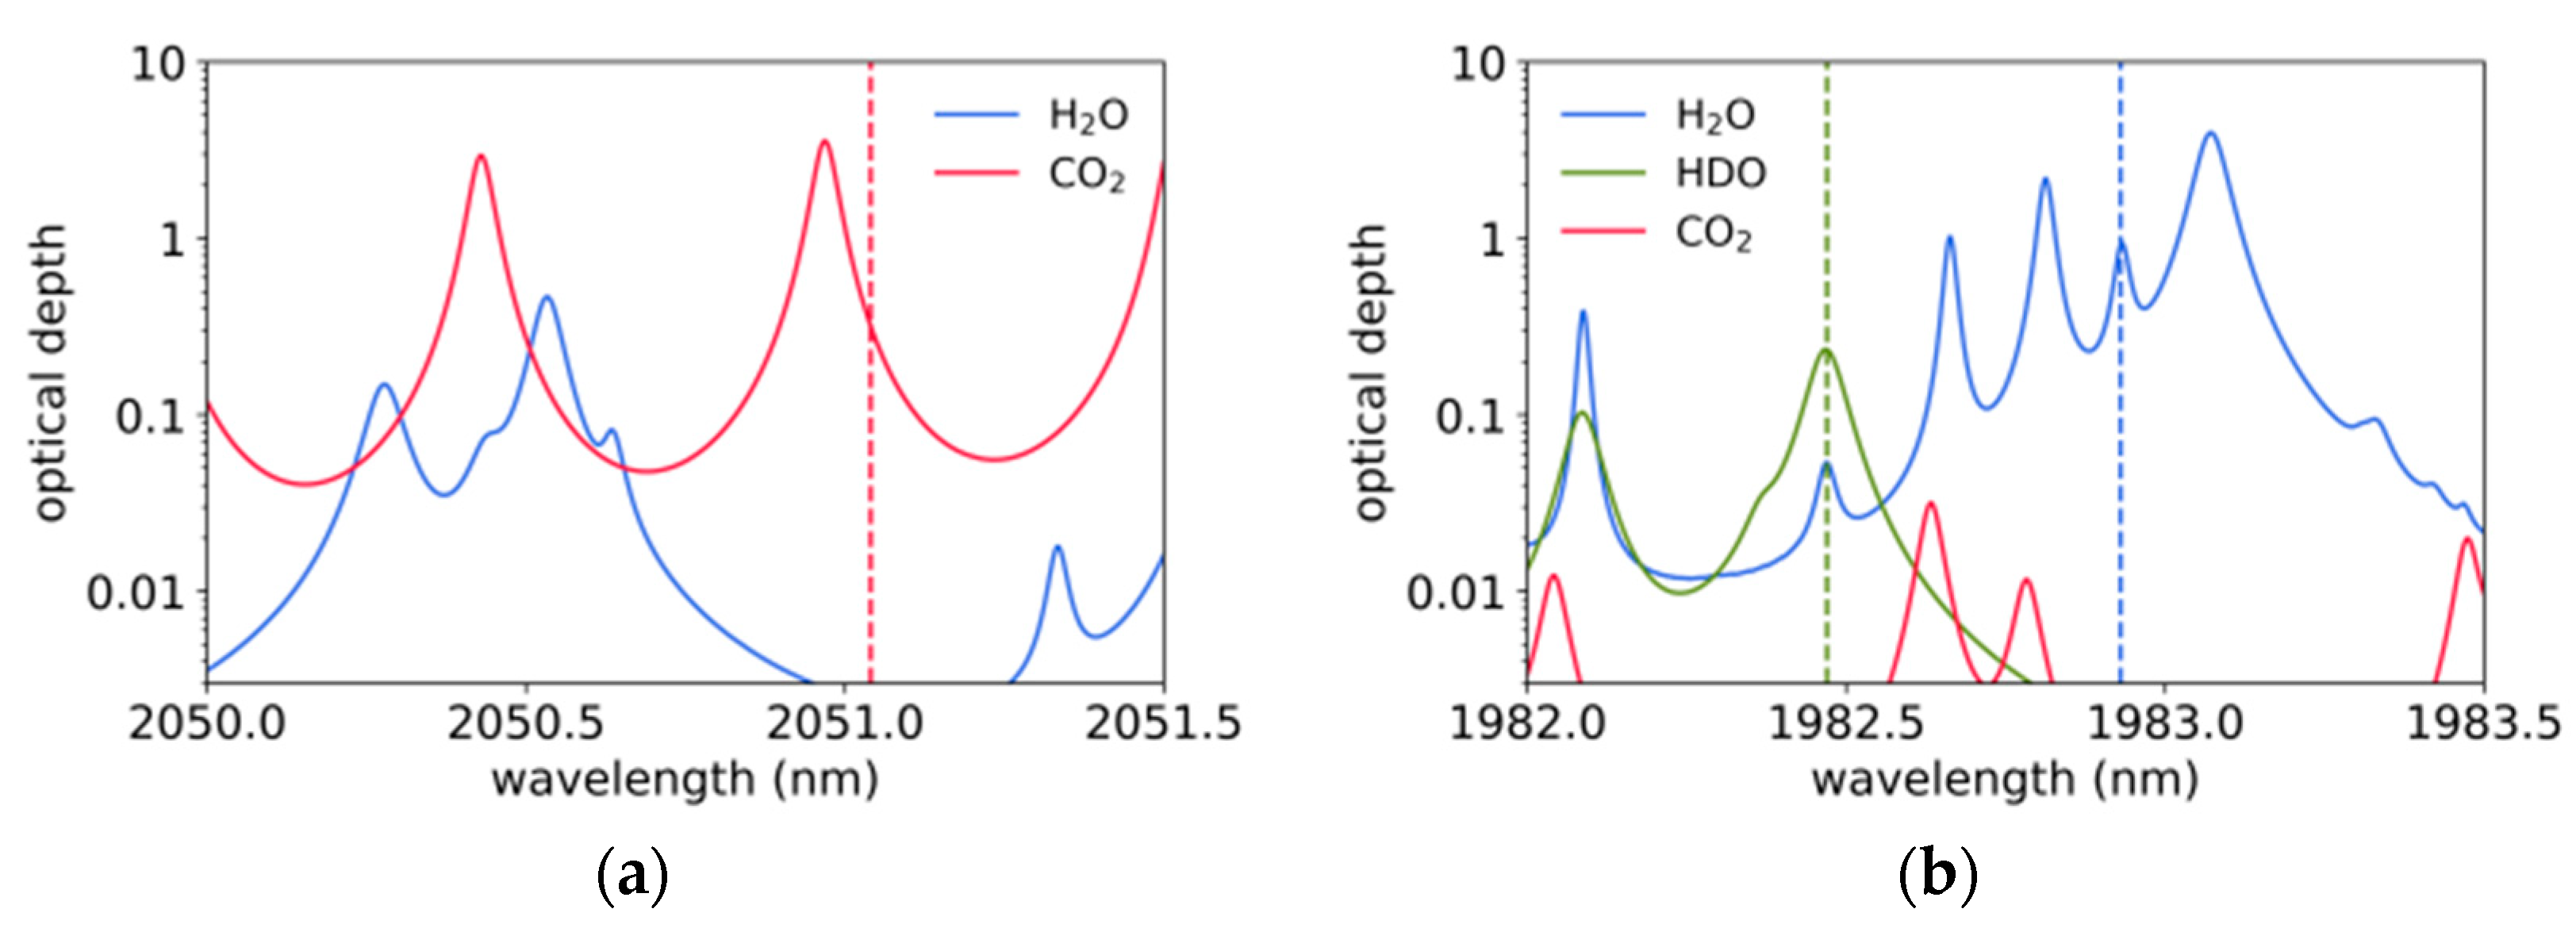
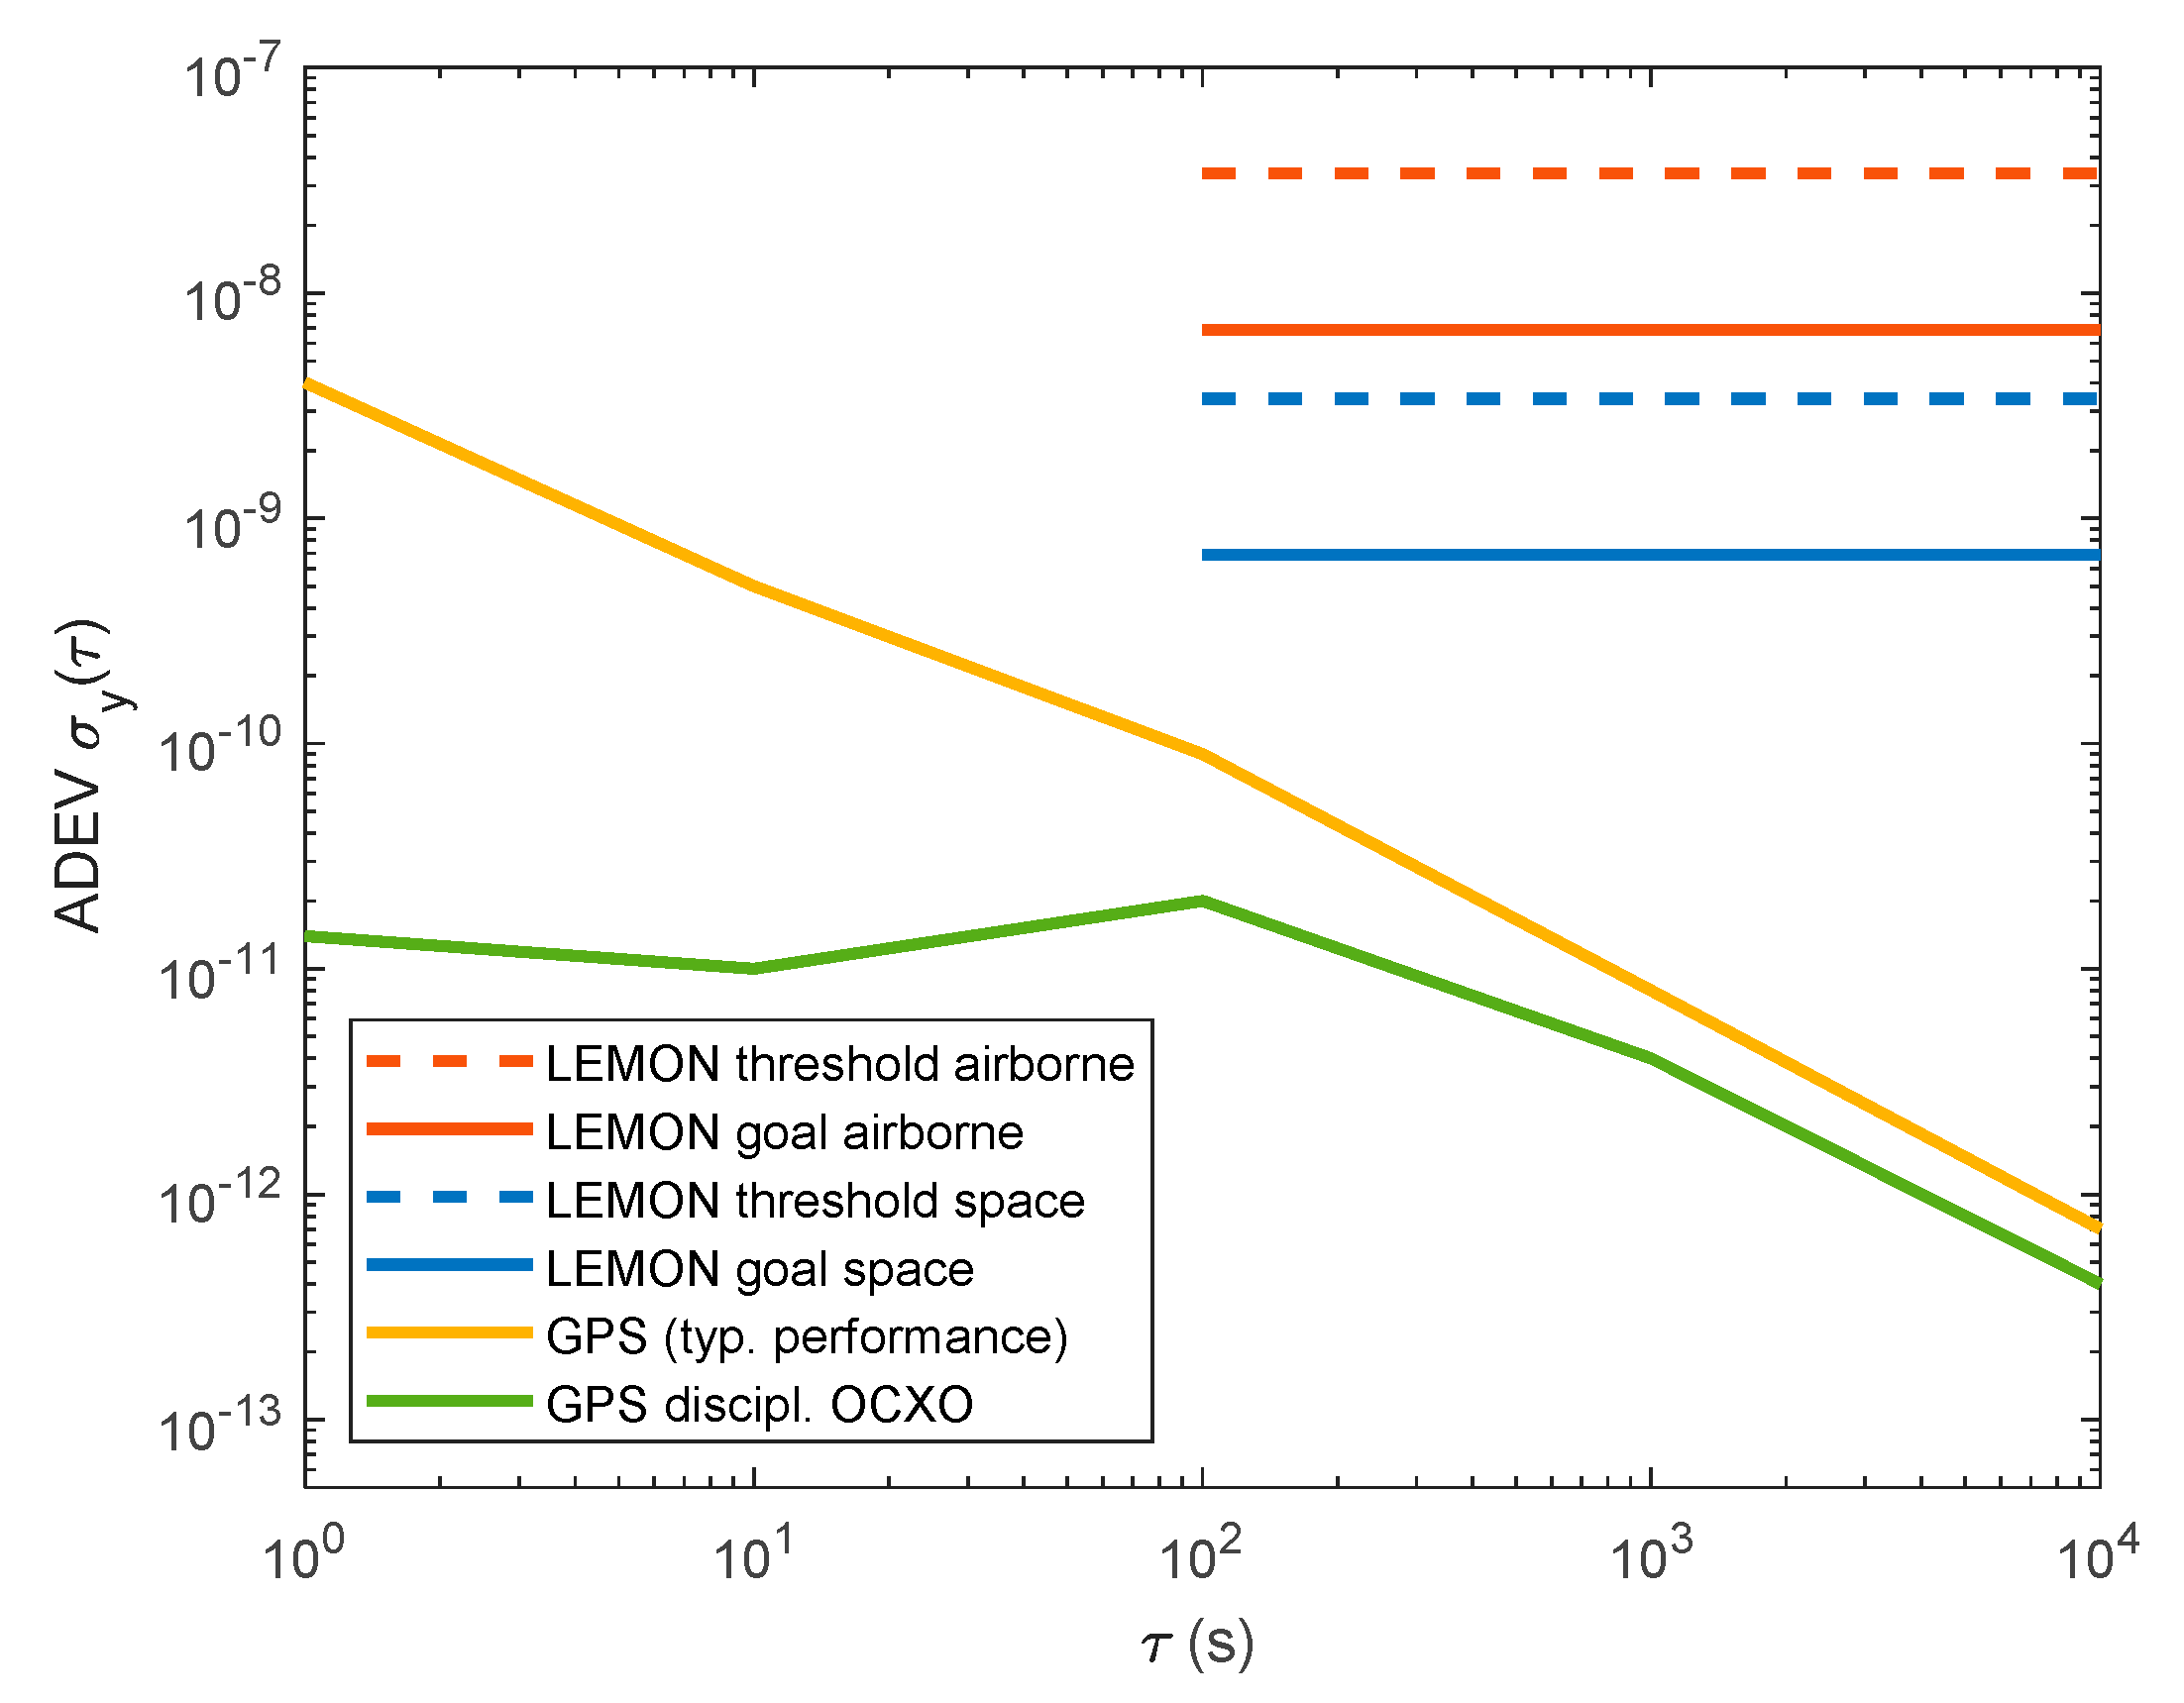
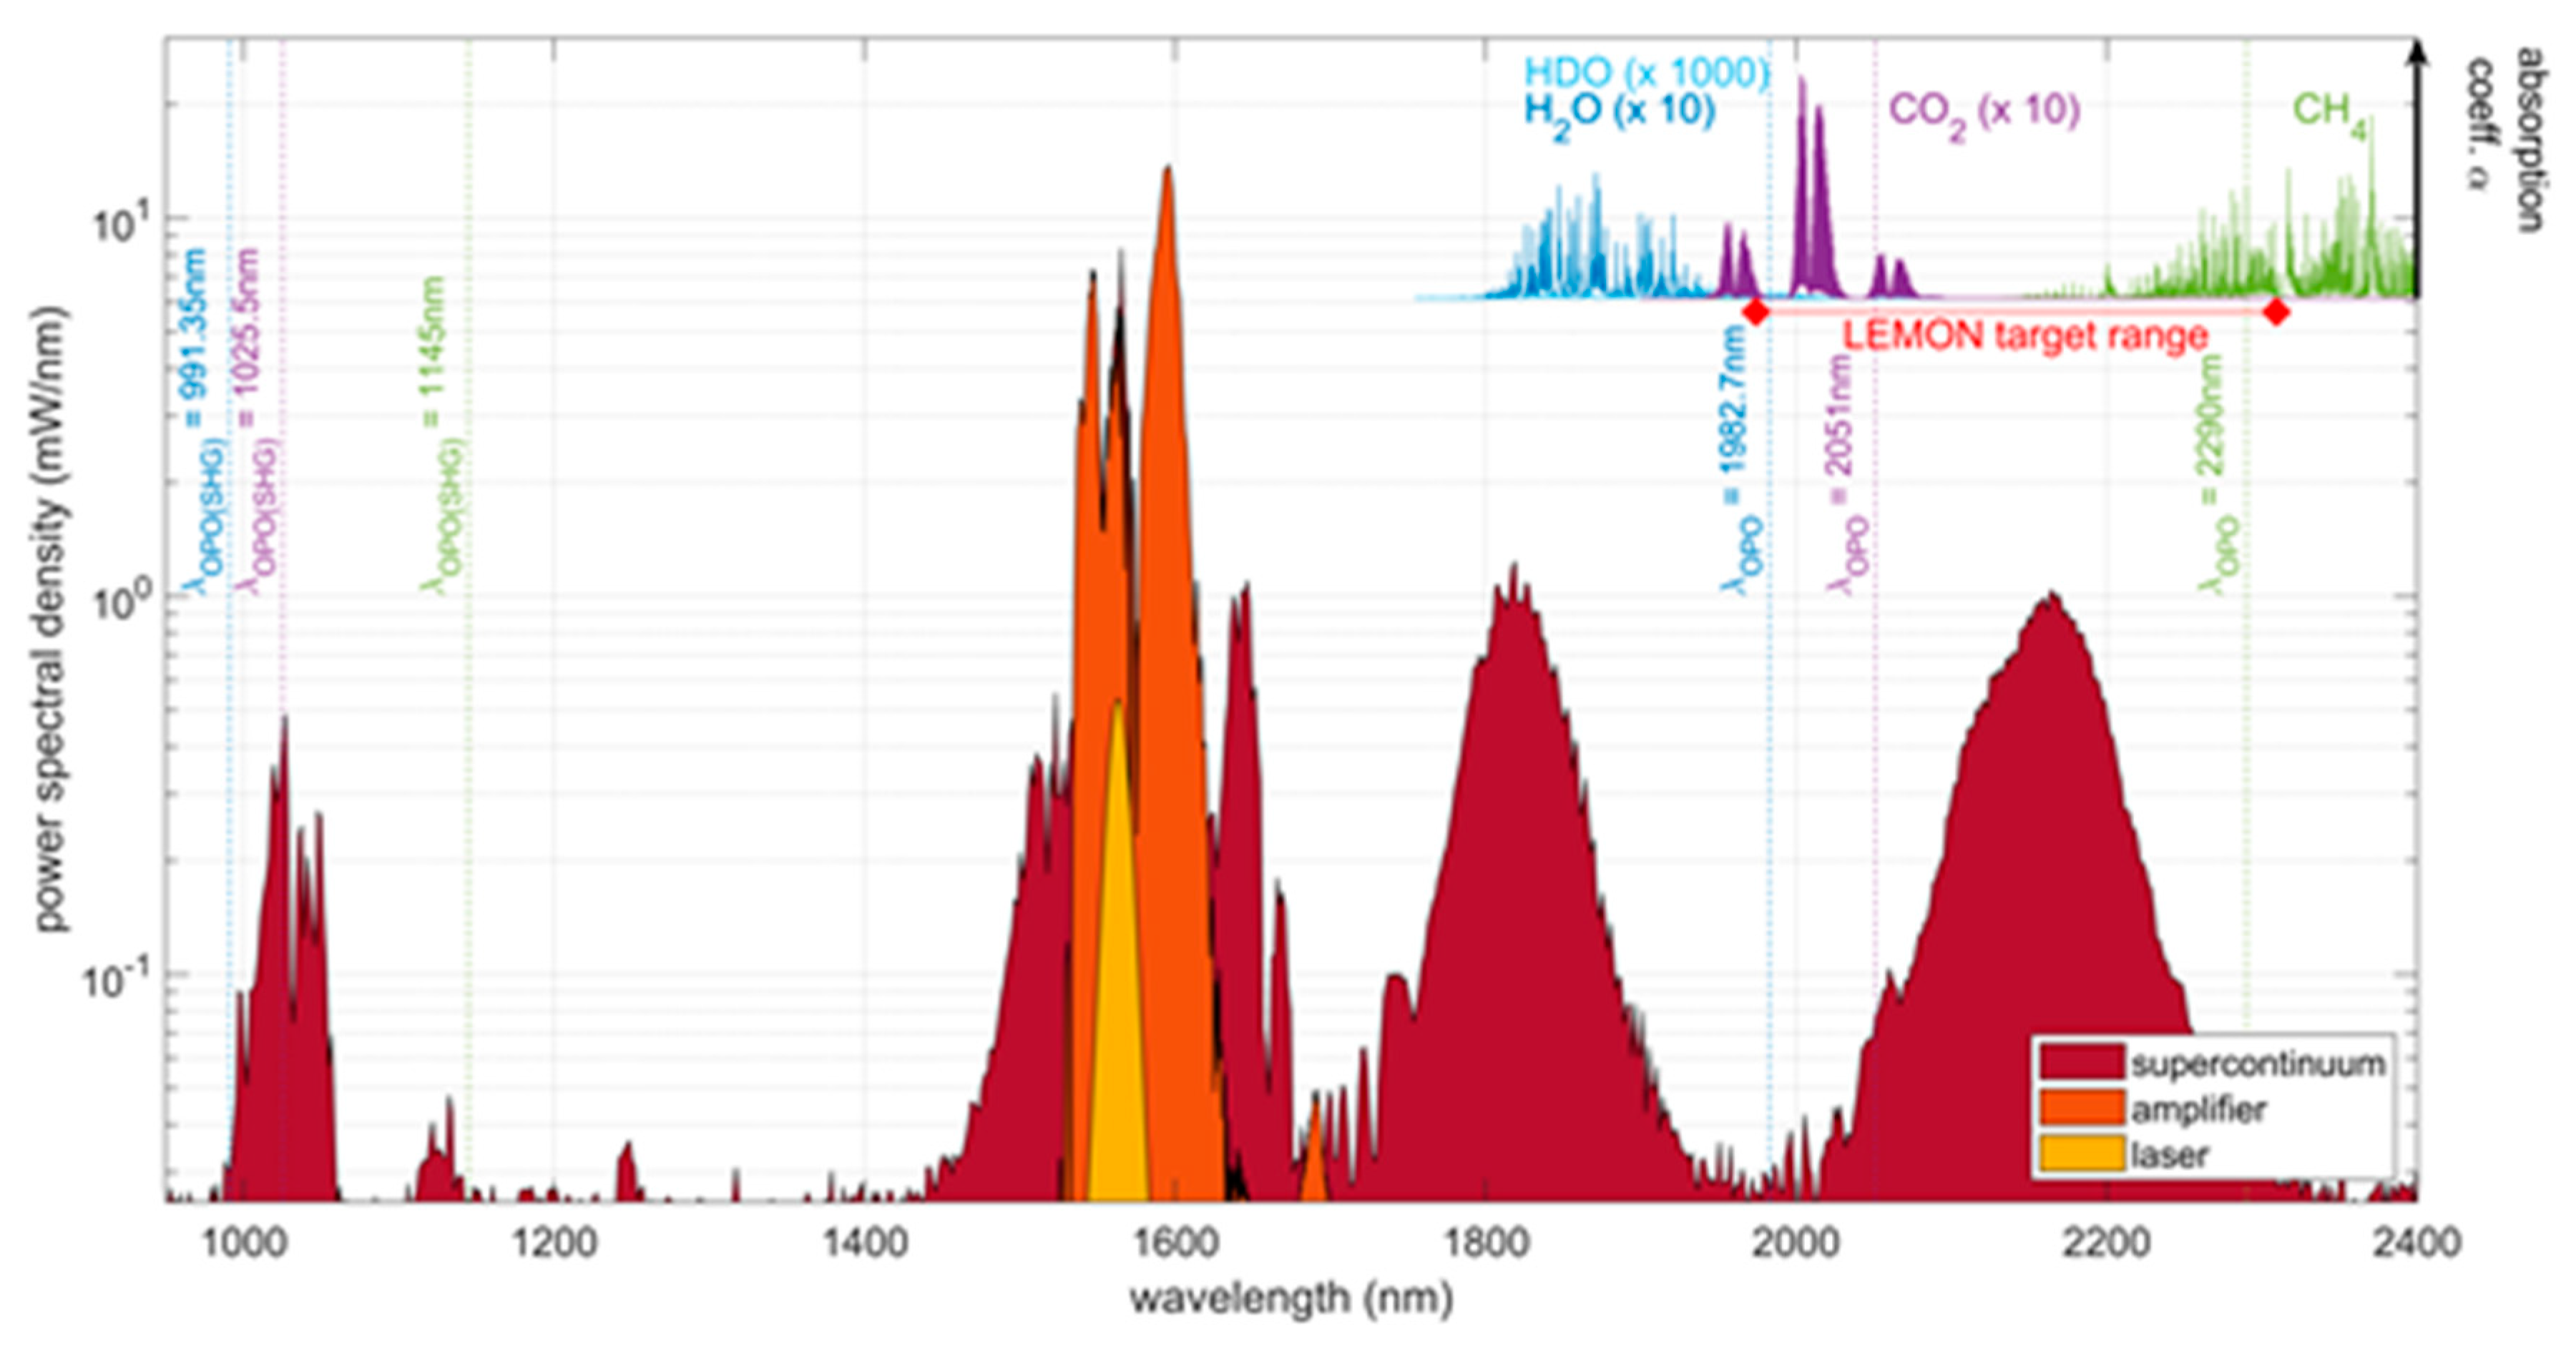
Demonstrate high power operation and high-frequency stability within distinct spectral windows located at 1.98 µm for water vapor isotopic ratio, and at 2.05 µm for CO2. For this purpose, a broadband frequency reference unit (FRU) based on frequency comb generation and beat note analysis with the laser transmitter laser output is exposed. Once again, the design is oriented by a frequency referencing capability goal in line with CO2 measurement from space.
The following section specifies the instrument requirements derived from studies for CO2 IP-DIAL measurement from space and briefly outlines the overall LEMON instrument concept. Section 3 is dedicated to the laser transmitter module. We present the optical setups of the pump laser, optical parametric oscillators (OPOs), and parametric amplification stages, along with preliminary experimental validation results and numerical performance simulations. Section 4 outlines the envisioned approach to measure and reference the emitted laser wavelength using a frequency comb technique. A summary of the so-far achieved instrument performances and perspectives for further development and testing in the prospect of an airborne demonstration is given in Section 5.

2. Proposed Instrument Concept

2.1. Instrument Requirements

The first driving characteristic for the laser transmitter is its wavelength range of operation. Here two spectral windows of interest are being investigated and illustrated in Figure 1. The first spectral window is located in the vicinity of the CO2 R30 line at 2051 nm and has been specifically identified for CO2 probing from space by several numerical studies [2,3,4,5,6,7,8]. This spectral window also presents a side benefit from the instrumental point of view since the differential optical depths (DOD) achievable with this line is also compatible with operational test scenarios, e.g., ground-based range resolved DIAL like for example in [30]. The second spectral window is related to water vapor isotopic ratio measurement, for which a favorable spectral situation can be found around 1982 nm where HDO and the main isotope of water vapor have separated absorption lines, with potential accessible DODs also favorable for long-range resolved DIAL as illustrated in Figure 1. These properties are the main driving considerations for targeting this second spectral window. One side benefit from this choice is the fact that in the parametric conversion of an Nd:YAG radiation at 1064 nm, the natural idler wave for a signal at 1982 nm is located around 2297 nm, which is very close to potential CH4 absorption line candidates for measurement from space [5]. This aspect has, however, a much more limited scope since power extraction will generally be optimized in favor of one wavelength, which will disadvantage the other one. As will be illustrated in the following sections, our design is oriented toward signal wave power extraction.
Secondly, the output power characteristics aimed at for the instrument are set in line with the requirement derived for CO2 IPDA measurement from space at 2 µm. Indicative values issued from the A-SCOPE mission assessment [4] are summarized in Table 1. In that particular study, a baseline energy value of 55 mJ was derived for a detector noise equivalent power of 100 fW/√Hz and a telescope aperture of 1.2 m diameter in direct detection mode. Since that study, several developments on avalanche photodiodes have been carried out in recent years [36,37,38,39], and detectors with record noise equivalent powers down to 0.5 fW/√Hz have been reported [38]. Taking into account these recent developments, we aim at generating 40 mJ of output pulse energy, at a repetition rate of 75 Hz, in double-pulse operation. Just like for the spectral window choices mentioned earlier, these power performance objectives for the source are essentially inherited from the requirements derived for CO2 measurement from space. Besides this, the foreseen power level would also allow us to improve our range-resolved measurement from the ground using commercially available detectors (e.g., InGaAs photodiodes).
Finally, previous studies have also derived the spectral performances required for CO2 measurement from space, which are also summarized in Table 1. Besides the accuracy goal on concentration measurement for a given species, these spectral requirements strongly depend on parameters such as intrinsic line shape, absorption cross-section, and their dependency on temperature and pressure variations, which generally result in more stringent constraint for a measurement scenario from space. Indeed, to optimize the DOD as well as the sensitivity in the lower layers of the atmosphere, the laser is ideally required to be placed in the wings of the absorption line, which implies a higher uncertainty on the observed absorption for a given frequency uncertainty on the laser frequency. This is the case for CO2 sounding from space at 2.051 µm [2,4,5]. Once again, we take these most stringent values for CO2 measurement from space as the objective for the frequency accuracy in our design and add the capacity to address different spectral windows besides the 2.05 µm one. To reach this accuracy and capacity to adapt to multiple spectral windows, an optical frequency reference based on a stabilized frequency comb is proposed. The concept is schematically illustrated in Figure 2 and further detailed in Section 4.

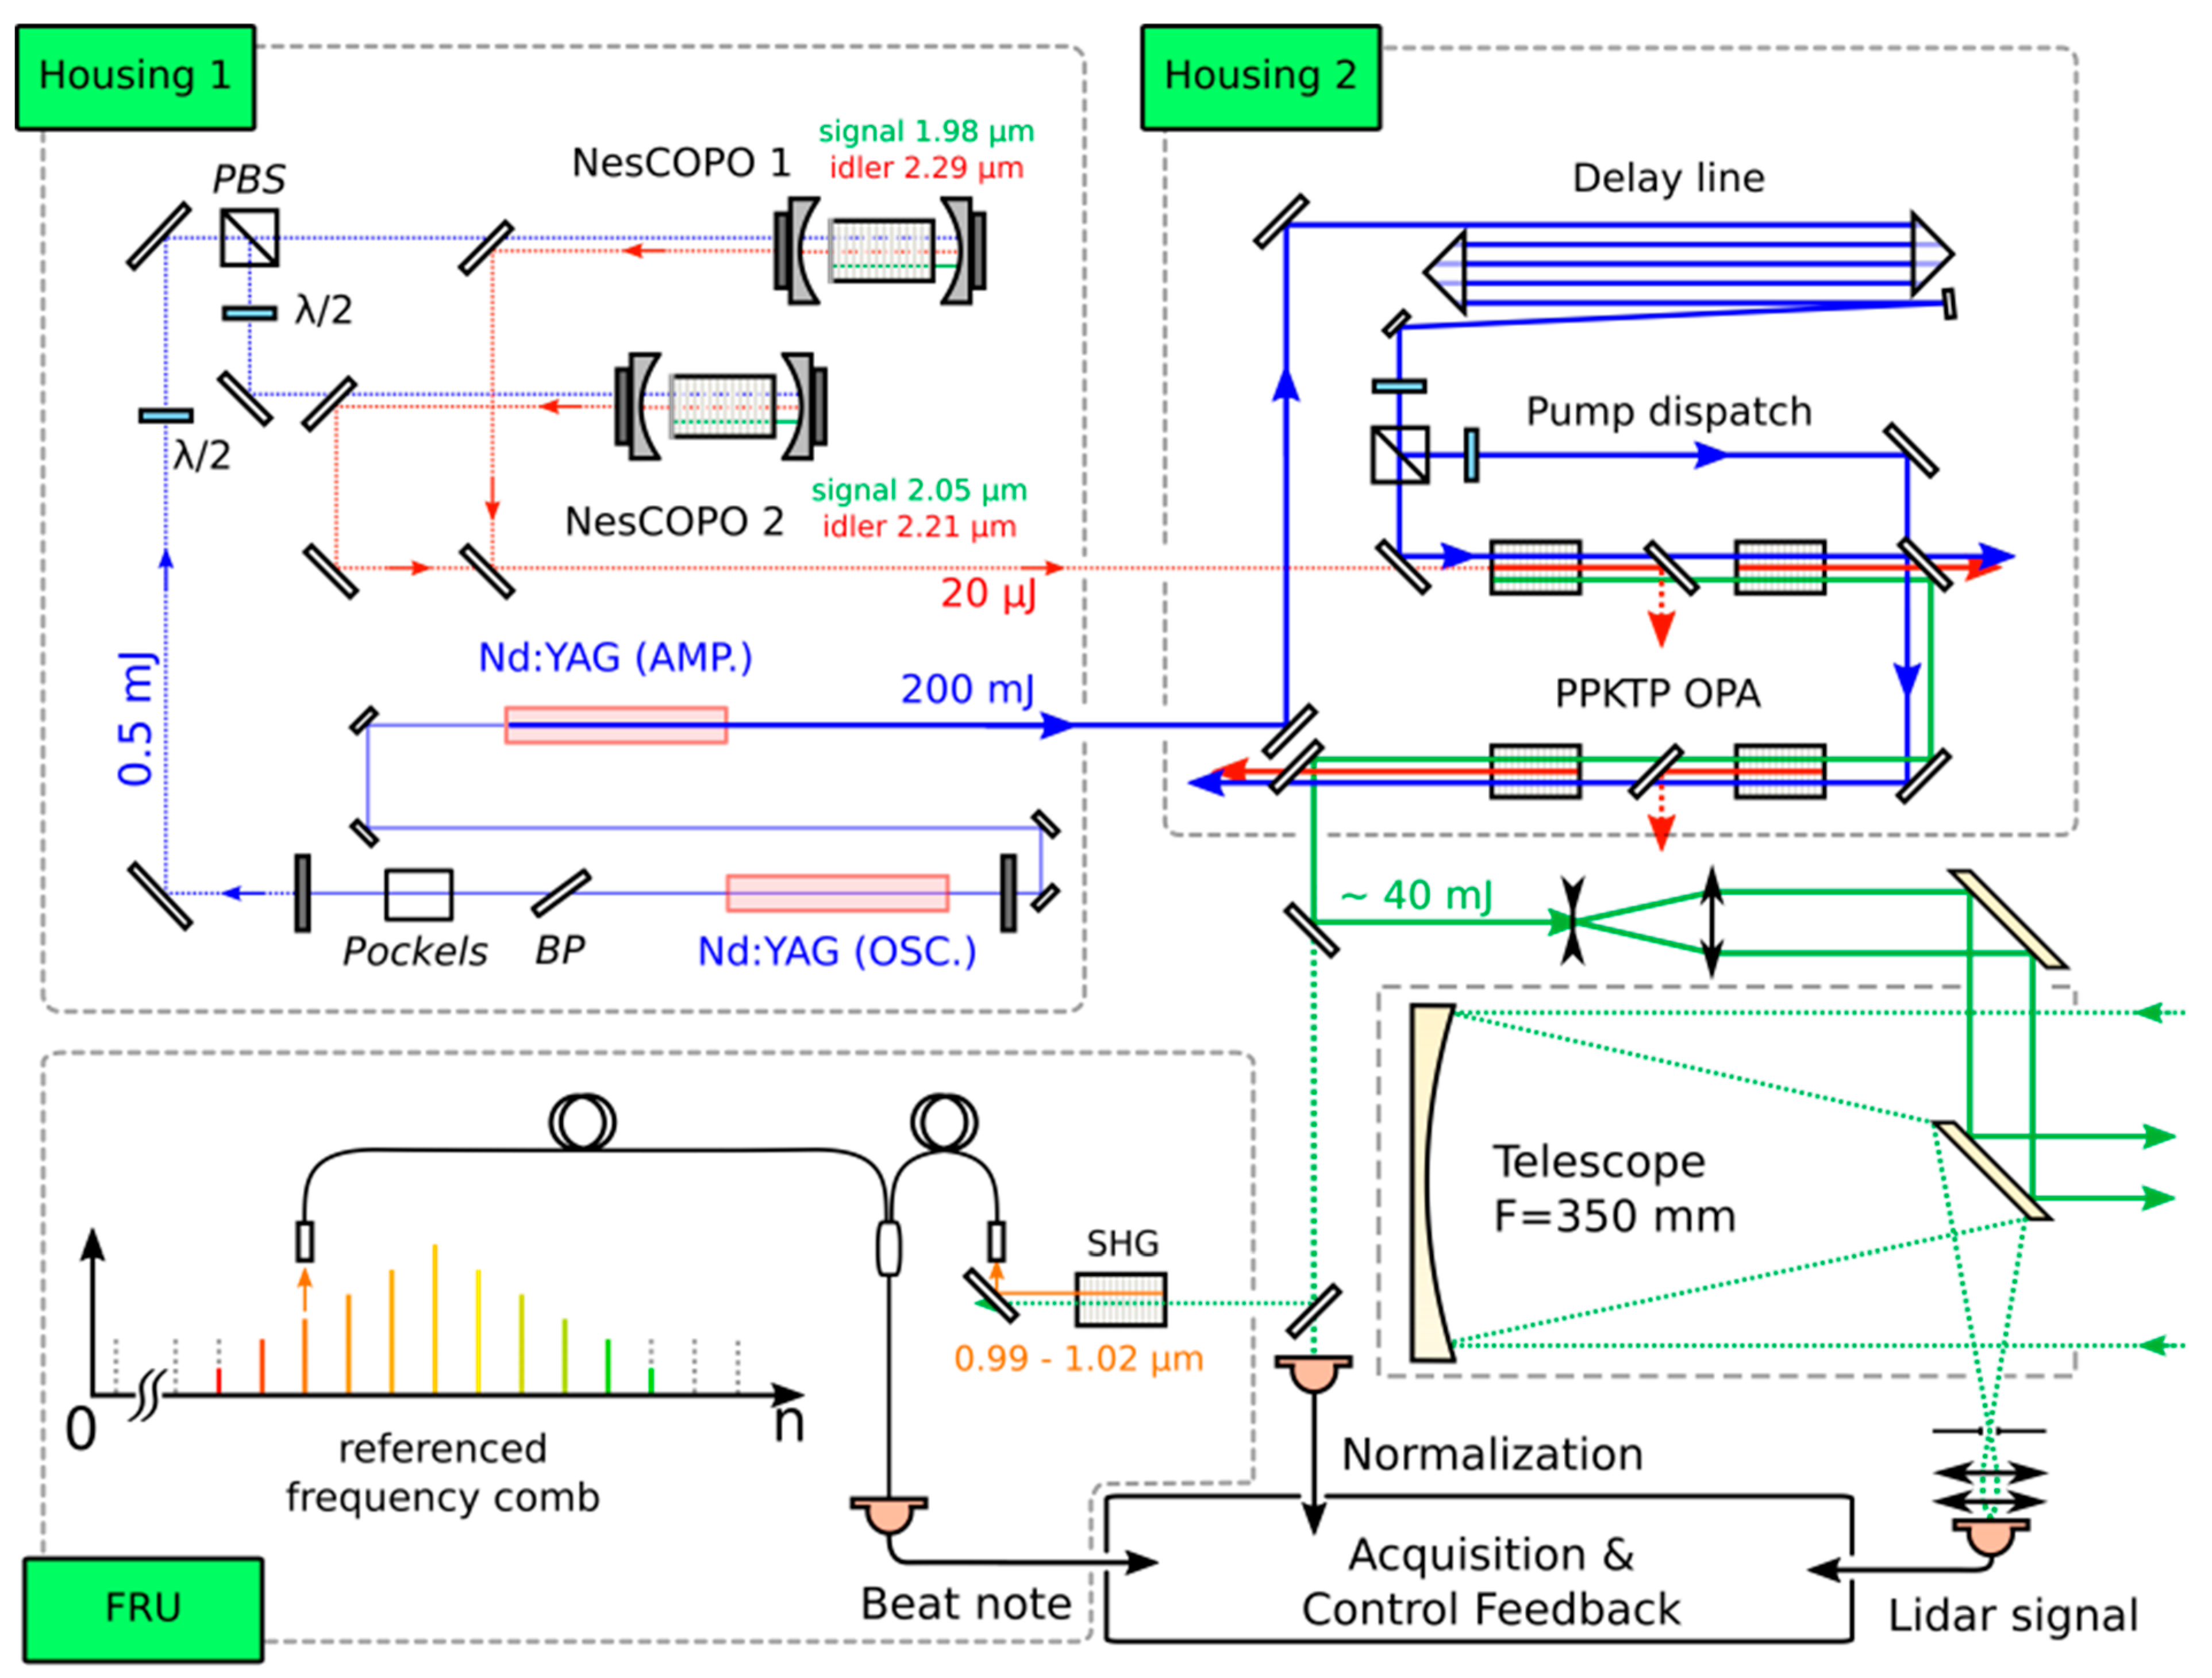
2.2. Conceptual Instrument Design

The LEMON instrument architecture is based on the combination of different technologies and is schematically depicted in Figure 2. It is composed of: (i) a laser transmitter module consisting of two separate housings, which emits the laser radiation to probe the targeted gas absorption lines; (ii) a frequency reference unit (FRU), which provides the frequency of the emitted laser radiation with high accuracy; (iii) an acquisition and receiver module to collect, detect, and acquire the DIAL signals; (iv) a software and electronic control system to control the emitter unit, record, and analyze the data. This paper is focused on the transmitter module and the frequency reference unit.
In order to achieve the laser transmitter specifications outlined in the previous section, and to benefit from the maturity and know-how on the development of 1.064 µm pump lasers, our laser transmitter architecture is based on a nested-cavity OPO (NesCOPO), followed by parametric amplifier stages. For enhanced thermomechanical stability, pump laser, NesCOPOs, and amplifiers are separated into two different housings, placed on a common base plate. The first housing is dedicated to the 1.06 µm pump laser and two NesCOPO stages (NesCOPO 1 for H2O/HDO, potentially CH4 and NesCOPO 2 for CO2). The second housing is dedicated to the parametric amplifier stages. The amplifiers are based on specifically developed periodically-poled KTiOPO4 (KTP) crystals. Details of the design of these two housings will be given in Section 3, along with preliminary validation experiment results and performance simulations.
In order to meet the very stringent frequency stability specification listed in Table 1, a specific locking procedure is required, and especially, a very stable optical frequency reference is needed. We thus also propose the design of a suited frequency reference concept, detailed in Section 4.
For the detection unit to be implemented for future airborne or ground-based testing, it will consist of a commercial p-i-n photodiode, like the one used in [30], coupled to a 350 mm diameter commercial telescope. Mechanical adaptations were performed to ensure the stability of the mechanical receiver design with respect to aircraft vibration levels for airborne validation campaigns.

3. Laser transmitter Optical Design and Preliminary Validation Results

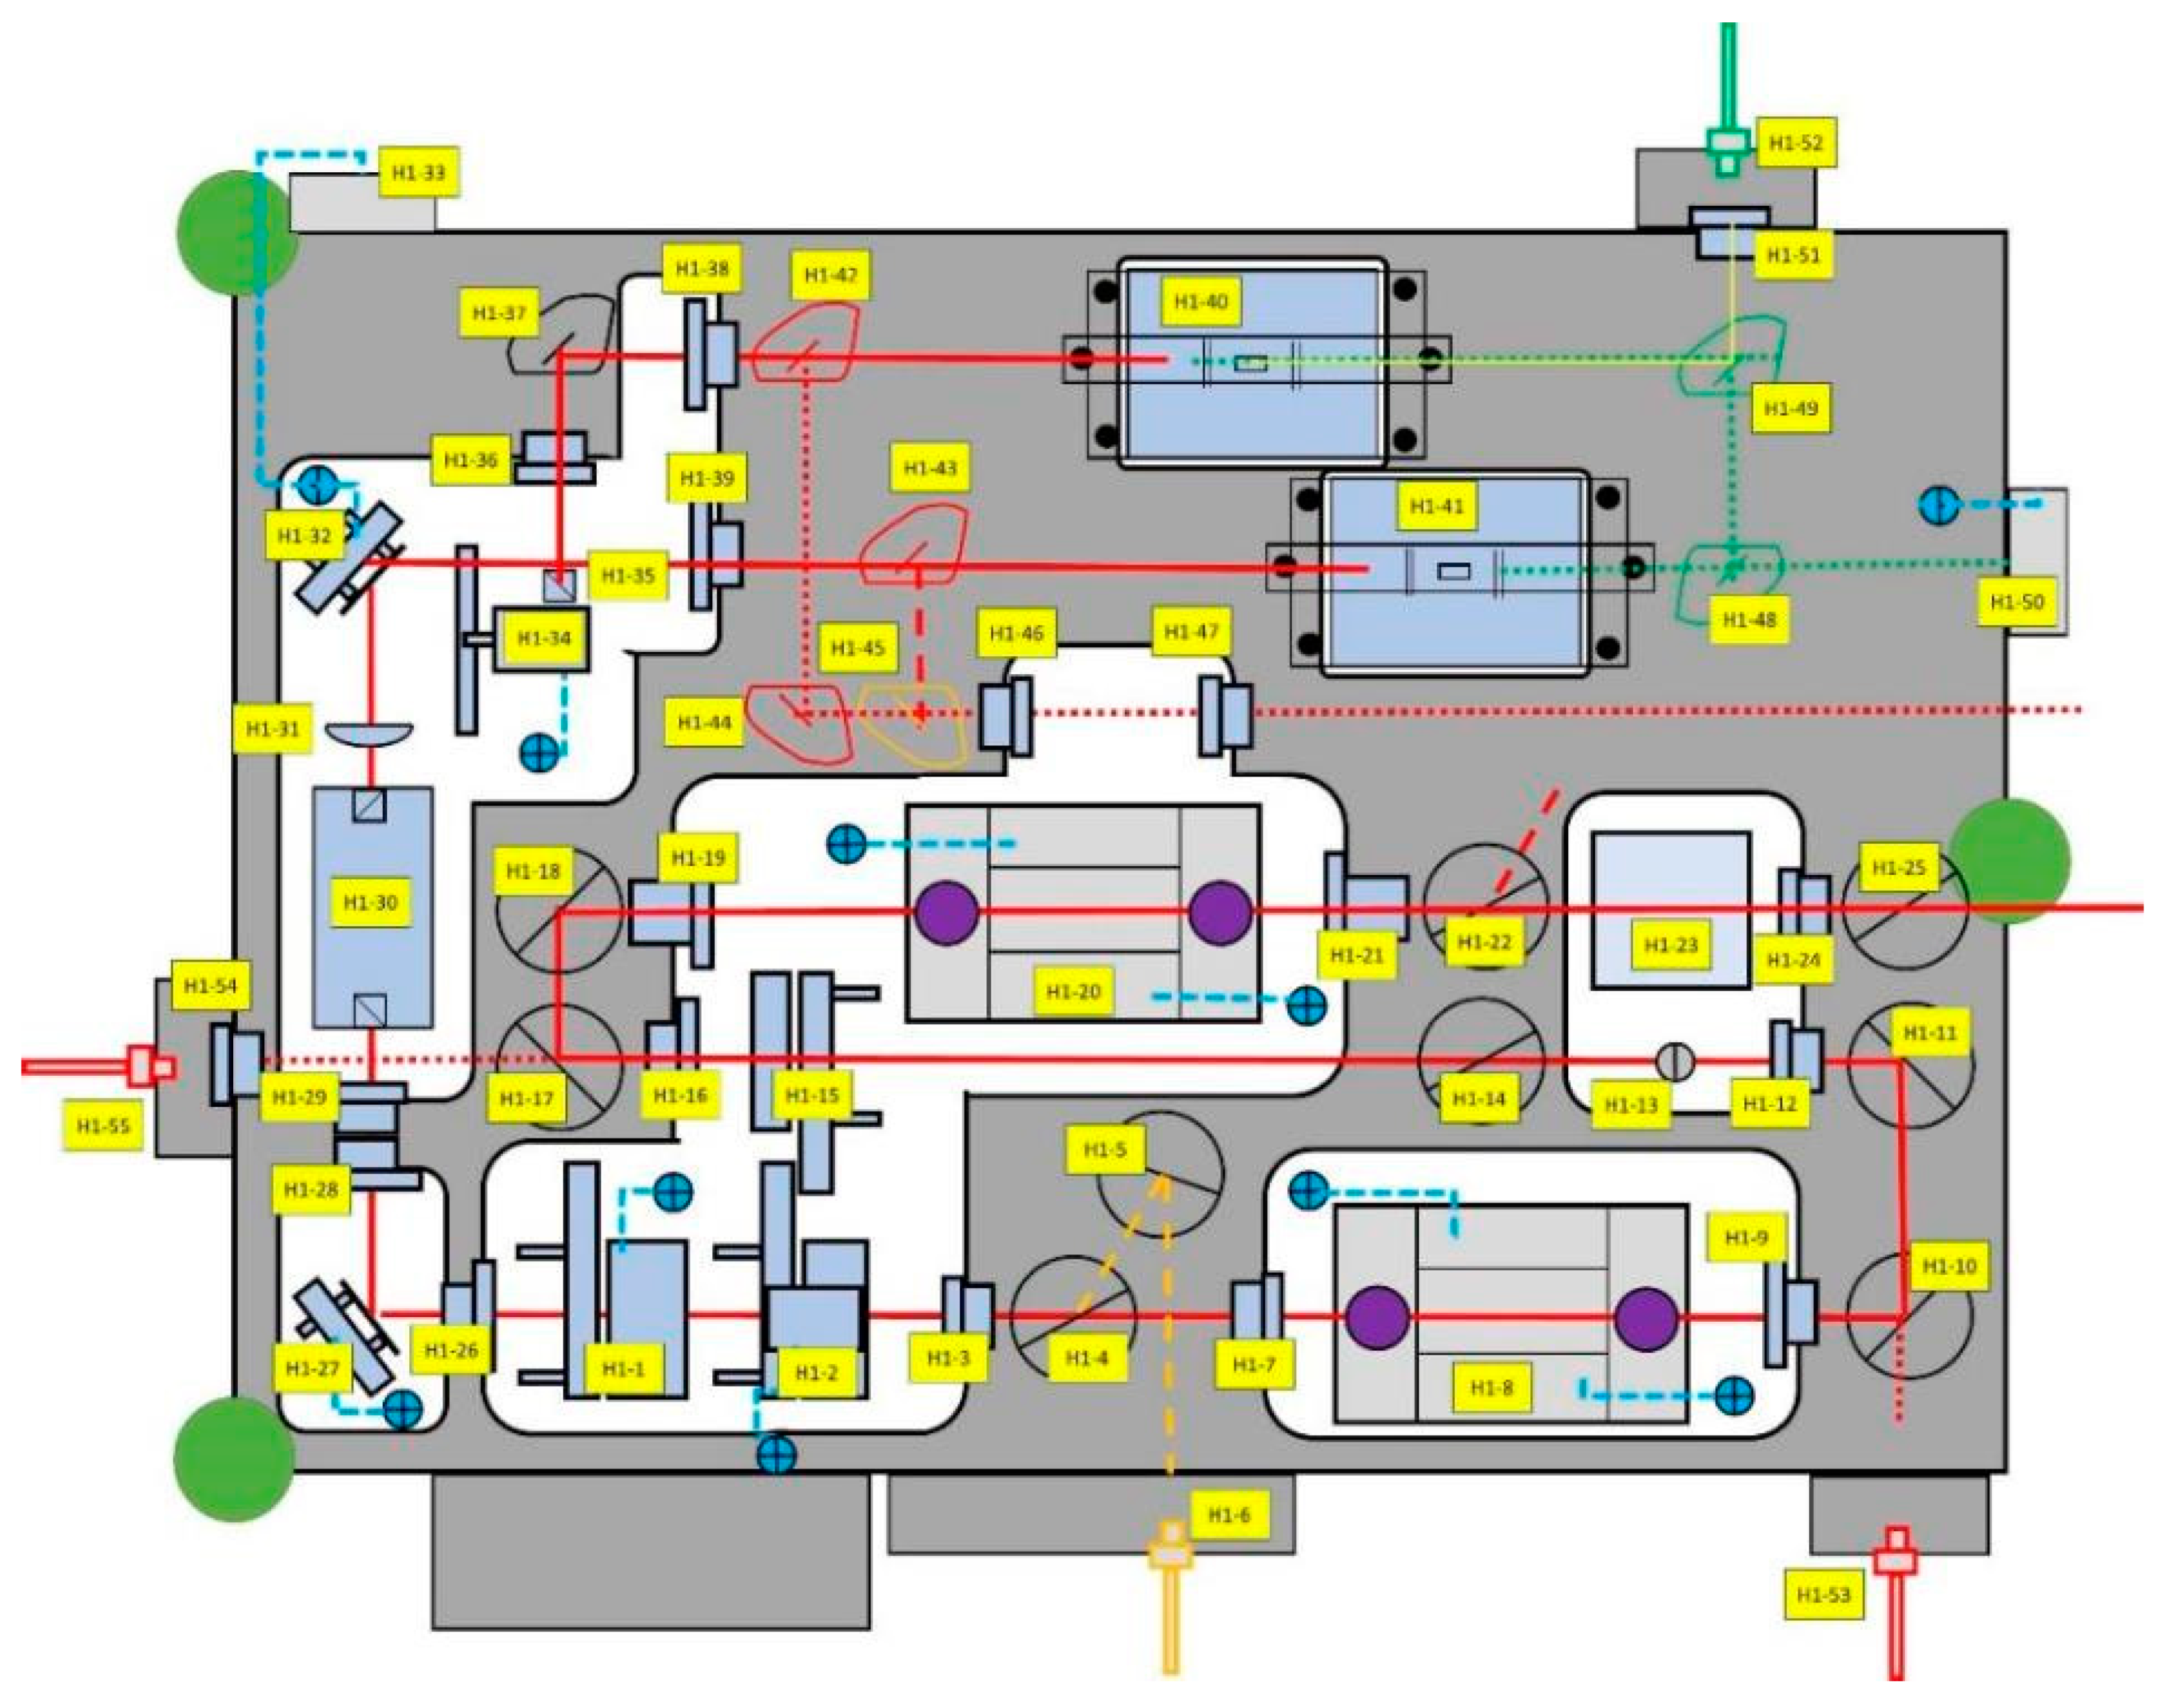
3.1. Housing 1: Pump Laser and Nested-Cavity OPO (NesCOPO)

The optical setup of the first housing is depicted in Figure 3. It is also representative of the mechanical design. It consists of a monolithic aluminum housing for the optical components with additional aluminum parts to connect and adjust the optical fibers.
The pump laser design (development by InnoLas, H1-1 to H1-25 in Figure 3) is based on a diode pumped, injection seeded Nd:YAG laser in a master-oscillator power amplifier configuration (MOPA). The laser radiation is generated in a folded oscillator between the partially reflecting rear and out-coupling mirrors H1-1 and H1-15 to reach the necessary pulse duration of about 15 ns. H1-2 to H1-4 illustrate components for Q-switching, H1-8 the active laser medium, and the remaining components in between the partially reflecting mirrors are for beam shaping and guiding. H1-6 and H1-53 are optical fibers for the injection seeding of the laser system. This allows for running the laser in a single longitudinal mode operation. After the out-coupling mirror (H1-15), the laser beam is guided through an amplifier (H1-20) and emitted through a polarizer (H1-25) to feed the consecutive OPA in housing 2 (see Section 3.2). The pump pulse energy will be over 200 mJ at a repetition rate of 150 Hz. A special pumping scheme will allow the operation in “quasi—75 Hz mode”, meaning that pairs of pulses with a delay of 500 µs are emitted at a repetition rate of 75 Hz. The beam quality is aimed to be M² < 1.5. As mentioned above, the rear mirror (H1-1) is also only partially reflecting. About 2 mJ of the oscillator radiation are coupled out through this mirror and guided over two piezo-controllable mirrors (H1-27 and H1-32) to pump the OPOs (H1-40 and H1-41). Indeed, less than 1 mJ is expected to be sufficient to pump the NesCOPO stages [29].

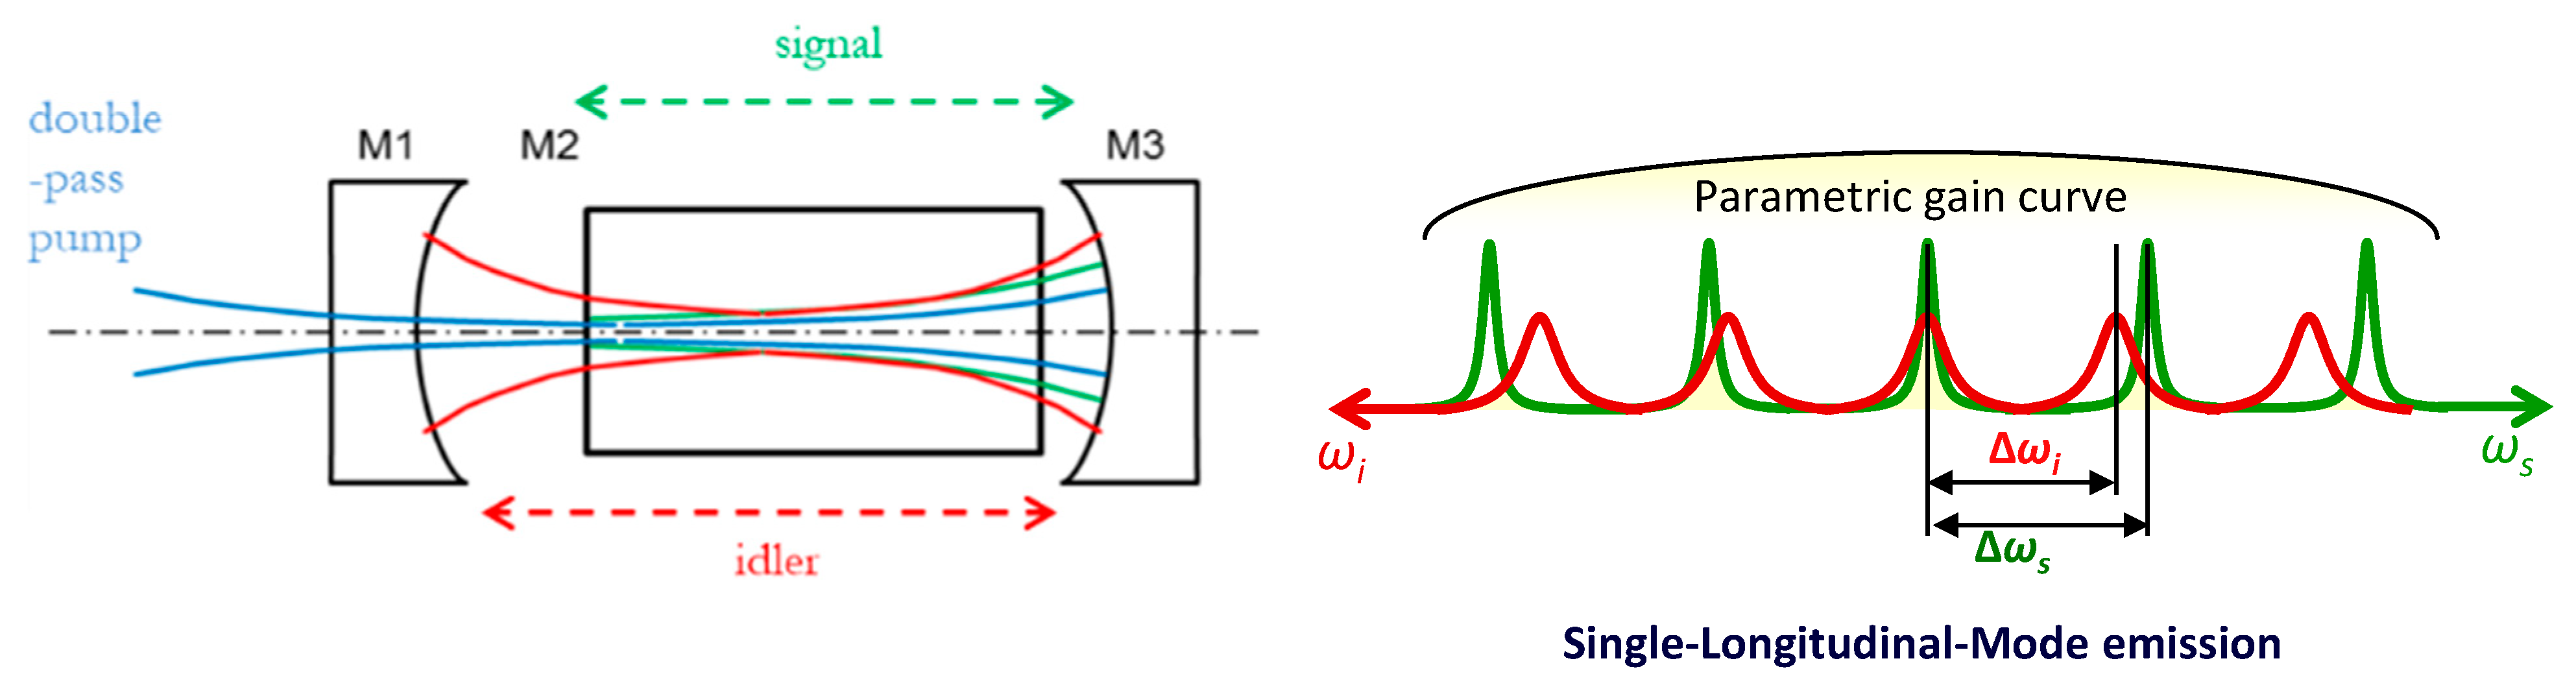
3.1.1. NesCOPO Architecture

The optical parametric oscillator is a nested-cavity configuration, which allows obtaining a single frequency over a wide tuning range without any injection seeding devices [40]. Indeed, as illustrated in Figure 4, using such a doubly-resonant configuration, with different cavity lengths for the signal and idler waves, it is possible, if the parametric nonlinear crystal bandwidth is narrow enough, and with an adequate signal and idler cavity dissociation, to have only a single pair of modes {ωsi} of the signal and idler cavity frequency combs respecting the energy conservation (i.e., ωp = ωs + ωi, with the pump, signal, and idler angular frequencies ωp,s,i), leading to single-longitudinal-mode emission.
Since the OPO operates close to the degeneracy (which is the case here with a 1.064 pump and a 2.05 µm signal), it is not suitable to exploit the usual type 0 quasi-phase-matching configuration (i.e., with similar polarization directions for the three interacting waves), which would enable the highest nonlinear efficiency. Indeed, the parametric gain bandwidth in either periodically poled Lithium Niobate (PPLN) or periodically poled Potassium Titanyl Phosphate (PPKTP) would be too broad to achieve single-frequency emission. Two alternatives can be implemented to avoid this issue: (i) the use of a volume-Bragg grating (VBG) mirror to reduce the bandwidth by introducing losses outside the VBG bandwidth [41], or (ii) the use of type II periodically poled crystals (with orthogonal signal and idler polarization directions), which results in a narrow linewidth but lower nonlinear efficiency [29]. In order to keep tuning capabilities over several tens of nanometers and thus be able to address other CO2 or water vapor lines (for instance, the 2.06 µm water vapor line), we chose to implement a type II crystal configuration, as demonstrated previously using commercial PPLN [29,30]. However, the factor of merit is higher in PPKTP and the damage threshold is also higher for PPKTP crystals than for PPLN crystals; we thus aimed at implementing this promising crystal and thus calculated the expected performances. In order to validate the calculation, preliminary tests were performed using commercial PPLN crystals in our NesCOPO architecture and compared with numerical simulations. Based on the comparison of experiment and simulation, numerical optimization of our NesCOPO design was then carried out for both PPLN and PPKTP crystals.

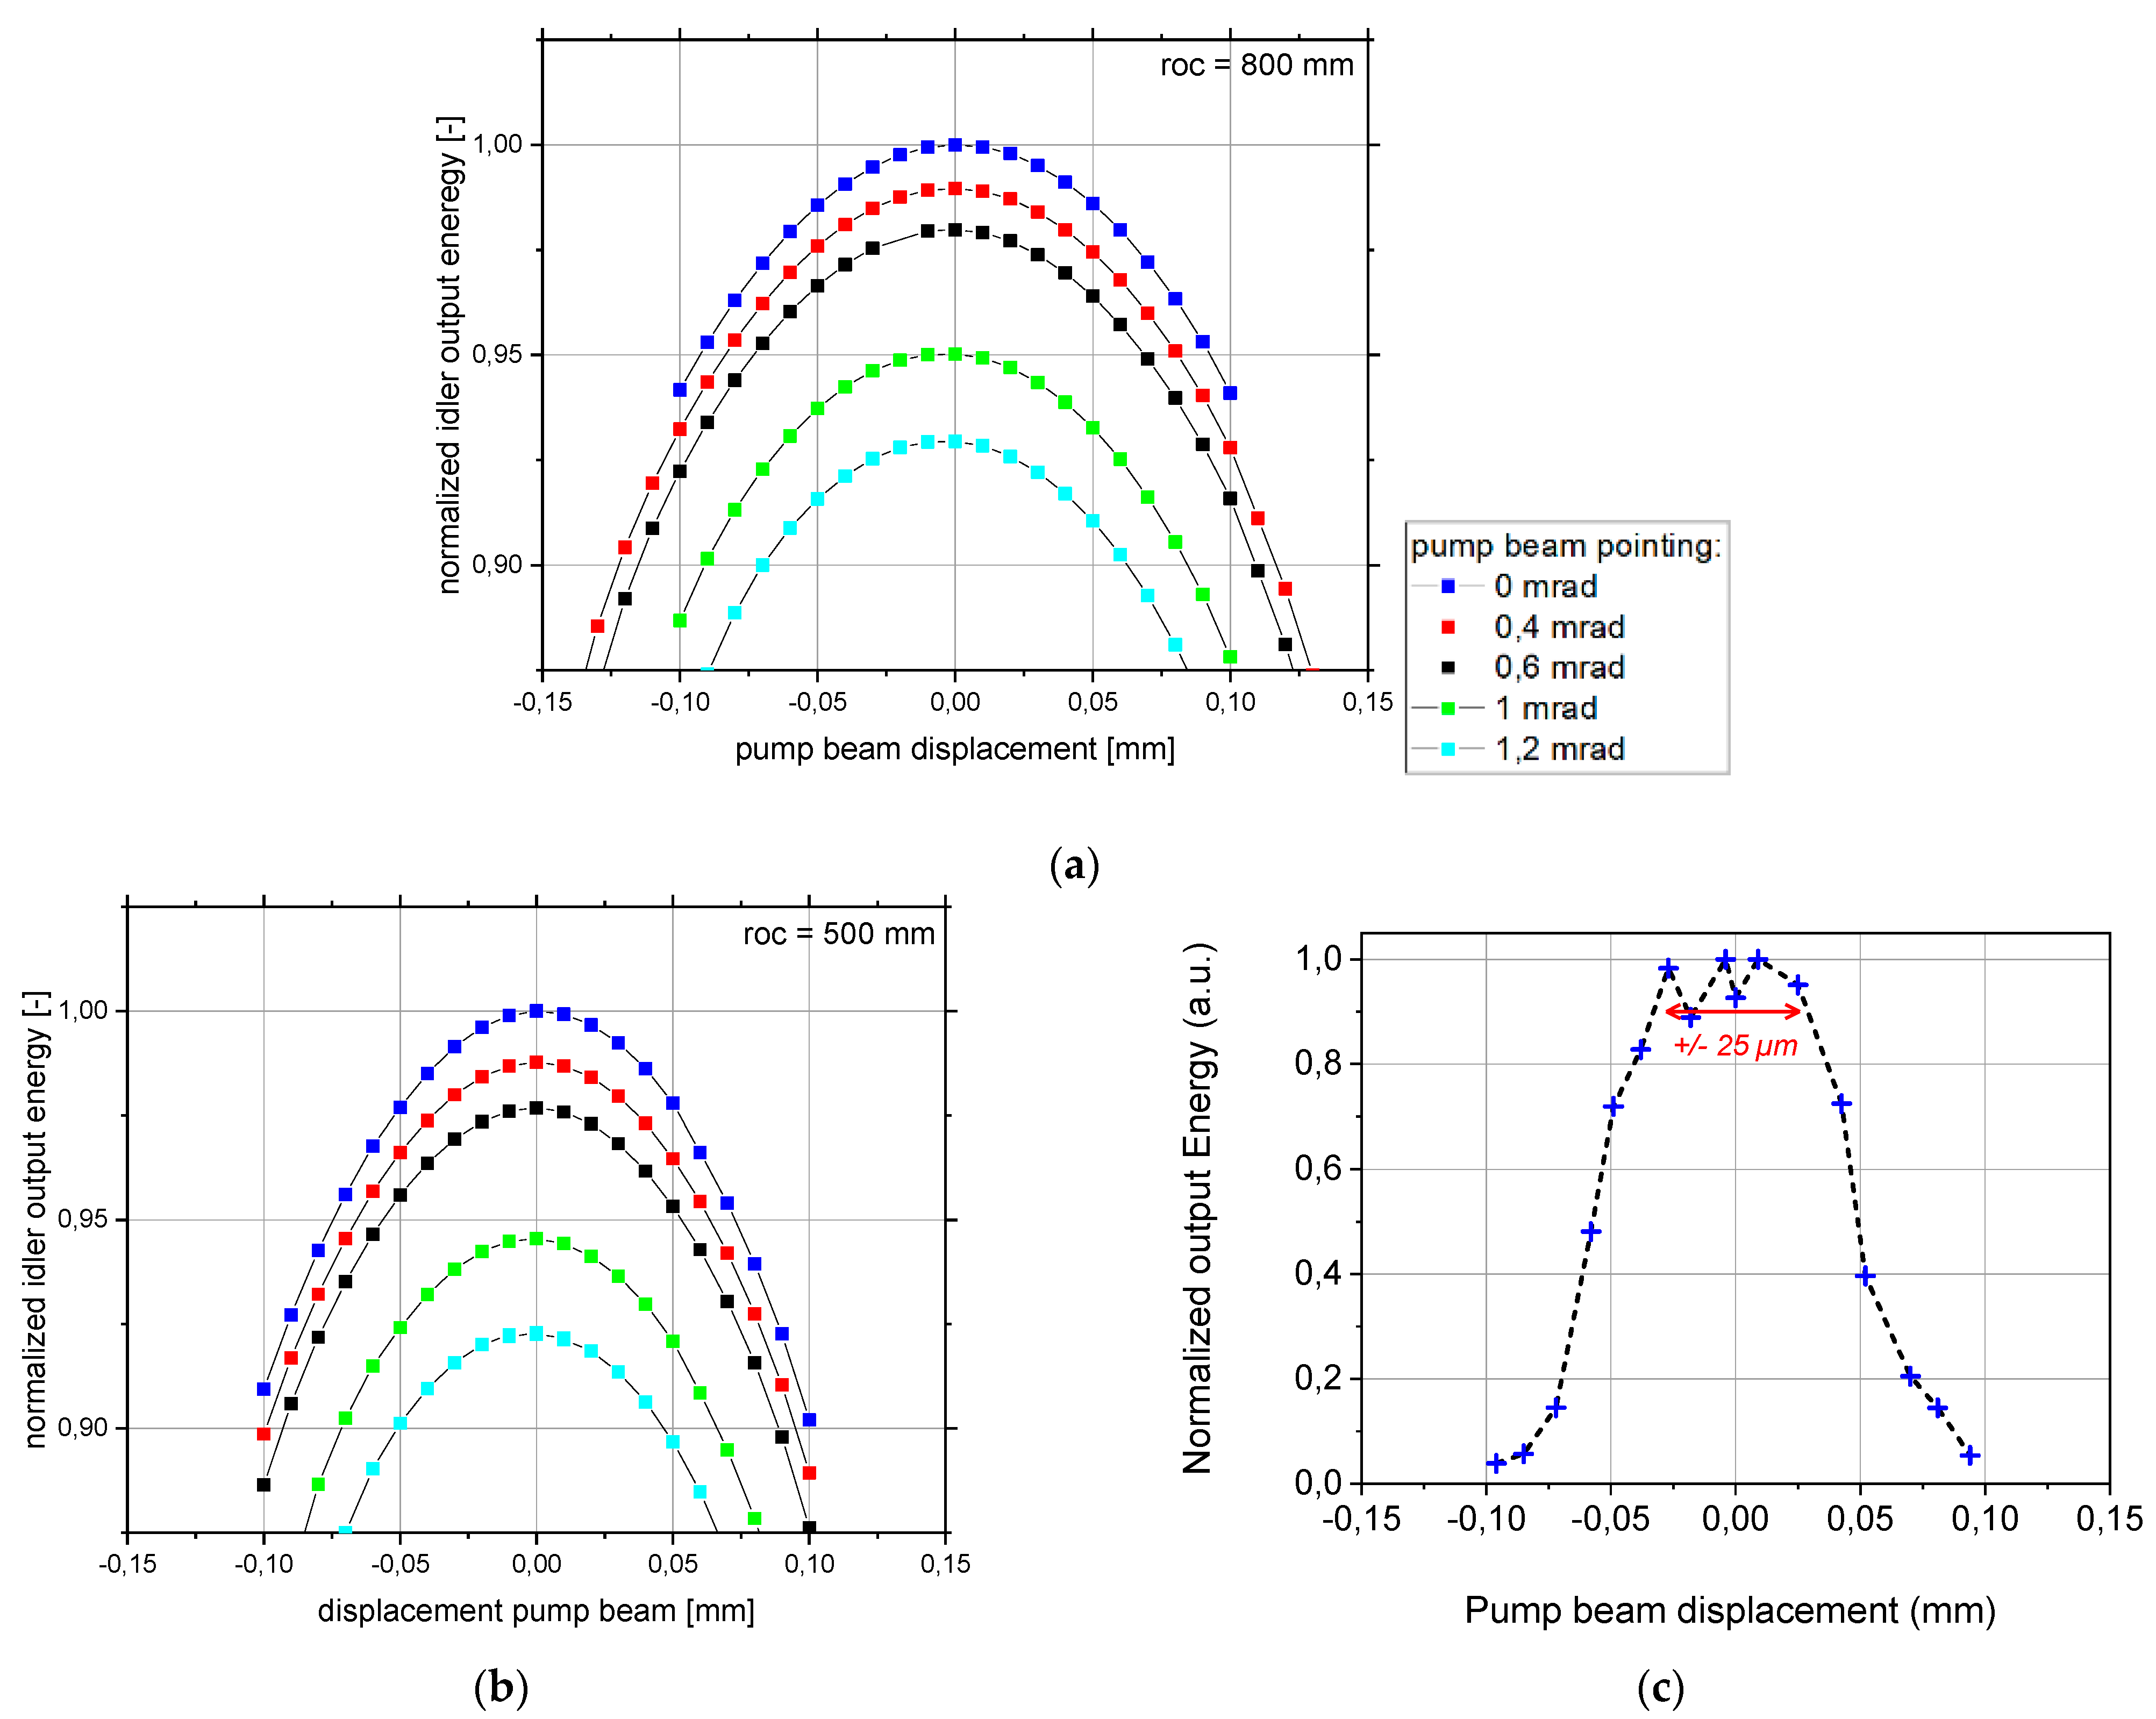
3.1.2. Performance Simulations, Experimental Validation, and Design Optimization

For the optimization of the design, the key goal was to reach maximum output pulse energy. The proprietary software package OPT [42] was used for the calculations, in which radiation fields are represented in two-dimensional, complex-valued arrays (field containers), in which the transverse intensity and phase distribution were stored. Optical elements, nonlinear media, and near-field propagators were implemented in the software package and operate on the field containers. To numerically solve the nonlinear differential equations in the medium, monochromatic plane waves are assumed. The temporal pulse shape was modeled using the finite element method. Additionally, transversal and temporal Gaussian intensity distributions of the pump pulses were assumed.
For the test experiments, we implemented a 2 µm type II commercial PPLN crystal in a NesCOPO architecture with the design parameters specified in Table 2. It is pumped by a commercial injection seeded laser emitting 12 ns pulses at 1064 nm. Up to 1 mJ of energy was used to pump the NesCOPO. The output energy of the idler wave was measured as a function of the incident pump energy (Figure 5).
Prior to the optimization, this NesCOPO was modeled using OPT and the calculated pulse energies were compared with the measured values. By varying the simulation parameters, the threshold and slope as characteristics of the OPO were fitted to the experimental data. Table 3 lists parameters based on the datasheets of optical components (experiment) and the corresponding values assumed in the simulation. Figure 5 shows the simulation results compared to the measurement results.
After this experiment-based initiation of the numerical model, an optimization of the free parameters targeting high output pulse energy is performed. For each possible architecture, either based on PPLN or PPKTP, the incident pump pulse energy is varied to compare threshold and slope between different crystals and cavity parameter configurations. In Table 4, the relevant sets of parameters are listed. The underlined values indicate the design for which the numerically calculated output pulse energy is maximized for a pump pulse energy of 500 µJ. Using PPKTP, the pulse energies are 20 and 47 µJ at the signal and idler wavelength, respectively. PPKTP has never been tested in a NesCOPO before and the calculations indicate it to be a promising candidate.
The simulations also determined the expected temporal shapes of the output pulses (Figure 6), which later served as input to the numerical calculations for the design of the amplifier stages. The shaded areas denote the full width at half maximum (FWHM) pulse durations at the respective wavelength. A difference between signal and idler pulse durations results from a larger cavity finesse of the NesCOPO at the signal wavelength.
Furthermore, in order to achieve single-frequency operation, care has to be taken of the signal and idler cavity lengths to avoid the appearance of mode clusters [40]. For a 13 mm long PPLN, distances of 3 mm between mirror M1 and crystal facet M2 and 0.5 mm between M3 and the crystal output facet allow obtaining a single coincidence of the possible signal and idler modes in the crystal parametric gain bandwidth. These dimensions are implemented experimentally in our test NesCOPO, where the signal oscillates between M2 and M3. For a type II PPKTP, given the group index values for signal and idler, achieving single-frequency emission is rendered possible by a cavity length dissociation in the 2.5% range by having the idler wave oscillate between M2 and M3 and the signal wave between M1 and M3.
Furthermore, we performed a numerical tolerance analysis taking into account laser beam displacement and pointing with respect to the in-coupling optics and the NesCOPO optics themselves. Simulation results are shown in Figure 7a,b and indicate that a design with larger mirror radii (roc) is expected to exhibit larger stability against tilting or misalignment of the pump beam. Additionally, an experimental approach was carried out by varying the pump beam position within the test NesCOPO cavity. As shown in Figure 7c, a beam displacement tolerance of ±25 µm has been identified. These findings are of importance to the development of the thermo-mechanical design of the first housing since the NesCOPOs may be subject to pump beam pointing fluctuations due to thermal variations within the laser housing. Pump beam displacement and pointing have to be kept within the NesCOPO tolerances to allow for maximum extraction of signal and idler energy.

3.2. Housing 2: Optical Parametric Amplification (OPA) Stage

The second housing (development by Fraunhofer ILT) contains two OPA stages with the objective of amplifying the 2.05 µm signal radiation emitted from the NesCOPO to an energy level of 40 mJ, which has been specified as an instrument requirement for CO2 measurement (see Section 2.1). Parametric amplification using PPKTP crystals is envisioned.
In a previous setup for ground-based DIAL measurement of CO2, we used commercial bulk KTP crystals [30]. However, angle tuning is necessary for such configuration to target different gas species, which is not robust for an integrated instrument. Since PPKTP enables us to reach the highest nonlinear coefficient of KTP, without walk-off, it makes it an excellent candidate for high-efficiency, high-energy amplification with good beam quality [43,44,45]. In addition, gamma radiation testing showed a high tolerance of these crystals to the space environment, especially for infrared wavelengths [46]. To benefit from these advantages to generate pulses with sufficient energy, high-aperture crystals need to be realized.

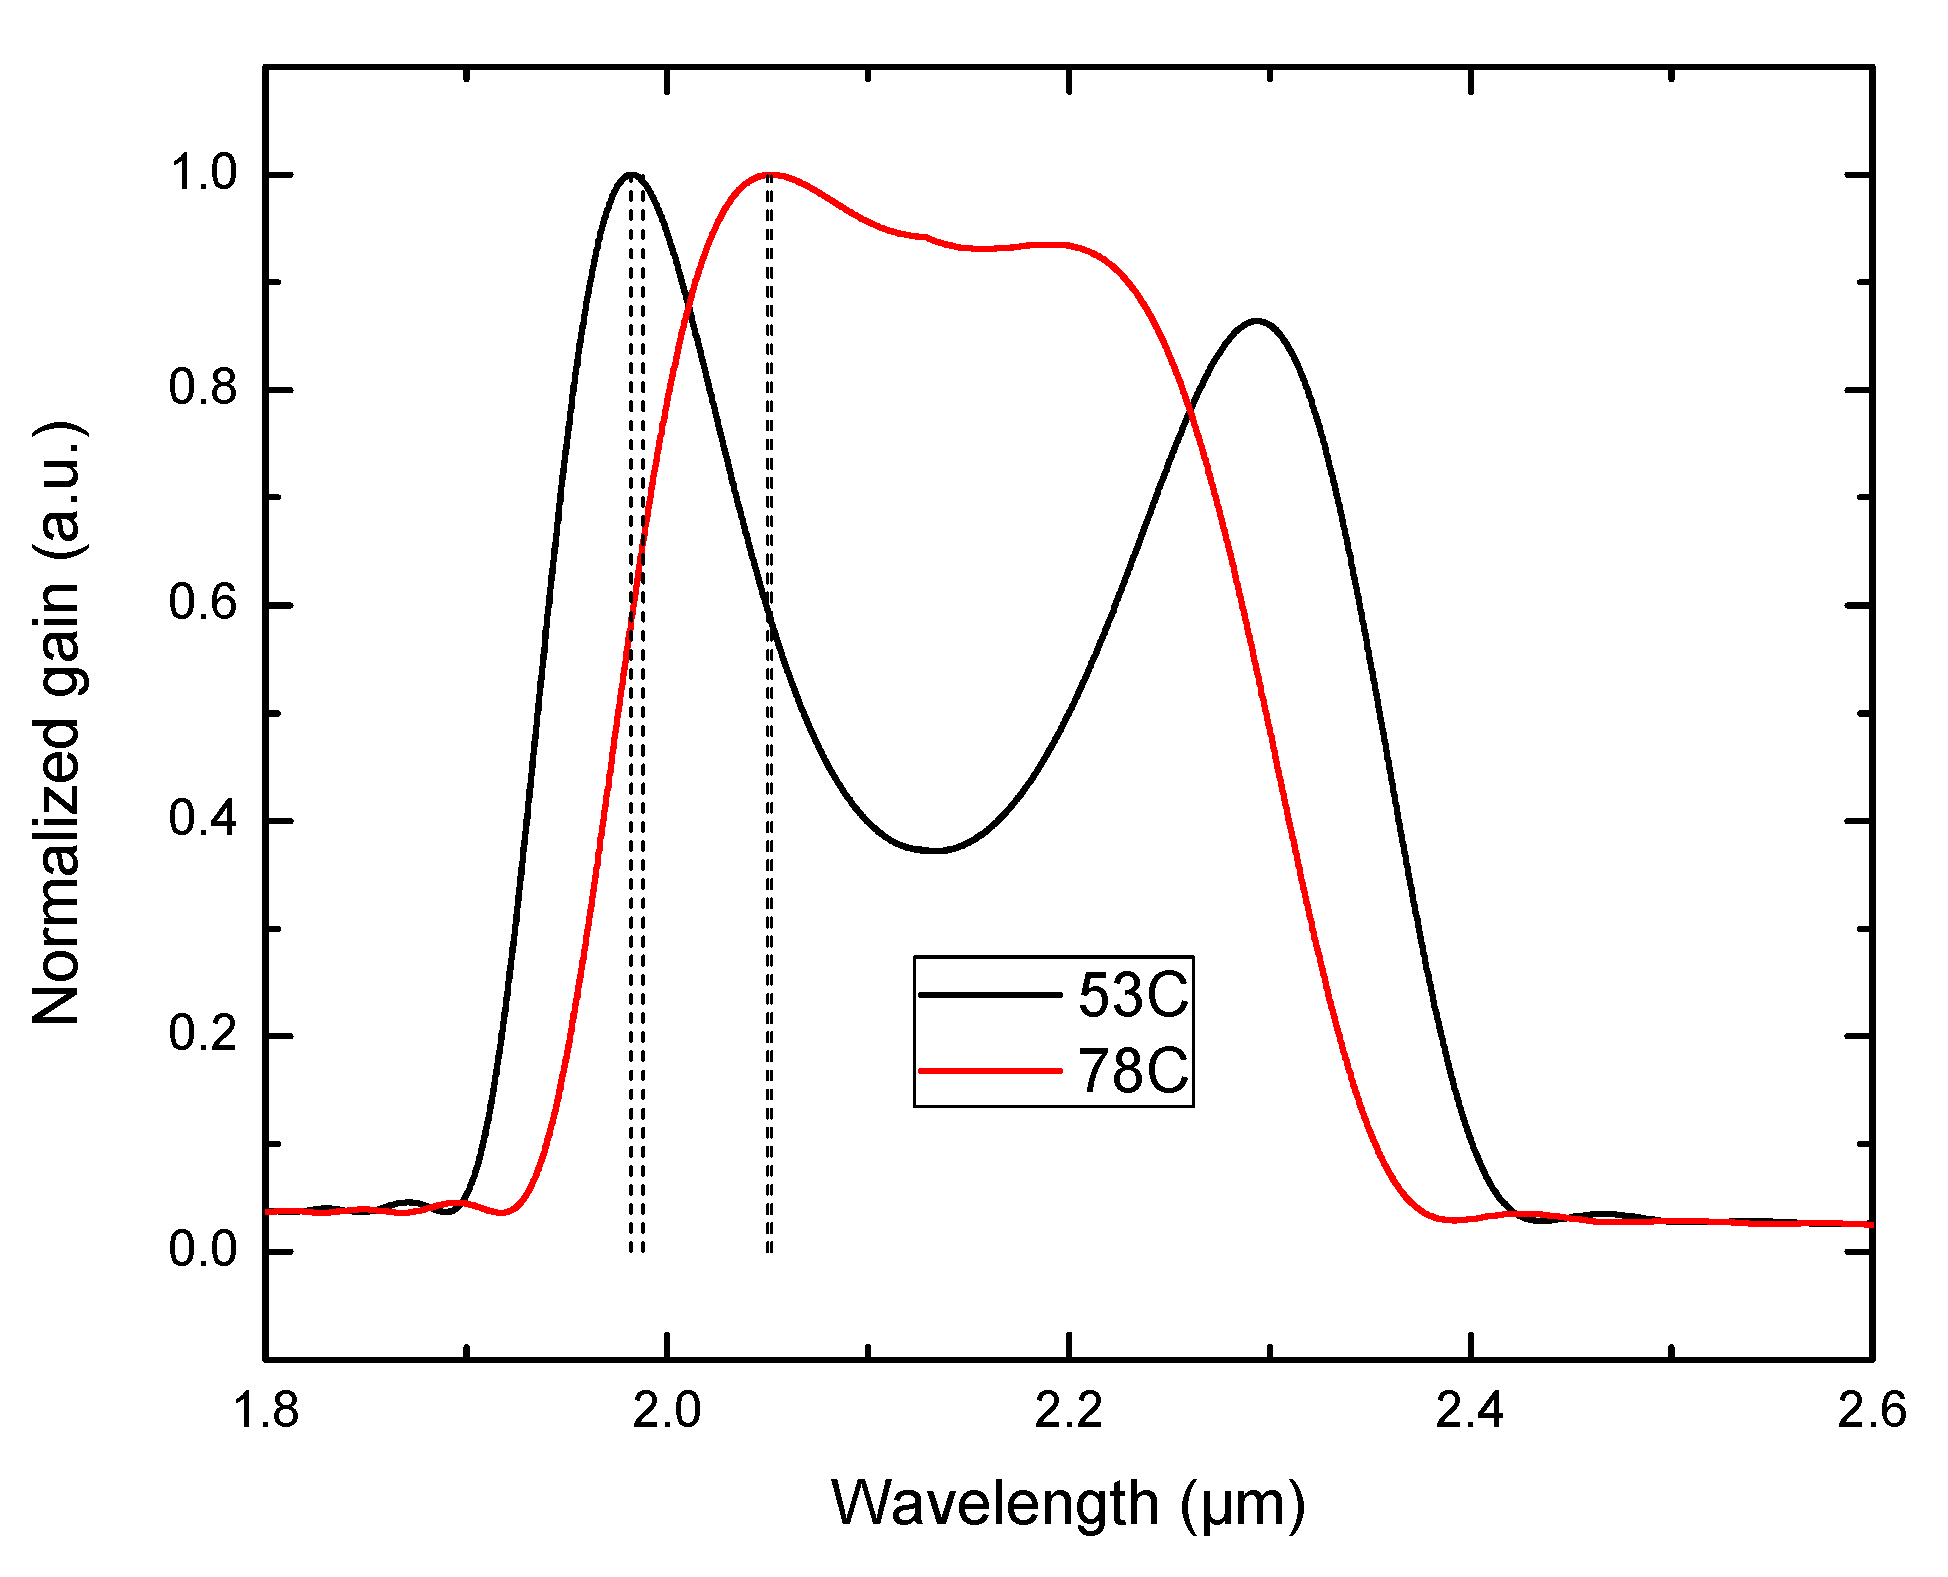
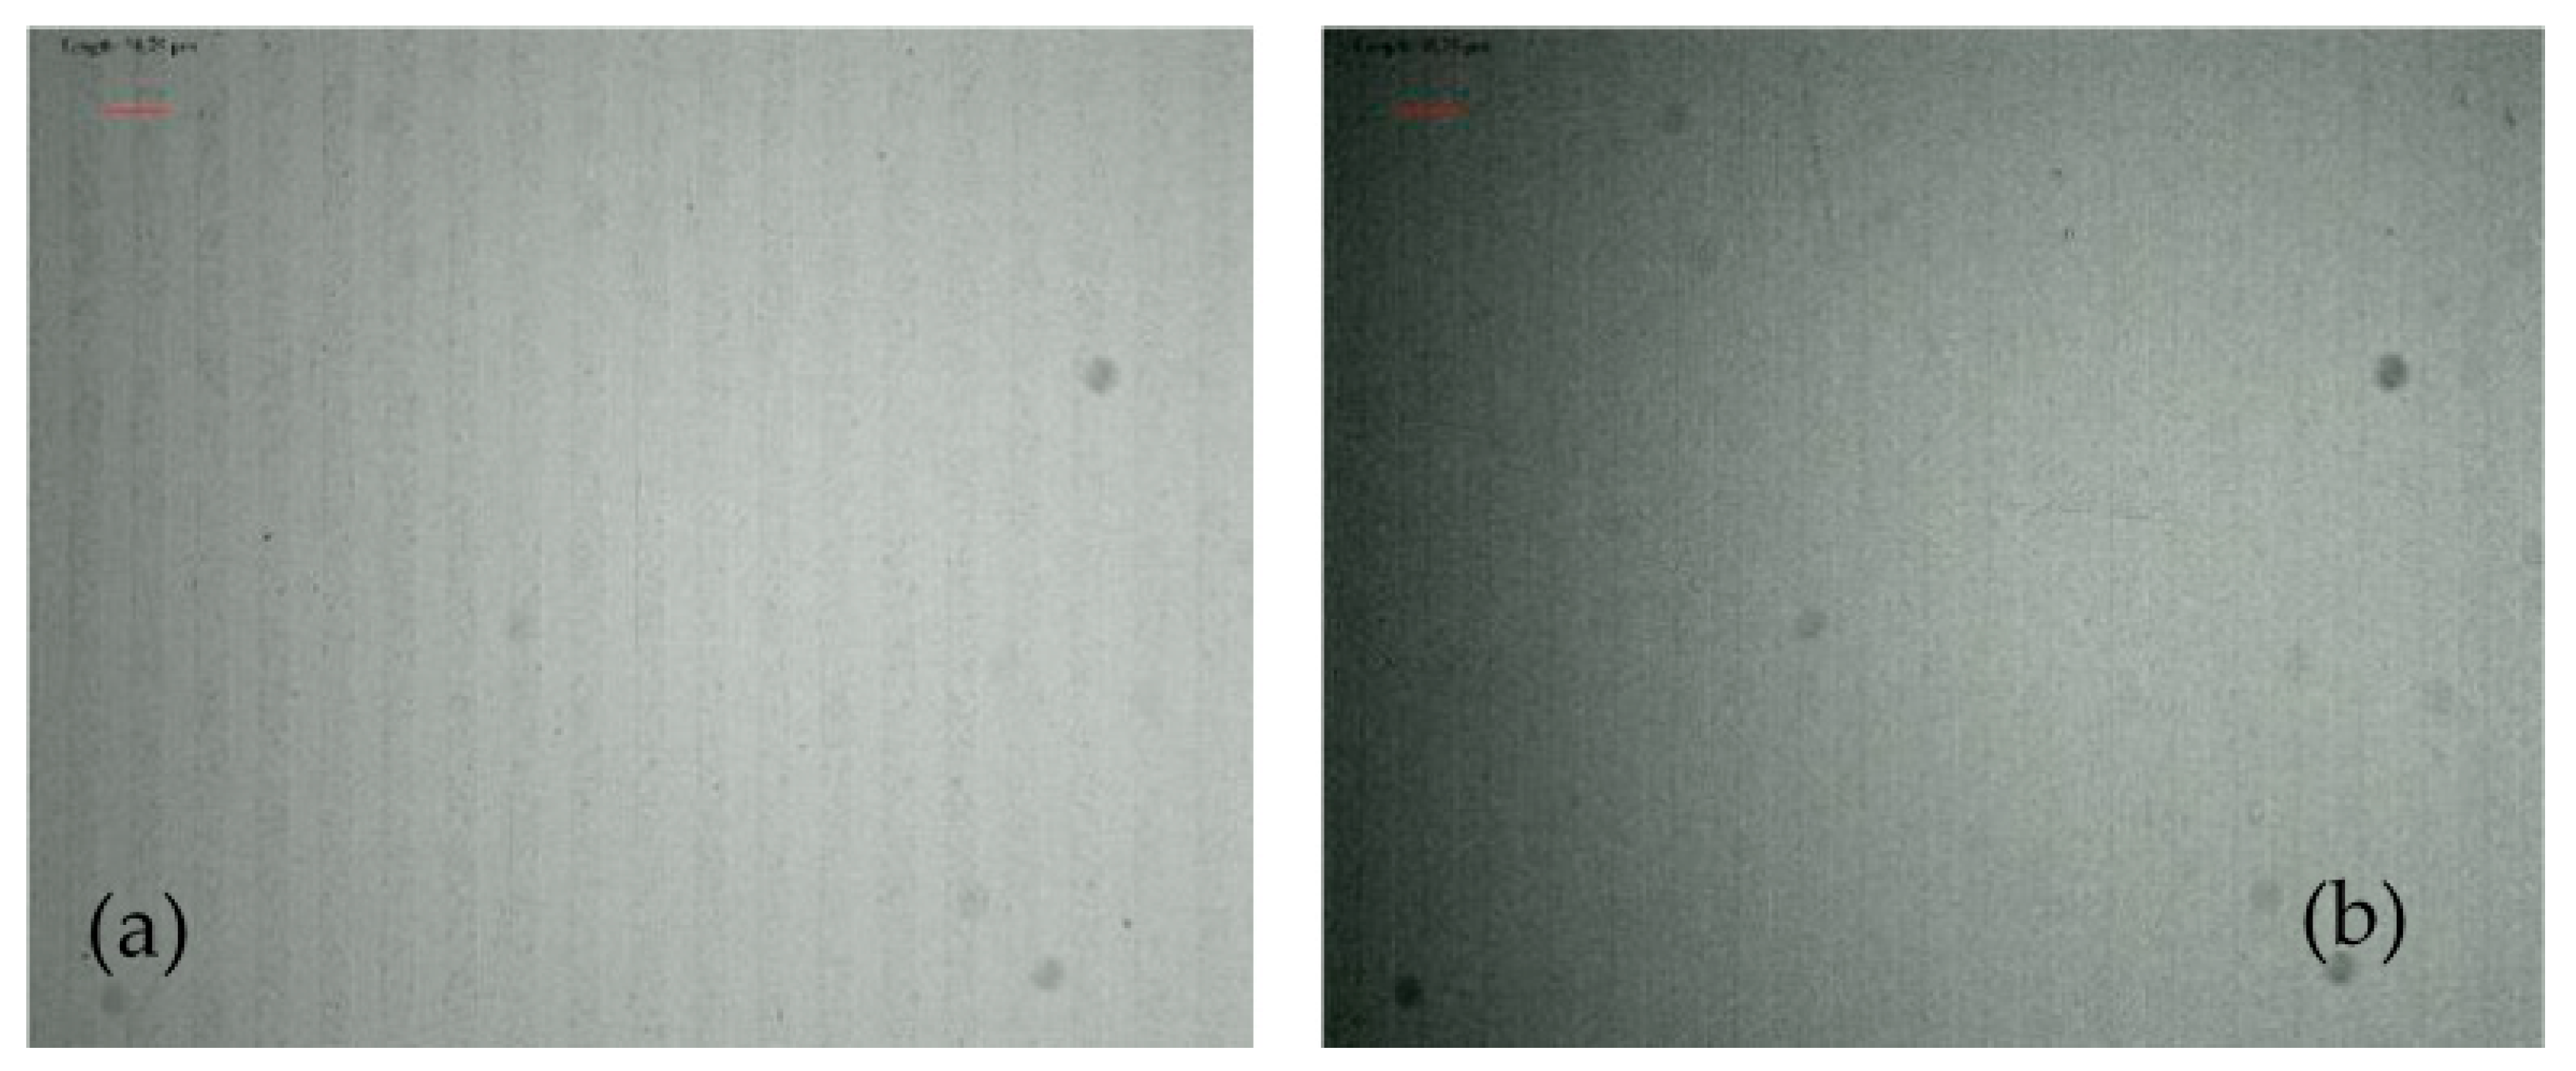
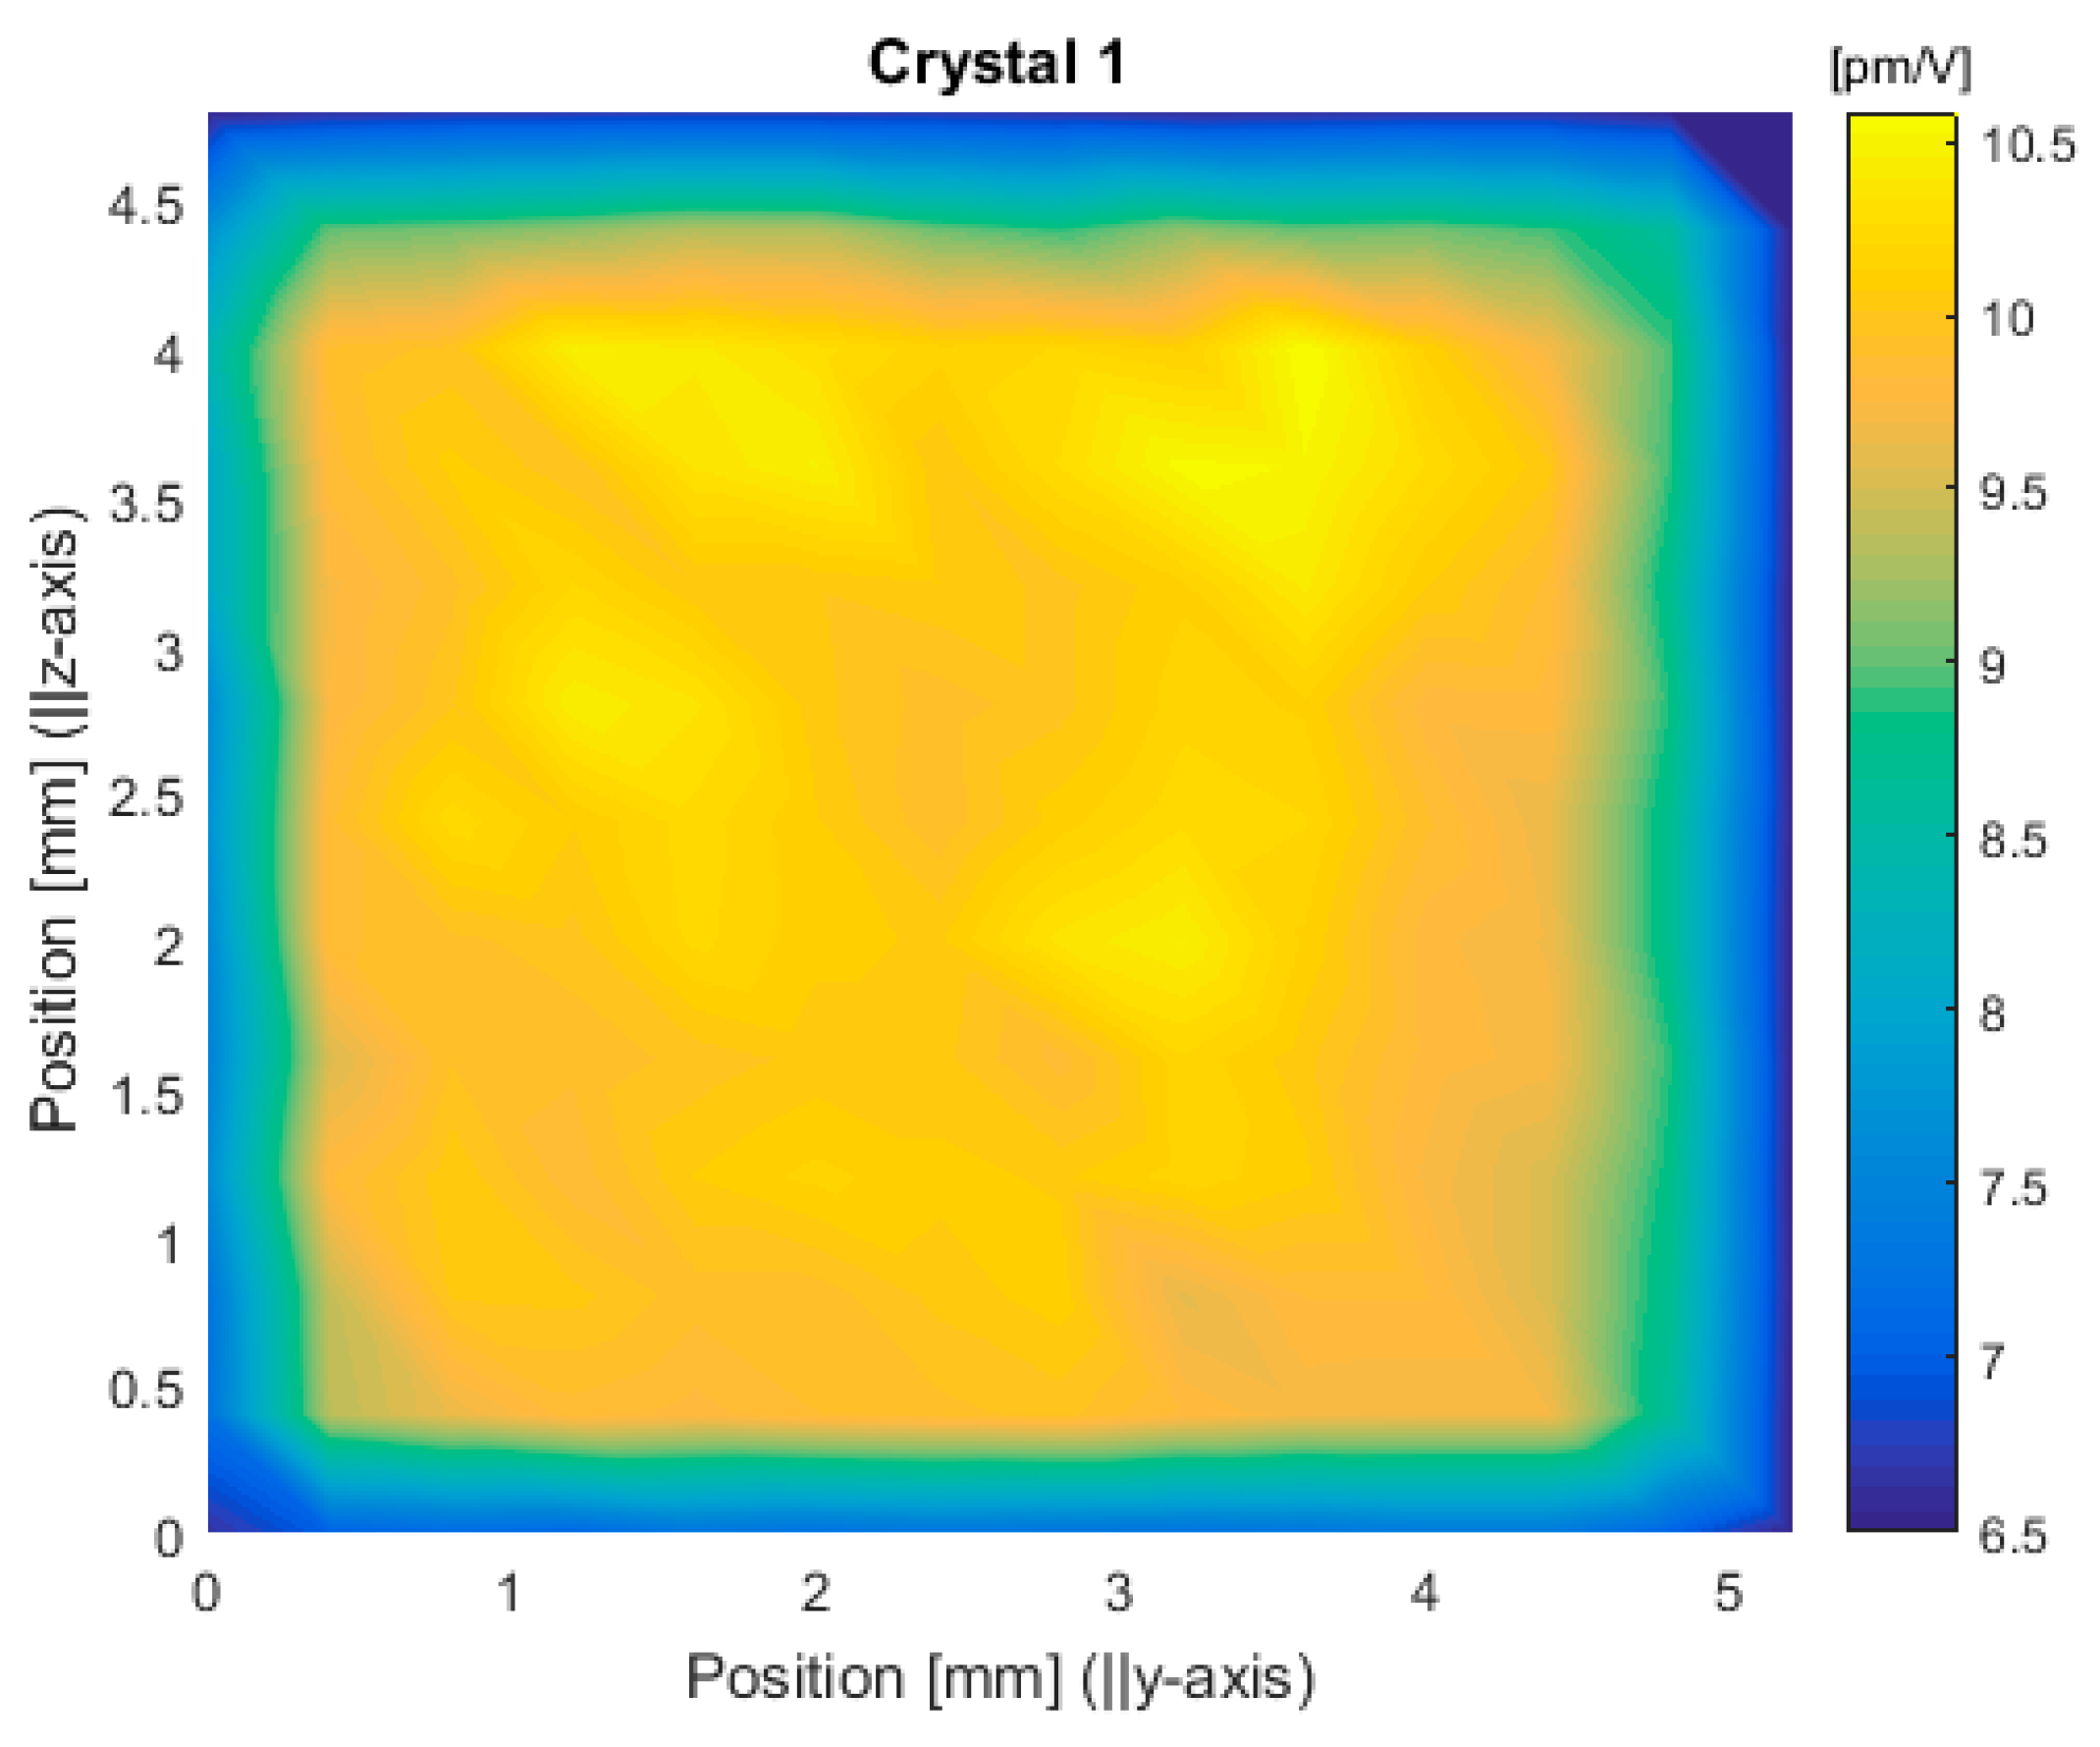
3.2.1. Nonlinear Crystal Design and Characterization

The choice of nonlinear crystals for the OPA stages is dictated by the need to cover the spectral bands of 2050–2060 nm (for CO2 and water vapor sounding) and 1982–1988 nm (for water vapor and/or methane sounding using an additional NesCOPO). The OPA will be seeded by the narrowband idler radiation from the NesCOPO and pumped at 1064 nm. The generated idler radiation will be in the corresponding ranges of 2209–2213 nm and 2289–2297 nm. The nonlinear crystals should exhibit high transmission at the pump, signal, and idler wavelengths, absence of two-photon absorption, and a high laser-induced damage threshold. Moreover, the aim is to reach the required spectral ranges in the OPA without mechanical movement of the nonlinear crystals, leaving the crystal temperature as the only practical tuning parameter. OPAs operating in the regime of pulse lengths of 10 ns and above aim at generating signal energies of tens of millijoules, require nonlinear materials with high effective nonlinearity, and large optical aperture in order to approach a saturated amplification regime at pump intensities at least two times below the laser-induced damage threshold.
By taking the above-mentioned requirements into consideration, we determined that periodically poled Rb-doped KTiOPO4 (Rb:KTP) would be the best choice for realizing the OPA. These crystals are characterized by a high damage threshold in the spectral region of 1–2 µm [47,48,49,50]. Moreover, they have been shown to have low susceptibility to radiation damage, an essential consideration for applications in space-based instruments [46]. Importantly, the technology allowing high-fidelity and large aperture structuring has been developed for PPKTP [43]. Large optical aperture crystals have been implemented in high-energy OPA and OPO settings before, although in different spectral ranges [43,44,45]. For the current project, a quasi-phase-matching period of 38.75 µm has been chosen for the PPKTP crystals. The choice was guided by the need to reach the target spectral bands within a convenient temperature range of 20–80 °C. The calculated gain spectra of a 10 mm long PPKTP with a 38.75 µm periodicity at two operation temperatures are shown in Figure 8. The dotted lines mark spectral bands corresponding to the specifications of target GHG (CO2, water vapor, CH4).
Rb:PPKTP crystals with optical apertures of 5 × 5 mm have been produced by using standard lithography and pulsed electric field poling procedure [43]. Rb:KTP has an orthorhombic crystal structure characterized by straight ferroelectric domain walls perpendicular to the [100] crystal axis. Such crystalline structure simplifies the fabrication of high-fidelity ferroelectric domain structures throughout the crystal volume. Figure 9 shows microphotographs of the chemically etched polar surfaces of a 5 mm thick PPKTP with a 38.75 µm period.
The fabricated crystals were tested in a singly resonant OPO setup. The OPO featured a hemispherical cavity comprising an input mirror with a radius of curvature of 150 mm. The reflectivity of the output coupler was 50% for the signal. The pumping mirror had a reflectivity of 99.5% at the signal. All mirrors were nominally anti-reflection coated for the pump and idler wavelength. The crystals were mounted on a temperature-controlled mount positioned on a motorized translation stage, allowing 2D mapping of the OPO performance as the crystal was scanned across the pump beam. The pump laser was an injection-seeded Q-switched Nd:YAG laser operating at 100 Hz repetition frequency generating 12.5 ns FWHM pulses in a single longitudinal mode. OPO tuning by changing crystal temperature is shown in Figure 10. The error bars in the figure denote the measured FWHM bandwidth of the OPO. The measured tuning data correspond reasonably well with calculations using Sellmeier expansion from [49] and thermo-optic coefficients from [50].
The effective nonlinearity of the crystals was estimated from the OPO threshold measurement. While scanning the crystal across the pump beam (1/e2 radius of 350 µm), the OPO threshold was measured at each point. The effective nonlinearity was deduced from the analytic expression for the nanosecond SRO threshold according to Brosnan and Byer [51]. The 2D map of the effective nonlinearity is shown in Figure 11. The apparent lower nonlinearity around the edges of the crystal is due to geometric pump beam clipping. The effective nonlinearity is homogeneously distributed and corresponds to the maximum value expected in PPKTP, indicating high quality periodically poled structure throughout the whole crystal volume. The obtained crystal characteristics are thus very promising for their future integration within the emitter OPA.

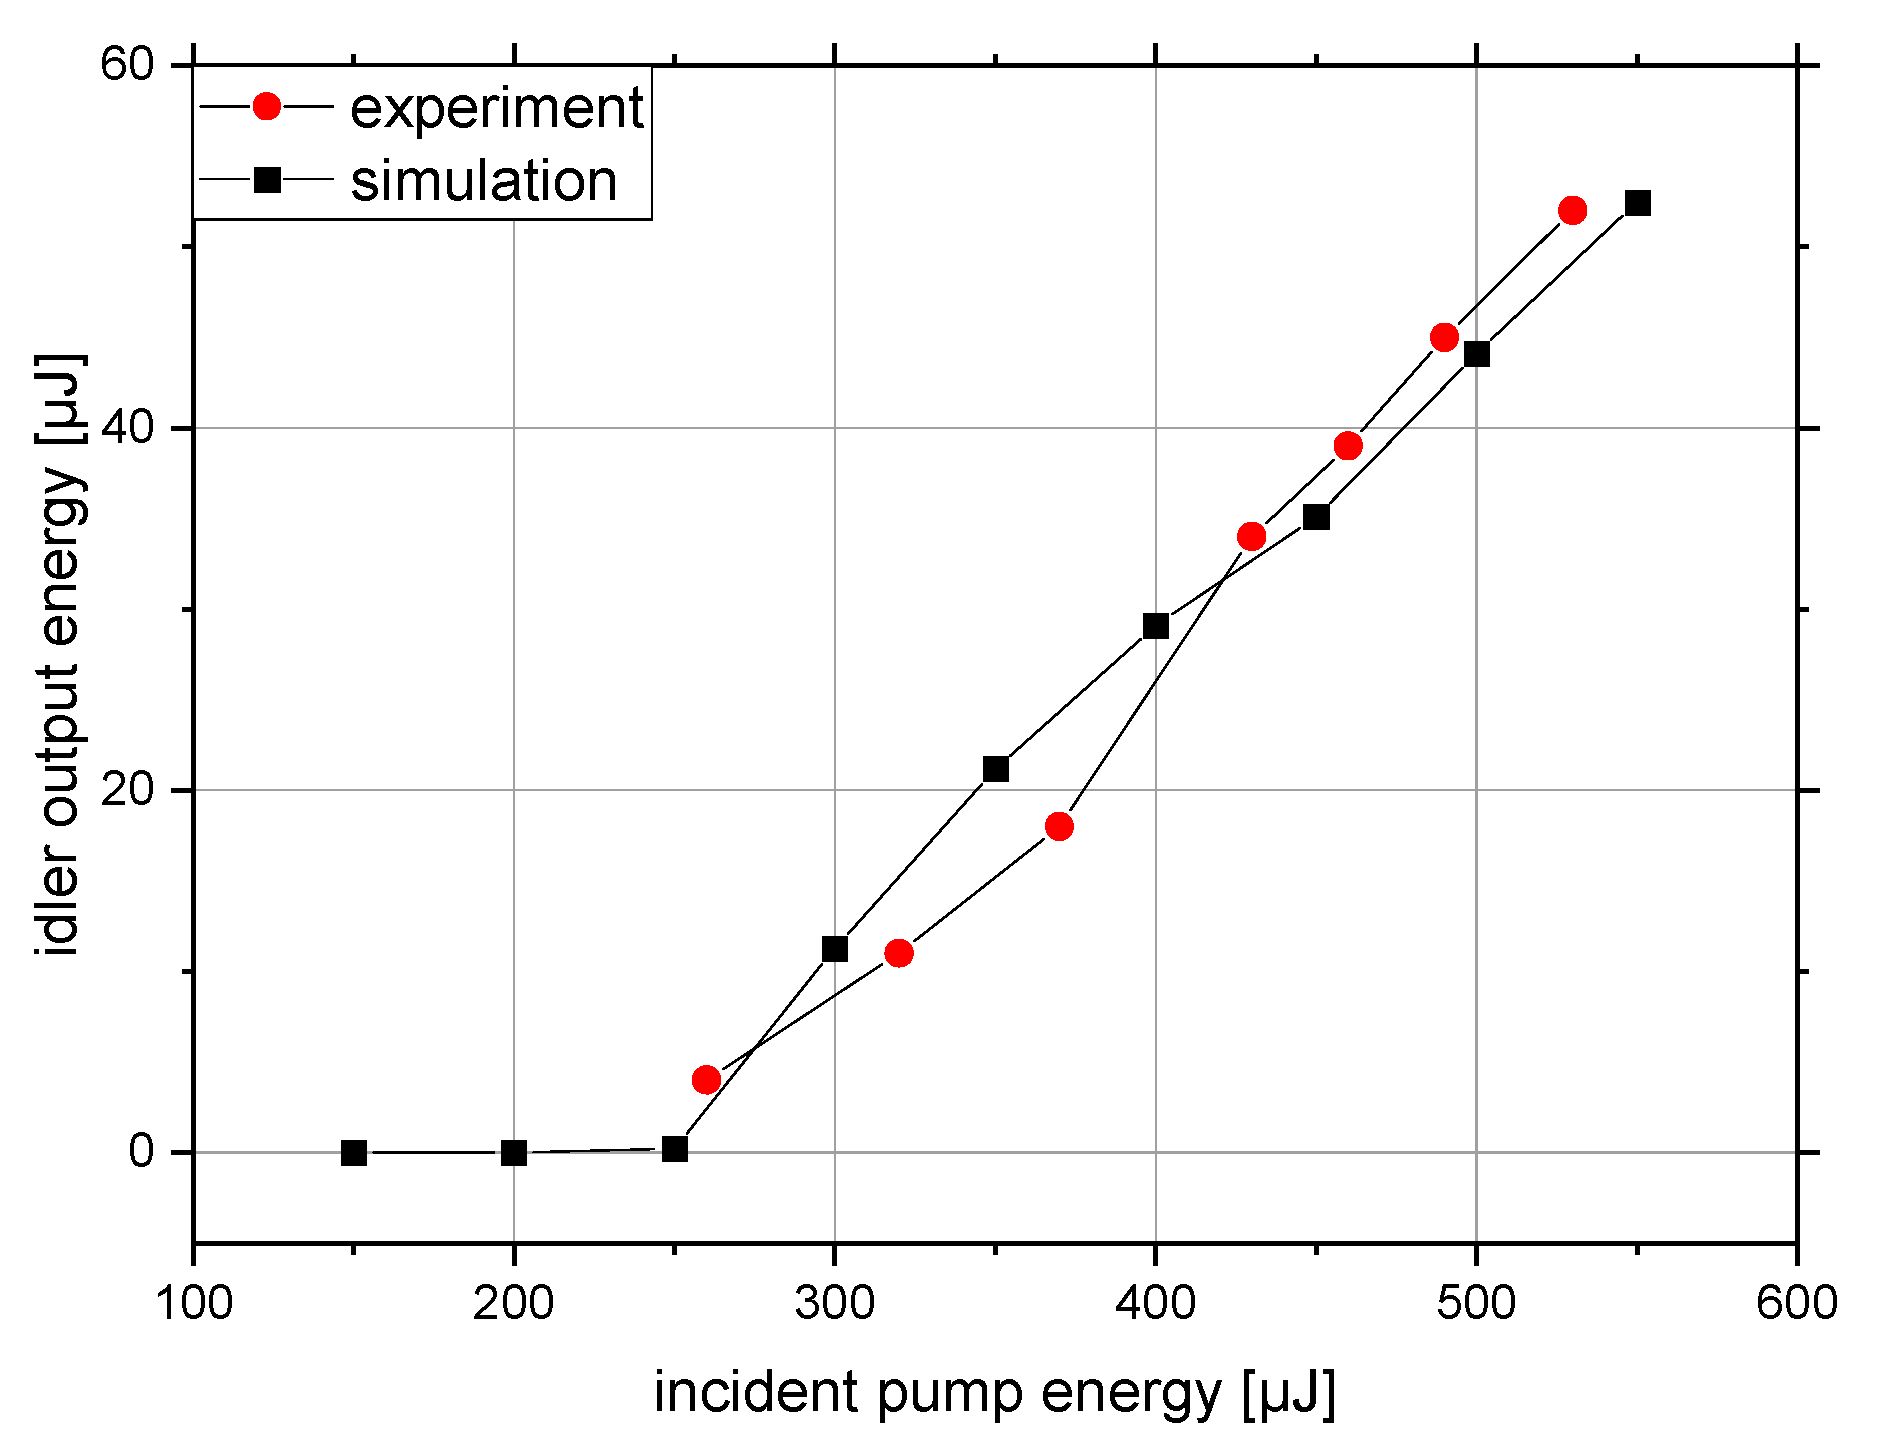
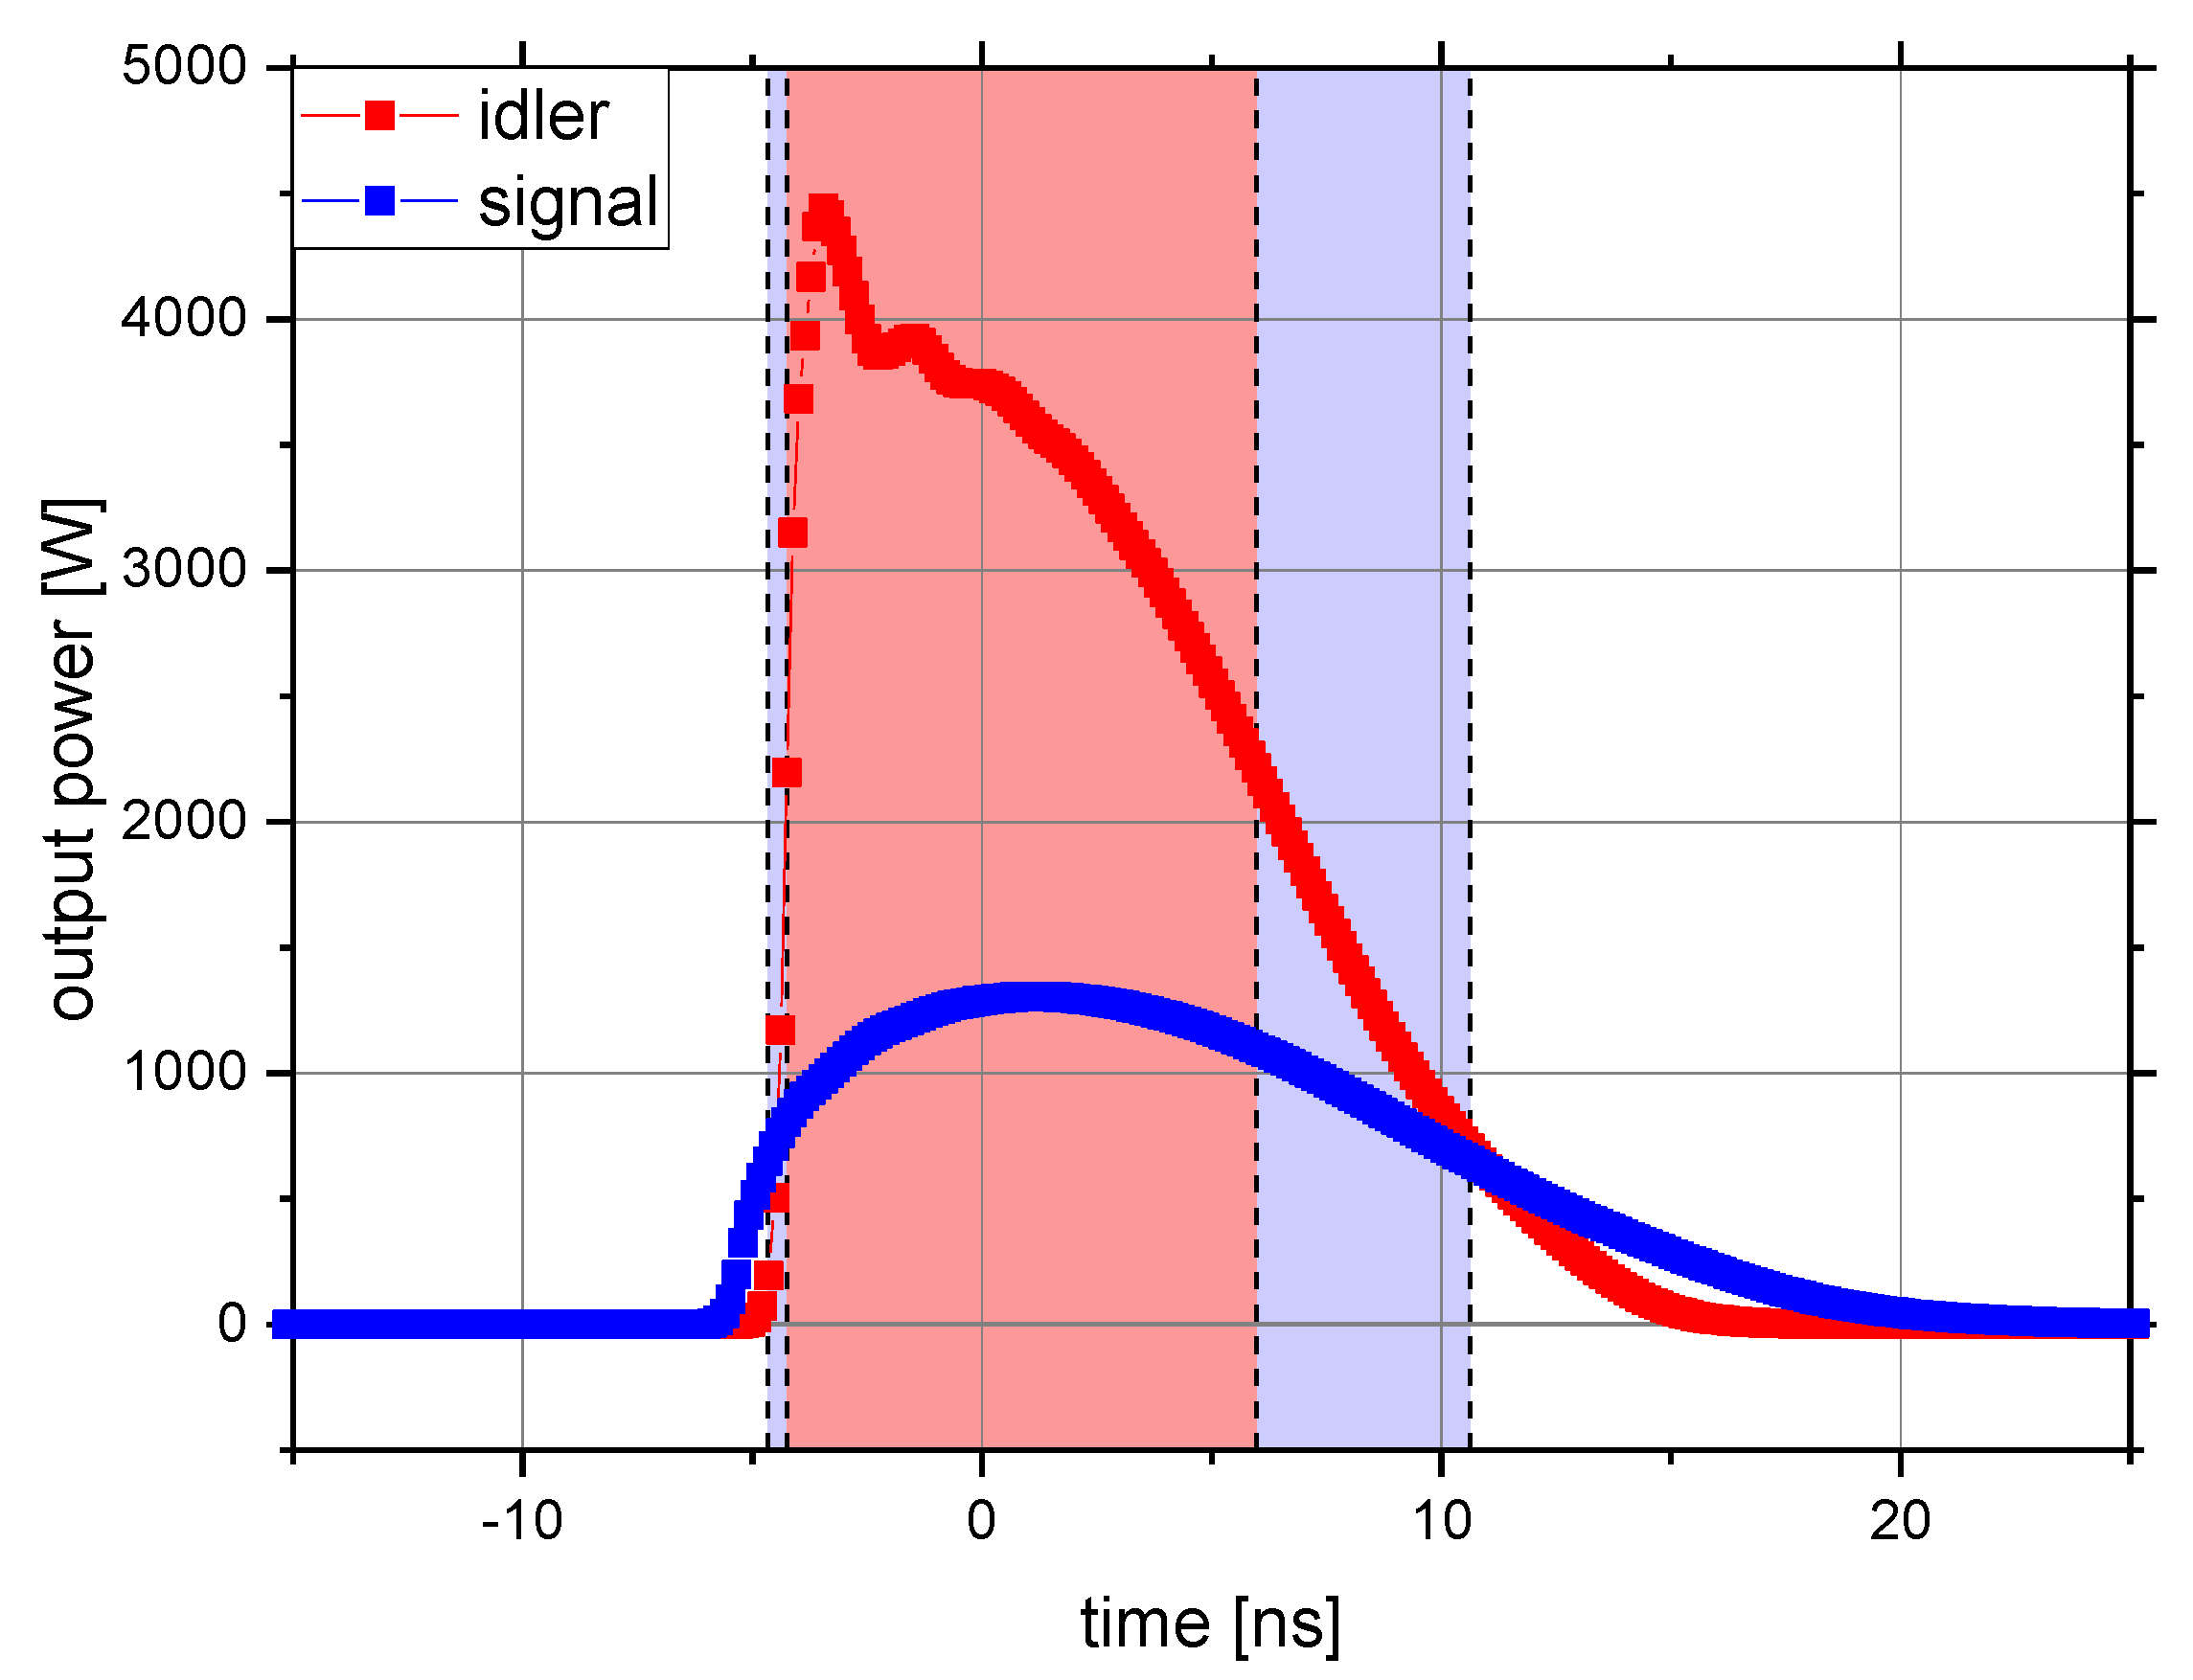
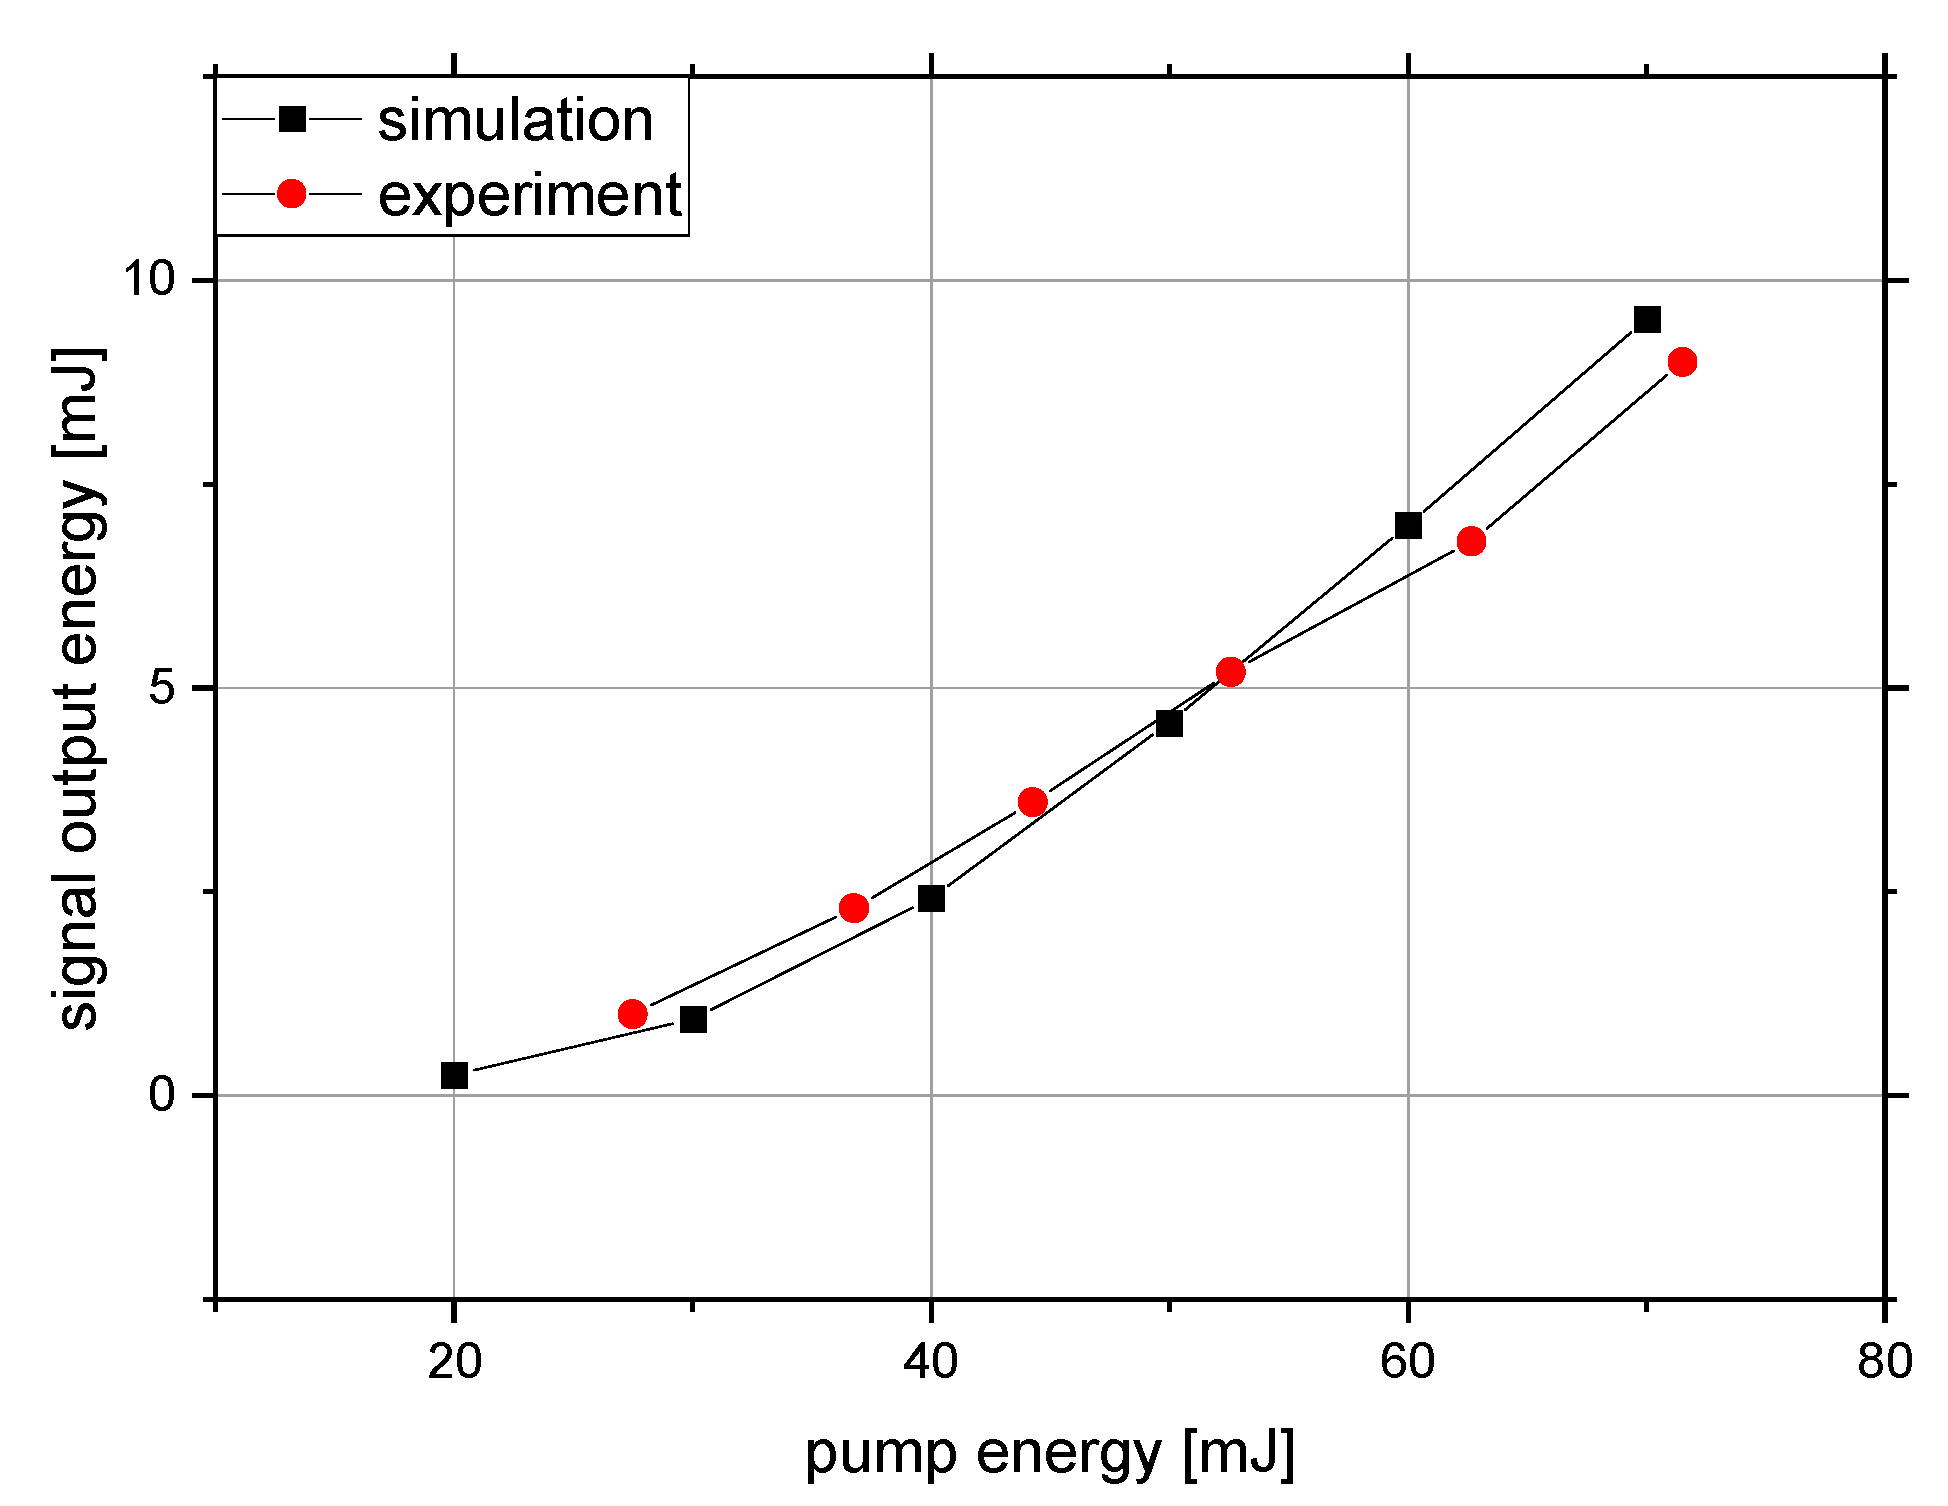
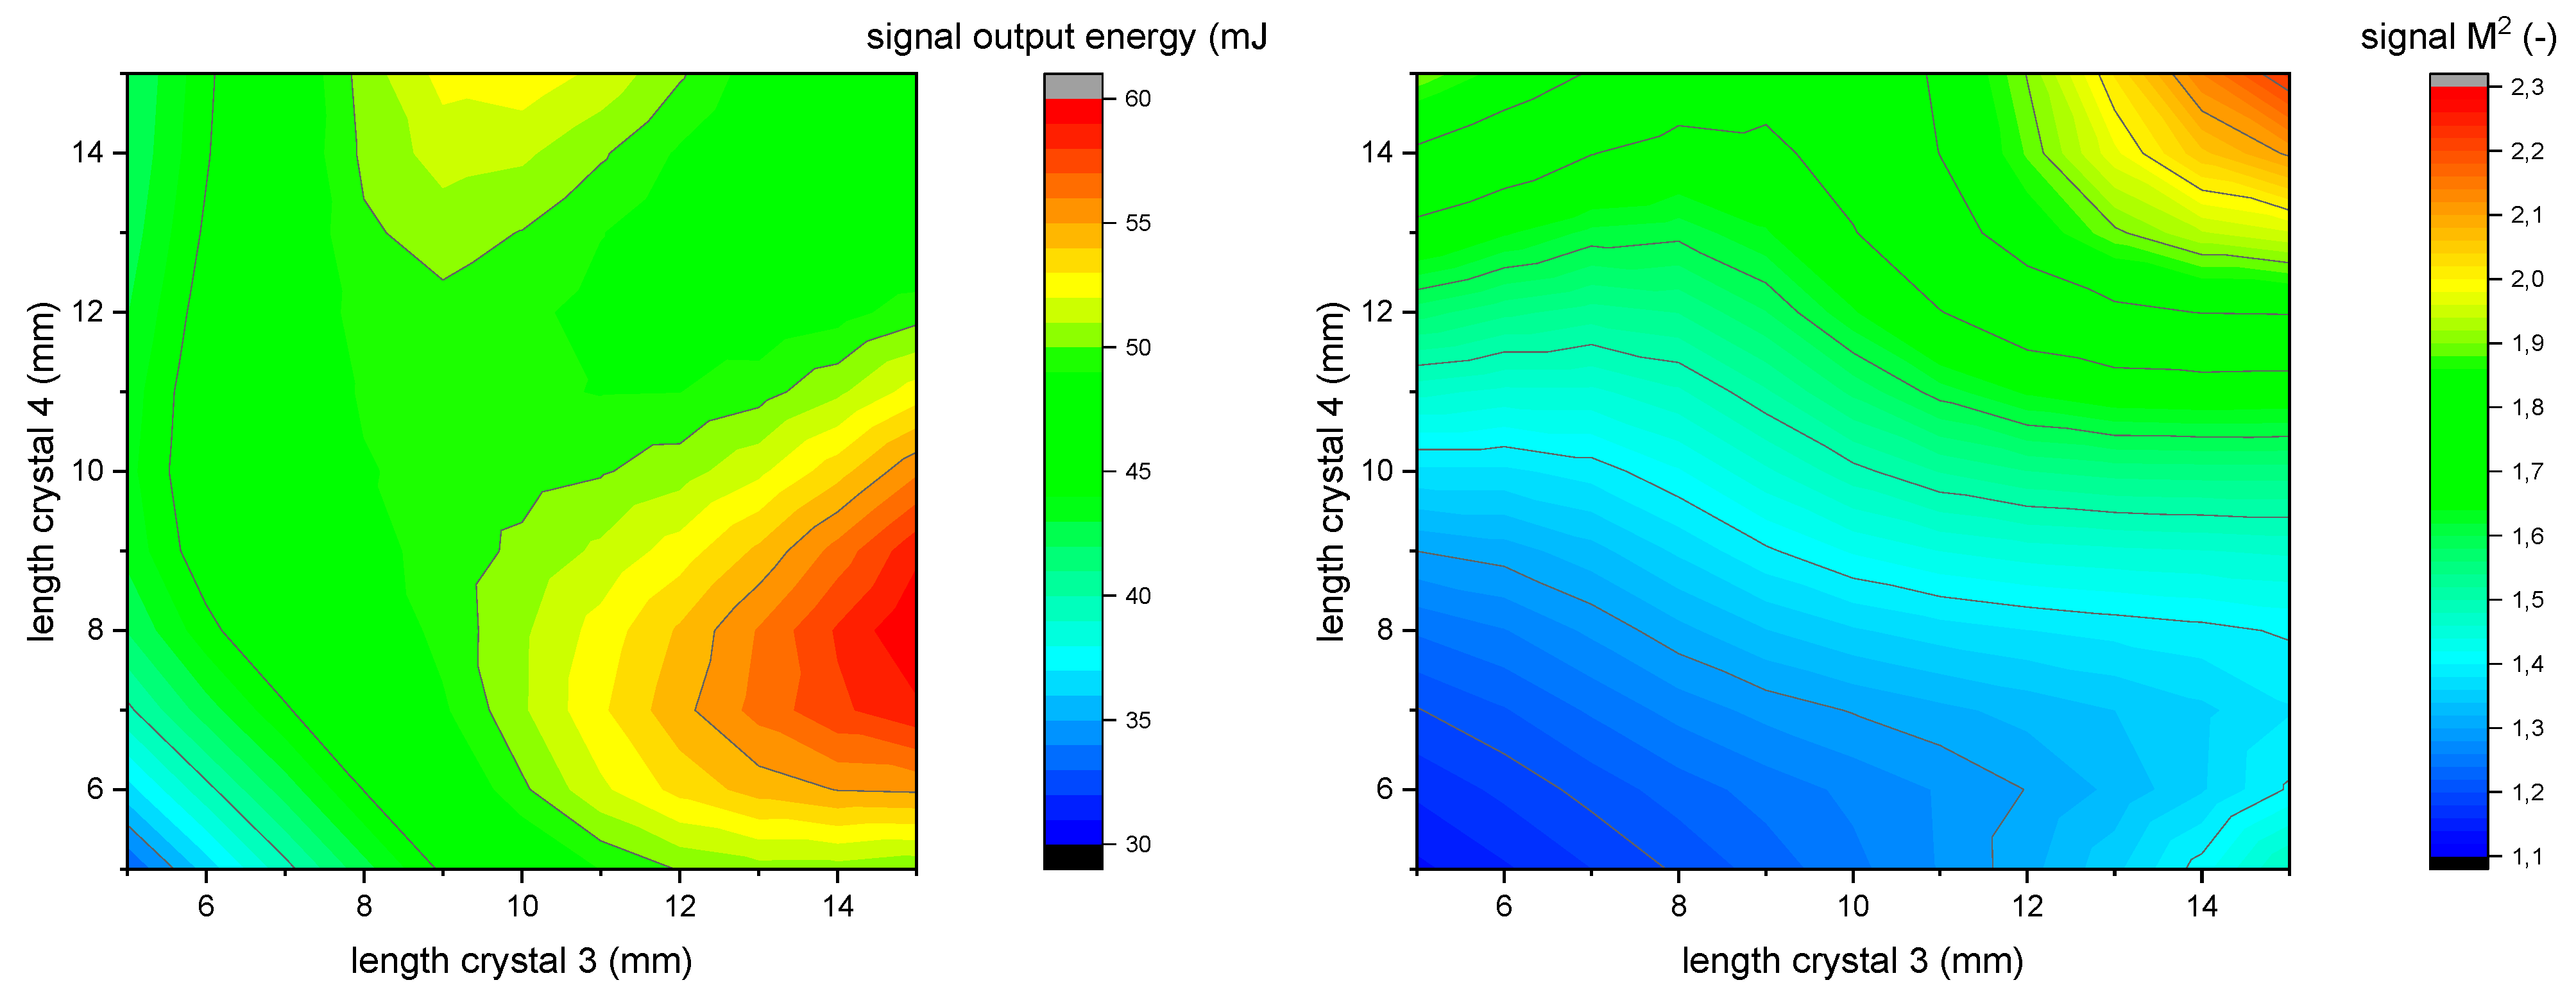
3.2.2. Preliminary OPA Testing and Performance Simulations

Similar to the approach used for the NesCOPO simulation study presented in Section 3.1.2, a reference OPA experiment was carried out to determine the parameters for further numerical calculations using the OPT simulation software. In the experiment, we used 10–20 µJ of idler single-frequency emission emitted by the PPLN-based NesCOPO specified in Table 2 and pumped an OPA line of three 12 mm long PPKTP crystals with up to 70 mJ at 1.064 µm and a repetition rate of 150 Hz. The pump beam diameter (at 1/e2) is 2.8 mm. To avoid gain saturation, the idler beam was removed between the last two crystals, as suggested in [52]. The measured signal output energy as a function of the pump energy is shown in Figure 12. The calculated output energy obtained by simulation with OPT using parameters adjusted to fit the experimental data is also shown.
By comparing measured and calculated pulse properties, deviations due to the assumed idealizations can be estimated. Thereupon, a reduced gain within the PPKTP crystal was observed. In the calculation, this gain reduction can be modeled by multiplying the effective nonlinearity of the PPKTP crystals (deff) [53] by a factor of 1/1.69 (see Table 5). This gain reduction, as well as reflection losses at the crystal faces, are assumed to account for the actual experimental outcome. Indeed, in previous works, a reduced gain by a factor of 1.5 was measured in a single-mode seeded OPA if the pump laser was switched from multi- to single-longitudinal-mode operation [54]. Moreover, our nonlinear crystals were operated at room temperature, close to 20 °C, thus out of the ideal phase-matching temperature, degrading the nonlinear gain of around 55% compared with the theoretical plane-wave non-saturated case. Slight misalignments in the experiment can also lead to reduced gain due to non-optimal overlap between the pump and idler waves.
Using the experiment-initiated simulation tool, the OPA design is optimized for maximum output pulse energy and beam quality factor. We investigated a design consisting of four PPKTP crystals in two successive amplifying stages with filtering of the idler wavelength behind each crystal. Indeed, distributing the available pump pulse energy between two stages and removal of the idler wave show to optimize the extracted signal energy and beam quality. Figure 13 shows the simulation results of the output signal pulse energy and beam quality factor after the second amplification stage with variable lengths of two crystals in stage 2 and otherwise constant parameters.
After calculating the expected signal output energy for all possible combinations of crystal lengths between 5 and 15 mm, a design with 12, 12, 12, and 6 mm long crystals was chosen, which is a trade-off between achievable output pulse energy and beam quality. For these crystal lengths, a signal output energy of >50 mJ with a beam quality factor <1.3 is expected for an incident pump energy of 90 mJ in the first OPA stage and 110 mJ in the second stage.
The technical implementation of the numerically optimized design consisting of four crystals in two successive stages is shown schematically in Figure 14 where the two stages are represented with the crystals in positions #19 and #22 for the first stage and #28 and #31 in the second stage. The delay line (#8) for the pump beam compensates the time delay arising from the pulse build-up time of the OPO. The pump energy ratio between the two OPA stages can be precisely tuned by means of a waveplate (#7) and a polarizer (#12) to guarantee the highest output energy with a good beam quality.
Additionally, the OPA output pulse energy was calculated for varying spatial offsets and angles between seed and pump beams. The first results indicate that the OPA stage exhibits tolerances to mechanical misalignments at least twice as high as in the previously presented tolerance analysis for the NesCOPO architecture (Section 3.1.2). In the case of the OPA, the crystals’ angular acceptance and beam overlap govern the reduced device performance due to misalignment, while the tolerance of the NesCOPO is additionally reduced by the cavity acceptance. This instrument is thus expected to be suitable for challenging environmental conditions during an airborne operation. Nevertheless, a beam stabilization system consisting of two piezo-controlled mounts (#6 and #10 in Figure 14 and two position-sensitive diodes (PSDs, #11 and #14) for the pump beam, a piezo-controlled mount (#16), and a customized 4-quadrant diode (4QD, #18) for the idler seed beam was implemented for active stabilization.

4. Frequency Measurement and Referencing

4.1. NesCOPO Frequency Locking by Wavemeter

In our previous experiments, frequency locking of the emitted NesCOPO radiation has been achieved with variations in the low MHz range over serval minutes [40]. However, these results were obtained by locking the signal frequency with a commercial wavemeter, which is prone to bias and can display frequency drifts if not calibrated regularly [55].
Using a similar approach with a commercial wavemeter for frequency measurement, preliminary locking tests of the PPLN NesCOPO specified in Table 2 were performed over durations of several minutes. The NesCOPO frequency was stabilized using a feedback loop by adjusting the M1 and M3 piezo voltages and using the pulse-to-pulse frequency measurement provided by a HighFinesse WS6 IR wavemeter as the locking error signal. To assess the frequency stability by a device independent of the feedback loop, the NesCOPO idler wave was sent to a PPKTP OPA and the generated signal wave was frequency-doubled in a second-harmonic setup to be measured with a HighFinesse WSU 10 wavemeter operating in the 1 µm range. Figure 15a shows the signal frequency recorded by the wavemeter used in the control loop, proving the capability of the NesCOPO for sub-MHz frequency locking over 10 s, which is in line with the requirements for space application. However, as Figure 15b indicates, the frequency stability measured by the second external wavemeter remains in the MHz range due to the relative measurement drift of the two wavemeters. Alternative solutions for frequency locking to a stable reference have thus to be investigated in order to meet the stringent frequency stability requirements for space applications.

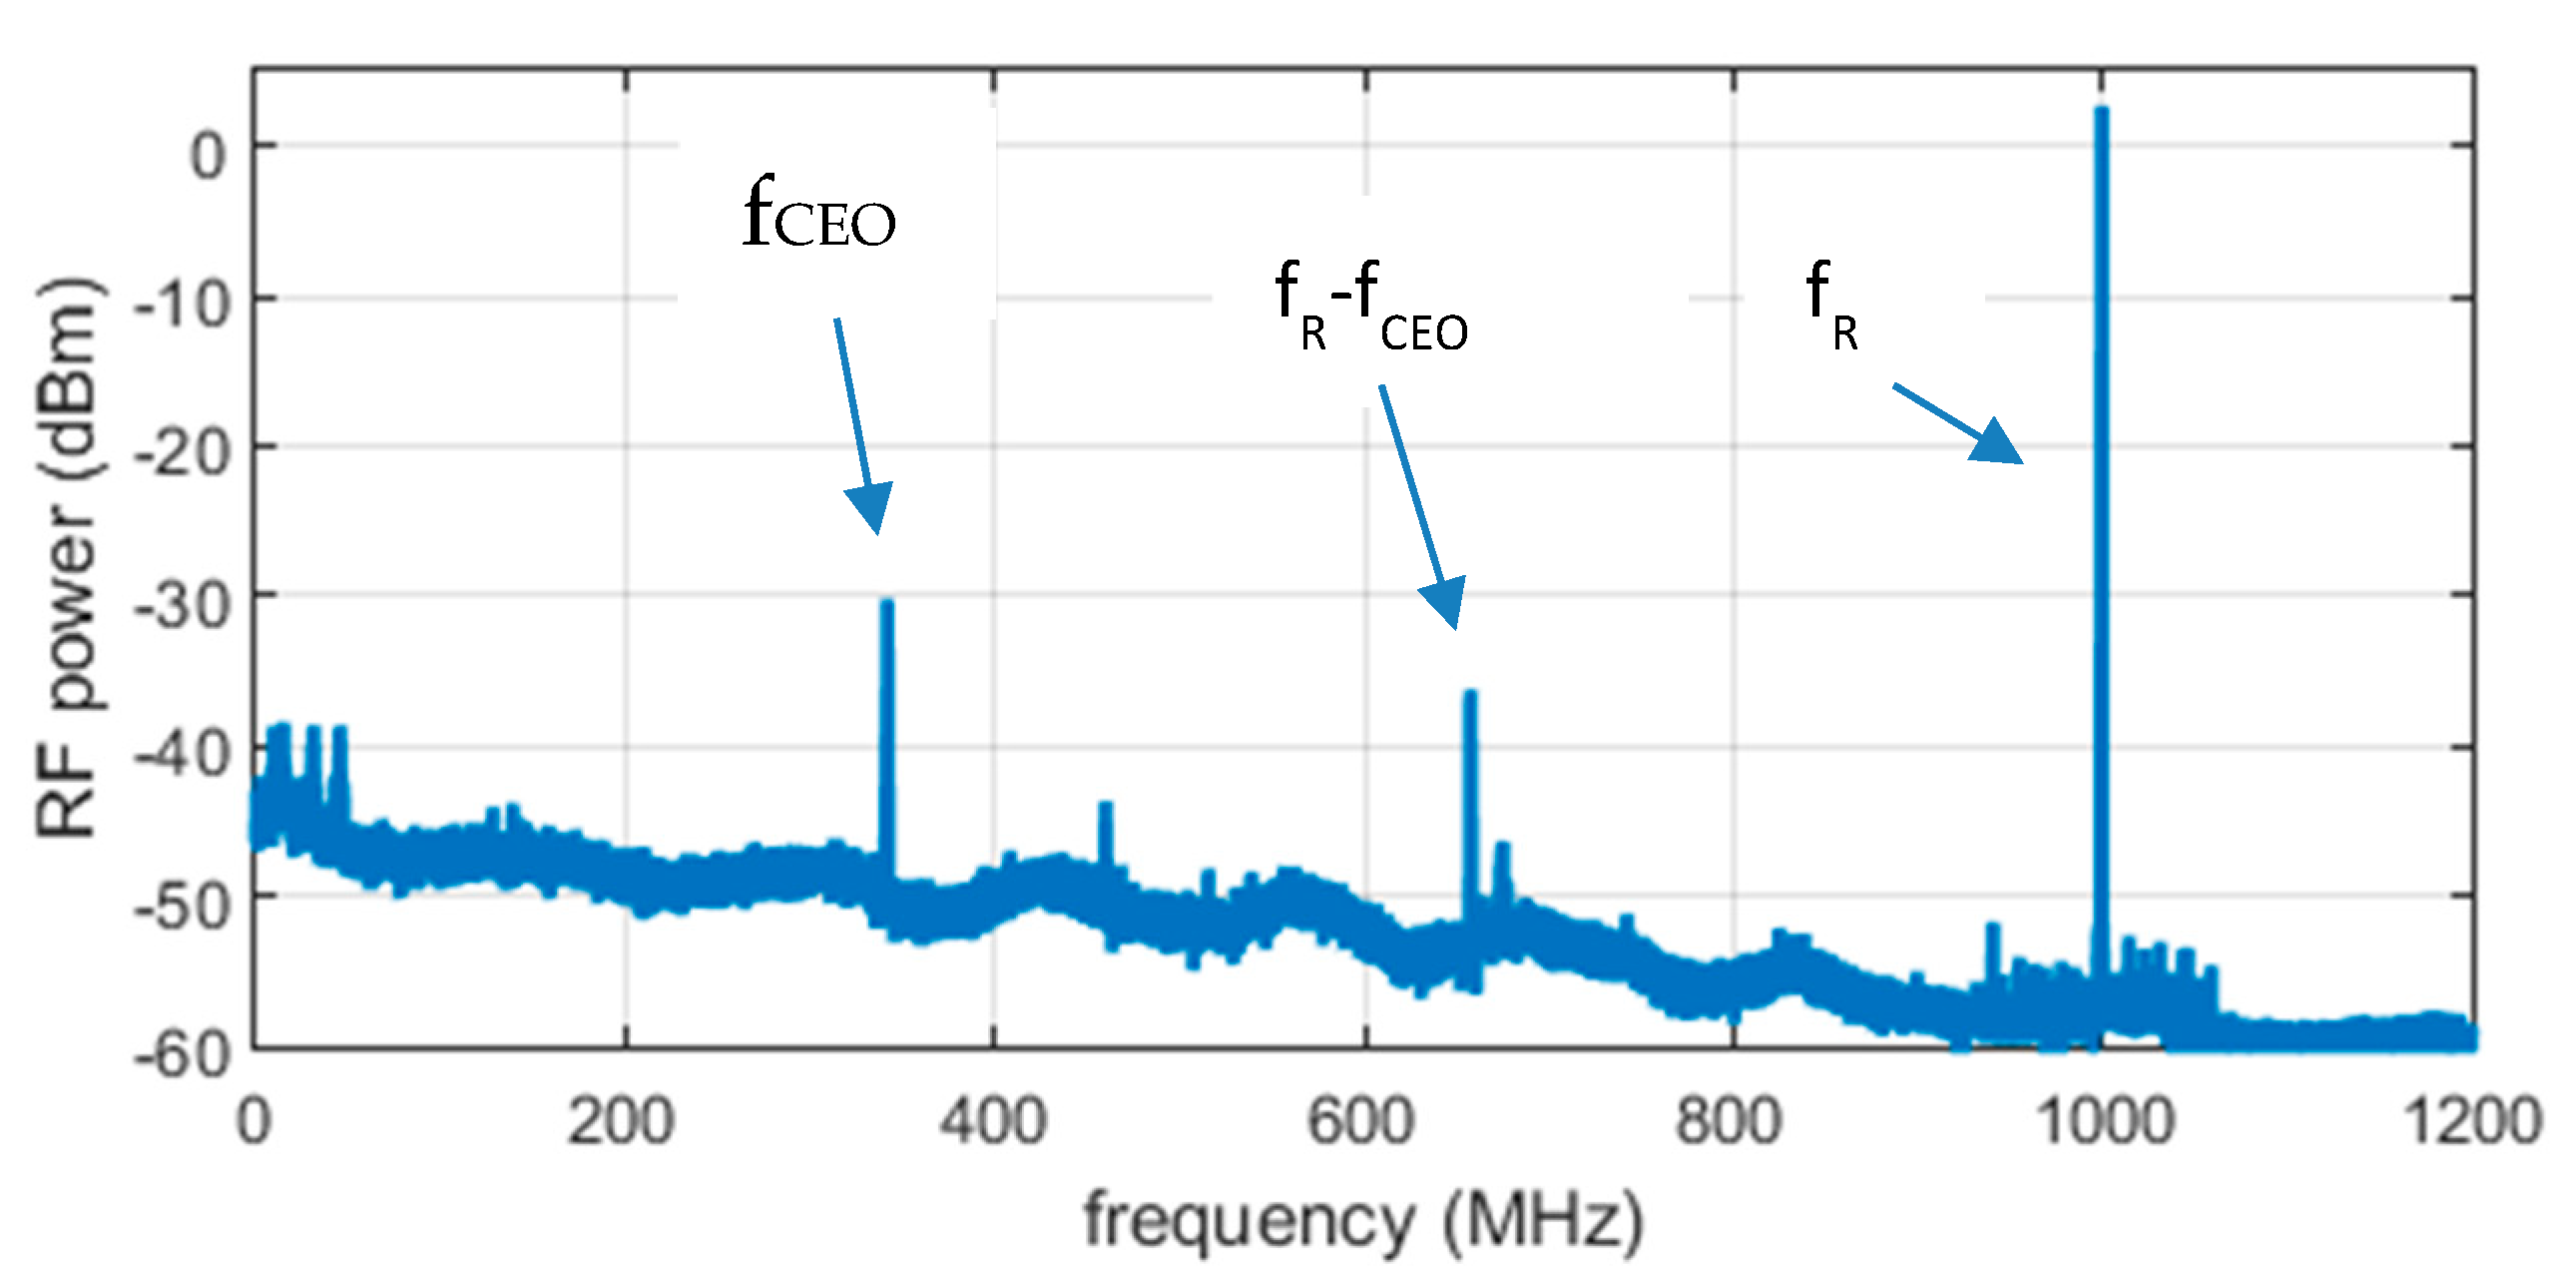
4.2. Frequency Reference Unit Based on Optical Frequency Comb

A typical approach for frequency referencing of a GHG DIAL instrument is to use an absorption gas cell with the same species as to be measured by the instrument. This allows for absolute calibration of the emitted wavelength but restricts the locking scheme to a narrow spectral band. In the context of the broad spectral range required by the multi-species LEMON instrument, we developed a solution based on an optical frequency comb to reference the laser transmitter wavelength and meet the stringent accuracy requirement (see Section 2.1). The frequency comb acts as a transfer oscillator to transfer the stability and accuracy of a GPS disciplined oscillator into the optical domain. For now, for more than 20 years, the concept of using frequency combs for bidirectional transfer between the radio-frequency and optical domains is well established [56], in particular in the scientific lab environment for atomic and optical clock comparisons [57]. Applications of frequency combs in the field and outside the lab [58,59], as well as their use as frequency references for lidar systems [60], have only started to emerge recently. Wavelength conversion or expansion is intrinsically required for stabilization of a comb using an f-2f interferometer. Due to ultra-short pulse duration and high peak powers associated with the mode-locked laser producing the frequency comb, nonlinear wavelength conversion in bulk, and more efficiently in fiber or waveguides is possible. Thinking towards a spaceborne system, the complexity should be reduced as much as possible. Therefore, we decided to investigate a system design without employing a transfer laser, measuring the laser transmitter pulses with heterodyne beat frequency detection directly with individual comb lines. This requires a wide-spaced frequency comb given the NesCOPO linewidth and free-spectral range. A femtosecond laser with a repetition rate of 1 GHz operating at a wavelength of 1.5 µm was chosen. The laser provides the performance allowing for frequency comb stabilization [61], the required large comb mode spacing, and it is constructed to withstand the loads associated with operation in an airplane. During the course of this development, we will also perform pre-qualification tests to validate the suitability of this laser for space.
When heterodyning an optical signal against one tooth of a frequency comb, the index number of the comb mode needs to be known in order to obtain an absolute frequency value. One method to determine this mode index is the use of a low resolution while also using a calibrated auxiliary wavemeter to make a coarse measurement of the wavelength of the optical signal. The resolution of this measurement needs to be better than the comb mode spacing or repetition rate of the frequency comb. Hereby, a frequency comb with a repetition rate in the GHz range is of benefit as well since it relaxes the resolution requirement of the wavemeter.
Figure 16 shows a schematic of the frequency reference unit (FRUIT) system. The output of the laser was amplified in an erbium-doped fiber amplifier (EDFA). After dispersion compensation, a supercontinuum (SC) spanning an octave and covering the lidar spectral range was generated. One part of the supercontinuum was split off for detecting the carrier-envelope offset frequency (fCEO) of the comb. Together with the repetition rate, after stabilization of the two degrees of freedom of the comb, the frequency of the comb modes was fixed and known. The second part of the supercontinuum was filtered and spatially and temporally overlapped with the light from the lidar transmitter. The 2 µm OPA pulses were frequency-doubled (SHG: second-harmonic generation) to shift the detection to 1 µm, enabling the use of standard silicon detectors. With a fast analog-to-digital converter (ADC), the heterodyne beat signal between comb mode and SHG pulses was sampled. Together with a low-resolution wavemeter measurement, the control unit can determine the absolute frequency of the SHG pulse. The obtained frequency value was used for lidar data analysis and for providing an error signal for active stabilization of the lidar transmitter.
The underlying functional operating principle of the FRUIT is depicted in more detail in Figure 17. The frequency of each mode of the frequency comb is determined by the two degrees of freedom of the comb: repetition rate and offset frequency. Knowledge of these two values allows calculating together with the integer mode index n the absolute optical frequency of each comb mode. With the transfer unit, a part of the comb spectrum was selected and heterodyned with the OPA pulse. A single frequency comb mode was isolated by suppressing neighboring modes with an optical filter. This leads to the interference of a quasi-continuous wave with the nanosecond SHG pulses. In the photo-detection process, low-pass filtering occurs and the result is a radio-frequency waveform representing the SHG pulse but with a center frequency determined by the distance between the center of the SHG spectrum and the closest frequency comb mode. This waveform can be sampled by a fast ADC with a sampling rate of 1 GHz. A subsequent Fourier transformation gives the center frequency of the waveform. Together with the values for the repetition rate and offset frequency of the frequency comb and the mode index n determined from a wavemeter measurement, this allows us to determine the absolute optical frequency of the SHG and thus the emitted OPA pulse from the heterodyne beat signal.
Figure 18 shows the stability requirements for the LEMON instrument. Due to the different integration path lengths for airborne and space operation of a DIAL instrument, the requirements of the two cases are different. By using a GPS-disciplined oscillator as the time base for comb stabilization and heterodyne beat sampling, the required stability and accuracy can be well reached.
Figure 19 shows the generated supercontinuum, the targeted absorption regions of the emitter, and the corresponding second-harmonic wavelengths. Using the octave spanning spectrum, the first implementation of measuring and stabilization of the offset frequency was successfully implemented. Together with the measurement and stabilization of the repetition rate, this gives us full control of the degrees of freedom of the frequency comb and absolute knowledge of the frequency comb modes.
A critical subunit with respect to environmental loads is the f-2f interferometer required for comb stabilization. The f-2f interferometer allows the determination of f CEO using a self-referencing scheme [62] and is implemented as shown in Figure 20. A portion of the infrared spectrum (around 2 µm) of the SC is frequency-doubled in a nonlinear crystal (BBO). Followed by a polarizing beam splitter, both f and 2f signals, located at the short-wavelength range of the spectrum (around 1 µm), are balanced in their intensities based on their polarization state. The heterodyne beat signal measured with a fast InGaAs photodiode (bandwidth greater than 1 GHz) results in f CEO and f R , see Figure 21. From the remaining horizontally polarized light, the spectral region around 1 µm is isolated by reflection from a dichroic mirror. Further spectral selection is achieved by a narrowband bandpass filter. The remaining light is coupled by a refractive collimator into fiber and sent towards the transfer unit to perform the actual metrology on the OPO pulses; compare Figure 17 and Figure 18. Concerning this matter, a coupling efficiency of over 50% is required. Therefore, the mechanical design has to withstand the vibrational and thermal environment of the aircraft.
The stabilization of the two degrees of freedom of the comb, repetition rate, and offset frequency was implemented as follows. On the fast photodiode in the f-2f setup, both repetition rate and offset frequency were measured. The two signals were separated using a suitable RF diplexer. The repetition rate signal was fed into a phase-locked loop where it was compared against a 1 GHz signal referenced to the GPSDO.
The error signal was sent to a digital PID controller and applied to two intra-cavity piezoelectric actuators to control the laser cavity length. The offset frequency signal was measured using a fast frequency counter, and low bandwidth feedback (<1 kHz) was applied to the laser via pump current modulation. Since the stability of the offset frequency is less critical than for the repetition rate, frequency stabilization is sufficient, and there was no need for a phase-locked loop (PLL). Figure 22 shows the first measurement results on the achieved comb stability, the projection on the expected optical stability at 1 µm and a comparison with the system requirements.
Implementation and test of the heterodyne beat detection unit, as well as the wavemeter in combination with the transfer unit, are currently ongoing. After final performance verification, and tests with the emitter, the FRUIT will be integrated into a 19 inch rack for airborne operation. The FRUIT will be relatively compact, with a volume of about 100 L and a weight of less than 40 kg. The power consumption of the system will be in the range of 200 W.

5. Conclusions

We have shown the optical design and preliminary tests of an original DIAL laser transmitter concept aiming at sounding CO2, water vapor, and its isotope HDO, and potentially CH4 in the 2 µm spectral range. The key design components and technological developments presented in this paper are the transmitter architecture and the optical frequency referencing method. The transmitter is a NesCOPO-based MOPA that converts high-energy pulses from a seeded Nd:YAG pump laser into the 2 µm spectral window where CO2 and water vapor display suitable absorption lines for concentration measurement from space with the IPDA method.
Simulations supported by preliminary validation experiments show that efficient parametric conversion can be obtained in the generated signal wave by optimization of the OPA stages through pump distribution and idler filtering. The presented design is enabled by recent progress in the fabrication of high-aperture PPKTP nonlinear crystals, which combine high nonlinear efficiencies and hardness suitable for high-fluence operation. From the current design status, supported by preliminary parametric amplification experiments, up to 40 mJ pulses are expected to be extracted within the signal beam at 2051 nm while preserving a beam quality factor M² <1.5 when pumped with a 200 mJ 1 µm laser. These energy levels are in line with spaceborne CO2 IP-DIAL measurement requirements and open the path for ground-based, range-resolved DIAL sounding of water vapor and its isotope HDO at 1982 nm.
Finally, we presented the prospected performances and current experimental developments for a generic frequency reference unit, well suited for largely tunable lasers, which is based on an innovative concept of beat note measurement between the laser transmitter output pulses and a longitudinal mode from a self-stabilized frequency comb referenced to a GPS-disciplined oscillator. With the current design and experimental progress, relative stabilities within the 10−11–10−12 range are expected to be transferred from the radio frequency domain to the optical frequency domain, which would correspond to optical frequency measurement precision for the wavelength better than a few 100 kHz over a few seconds integration time (in terms of Allan deviation), which will be used to stabilize the laser transmitter through feedback loop locking. Along with the possibility to adapt the concept to any wavelength in the range of the frequency comb spectrum, one benefit of the method is thus its compliance with the precision performance levels that are required for space application.
The next steps will consist of the mechanical realization and optical integration of the transmitter, along with its frequency reference. The coupling of this laser with a receiver based on a commercial photodiode will also be realized in order to improve our previous ground-based, range-resolved CO2 measurements. Simultaneous water vapor and CO2 mixing ratio measurements will be carried out. Integration of the instrument with the ATR42 aircraft from CNRS/Safire is envisioned to carry out airborne IPDIAL testing and validation of the instrument in such an environment as a step towards space-based operation.

Author Contributions

Conceptualization of the laser and parametric source and validation experiments: J.H., J.-B.D., J.-M.M., A.G., M.R., J.F.G., M.S., S.R., P.D., N.G., K.M.M., A.Z., V.P. Conceptualization of the instrument and measurement concept: J.H., J.-B.D., R.S., M.R., M.D., V.L., C.F. Conceptualization, implementation, validation experiments, and data analysis for Fruit: H.S., D.F., O.P., L.N., D.H. Writing—original draft preparation, M.R.; writing—review and editing, all authors. All authors have read and agreed to the published version of the manuscript.

Funding

This research has received funding from the European Union’s Horizon 2020 research and innovation program under grant agreement N° 821868, and from the French Agence Nationale pour la Recherche ANR under grant N° ANR-16-CE01-0009.

Institutional Review Board Statement

Not applicable.

Informed Consent Statement

Not applicable.

Data Availability Statement

Data sharing not applicable.

Conflicts of Interest

The authors declare no conflict of interest.

References

  1. Ehret, G.; Bousquet, P.; Pierangelo, C.; Alpers, M.; Millet, B.; Abshire, J.B.; Bovensmann, H.; Burrows, J.P.; Chevallier, F.; Ciais, P.; et al. MERLIN: A French-German Space Lidar Mission Dedicated to Atmospheric Methane. Remote Sens. 2017, 9, 1052. [Google Scholar] [CrossRef] [Green Version]
  2. ASCENDS Workshop Steering Committee. Active Sensing of CO2 Emissions over Nights, Days, and Seasons (ASCENDS) Mission. NASA Science Definition and Planning Workshop Report; University of Michigan: Ann Arbor, MI, USA, 2008. [Google Scholar]
  3. Ciais, P.; Crisp, D.; Van der Gon, H.D.; Engelen, R.; Janssens-Maenhout, G.; Heiman, M.; Rayner, P.; Scholze, M. Towards a European Operational Observing System to Monitor Fossil CO2 Emissions, Final Report from the Expert Group; European Commission: Brussels, Belgium, 2015. [Google Scholar]
  4. ESA. Report for Assessment, SP-1313/1. A-SCOPE—Advanced Space Carbon and Climate Observation of Planet Earth; ESA-ESTEC: Noordwijk, The Netherlands, 2008. [Google Scholar]
  5. Ehret, G.; Kiemle, C.; Wirth, M.; Amediek, A.; Fix, A.; Houweling, S. Space-borne remote sensing of CO2, CH4, and N2O by integrated path differential absorption lidar: A sensitivity analysis. Appl. Phys. B 2008, 90, 593–608. [Google Scholar] [CrossRef] [Green Version]
  6. Singh, U.N.; Refaat, T.F.; Ismail, S.; Davis, K.J.; Kawa, S.R.; Menzies, R.T.; Petros, M. Feasibility study of a space-based high pulse energy 2  μm CO2 IPDA lidar. Appl. Opt. 2017, 56, 6531–6547. [Google Scholar] [CrossRef] [PubMed]
  7. Fix, A.; Matthey, R.; Amediek, A.; Ehret, G.; Gruet, F.; Kiemle, C.; Klein, V.; Mileti, G.; Do Carmo, J.P.; Quatrevalet, M. Investigations on frequency and energy references for a space-borne integrated path differential absorption lidar. In Proceedings of the International Conference on Space Optics—ICSO 2014, Tenerife, Canary Islands, Spain, 6–10 October 2014; SPIE: Bellingham, WA, USA, 2017; Volume 10563, p. 105630A. [Google Scholar]
  8. Caron, J.; Durand, Y. Operating wavelengths optimization for a spaceborne lidar measuring atmospheric CO2. Appl. Opt. 2009, 48, 5413–5422. [Google Scholar] [CrossRef]
  9. Ambrico, P.F.; Amodeo, A.; Di Girolamo, P.; Spinelli, N. Sensitivity analysis of differential absorption lidar measurements in the mid-infrared region. Appl. Opt. 2000, 39, 6847–6865. [Google Scholar] [CrossRef] [PubMed]
  10. Menzies, R.T.; Tratt, D.M. Differential Laser absorption spectrometry for global profiling of tropospheric carbon dioxide: Selection of optimum sounding frequencies for high-precision measurements. Appl. Opt. 2003, 42, 6569–6577. [Google Scholar] [CrossRef]
  11. Bruneau, D.; Quaglia, P.; Flamant, C.; Meissonnier, M.; Pelon, J. Airborne lidar LEANDRE II for water vapour profiling in the troposphere. Appl. Opt. 2001, 40, 3450–3475. [Google Scholar] [CrossRef]
  12. Wirth, M.; Fix, A.; Mahnke, P.; Schwarzer, H.; Schrandt, F.; Ehret, G. The airborne multi-wavelength water vapor differential absorption lidar WALES: System design and performance. Appl. Phys. B 2009, 96, 201. [Google Scholar] [CrossRef] [Green Version]
  13. Kiemle, C.; Ehret, G.; Amediek, A.; Fix, A.; Quatrevalet, M.; Wirth, M. Potential of Spaceborne Lidar Measurements of Carbon Dioxide and Methane Emissions from Strong Point Sources. Remote Sens. 2017, 9, 1137. [Google Scholar] [CrossRef] [Green Version]
  14. Singh, U.N.; Petros, M.; Refaat, T.F.; Yu, J.; Ismail, S. Column carbon dioxide and water vapor measurements by an airborne triple-pulse integrated path differential absorption lidar—Novel lidar technologies and techniques with path to space. In Proceedings of the International Conference on Space Optics—ICSO 2016, Biarritz, France, 18–21 October 2016; SPIE: Bellingham, WA, USA, 2017; Volume 10562, p. 105621R. [Google Scholar]
  15. Wagner, G.; Plusquellic, D. Ground-based, integrated path differential absorption LIDAR measurement of CO2, CH4, and H2O near 1.6 μm. Appl. Opt. 2016, 55, 6292. [Google Scholar] [CrossRef]
  16. Refaat, T.F.; Ismail, S.; Koch, G.J.; Rubio, M.; Mack, T.L.; Notari, A.; Collins, J.E.; Lewis, J.; De Young, R.; Choi, Y.; et al. Backscatter 2 µm Lidar Validation for Atmospheric CO2 Differential Absorption Lidar Applications. IEEE Trans. Geosci. Remote Sens. 2011, 49, 572–580. [Google Scholar] [CrossRef]
  17. Refaat, T.; Singh, U.; Yu, J.; Petros, M.; Remus, R.; Ismail, S. Double-pulse 2-μm integrated path differential absorption lidar airborne validation for atmospheric carbon dioxide measurement. Appl. Opt. 2016, 55, 4232–4246. [Google Scholar] [CrossRef] [PubMed]
  18. Spiers, G.D.; Menzies, R.T.; Jacob, J.; Christensen, L.E.; Phillips, M.W.; Choi, Y.; Browell, E.V. Atmospheric CO2 measurements with a 2 μm airborne laser absorption spectrometer employing coherent detection. Appl. Opt. 2011, 50, 2098. [Google Scholar] [CrossRef]
  19. Abshire, J.B.; Riris, H.; Weaver, C.J.; Mao, J.; Allan, G.R.; Hasselbrack, W.E.; Browell, E.V. Airborne measurements of CO2 column absorption and range using a pulsed direct-detection integrated path differential absorption lidar. Appl. Opt. 2013, 52, 4446. [Google Scholar] [CrossRef] [PubMed]
  20. Numata, K.; Riris, H.; Li, S.; Wu, S.; Kawa, S.R.; Krainak, M.; Abshire, J.B. Ground demonstration of trace gas lidar based on optical parametric amplifier. J. Appl. Remote Sens. 2012, 6, 63561. [Google Scholar] [CrossRef]
  21. Riris, H.; Numata, K.; Wu, S.; Gonzalez, B.; Rodriguez, M.; Scott, S.; Kawa, S.; Mao, J. Methane optical density measurements with an integrated path differential absorption lidar from an airborne platform. J. Appl. Remote Sens. 2017, 11, 034001. [Google Scholar] [CrossRef] [PubMed] [Green Version]
  22. Amediek, A.; Fix, A.; Wirth, M.; Ehret, G. Development of an OPO system at 1.57 μm for integrated path DIAL measurement of atmospheric carbon dioxide. Appl. Phys. B 2008, 92, 295–302. [Google Scholar] [CrossRef] [Green Version]
  23. Uchiumi, M.; Vasa, N.J.; Fujiwara, M.; Yokoyama, S.; Maeda, M.; Uchino, O. Development of DIAL for CO2 and CH4 in the atmosphere. In Lidar Remote Sensing for Industry and Environment Monitoring III; Singh, U.N., Itabe, T., Liu, Z., Eds.; International Society for Optics and Photonics: Bellingham, WA, USA, 2003; Volume 4893, pp. 141–149. [Google Scholar]
  24. Ishii, S.; Mizutani, K.; Baron, P.; Iwai, H.; Oda, R.; Itabe, T.; Fukuoka, H.; Ishikawa, T.; Koyama, M.; Tanaka, T.; et al. Partial CO2 Column-Averaged Dry-Air Mixing Ratio from Measurements by Coherent 2-μm Differential Absorption and Wind Lidar with Laser Frequency Offset Locking. J. Atmos. Ocean. Technol. 2012, 29, 1169–1181. [Google Scholar] [CrossRef]
  25. Kameyama, S.; Imaki, M.; Hirano, Y.; Ueno, S.; Kawakami, S.; Sakaizawa, D.; Nakajima, M. Performance improvement and analysis of a 1.6 μm continuous-wave modulation laser absorption spectrometer system for CO2 sensing. Appl. Opt. 2011, 50, 1560. [Google Scholar] [CrossRef]
  26. Sakaizawa, D. Ground-based demonstration of a CO2 remote sensor using a 1.57 μm differential laser absorption spectrometer with direct detection. J. Appl. Remote Sens. 2010, 4, 43548. [Google Scholar] [CrossRef]
  27. Gibert, F.; Pellegrino, J.; Edouart, D.; Cénac, C.; Lombard, L.; Le Gouët, J.; Nuns, T.; Cosentino, A.; Spano, P.; Di Nepi, G. 2-μm double-pulse single-frequency Tm:fiber laser pumped Ho:YLF laser for a space-borne CO2 lidar. Appl. Opt. 2018, 57, 10370–10379. [Google Scholar] [CrossRef]
  28. Johnson, W.; Repasky, K.S.; Carlsten, J.L. Micropulse differential absorption lidar for identification of carbon sequestration site leakage. Appl. Opt. 2013, 52, 2994. [Google Scholar] [CrossRef]
  29. Barria, J.B.; Mammez, D.; Cadiou, E.; Dherbecourt, J.B.; Raybaut, M.; Schmid, T.; Bresson, A.; Melkonian, J.M.; Godard, A.; Pelon, J.; et al. Multispecies high-energy emitter for CO2, CH4, and H2O monitoring in the 2  μm range. Opt. Lett. 2014, 39, 6719–6722. [Google Scholar] [CrossRef]
  30. Cadiou, E.; Mammez, D.; Dherbecourt, J.B.; Gorju, G.; Pelon, J.; Melkonian, J.M.; Godard, A.; Raybaut, M. Atmospheric boundary layer CO2 remote sensing with a direct detection LIDAR instrument based on a widely tunable optical parametric source. Opt. Lett. 2017, 42, 4044–4047. [Google Scholar] [CrossRef] [PubMed]
  31. Cosentino, A.; D’Ottavi, A.; Bravetti, P.; Suetta, E. Spaceborne lasers development for ALADIN instrument on board ADM-Aeolus ESA mission. In Optical Systems Design 2015: Optical Design and Engineering VI; International Society for Optics and Photonics: Bellingham, WA, USA, 2015. [Google Scholar] [CrossRef]
  32. Hahn, S.; Bode, M.; Luttmann, J.; Hoffmann, D. FULAS: High energy laser source for future LIDAR applications. In Proceedings of the International Conference on Space Optics—ICSO 2018, Chania, Greece, 9–12 October 2018; SPIE: Bellingham, WA, USA, 2019; Volume 11180, p. 111805F. [Google Scholar] [CrossRef] [Green Version]
  33. Hamperl, J.; Capitaine, C.; Santagata, R.; Dherbecourt, J.B.; Melkonian, J.M.; Godard, A.; Raybaut, M.; Régalia, L.; Grouiez, B.; Blouzon, F.; et al. WaVIL: A Differential Absorption LIDAR for Water Vapor and Isotope HDO Observation in the Lower Troposphere—Instrument Design. In Optical Sensors and Sensing Congress, OSA Technical Digest; Optical Society of America: Washington, DC, USA, 2020; paper LM4A.4. [Google Scholar]
  34. Galewsky, J.; Steen-Larsen, H.C.; Field, R.D.; Worden, J.; Risi, C.; Schneider, M. Stable isotopes in atmospheric water vapor and applications to the hydrologic cycle. Rev. Geophys. 2016, 54, 809–865. [Google Scholar] [CrossRef] [PubMed]
  35. EU H2020 LEMON Project. Lidar Emitter and Multispecies Greenhouse Gases Observation Instrument. Available online: https://lemon-dial-project.eu/ (accessed on 1 January 2020).
  36. Dumas, A.; Rothman, J.; Gibert, F.; Édouart, D.; Lasfargues, G.; Cénac, C.; Le Mounier, F.; Pellegrino, J.; Zanatta, J.; Bardoux, A.; et al. Evaluation of a HgCdTe e-APD based detector for 2  μm CO2 DIAL application. Appl. Opt. 2017, 56, 7577–7585. [Google Scholar] [CrossRef] [PubMed]
  37. Sun, X.; Abshire, J.B.; Beck, J.D.; Mitra, P.; Reiff, K.; Yang, G. HgCdTe avalanche photodiode detectors for airborne and spaceborne lidar at infrared wavelengths. Opt. Express 2017, 25, 16589–16602. [Google Scholar] [CrossRef]
  38. Beck, J.; Welch, T.; Mitra, P.; Reiff, K.; Sun, X.; Abshire, J. A highly sensitive multi-element HgCdTe e-APD detector for IPDA lidar applications. J. Electron. Mater. 2014, 43, 2970–2977. [Google Scholar] [CrossRef]
  39. Tan, C.H.; Velichko, A.; Lim, L.W.; Ng, J.S. Few-photon detection using InAs avalanche photodiodes. Opt. Express 2019, 27, 5835–5842. [Google Scholar] [CrossRef] [PubMed]
  40. Godard, A.; Raybaut, M.; Lefebvre, M. Nested Cavity Optical Parametric Oscillators—A Tunable Frequency Synthesizer for Gas Sensing. In Encyclopedia of Analytical Chemistry; Meyers, R.A., Ed.; Wiley: Hoboken, NJ, USA, 2017. [Google Scholar] [CrossRef]
  41. Kabacinski, A.; Armougom, J.; Melkonian, J.-M.; Raybaut, M.; Dherbecourt, J.-B.; Godard, A.; Vasilyeu, R.; Smirnov, V. Wavelength tunable, single-longitudinal-mode optical parametric oscillator with a transversally chirped volume Bragg grating. Opt. Lett. 2020, 45, 607–610. [Google Scholar] [CrossRef] [PubMed]
  42. Wester, R. Physical optics methods for laser and nonlinear optics simulations. Adv. Opt. Technol. 2013, 2, 247–255. [Google Scholar] [CrossRef]
  43. Zukauskas, A.; Thilmann, N.; Pasiskevicius, V.; Laurell, F.; Canalias, C. 5 mm thick periodically poled Rb-doped KTP for high energy optical parametric frequency conversion. Opt. Mater. Express 2011, 1, 201–206. [Google Scholar] [CrossRef]
  44. Stoeppler, G.; Thilmann, N.; Pasiskevicius, V.; Zukauskas, A.; Canalias, C.; Eichhorn, M. Tunable Mid-infrared ZnGeP2 RISTRA OPO pumped by periodically-poled Rb:KTP optical parametric master-oscillator power amplifier. Opt. Express 2012, 20, 4509–4517. [Google Scholar] [CrossRef] [Green Version]
  45. Melkonian, J.-M.; Armougom, J.; Raybaut, M.; Dherbecourt, J.-B.; Gorju, G.; Cézard, N.; Godard, A.; Pasiskevicius, V.; Coetzee, R.; Kadlčák, J. Use of long-wave infrared multiwavelength optical source for standoff detection of chemical warfare agents. Appl. Opt. 2020. [Google Scholar] [CrossRef]
  46. Coetzee, R.S.; Duzellier, S.; Dherbecourt, J.B.; Zukauskas, A.; Raybaut, M.; Pasiskevicius, V. Gamma irradiation-induced absorption in single-domain and periodically-poled KTiOPO4 and Rb:KTiOPO4. Opt. Mater. Express 2017, 7, 4138. [Google Scholar] [CrossRef] [Green Version]
  47. Coetzee, R.S.; Thilmann, N.; Zukauskas, A.; Canalias, C.; Pasiskevicius, V. Nanosecond laser induced damage thresholds in KTiOPO4 and Rb:KTiOPO4 at 1 µm and 2 µm. Opt. Mater. Express 2015, 5, 2090–2095. [Google Scholar] [CrossRef] [Green Version]
  48. Bach, F.; Mero, M.; Pasiskevicius, V.; Zukauskas, A.; Petrov, V. High Repetition Rate, Femtosecond and Picosecond Laser Induced Damage Thresholds of Rb:KTiOPO4 at 1.03 µm. Opt. Mater. Express 2017, 7, 744–750. [Google Scholar] [CrossRef]
  49. Fradkin, K.; Arie, A.; Skliar, A.; Rosenman, G. Tunable midinfrared source by difference frequency generation in bulk periodically poled KTH. Appl. Phys. Lett. 1999, 74, 914. [Google Scholar] [CrossRef] [Green Version]
  50. Emanueli, S.; Arie, A. Temperature-dependent dispersion equations for KTiOPO4 and KTiOAsO4. Appl. Opt. 2003, 42, 6661. [Google Scholar] [CrossRef]
  51. Brosnan, S.; Byer, R. Optical parametric oscillator threshold and linewidth studies. IEEE J. Quantum Electron. 1979, 15, 415. [Google Scholar] [CrossRef]
  52. Arisholm, G.; Nordseth, Ø.; Rustad, G. Optical parametric master oscillator and power amplifier for efficient conversion of high-energy pulses with high beam quality. Opt. Express 2004, 12, 4189–4197. [Google Scholar] [CrossRef] [PubMed]
  53. Vanherzeele, H.; Bierlein, J.D. Magnitude of the nonlinear-optical coefficients of KTiOPO4. Opt. Lett. 1992, 17, 982. [Google Scholar] [CrossRef] [PubMed]
  54. Elsen, F.; Livrozet, M.; Strotkamp, M.; Wüppen, J.; Jungbluth, B.; Kasemann, R.; Löhring, J.; Meissner, A.; Meyer, R.; Hoffmann, H.; et al. Demonstration of a 100-mJ OPO/OPA for future lidar applications and laser-induced damage threshold testing of optical components for MERLIN. Opt. Eng. 2017, 57, 021205. [Google Scholar] [CrossRef] [Green Version]
  55. Verlinde, M.; Dockx, K.; Geldhof, S. On the performance of wavelength meters: Part 1—Consequences for medium-to-high-resolution laser spectroscopy. Appl. Phys. B 2020, 126, 85. [Google Scholar] [CrossRef]
  56. Fortier, T.; Baumann, E. 20 years of developments in optical frequency comb technology and applications. Commun. Phys. 2019, 2, 153. [Google Scholar] [CrossRef]
  57. Hollberg., L.; Diddams, S.; Bartels, A.; Fortier T., K.K. The Measurement of Optical Frequencies. Metrologia 2005, 42, S105. [Google Scholar] [CrossRef]
  58. Coburn, S. Regional trace-gas source attribution using a field-deployed dual frequency comb spectrometer. Optica 2018, 5, 320–327. [Google Scholar] [CrossRef]
  59. Ycas, G.G.; Quinlan, F.; Diddams, S.A.; Osterman, S.; Mahadevan, S.; Redman, S.; Terrien, R.; Ramsey, L.; Bender, C.F.; Botzer, B.; et al. Demonstration of on-sky calibration of astronomical spectra using a 25 GHz near-IR laser frequency comb. Opt. Express 2012, 20, 6631–6643. [Google Scholar] [CrossRef] [Green Version]
  60. Lezius, M.; Wilken, T.; Deutsch, C.; Giunta, M.; Mandel, O.; Thaller, A.; Schkolnik, V.; Schiemangk, M.; Dinkelaker, A.; Kohfeldt, A.; et al. Space-borne frequency comb metrology. Optica 2016, 3, 1381–1387. [Google Scholar] [CrossRef]
  61. Lind, A.J. Frequency-stabilized 1 GHz turnkey frequency comb. In Proceedings of the Laser Congress 2019 (ASSL, LAC, LS&C), Vienna, Austria, 29 September–3 October 2019; Optical Society of America: Washington, DC, USA, 2019. paper JTh3A.51. [Google Scholar]
  62. Telle, H.R. Carrier-envelope offset phase control: A novel concept for absolute optical frequency measurements and ultrashort pulse generation. Appl. Phys. B 1999, 69, 327. [Google Scholar] [CrossRef]
Figure 1. Optical depth for a vertical line of sight in the lowest 6 km of the atmosphere in the 2.05 µm range for CO2 sounding (a) and the 1.98 µm range for H2O/HDO sounding (b). US Standard Atmosphere with 370 ppmv of CO2, 8500 ppmv of water vapor (at ground level, HDO relative abundance of 0.03%). Dashed lines indicate on-line wavelengths for DIAL measurement—calculations based on-line parameters from HITRAN 2016 database.
Atmosphere 12 00402 g001
Figure 2. Schematic setup of the LEMON instrument architecture. Housing 1 with Nd:YAG pump laser (1.06 µm) in master-oscillator power amplifier (MOPA) configuration and two nested-cavity optical parametric oscillators (NesCOPO) for wavelength generation around 2.05 µm and 1.98 µm. Housing 2 contains two periodically poled Potassium Titanyle Phosphate crystals (PPKTP) amplification stages and a delay line to compensate for the pulse build-up time in the NesCOPOs. PBS: polarizing beam splitter, OSC: master oscillator, AMP: amplifier, SHG: second harmonic generation, FRU: frequency reference unit. LEMON: Lidar Emitter and Multispecies greenhouse gases Observation.
Atmosphere 12 00402 g002
Figure 3. Schematic of the pump laser system (housing 1; the size of the monolithic head 40 × 57 cm²).
Atmosphere 12 00402 g003
Figure 4. NesCOPO doubly resonant configuration and principle of operation for single-frequency emission (signal and idler cavity lengths differ by a few percent, allowing only a single pair of signal and idler cavity modes to overlap and respect the energy conservation relation (ωp = ωs + ωi)).
Atmosphere 12 00402 g004
Figure 5. Measurement and simulation results of the idler output pulse energy of the NesCOPO in dependency of the incident pump power.
Atmosphere 12 00402 g005
Figure 6. The calculated output pulse shape of the NesCOPO at the signal (blue) and idler (red) wavelength. The shaded areas denote the respective full width at half maximum (FWHM) pulse durations.
Atmosphere 12 00402 g006
Figure 7. Calculated output idler pulse energy of the NesCOPO in dependency of spatial pump beam displacement. The given angles denote a tilt between the pump beam and the NesCOPO’s optical axis. Results with mirror radii of 800 mm are reported in (a). Results with mirror radii of 500 mm are reported in (b), experimental results with 500 mm mirror radii are reported in (c).
Atmosphere 12 00402 g007
Figure 8. The calculated gain spectra in 10 mm PPKTP with 38.75 µm period at temperatures of 53 °C (solid black line) and 78 °C (red line). The Dotted lines indicate the target spectral ranges.
Atmosphere 12 00402 g008
Figure 9. Microphotographs of c+ (a) and c- (b) polar surfaces in 5 mm thick PPKTP. The selective chemical etching was used to reveal a ferroelectric domain structure with 38.75 µm periodicity.
Atmosphere 12 00402 g009
Figure 10. Signal and idler wavelengths as a function of temperature in the OPO comprising PPKTP with 38.75 µm periodicity. Measured peak wavelength (solid points), idler wavelength determined from Manley–Rowe relations (crosses), and calculation (red line). Horizontal lines determine the target spectral ranges. Error bars demarcate the FWHM of the measured spectra.
Atmosphere 12 00402 g010
Figure 11. Map of the effective nonlinearity deff across the aperture of the PPKTP crystal.
Atmosphere 12 00402 g011
Figure 12. Measurement and simulation results of the signal output pulse energy of an OPA stage in dependency of the incident pump power.
Atmosphere 12 00402 g012
Figure 13. Calculated output pulse energy (left) and beam quality factor (right) after the second OPA stage in dependency of crystal lengths between 5 and 15 mm for an idler seeded OPA. The first stage consists of two 12 mm long crystals and the idler wavelength is coupled out in between all four crystals.
Atmosphere 12 00402 g013
Figure 14. Scheme of the OPA setup with beam-shaping, delay-line, monitoring, and two OPA stages with two crystals each within the housing with a footprint of 400 × 400 mm2 (dashed lines: idler beam as seeder, solid lines: pump and signal beam).
Atmosphere 12 00402 g014
Figure 15. NesCOPO preliminary frequency locking experiments: (a) the wavelength measured by the wavemeter used in the control loop; (b) the measurement using an independent wavemeter.
Atmosphere 12 00402 g015
Figure 16. Schematic of the frequency reference unit (FRUIT).
Atmosphere 12 00402 g016
Figure 17. Functional operating principle of the FRUIT.
Atmosphere 12 00402 g017
Figure 18. Stability requirements (Allan deviation, ADEV) for the LEMON airborne instrument and future spaceborne instruments together with typical stability performance of Global Positioning System (GPS) and a GPS-disciplined oven-controlled quartz crystal oscillator (OCXO).
Atmosphere 12 00402 g018
Figure 19. Laser spectrum together with spectrum after fiber amplifier and supercontinuum generated in a nonlinear fiber. In addition, the relevant absorption bands for the molecules are shown together with the interrogation wavelengths generated by the emitter.
Atmosphere 12 00402 g019
Figure 20. Schematic setup of the f-2f interferometer.
Atmosphere 12 00402 g020
Figure 21. Radio frequency (RF) spectrum of the photodiode signal of the f-2f interferometer showing the carrier-envelope offset frequency (fCEO) and repetition rate fR signals used for stabilization.
Atmosphere 12 00402 g021
Figure 22. Frequency measurement (a) and stability of the stabilized repetition rate (b), frequency measurement of the offset frequency (c), and its stability (d). Combined frequency behavior of an optical comb mode at a wavelength of 1 µm (e) and achieved stability in comparison with performance requirements (f).
Atmosphere 12 00402 g022
Table 1. Laser transmitter specifications from [4,7] for spaceborne measurement, estimated using a 1.2 m diameter telescope, an optical filter bandwidth of 1 nm, a receiver transmittance of 0.64, a pulse pair repetition rate of 50 Hz, a detector noise equivalent power of 100 fW/√Hz, an integration time of 160 ns, and a spacecraft altitude of 350 km.
ParameterRequirements from Literature and Previous StudiesObjectives for This Study
ON and OFF frequenciesFor CO2 from [4]
ON: 4875.59 cm−1
OFF: 4875.386 cm−1
3 cm−1 tunability around line center at:
-
4875.59 cm−1 for CO2
-
5045.41 cm−1 for HDO/H2O
Output energy Baseline 55 mJ for λON, threshold > 30 mJ [4]40 mJ baseline; 30 mJ threshold (taking into account progress in APD technology)
λON stability: goal for spaceFor CO2 from [7]:
λON Allan deviation goal better than 0.2 MHz (threshold 1 MHz) RMS over 100 s. Long term drift goal better than 0.1 MHz (threshold 0.5 MHz)
-
Same values
-
Extended to all spectral windows with broadband FRU concept
λON frequency purity: goal for space 99.93% [4]Experimental verification
Table 2. Test NesCOPO parameters (RoC: Radius of Curvature).
ParameterValue
Reflectivity M1 (idler) 0.8
RoC M1500 mm
Reflectivity M2 (signal)0.98
Reflectivity M3 (idler)0.99
RoC M3500 mm
Reflectivity M3 (signal)0.99
Reflectivity M3 (pump)0.99
Pump beam 1/e2 diameter460 μm
Distance M1-M22 mm
Distance M3 – Crystal output facet0.5 mm
Crystal/lengthPPLN/10 mm
Table 3. Parameters that were adjusted in the simulation to best fit the experimental results.
ParameterExperimentSimulation
Reflectivity M1 (idler)0.8–0.90.78
Reflectivity M2 (signal)0.98–0.990.98
Reflectivity M3 (idler)0.990.98
Reflectivity M3 (signal)0.990.96
Reflectivity M3 (pump)0.991
Beam diameter (pump)460 μm480 μm
Table 4. Optimization parameters and possible values of the NesCOPO, the underlined parameters correspond to the best configuration (optimized output pulse energy).
ParameterValues
Crystal typePPKTP/PPLN
Crystal length in mm10/13
Pump beam radius in mm0.25/0.35
RoC M1 in mm500/800
RoC M3 in mm500/800
Table 5. Applied simulation values to best fit the experimental results.
ParameterNominal ValueSimulation Value
d e f f   [ pm V ] 9.3 (Ref. [54])5.5 = deff/1.69
Losses at crystal facesn.a.3% λ
Seed energy [µJ]10 to 20 11
Publisher’s Note: MDPI stays neutral with regard to jurisdictional claims in published maps and institutional affiliations.

