Article

Annual NO2 as a Predictor of Hourly NO2 Variability: Do Defra UK’s Heuristics Make Sense?

Centre for Health Services Studies, The University of Kent, Canterbury, Kent CT2 7NF, UK
*
Author to whom correspondence should be addressed.
These authors contributed equally to this work.
Atmosphere 2021, 12(3), 385; https://doi.org/10.3390/atmos12030385
Submission received: 22 February 2021 / Revised: 10 March 2021 / Accepted: 14 March 2021 / Published: 16 March 2021
(This article belongs to the Section Air Quality and Human Health)

Abstract

:
Background: In the UK an hourly objective exists for NO2 concentrations and assessment against this objective is required for various administrative purposes. The vast majority of NO2 measurement in the UK is non-hourly however. Thus, Defra guidance provides a heuristic to estimate hourly objective exceedance likelihood from an annual average. Methods: We examine the performance of this heuristic using a Europe wide dataset containing over 20,000 site-years of data, and perform a sensitivity test to account for data uncertainty. Results: The heuristic misses 64% of sites that break the hourly objective. The heuristic is neither a necessary nor sufficient condition for predicting hourly objective breaches. The sensitivity test reveals that the heuristic is input-fragile. Conclusions: The heuristic performs poorly, is weakly coupled to medical evidence, and work is needed to develop new short term exposure limits for NO2.

1. Introduction

For the purpose of protecting human health, the UK has established objective limits against which key pollutants are measured.
There are two objective limits in force for NO2: an annual mean of 40 μ g / m 3 and an hourly mean of 200 μ g / m 3 not to be exceeded more than 18 times per year [1].
In addition to applying nationally as legal thresholds via the 2008 ambient air quality directive [2] against which the UK government can and has been held to account as in the ClientEarth judgement [3], the limits are applicable to devolved regional authorities who must monitor for and react to exceedances within the Local Air Quality Management (LAQM) framework [4].
The LAQM policy framework determines how devolved authorities must: monitor for exceedances, declare Air Quality Management Areas (AQMAs) upon detection of exceedances, and devise Air Quality Action Plans (AQAPs) to redress detected
There are currently 734 AQMAs declared in the UK [5], 599 of these (81.6%) are for the NO2 annual objective. 36 (4.9%) are for both the NO2 annual and NO2 hourly objective, and 1 is for the NO2 hourly objective alone. How NO2 is measured and reported is clearly therefore important for local authority compliance to objective limits.
Local authorities are referred to a policy guidance document published by the UK government’s Department for Environment, Food, and Rural Affairs (Defra) [4].
This policy guidance document [4] is married to a technical guidance document (LAQM.TG(16)) [6] also published by Defra which sets out in detail how air quality should be monitored, modeled, appraised, and reported in order to comply with the policies.
The redress of air quality exceedances translates practically to changes in transport and land use, and the UK government issues planning guidance to this end in the form of the National Planning Policy Framework (NPPF) [7] which directs local and regional authorities to:
“sustain and contribute towards compliance with relevant limit values or national objectives for pollutants, taking into account the presence of Air Quality Management Areas and Clean Air Zones, and the cumulative impacts from individual sites in local areas”
(para 181, [7])
The NPPF also states that planning decisions in AQMAs should be consistent with local AQAPs. The NPPF augments regional and local authority land use planning documents, for example the 2016 London Plan [8] states that development proposals should:
“minimise increased exposure to existing poor air quality and make provision to address local problems of air quality (particularly within Air Quality Management Areas (AQMAs) and where development is likely to be used by large numbers of those particularly vulnerable to poor air quality, such as children or older people)“
(Policy 7.14 “Improving Air Quality” [8])
When it comes to the issue of deciding planning applications, air quality is thus a direct material consideration and local authorities look to their own land use plans, the NPPF, and the LAQM framework for authority in this regard.
Not all planning applications will have a significant impact on air quality, but those screened by the local authority as likely to will require an accompanying Environmental Impact Assessment (EIA) in the form of an Environmental Statement (ES) in accord with The Town and Country Planning Regulations 2017 [9].
In such cases the ES will contain a section on air quality, and will be guided by the same technical guidance LAQM.TG(16) that the local authority is itself accustomed to. It will contain an air quality appraisal referring to objective limit values for key pollutants, and in the case of NO2 both the annual and hourly limits should be assessed where a likelihood of exceedance is judged.
Typically, this means that the applicant will estimate the current and operational year NO2 at a number of key receptors (i.e locations), with and without the development in order to appraise the likely impact of the development on future NO2 values.
Future values are estimated by a complicated modeling process which we have previously shown to be flawed on a number of significant fronts [10] and like any modeling process, the outputs are only as good as the inputs. In the case of air quality modeling, it is typical for a developer to calibrate their model against air quality data obtained from the relevant local authority.
Unfortunately, due to the expense and operational complexity of continuous automatic monitoring stations, the majority of local authority data for NO2 is derived from NO2 diffusion tubes which are classified by Defra as an “indicative” monitoring technique, and are usually exposed monthly in accord with LAQM.TG(16) guidance [6], thus limiting the accuracy and temporal resolution of measurement significantly.
Even where continuous data is available from a Defra certified monitoring technique, it is unlikely to be situated exactly where the modeled receptors are located, thus the purpose of modeling is to extrapolate across both time and space.
Since the dominant source of air pollution in UK urban areas is traffic [11], modeling is performed by computationally dispersing pollutants from line sources that represent roads and the outputs are calibrated against a baseline year for which actual data is available. Future vehicular emissions estimates and other factors are used to predict future values of pollutants as an extrapolation from the baseline model (see [10] for a detailed explanation of the modeling process).
Contemporary dispersion modeling software such as ADMS-Roads [12] and R-line [13], although capable of time-varying emission and weather profiles as inputs, for traffic sources are invariably executed based on the assumption of continuous emissions from line sources and thus do not predict time-varying pollutant outputs. The output is instead a static integral of any time-varying inputs that represents convergence of the model. This is supported by Defra’s LAQM.TG(16) [6] which states in para 7.90 that:
“Dispersion models cannot predict short-term concentrations as reliably as annual mean concentrations. Moreover model verification is likely to be challenging.”.
Which brings us to the crux of this work: how then does an Environmental Statement in a planning application (or a local authority assessing the application) assess NO2 against hourly objective limits if no such hourly outputs are monitored or modelled?
The answer is that a heuristic based on predicted annual mean values is promoted by Defra, as specified in paragraph 7.91 of the LAQM.TG(16) guidance [6]:
“Previous research carried out on behalf of Defra and the Devolved Administrations identified that exceedances of the NO2 1-h mean are unlikely to occur where the annual mean is below 60 μg / m 3 . This assumption is still considered valid; therefore local authorities should refer to it if NO2 1-h mean monitoring data are not available (typically if monitoring NO2 using passive diffusion tubes).”
Note that they are referring to the 1-h mean objective here, which is more than 18 exceedances of the 1-h mean. This is applied according to the paragraph on page 5–3 which states:
“For diffusion tube monitoring, it can be considered that exceedances of the NO2 1-h objective may occur at roadside sites if the annual mean is above 60 μg / m 3
In the context of planning applications this interpretation is used.
This heuristic derives from a single non-peer-reviewed report [14] prepared by Air Quality Consultants for Defra and published in 2003 which looked at the relationship between annual mean NO2 and hourly objective limit exceedances.
Almost 20 years on at the time of this work’s publication, the concluding remarks of the report, in referring to the heuristic advice, could not be more prescient “It would clearly be sensible to re-evaluate the monitoring data from time to time to confirm that this remains appropriate advice”.
In this paper we do just that and examine whether the heuristic derived from that work, which found its way through Defra’s technical guidance into decision making, was ever sensible and whether it still holds today in the face of vastly more accumulated data against which to judge it.
In the next section we critically examine the original heuristic study and assess whether it was ever fit-for-purpose and follow this by looking at all Defra’s AURN data and all EU member state data published by the EU in order to re-appraise the relationship using contemporary data.

2. Results

2.1. Evaluation of the Original Heuristic Study

The heuristic derived from (hereafter referred to as the heuristic study) is as follows: any location reporting or modeling an annual mean 60 μ g / m 3 or above is considered “likely” to see more than 18 exceedances of the hourly limit of 200 μ g / m 3 in a year. Conversely, any location with an annual mean below 60 μ g / m 3 is considered “unlikely” to.
We need to understand what the heuristic study means by “likely” and “unlikely” in order to understand how the heuristic was derived and what it actually means.
The heuristic study refers to paragraph 1.13 of LAQM.TG(03) [15] which says the point of air quality appraisal is to “identify with reasonable certainty whether or not a likely exceedance will occur”. This provides the context for the word “likely”. The heuristic study goes on to state in paragraph 4.1 that “Likely is taken to be a 50% chance of the exceedance occurring”. The latter appears to be their own construction as we could find no reference to such a 50% threshold in any of the citations of their report, yet they attribute it to LAQM.TG(03) in two later figures in the report.
The heuristic study offers another interpretation of what “likely” and “unlikely” mean, referring, seemingly arbitrarily, to a 2003 Basingstoke and Deane Council Air Quality Review [16]. After some analysis for establishing confidence intervals for some air quality predictions it makes the authors of the last decide that “unlikely” means a 5–20% chance of an exceedance, and “likely” means a 80–95% chance of an exceedance.
No justification for rejecting this latter interpretation is given, and no justification is provided as to why an inflexion point at 50% is a reasonable way to categorise the probability of events into “likely” and “unlikely”. Given margins for error, points around the inflexion point are going to be more or less equally “likely” and “unlikely” according to this definition so these adjectives have limited descriptive power and could be very misleading in the context of planning where non-experts are making decisions. Event likelihoods of 0% upto 50% are conflated under the same label “unlikely”.
So it is that the heuristic study uses 50% likelihood as a definition for the adjective “likely” and conversely, anything below 50% as the definition for “unlikely”. We can now examine the study to see how it arrives at the NO2 threshold of 60 μ g / m 3 as a proxy for the hourly NO2 objective.
The heuristic begins with a dataset containing 159 continuous monitoring sites with data between 1980 and 2001. This is then restricted to kerbside and roadside sites under justification taken from LAQM.TG(03) [15] that the 1-h objective applies in “busy streets where people may spend an hour or more close to traffic”) and another Defra document [17] from 2004 which refers to “the pavement of a street where people might regularly spend up to an hour, for instance a street with pavement cafes.” (Box 1.2, page 20). It is interesting to note that admits that this is guidance rather than legislation and that “this text still leaves the relevant locations at which to apply the objectives open to interpretation”. (Box 1.2, page 20).
Eliminating the remaining sites using this argument is flawed because people may regularly spend time near non-roadside and non-kerbside monitoring locations depending on exactly where they are situated. Furthermore the heuristic is applied routinely in contemporary planning applications to analyse all locations regardless of whether they are roadside or kerbside.
Thus the number of monitoring sites entering the critical part of the analysis is reduced from 159 to 68 and the corresponding date range is reduced to between 1996 and 2001 as before 1996 there was only a single roadside/kerbside site.
These 68 sites are divided further into roadside and kerbside sets. A given site might have multiple years of recorded values, so data is presented in the form of site-years. For example, if a single site has three years of data then they consider this to be three data points against which to compare hourly peaks against annual means and thus three site-years.
The heuristic study then plots for each site-year the corresponding quantized mean annual NO2 against the number of exceedances of the “no more than 18 times hourly 200 μ g / m 3 ” objective for that year. This is done for the roadside and kerbside sites separately, and the mean annual NO2 is quantized into four and nine mean NO2 intervals respectively. The intervals are determined so that a minimum of five data points falls in each band.
This quantization allows for examination of a given band such that a comparison can be made between the number of hourly limit breaches for that band and the total number of data points in that band, thus allowing an estimate of the frequency (which they equate to likelihood) of the hourly objective being breached for a given annual mean interval.
None of the roadside site intervals have more than 50% of the sites exceeding the hourly objective so this dataset is essentially discarded. In the kerbside sites the 65–75 μ g / m 3 band and the >75 μ g / m 3 band both have more than 50% of the sites exceeding the hourly objective. And thus the authors derive a 65 μ g / m 3 threshold for the heuristic which they round-down to 60 μ g / m 3 , presumably to allow for a margin of error.
The kerbside dataset from which this figure is derived contains only 24 site-years. Another table in the report lists all the sites with and without exceedances from which we can count that this comes from only 8 distinct sites over a period totalling 5 years.
Any actual relationship between annual mean NO2 and the 1-h objective is obscured here because the analysis first of all uses a very small dataset, it then quantizes annual mean NO2 into four bands losing even more information, and then applies a discontinuous binary criteria to establish the significance of the relationship, throwing away any remaining nuance.
The essentially arbitrary determination of significance attached to the adjective “likely” as defined by the heuristic study has been informing decision making, decision making that directly affects public health, for the last 20 years.
In the next section we examine the relationship between annual mean NO2 and hourly NO2 objective exceedances using all of the NO2 data available from every AURN site between 1973 to 2019, a period of 46 years.

2.2. Analysis Using Defra AURN Sites

Defra runs the Automatic Urban and Rural Network (AURN) in the UK which is a network of 171 automatic air quality monitoring stations [18]. Of these, 159 measure NO2 hourly. Of these 14 are classified as Rural Background, 4 as Suburban Background, 2 as Suburban Industrial, 63 as Urban Background, 9 as Urban Industrial, and 67 as Urban Traffic.
We chose to restrict our analysis for the UK to this dataset because AURN sites only use MCERTS certified measurement techniques [19], produce data trusted by Defra, trusted by the policy instruments, and are maintained to good standard. NO2 is measured by chemiluminescence in the AURN.
We adopt the data-completeness criterion of [20] of 75%. This reflects the behaviour of local authorities since Defra only advocates annualisation of data when the 75% threshold is not met, and with regard to the 1-h average for NO2 states that: “The 1 h average will only be valid if there was at least 75% data capture” (para 7.212 LAQM.TG(16) [6]).
Defra’s Urban Traffic category most closely matches that used in the study described in the last section, however the heuristic is applied in land-use planning regardless of receptor location. It makes sense therefore to consider all site types in this evaluation with the exception of industrial sites since these might be subject to unusual patterns of emission that are not relevant for typical land-use planning.
With this consideration there are 1611 site-years of data between 1996 and 2019 that meet the data capture criteria. Figure 1 plots the mean annual NO2 for each site-year datapoint against the number of hours where NO2 was greater than 200 μ g / m 3 for that datapoint.
The data shows that each quadrant formed by the bisecting lines at 18 h and 60 μ g / m 3 has points in it, which demonstrates that the heuristic is neither a necessary nor a sufficient condition for an hourly limit breach. The quadrant data is summarised in Table 1.
Across the entire AURN data set, for all site-types, 12 out of 143 sites (8.4%) have one or more year where the hourly objective is exceeded. Five of these sites (41.7% of the hourly objective breakers) have an annual mean less than 60 μ g / m 3 (false negatives for the heuristic) for at least one year.
Analysis was performed for various data subsets to examine how many objective breaking sites did not fulfil the heuristic criteria. The results of this are shown in Table 2.
Only urban site types contained objective breaking sites with the proportion of objective breakers being larger for Urban Traffic sites than Urban Background sites. This is accounted for by the mean annual NO2 for Urban Traffic sites being higher than for Urban Background sites.

Sensitivity Test

Defra has well defined procedures for data assurance and quality control [21] for the AURN, and thereby the data used in this section. Data is required to be consistent with EU directives 2008/50/EC [2] and 2004/107/EC [22] (as transcribed into UK law) for accuracy. For NO2 this is defined as 15% at the objective limit: within 6 μ g / m 3 for the annual limit of 40 μ g / m 3 .
Defra tested AURN equipment for compliance with the directives in [21] for four different types of NOx analyser used and obtained accuracies between 10% and 14%. Although tested for NOx the report points out that “the quoted uncertainties apply to measurements of NO2 (page 88, para 2).
It is reasonable therefore, as a sensitivity test, to examine the heuristic for the NO2 hourly objective in the context of the uncertainty bounds of the input data. When considering this uncertainty The Precautionary Principle compels us to be biased towards the cases where there is risk of harm to life.
We can ask the question therefore, what would happen if a given site was underestimating NO2 by 15%, or the equivalent question for all sites, when the hourly limit is reduced from 200 μ g / m 3 by 15% to 170 μ g / m 3 . The results of this sensitivity test are shown in Table 3.
In this worst case sensitivity analysis, 29 sites exceeded the sensitivity test hourly objective (more than 18 h >170 μ g / m 3 , and 21 of these (72% of the hourly objective breakers) did not meet the heuristic criterion for an annual average of 60 μ g / m 3 . The lowest mean NO2 that broke the sensitivity test hourly objective was 30.9 μ g / m 3 which is more than 20% less than the annual mean objective for NO2.
In the next section we extend the analysis to cover data obtained from the EU.

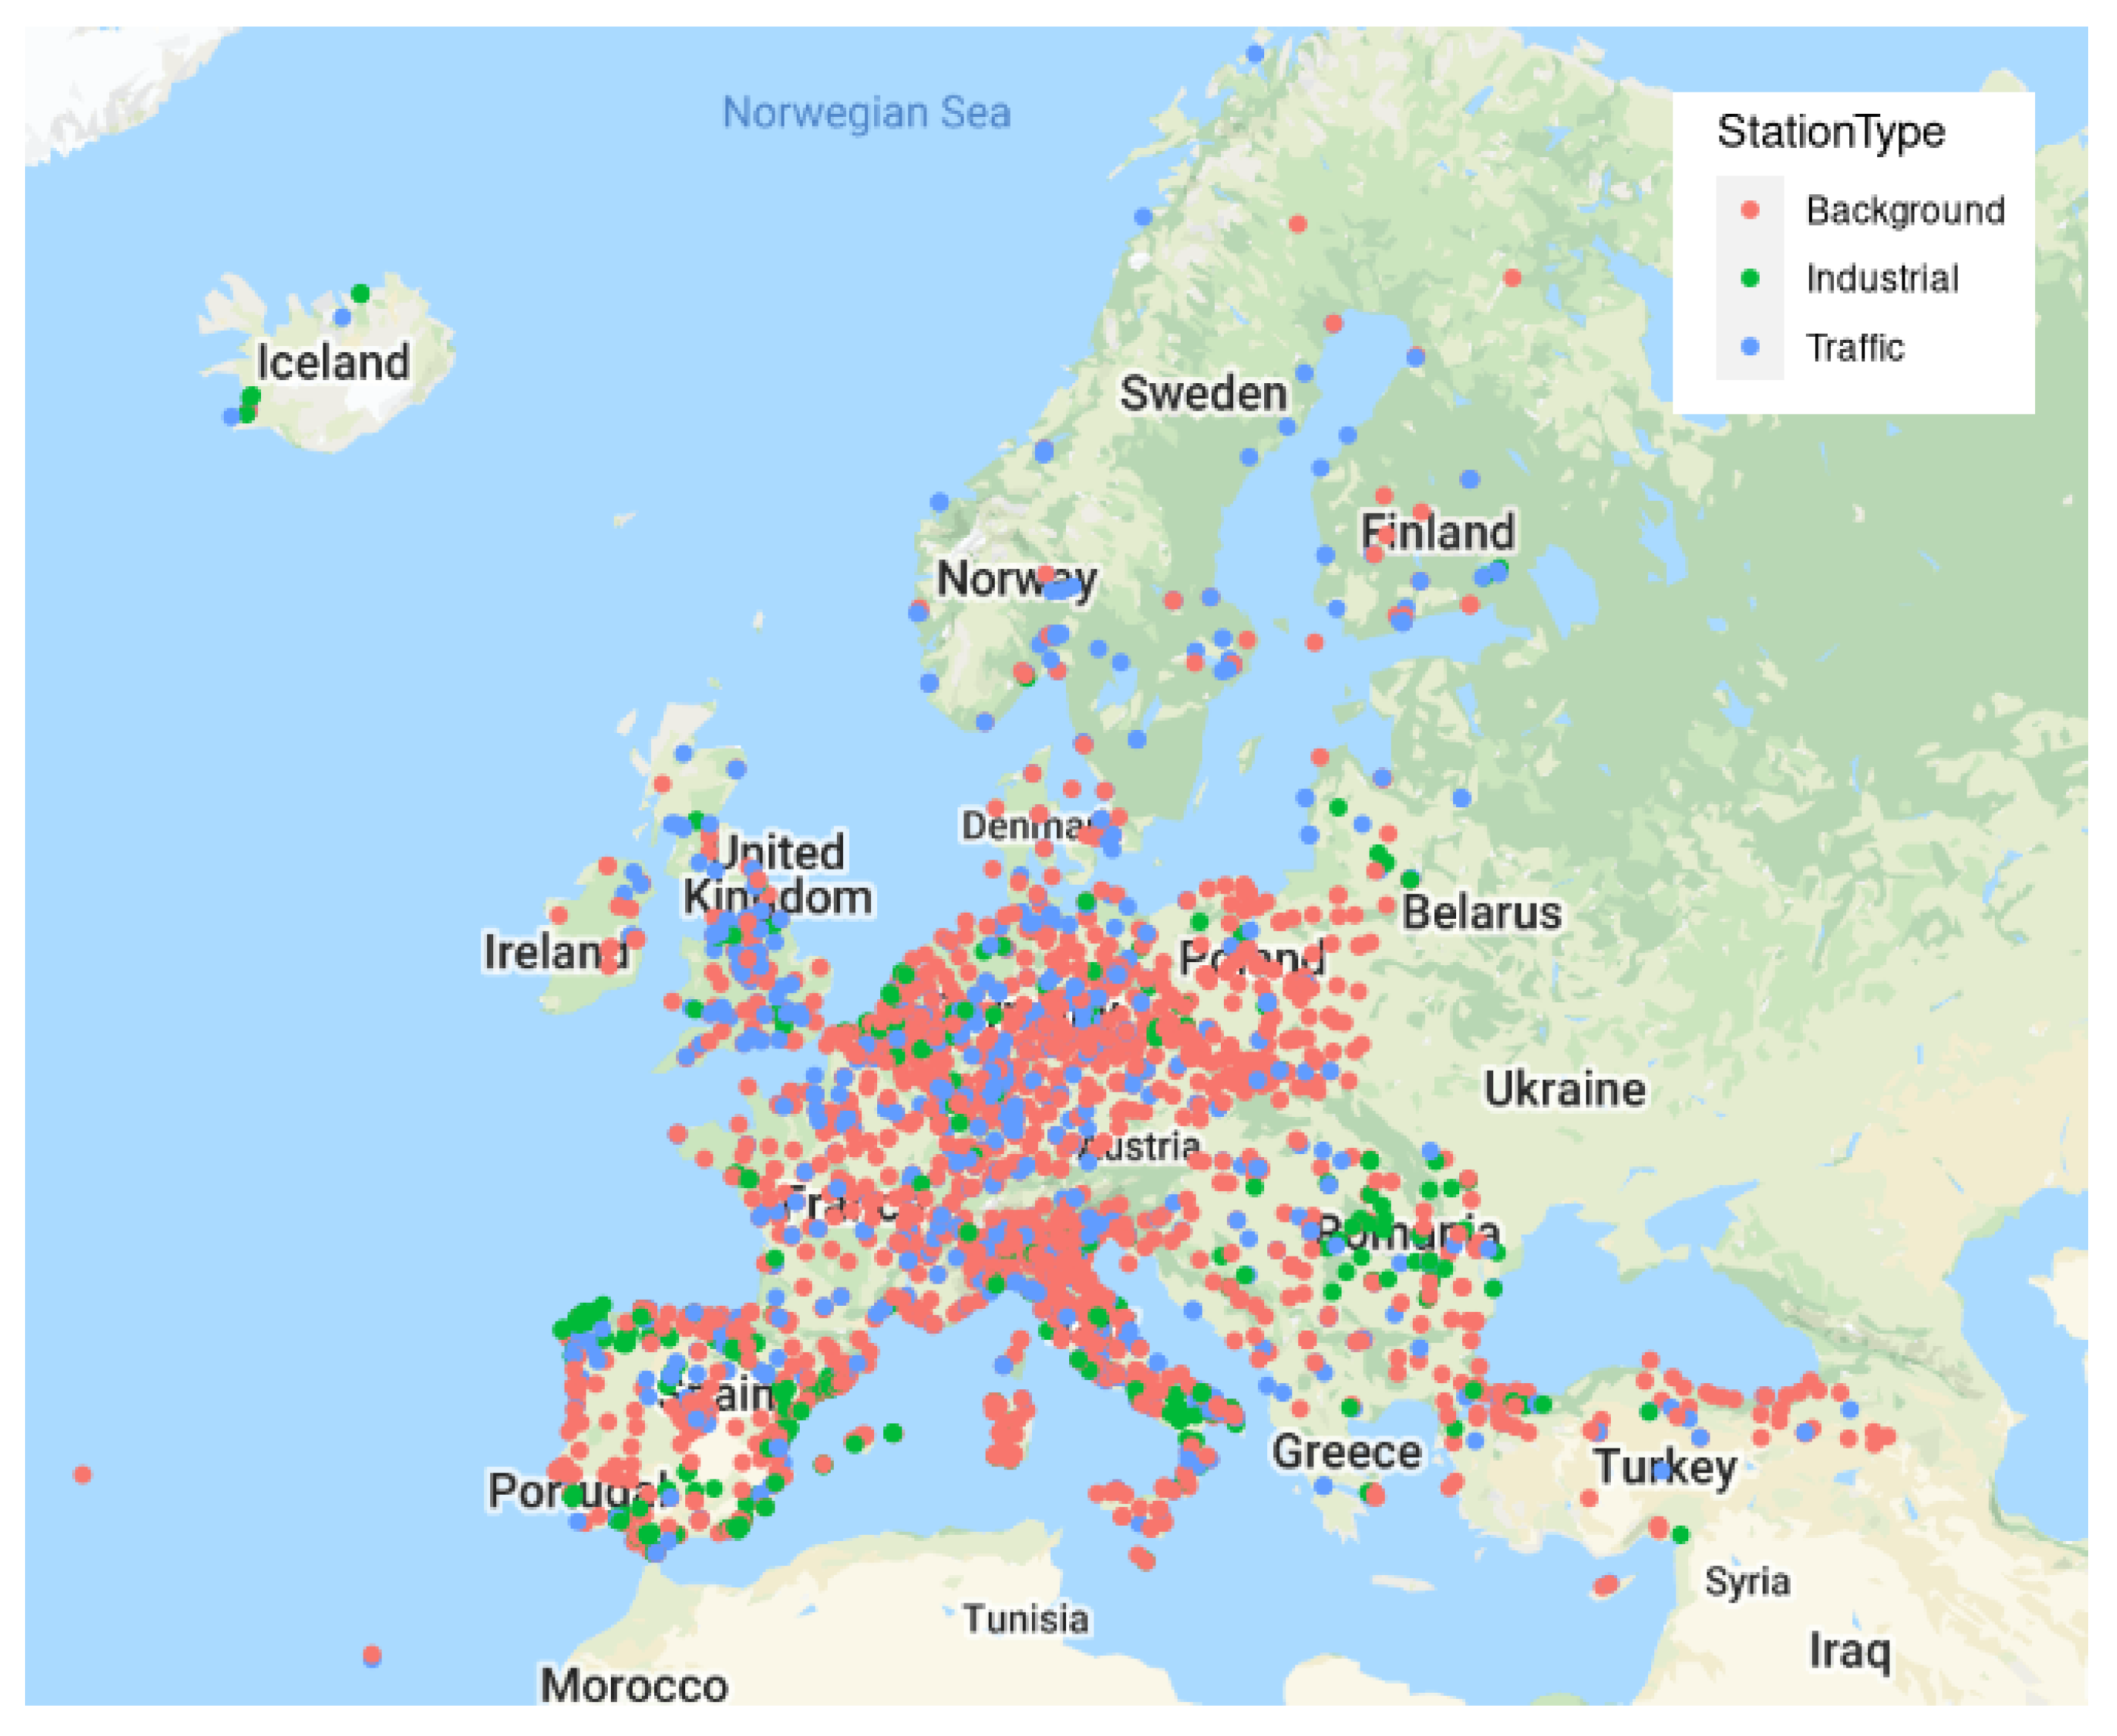
2.3. EU-Wide Dataset

The EU amalgamates annual time series air quality data from EU member states and cooperating non-EU countries and provides a web interface to access this data [23]. The analysis in this section is presented for the entire obtainable dataset (some files were missing from the webserver) comprising 22,408 site-years measuring NO2 from 4250 unique site-ids between 2013 and 2019. Of these, 20,603 site-years met the data capture criteria (>75%), distributed across 3692 site-ids. Note that 18 site-ids in the database have duplicate associated lat/lon locations (9 unique lat/lon pairs), and 196 do not have metadata listed at all.
After removing these NA data, Figure 2 shows the site locations classified as background (1747 sites), industrial (455 sites), and traffic (857 sites). Site locations are shown coloured by site category.
Analysis was performed, as in the last section, to examine the relationship between the 1-h mean objective and the annual mean measurement. The summary statistics from this analysis Examining just the Traffic sites, the summary statistics are shown in Table 4.
There are 48 sites (4.6% of all EU traffic sites) having at least one year with more than 18 exceedances of 200 μ g / m 3 hourly objective. 25 of these (52%) sites have years in which the annual mean was below 60 μ g / m 3 with the lowest being 23.57 μ g / m 3 which is almost half the annual mean target of 40 μ g / m 3 .
Finally, we performed the analysis for EU “Background” sites. Out of 2122 background sites, 36 (1.6% of all background sites) had more than 18 exceedances of 200 μ g / m 3 hourly objective. 29 of these (80.6% of the violating sites) had annual means lower than 60 μ g / m 3 . The lowest annual mean for a violating site was 12.6 μ g / m 3 , and the average annual mean for violators was 42.56 μ g / m 3 with a SD of 13.8 μ g / m 3 .
Analysis was performed for various data subsets to examine how many objective breaking sites did not fulfil the heuristic criteria. The results of this are shown in Table 5.
For the EU dataset, only two industrial sites are objective breakers, and only one of these is a heuristic breaker. This dataset is too small to make inferences from. It is also the case that industrial sites are modelled differently to traffic sites and Defra provides separate screening criteria for them (Table 7.3 [6]). Defra makes specific reference to the 60 μ g / m 3 heuristic in the context of industrial sites and states that “this relationship is not considered to be applicable in instances where industrial emissions impact on air quality” (Para 7.91 [6]).
Thus, whilst we have included industrial sites in the tables above for data-completeness, in the discussion that follows we have excluded industrial sites from consideration of our arguments since they are not considered representative.

3. Discussion

The data clearly shows that there is a problem of measurement, classification and application when it comes to NO2.
We can observe that in general a small percentage of sites breach the hourly objective (>18 exceedances of 200 μ g / m 3 ). Taking the larger EU dataset (without industrial sites) as representative, this is around 2.7% of all sites. A larger proportion of traffic sites (4.7% of traffic sites) breach the hourly objective than non-traffic sites. This trend was also seen for the Defra dataset.
Non-traffic sites that are hourly objective breakers are more likely to also be heuristic breakers (80.6%) when compared to traffic sites (52.1%), despite on average having lower annual means as a category (17.5 μ g / m 3 ) than traffic sites (33.8 μ g / m 3 ).
Using the EU dataset (without industrial sites) as a proxy for the effectiveness of the heuristic as it is generally applied, then we can say that it misses 64.3% of hourly objective breakers.
Although only a relatively small percentage of traffic sites breach the hourly objective (4.7%), in the context of a planning application which could have tens of modeled receptors, this is significant. If a planning application had 22 traffic receptors spread across a variety of roads and conditions, we might expect one of those to be an objective breaker, with a roughly 50% chance of meeting, or not meeting the heuristic criteria. It seems highly likely then the heuristic is doing a disservice as a predictor of hourly breaches across the thousands of planning applications that are considered per year.
There are 635 AQMAs in force for the annual NO2 limit, the majority of which are assessed using NO2 diffusion tubes, and NO2 measurement using diffusion tubes occurs in all local authority air quality assessments.
If this analysis was expertly understood by the Planning Committee of a Council at the point of decision making, the air quality aspects of planning applications could be appraised in a balanced manner. However, Planning Committee members are not usually air quality experts, and may or may not be numerically fluent. Furthermore, when Planning Committees rely on expert advice, this also refers to the heuristic discussed here.
In practice therefore, rather than serving as informative and nuanced information, the heuristic discussed here, establishes a hard threshold upon which decisions inflect.
To give an example, in Goodmayes, Redbridge, London, a proposal [24] to build 1360 residences and a primary school, contained this reference to hourly NO2 in the Environmental Statement [25] when presenting the dispersion modeling results:
“The Guidance states that authorities may assume exceedances of the hourly mean objective are only likely to occur where annual mean concentrations are 60 μ g / m 3 or above. Therefore, it is considered highly unlikely that this objective will be exceeded at any of the receptors.”
Thus, even though the data in the original heuristic study contained examples of objective breaches with values under 60 μ g / m 3 , after being transcribed into guidance, the guidance ends up being interpreted by the above developer as an absolute with the qualifiers “only likely” and “highly unlikely” being used.

3.1. The Need for a New Exposure-Based Limit

Given the performance of the heuristic threshold demonstrated in this paper, it might be argued that a new heuristic threshold should be derived, using the same or a different methodology. We argue here against this as follows.
The data shows that the annual mean does not contain enough information to reliably predict the hourly mean variation, and a heuristic based on annual mean alone is not going to be sufficient. Even if a combination of site characteristics and the annual mean were capable of predicting the hourly objective with a low error, the sensitivity test we performed for the Defra site demonstrates that threshold based objectives are fragile in the face of equipment with large measurement uncertainties.
Furthermore, this numerical gerrymandering distracts from the goal of the objectives as established, namely: to protect human health.
So it is that we return to this concept and can ask on what evidence was the 200 μ g / m 3 hourly limit, not to be exceeded more than 18 times, established?
The earliest reference we could find establishing the origin of the current limits is from UK’s LAQM technical guidance from 2003 [15] where it says on page 6-1:
“The air quality standard for nitrogen dioxide ... is based upon the advice of EPAQS (Expert Panel on Air Quality Standards). ... The limit values are derived from the WHO air quality guidelines.”
The WHO air quality guidance for NO2 obtained its current form in 1996 [26], and although the original documents are no longer available, justification for the choice is summarised in the WHO’s 2000 update [27]. At the time the guidelines were made, the WHO admits (p. 178 [27]) that:
“there is no evidence for a clearly defined concentration–response relationship for nitrogen dioxide exposure.”
They go on to say that:
“Given the small changes in lung function (< 5% drop in FEV1 between air and nitrogen dioxide exposure) and changes in airway responsiveness reported in several studies, 375–565 μg / m 3 (0.20–0.30 ppm) is a clear lowest-observed-effect level. A 50% margin of safety is proposed”
And then on p. 179:
“On the basis of these human clinical data, a 1-h guideline of 200 μg / m 3 is proposed.”
Unfortunately there is serious lack of contemporary research that directly addresses the issue of short-term exposure and health, but we will make an argument for its importance here.
There are many studies looking at associations between mortality and mean annual NO2 exposure. Examining a recent meta-analysis looking at associations between NO2 and mortality [28], the majority of the 41 studies showed positive associations, relative risk increases were quantifiable per 10 μ g / m 3 , and pollutant ranges contained inputs below annual objectives. In a 2018 Public Health England review [29] of the long-term health effects of NO2 they state that long-term mortality associations have been found in:
“cohorts in which the range of outdoor levels reaches as low as 5 μg / m 3 annual average NO2 concentration.”
It seems clear that there is a dose-response for negative outcomes for NO2 at the annual measurement level, and that this dose-response occurs below objective limits for NO2.
Daily variation also matters: a meta analysis of 204 time-series studies [30] found associations between 24h NO2 and daily mortality and hospital admissions for a variety of morbidity and age groups. A study looking at 18 french cities [31] found that relative risk increases for NO2 at lags of 0–1 days and greater risks associated with cumulative exposures over 0–5 days.
At even shorter timescales one study that looked at children walking to school [32] estimated that children obtained 20% of their black carbon daily dose (according to U.S EPA regulations) over a time period that accounted for only 6% of the day.
To give a specific example, with which these statements resonate, consider the case of Ella Kissi-Debra. Ella Kissi-Debrah was a 9 year old girl with a rare form of severe asthma who died after acute respiratory failure on 15 February 2013, with “Air pollution exposure” listed as a medical cause of death [33]. This conclusion was reached following a coroners inquiry and is believed to be the first time air pollution has been recorded as a cause of death in the UK.
The inquiry noted that “The principal source of her exposure was traffic emissions” [33]. Ella lived approximately 25m from a busy arterial road in London and the inquiry noted that she often walked to school along this road.
Ella was admitted to hospital 27 times between 2010 and 2013. Examining the air quality status reports from the Lewisham local authority [34], the nearest continuous anaylser (Lewisham 1, Catford) had annual means of 55, 51, and 50 μ g / m 3 in the years 2010, 2011, and 2012 respectively. The number of hours that exceeded 200 μ g / m 3 in each of those respective years were 1, 0 and 2. In the years 2010 and 2011 a diffusion tube was placed outside Holbeach school where Ella was a pupil. The mean annual values for 2010 and 2011 were recorded as 32 and 28 μ g / m 3 respectively [35].
We do not know if the annual mean at the door to Ella’s home exceeded the annual objective limit for NO2, or what the pollution levels inside her home were like. We do know that the average background value given by Defra for the two map grids spanning the area were 27 and 28 μ g / m 3 respectively in 2011 [36]. Residential addresses are specifically included as locations where “Objectives should apply” for annual objectives, and “Kerbside sites (as opposed to locations at the building façade), or any other location where public exposure is expected to be short term.” are specifically recommended against applying for annual objectives (”Objectives should generally not apply“) [6].
Despite living 25m away from the main traffic source of pollution, despite the school diffusion tubes never exceeding the national objective of 40 μ g / m 3 , and despite the nearest continous analyser never having exceeded more than 18 h in excess of 200 μ g / m 3 in a single year, cumulative and episodic exposure ultimately contributed to the Ella’s death. In the inquiry, Ella’s hospital admissions were shown to be directly correlated with spikes in measured air pollution.
To summarise this material: (i) daily changes in NO2 can impact health (ii) roadside exposure can contribute disproportionately to an individual’s cumulative daily dose (iii) air pollution exposure has been recorded as a cause of death in the UK. We need therefore to understand the nature of exposure.
The problem is complicated in that traffic emissions are a mixture of pollutants, not just NO2, and we cannot attribute Ella’s death to NO2 alone, nor any other pollutant alone. It isn’t just that apportioning health effects to the relevant mixture components is not currently possible, but that individual mixture components can synergistically compound. In a comprehensive EU report on mixture toxicity [37] the contracted authors pose the question (page 6, subheading):
Is there not sufficient protection against mixture effects if we make sure that each chemical is present individually at exposures unlikely to pose risks?
And conclude that (page 7, para 2):
there is decisive evidence that mixtures composed of chemicals with diverse modes of action also exhibit mixture effects when each component is present at doses equal to, or below points of departure.
We need to be able to answer questions such as: if a person is exposed to a certain mix of pollutants for 2 h at medium levels how does that compare to being exposed to the same pollutants for 1 h at much higher levels? How about a mixture A containing certain relative concentrations in comparison to another mixture B containing different relative concentrations? In other words, what is the relationship between short term exposure, pollution mix, cumulative dose, and health outcomes?
We hope this argument serves to illustrate the absurdity of using an annual-mean based heuristic to estimate short-term exposure risk, that is both technically insufficient, and which lacks a strong medical foundation. In the section that follows we offer a proposal, describing the next steps that the UK government should take to addressing the problems outlined in this report.

3.2. Proposals to Move Forward

Complete electrification of transport and heating in the coming decades will eliminate the vast majority of pyrogenic airborne pollution in populated areas attributable to anthropogenic sources [38].
In the interim period however, the trend of 40,000 estimated annual deaths attributed to air pollution in the UK [39] is likely to continue, albeit presumably in steady decline. It is imperative therefore that calls for action by medical authorities [40,41] are heeded.
Proposing an immediate target of zero (or natural-systems equivalent) is not realistic nor practicable given the current regulatory regime. An incremental approach attending to the constraints and mechanisms of government is necessary.
The first step we propose, which requires no regulatory change, amounts to interpretation of existing law. Regulation 4 of the Air Quality (England) Regulations 2000 [42] sets out the conditions against which air quality objectives should be judged:
(2) The achievement or likely achievement of an air quality objective prescribed by paragraph
 (1) shall be determined by reference to the quality of air at locations–
  (a) which are situated outside of buildings or other natural or man-made structures above or below ground; and
  (b) where members of the public are regularly present.
As we have already mentioned, Defra has previously admitted that “this text still leaves the relevant locations at which to apply the objectives open to interpretation”. (Box 1.2, page 20 [17]).
In the UK the interpretation of statute is supposed to accord with three rules, one of which is known as the plain meaning or literal rule [43]. The idea is that if a statute does not explicitly define terms, then the ordinary language meaning of the words should be used.
It is our view that the plain reading of “where members of the public are regularly present” clearly applies to any pavement or public space, where members of the public are regularly present. For example, in the case of Ella Kissi-Debrah previously discussed, under this interpretation, the annual objectives would have applied along her entire route to school.
Adopting this interpretation of existing law would shift the evaluation of annual objectives broadly toward actual public exposure, rather than the current situation of token specific locations (house façades) serving as a proxy for this role.
The second step we propose is to lower existing annual targets. As pointed out in [39], of the estimated 29,000 annual deaths attributed by COMEAP to PM2.5 [44] it’s the case “only a small fraction of that figure relating to exposures to concentrations in excess of legal limits” (para 5, page 18, [39]).
The UK government is already moving in this direction. Following the coronavirus outbreak, a 2020 select committee inquiry into air quality [45] recommended amendments to the government’s proposed Environment Bill. They recommended:
a specific target to reduce the annual mean concentration of PM2.5 to under 10 μ g / m 3 by 1 January 2030, in line with WHO guidelines
and
Alongside the PM2.5 target, the Secretary of State should use his discretionary powers in the Bill to set additional long-term air quality targets to reduce NO2, PM10, SO2, NMVOCs and ammonia
We agree that reducing the annual objective for PM2.5 from 25 μ g / m 3 to 10 μ g / m 3 is an appropriate next step, and aligns with existing Scottish law. We propose the NO2 objective also be revised based on a comprehensive analysis of the available evidence.
Finally, we propose moving towards exposure-oriented targets. We propose a new 12-h average for NO2 and PM2.5 that covers the daytime period where the majority of traffic-oriented exposure occurs. For the Defra dataset examined above, NO2 is 6.3 μ g / m 3 higher during the hours 7 a.m.–8 p.m. compared to outside of this time, even when averaged over all site types. As an interim position we would advocate that current annual objectives should apply to the reduced exposure window. We now address the question of how to make these measurements.
At the present time the majority of local authority monitoring for air quality management and land use planning employs Nitrogen Dioxide diffusion tubes. These are cheap, inaccurate and are typically exposed in monthly intervals and thus do not capture short-term effects. Defra classifies diffusion tubes as an “indicative” monitoring technique [46] (para 1, page 8). This means they are considered to have an accuracy of ±25%.
Continuous monitoring of pollutants using laboratory-grade equipment, such as used in Defra’s AURN network is too expensive to be used widely.
In recent years, a variety of multi-pollutant continuous monitors [47,48,49,50,51] have appeared that classify themselves as “near-reference”. They pitch themselves as being cheap enough to be used by local authorities, but also accurate enough to be useful.
Defra’s preliminary guidance on the use of low-cost sensors [52], points to their varying accuracy, caveats that proper co-location calibration and informed use is required, but ultimately speculates that:
as the technology evolves applications will arise where they do bring new insight to air pollution issues.
A more detailed appraisal [53] from The World Meteorological Organisation offers similar cautions and summarises its view as:
low-cost sensors are not currently a direct substitute for reference instruments, especially for mandatory purposes; they are however a complementary source of information on air quality, provided an appropriate sensor is used.
Our view is the following. Academic appraisals exist for low-cost sensors for NO2 [54,55] (electrochemical) and PM [56,57,58,59] (optical). Examining these, it is reasonable to infer from the reported RMSE and R 2 values that current technologies are at least as accurate as NO2 diffusion tubes, but with the benefit of being able to monitor continuously.
In the best cases, low-cost continuous sensors are more accurate than NO2 diffusion tubes. For example, Sensirion’s SPS30 PM sensor [60] is MCERTS certified [19] but costs less than 50 GBP. The MCERTS certificate for the device [61] for PM2.5 states that the maximum uncertainty relative to the reference equipment observed during the certification process was 8.9% and that the average intra-instrument uncertainty was 0.22 μ g / m 3 which is lower than the intra-instrument uncertainty of the equipment it was tested against.
Low-cost sensors with low intra-instrument uncertainty can be deployed in a configuration with tethers to reference sites, which provides a way to continuously re-calibrate the array for changing environmental conditions.
Local authorities are already starting to use these monitors as an adjunct to existing monitoring. The Mayor of London recently funded a 100+ deployment of a particular brand of these monitors [51] as part of the “Breathe London” project [62] which describes itself as “The new community air pollution sensing project for London” and caveats that the goal isn’t to replace existing reference monitoring.
We would go further and propose that properly calibrated low-cost monitors should be used to understand exposure patterns and to understand daily variation in place of NO2 diffusion tubes given that their accuracy is at least as good and in some cases exceeds.
With comprehensive continuous monitoring in place, and continuing evolution of technologies, we will be in a position to gather enough accurate data to inform epidemiology and be in a position to understand the true health impact of short-term exposures to airborne pollutants.
Summarising the above, we propose that (i) existing objectives should apply wherever people are present (ii) annual objectives should be reduced to 10 μ g / m 3 for PM2.5 and a review is necessary for NO2 (iii) new 12-h objectives for NO2 and PM2.5 should be created with adoption of current standards to this period as an interim position (iv) the substitution of NO2 diffusion tubes with low-cost continuous monitors as a pathway towards deriving evidence-based short-term exposure limits.

4. Conclusions

Defra’s heuristic for identifying hourly NO2 objective breaches is neither necessary nor sufficient. It misses more than half the true cases of hourly objective breach for both traffic and non-traffic sites and sensitivity testing implies an even worse practical performance. The heuristic should not be taken with confidence. Work needs to be done to establish the relationship between short-term exposure, cumulative dose, and health outcomes to derive health-based short-term objectives.

Author Contributions

Conceptualization, A.M. and S.P.; methodology, A.M.; software, A.M.; validation, A.M.; formal analysis, A.M.; investigation, A.M.; resources, A.M. and S.P.; data curation, A.M.; writing—original draft preparation, A.M.; writing—review and editing, A.M. and S.P.; visualization, A.M.; supervision, S.P.; project administration, S.P.; All authors have read and agreed to the published version of the manuscript.

Funding

This research received no external funding.

Data Availability Statement

Publicly available datasets were analyzed in this study. This data can be found here: (i) Defra continuous air quality analyser data [https://uk-air.defra.gov.uk/data/] (accessed on 16 March 2021); (ii) European air quality information reported by EEA member countries [https://www.eea.europa.eu/data-and-maps/data/aqereporting-8] (accessed on 16 March 2021).

Acknowledgments

We would like to thank the anonymous reviewers for constructive comments that substantially improved our paper, and the editors for excellent attention to detail.

Conflicts of Interest

The authors declare no conflict of interest.

References

  1. Defra. National Air Quality Objectives and European Directive Limit and Target Values for the Protection of Human Health. Available online: https://uk-air.defra.gov.uk/assets/documents/Air_Quality_Objectives_Update.pdf (accessed on 16 March 2021).
  2. European Parliament, Council of the European Union. Directive 2008/50/EC of the European Parliament and of the Council of 21 May 2008 on Ambient Air Quality and Cleaner Air for Europe. 2018. Available online: https://eur-lex.europa.eu/eli/dir/2008/50/oj (accessed on 16 March 2021).
  3. Clientearth No.3, R (On the Application of) v Secretary of State for Environment, Food and Rural Affairs & Ors [2018] EWHC 315 (Admin). 2008. Available online: http://www.bailii.org/cgi-bin/format.cgi?doc=/ew/cases/EWHC/Admin/2018/315.html&query=(clientearth) (accessed on 16 March 2021).
  4. Defra. Local Air Quality Management Policy Guidance (PG16); Technical Report; Defra: London, UK, 2016. Available online: https://laqm.defra.gov.uk/documents/LAQM-PG16-April-16-v1.pdf (accessed on 16 March 2021).
  5. Defra. Current AQMAs by Pollutant and Objective Declared. 2021. Available online: https://uk-air.defra.gov.uk/aqma/summary (accessed on 16 March 2021).
  6. Defra. Local Air Quality Management Technical Guidance (TG16). 2018. Available online: https://laqm.defra.gov.uk/technical-guidance/ (accessed on 16 March 2021).
  7. Ministry of Housing, Communities and Local Government. National Planning Policy Framework; Technical Report. 2019. Available online: https://assets.publishing.service.gov.uk/government/uploads/system/uploads/attachment_data/file/810197/NPPF_Feb_2019_revised.pdf (accessed on 16 March 2021).
  8. Greater London Authority. The London Plan 2016; Technical Report. 2016. Available online: https://www.london.gov.uk/sites/default/files/the_london_plan_2016_jan_2017_fix.pdf (accessed on 16 March 2021).
  9. HM Government. The Town and Country Planning (Environmental Impact Assessment) Regulations 2017. Available online: https://www.legislation.gov.uk/uksi/2017/571/introduction/made (accessed on 16 March 2021).
  10. Mills, A.; Peckham, S. Garbage in, gospel out?—Air quality assessment in the UK planning system. Environ. Sci. Policy 2019, 101, 211–220. [Google Scholar] [CrossRef]
  11. Defra. UK Plan for Tackling Roadside Nitrogen Dioxide Concentrations—Technical Report. Technical Report. 2017. Available online: https://assets.publishing.service.gov.uk/government/uploads/system/uploads/attachment_data/file/632916/air-quality-plan-technical-report.pdf (accessed on 16 March 2021).
  12. CERC. ADMS Roads Software. 2021. Available online: http://cerc.co.uk/environmental-software/ADMS-Roads-model.html (accessed on 16 March 2021).
  13. University of North Carolina at Chapel Hill (UNC) Institute for the Environment. R-LINE Version 1.2—A Research LINE-Source Dispersion Model for Near-Surface Releases. 2013. Available online: https://www.cmascenter.org/r-line/ (accessed on 16 March 2021).
  14. Laxen, D.; Marner, B. Analysis of the Relationship Between 1-Hour and Annual Mean Nitrogen Dioxide at UK Roadside and Kerbside Monitoring Sites; Technical Report, “Air Quality Consultants”. 2003. Available online: https://uk-air.defra.gov.uk/assets/documents/reports/cat06/1hr_NO2_rpt_Final_b.pdf (accessed on 16 March 2021).
  15. Defra. Local Air Quality Management Technical Guidance 2003; LAQM.TG(03). Technical Report. 2003. Available online: https://web.archive.org/web/20030731235829/http://www.defra.gov.uk/environment/airquality/laqm/guidance/pdf/laqm-tg03.pdf (accessed on 16 March 2021).
  16. “Basingstoke and Deane Borough Council”. Air Quality Review and Assessment—Stage 3 for Basingstoke & Deane—2000; Technical Report. 2000. Available online: https://web.archive.org/web/20040725121631/http://www.uwe.ac.uk/aqm/review/examples/basingstoke/stage3.doc (accessed on 16 March 2021).
  17. Air Quality Expert Group. Nitrogen Dioxide in The United Kingdom; Technical Report. 2004. Available online: https://uk-air.defra.gov.uk/library/assets/documents/reports/aqeg/Nitrogen_Dioxide_in_the_UK_2004.pdf (accessed on 16 March 2021).
  18. Defra. Automatic Urban and Rural Network (AURN). 2021. Available online: https://uk-air.defra.gov.uk/networks/network-info?view=aurn (accessed on 16 March 2021).
  19. CSA Group. MCERTS—The Environment Agency’s Monitoring Certification Scheme for Equipment, Personnel and Organisations. 2021. Available online: https://www.csagroupuk.org/services/mcerts/ (accessed on 16 March 2021).
  20. Malley, C.; von Schneidemesser, E.; Moller, S.J.; Hicks, W.K.; Braban, C.; Heal, M. Analysis of the distributions of hourly NO2 concentrations contributing to annual average NO2 concentrations across the European monitoring network between 2000 and 2014. Atmos. Chem. Phys. 2018, 18, 3563–3587. [Google Scholar] [CrossRef] [Green Version]
  21. Defra. Quality Assurance and Quality Control (QA/QC) Procedures for UK Air Quality Monitoring under 2008/50/EC and 2004/107/EC; Technical Report. 2016. Available online: https://uk-air.defra.gov.uk/assets/documents/reports/cat09/1902040953_All_Networks_QAQC_Document_2012__Issue2.pdf (accessed on 16 March 2021).
  22. European Parliament, Council of the European Union. Directive 2004/107/EC of the European Parliament and of the Council. 2004. Available online: https://www.legislation.gov.uk/eudr/2004/107/contents (accessed on 16 March 2021).
  23. European Environment Agency. European Environment Agency—Air Quality e-Reporting (AQ e-Reporting). 2018. Available online: https://www.eea.europa.eu/data-and-maps/data/aqereporting-8 (accessed on 16 March 2021).
  24. Terence oRourke Ltd. Redevelopment of Tesco Extra Site, Goodmayes, London Borough of Redbridge, EIA Scoping Report; Technical Report; Published by Redbridge Council (Planning Application no 4309/19). 2019. Available online: https://planningdocs.redbridge.gov.uk/NorthgatePublicDocs/00685284.pdf (accessed on 16 March 2021).
  25. Aether Ltd. Goodmayes Environmental Statement Technical Appendix C: Air Quality; Technical Report; 2019. Published by Redbridge Council (Planning Application no 4309/19). Available online: https://planningdocs.redbridge.gov.uk/NorthgatePublicDocs/00685253.pdf (accessed on 16 March 2021).
  26. van Leeuwen, F.X.R. Update and Revision of WHO Air Quality Guidelines for Europe; Technical Report; WHO-ECEH: Geneva, Switzerland, 1998; Available online: https://www.elaw.org/system/files/airqual.pdf (accessed on 16 March 2021).
  27. World Health Organisation. WHO Air Quality Guidelines for Europe, 2nd ed.; Technical Report; World Health Organization: Geneva, Switzerland, 2000; Available online: https://apps.who.int/iris/bitstream/handle/10665/107335/E71922.pdf (accessed on 16 March 2021).
  28. Huangfu, P.; Atkinson, R. Long-term exposure to NO2 and O3 and all-cause and respiratory mortality: A systematic review and meta-analysis. Environ. Int. 2020, 144, 105998. [Google Scholar] [CrossRef] [PubMed]
  29. Committee on the Medical Effects of Air Pollutants. Associations of Long-Term Average Concentrations of Nitrogen Dioxide with Mortality; Technical Report; Public Health England. 2018. Available online: https://assets.publishing.service.gov.uk/government/uploads/system/uploads/attachment_data/file/734799/COMEAP_NO2_Report.pdf (accessed on 16 March 2021).
  30. Mills, I.C.; Atkinson, R.W.; Kang, S.; Walton, H.; Anderson, H.R. Quantitative systematic review of the associations between short-term exposure to nitrogen dioxide and mortality and hospital admissions. BMJ Open 2015, 5, e006946. [Google Scholar] [CrossRef] [PubMed]
  31. Corso, M.; Blanchard, M.; Medina, S.; Wagner, V. Short-Term Associations of Nitrogen Dioxide (NO2) on Mortality in 18 French Cities, 2010–2014. Atmosphere 2020, 11, 1198. [Google Scholar] [CrossRef]
  32. Alvarez-Pedrerol, M.; Rivas, I.; López-Vicente, M.; Suades-González, E.; Donaire-Gonzalez, D.; Cirach, M.; de Castro, M.; Esnaola, M.; Basagaña, X.; Dadvand, P.; et al. Impact of commuting exposure to traffic-related air pollution on cognitive development in children walking to school. Environ. Pollut. 2017, 231, 837–844. [Google Scholar] [CrossRef] [PubMed] [Green Version]
  33. London Inner South Coroner’S Court. Record of Inquest—Ella Roberta Adoo Kissi—Debrah; Technical Report. 2020. Available online: https://www.innersouthlondoncoroner.org.uk/assets/attach/86/mnizari_16-12-2020_10-28-00.pdf (accessed on 16 March 2021).
  34. Lewisham Council. 2013 Air Quality Action Plan Progress Report for London Borough of Lewisham; Technical Report. 2014. Available online: https://lewisham.gov.uk/-/media/files/imported/airqualityprogressreport2013.ashx (accessed on 16 March 2021).
  35. AECOM. London Borough of Lewisham Nitrogen Dioxide Diffusion Tube Survey 2012; Technical Report; 2013. Available online: https://lewisham.gov.uk/-/media/files/imported/2012diffusiontubeannualreport.ashx (accessed on 16 March 2021).
  36. Defra. Background Mapping Data for Local Authorities. Available online: https://uk-air.defra.gov.uk/data/laqm-background-maps (accessed on 16 March 2021).
  37. The School of Pharmacology, University of London (ULSOP). State of the Art Report on Mixture Toxicity - Final Report—Executive Summary; Technical Report. 2009. Available online: https://ec.europa.eu/environment/chemicals/effects/pdf/report_mixture_toxicity.pdf (accessed on 16 March 2021).
  38. MacKay, D. Sustainable Energy—Without the Hot Air; UIT: Cambridge, UK, 2008; Available online: https://www.repository.cam.ac.uk/handle/1810/217849 (accessed on 16 March 2021).
  39. Royal College of Physicians. Every Breath We Take: The Lifelong Impact of Air Pollution; Report of a Working Party, Technical Report. 2016. Available online: https://www.rcplondon.ac.uk/projects/outputs/every-breath-we-take-lifelong-impact-air-pollution (accessed on 16 March 2021).
  40. Iacobucci, G. Urgent action on UK air pollution is needed, say experts. BMJ 2016, 352, i1099. [Google Scholar] [CrossRef] [PubMed]
  41. The Lancet. Scale of Europe’s air pollution problem demands more action. Lancet 2016, 388, 2714. [Google Scholar] [CrossRef]
  42. The Air Quality (England) Regulations 2000, UK Statutory Instruments 2000, No. 928, Regulation 4. Available online: http://www.legislation.gov.uk/uksi/2000/928/regulation/4/made (accessed on 16 March 2021).
  43. Domingo, L.; Stewart, W.J. Collins Dictionary of Law, 2nd ed.; Collins: London, UK, 2001. [Google Scholar]
  44. Committee on the Medical Effects of Air Pollutants. The Mortality Effects of Long-Term Exposure to Particulate Air Pollution in the United Kingdom; Technical Report. 2010. Available online: https://assets.publishing.service.gov.uk/government/uploads/system/uploads/attachment_data/file/304641/COMEAP_mortality_effects_of_long_term_exposure.pdf (accessed on 16 March 2021).
  45. House of Commons Environment, Food and Rural Affairs Committee. Air Quality and Coronavirus: A Glimpse of a Different Future or Business as Usual—Fifth Report of Session 2019–21; Technical Report. 2021. Available online: https://publications.parliament.uk/pa/cm5801/cmselect/cmenvfru/468/468.pdf (accessed on 16 March 2021).
  46. AEA Technology Plc. Diffusion Tubes for Ambient NO2 Monitoring: Practical Guidance for Laboratories and Users. Report to Defra and the Devolved Administrations ED48673043. Issue 1a. 2008. Available online: https://laqm.defra.gov.uk/documents/0802141004_NO2_WG_PracticalGuidance_Issue1a.pdf (accessed on 16 March 2021).
  47. Environmental Instruments Ltd. AQMesh Small Sensor Air Quality Monitoring System. Available online: https://www.aqmesh.com/ (accessed on 16 March 2021).
  48. Earthsense Ltd. Earthsense Zephyr Air Quality Monitor. Available online: https://www.earthsense.co.uk/zephyr (accessed on 16 March 2021).
  49. Envirowatch Ltd. The E-MOTE—Air Quality and Noise Pollution Monitoring. Available online: http://www.envirowatch.ltd.uk/e-mote/ (accessed on 16 March 2021).
  50. South Coast Science Ltd. Praxis Urban Air Quality Monitor. Available online: https://www.southcoastscience.com/products/ (accessed on 16 March 2021).
  51. Clarity Movement, Co. Clarity Movement Co.—Low Cost Air Quality Monitoring & Measurement. Available online: https://www.clarity.io/ (accessed on 16 March 2021).
  52. Defra. ’Low-Cost’ Pollution Sensors—Understanding the Uncertainties- Defra, UK. Available online: https://uk-air.defra.gov.uk/research/aqeg/pollution-sensors/understanding-uncertainties.php (accessed on 16 March 2021).
  53. World Meteorological Organisation. Low-Cost Sensors for the Measurement of Atmospheric Composition: Overview of Topic and Future Applications; Technical Report. 2018. Available online: http://www.wmo.int/pages/prog/arep/gaw/documents/Low_cost_sensors_18_Oct.pdf (accessed on 16 March 2021).
  54. Cross, E.S.; Williams, L.R.; Lewis, D.K.; Magoon, G.R.; Onasch, T.B.; Kaminsky, M.L.; Worsnop, D.R.; Jayne, J.T. Use of electrochemical sensors for measurement of air pollution: Correcting interference response and validating measurements. Atmos. Meas. Tech. 2017, 10, 3575–3588. [Google Scholar] [CrossRef] [Green Version]
  55. Bigi, A.; Mueller, M.; Grange, S.K.; Ghermandi, G.; Hueglin, C. Performance of NO, NO2 low cost sensors and three calibration approaches within a real world application. Atmos. Meas. Tech. 2018, 11, 3717–3735. [Google Scholar] [CrossRef] [Green Version]
  56. Han, I.; Symanski, E.; Stock, T.H. Feasibility of using low-cost portable particle monitors for measurement of fine and coarse particulate matter in urban ambient air. J. Air Waste Manag. Assoc. 2017, 67, 330–340. [Google Scholar] [CrossRef] [PubMed] [Green Version]
  57. Steinle, S.; Reis, S.; Sabel, C.E.; Semple, S.; Twigg, M.M.; Braban, C.F.; Leeson, S.R.; Heal, M.R.; Harrison, D.; Lin, C.; et al. Personal exposure monitoring of PM2.5 in indoor and outdoor microenvironments. Sci. Total Environ. 2015, 508, 383–394. [Google Scholar] [CrossRef] [PubMed] [Green Version]
  58. Holstius, D.M.; Pillarisetti, A.; Smith, K.R.; Seto, E. Field calibrations of a low-cost aerosol sensor at a regulatory monitoring site in California. Atmos. Meas. Tech. 2014, 7, 1121–1131. [Google Scholar] [CrossRef] [Green Version]
  59. Crilley, L.R.; Shaw, M.; Pound, R.; Kramer, L.J.; Price, R.; Young, S.; Lewis, A.C.; Pope, F.D. Evaluation of a low-cost optical particle counter (Alphasense OPC-N2) for ambient air monitoring. Atmos. Meas. Tech. 2018, 11, 709–720. [Google Scholar] [CrossRef] [Green Version]
  60. Sensirion Ltd. Particulate Matter Sensor SPS30. Available online: https://www.sensirion.com/en/environmental-sensors/particulate-matter-sensors-pm25/ (accessed on 16 March 2021).
  61. GROUP, C. Product Conformity Certificate—SPS30 Particulate Matter Sensor. Technical Report. 2020. Available online: https://www.csagroupuk.org/wp-content/uploads/2020/01/MC20035000.pdf (accessed on 16 March 2021).
  62. Breathe London Project. Available online: https://www.breathelondon.org/ (accessed on 16 March 2021).
Figure 1. The number of hours where NO2 exceeded 200 μ g / m 3 against annual mean NO2 for each site-year datapoint. Open points have more than 18 exceedances and closed points have less than or equal to 18 exceedances. A horizontal black line is drawn at 18 h for clarity. Points in the top right hand corner are all plotted at 400 h to compress the y-space needed for the graph and the actual values are shown in labels. A vertical line is shown at 60 μ g / m 3 which represents the heuristic that is supposed to separate closed from open datapoints.
Atmosphere 12 00385 g001
Figure 2. Locations of monitoring stations in complete EU air quality dataset, coloured by site category.
Atmosphere 12 00385 g002
Table 1. Summary of data for all site types in the AURN dataset, examining the cartesian product of whether the heuristic threshold is met (>60 μ g / m 3  annual mean) and whether the hourly threshold is met (more than 18 h >200 μ g / m 3 ). The last four columns show mean, minimum, maximum, and standard deviation of measured NO2 for each category (in μ g / m 3 ). * A site can be in more than one set because it can differ from year-to-year and so the total of the column exceeds the total number of sites (143).
Conditions BreachedNumber of Site Years (and %)No. Sites *Mean NO2Min NO2Max NO2Std NO2
None1508 (93.6)14126.31.959.912.6
Only Hourly7 (0.4)553.941.959.26.3
Only Heuristic45 (2.8)765.360.380.44.3
Hourly and Heuristic51 (3.2)781.361.5115.314.8
Table 2. A table which examines how many objective breaking sites (sites with >18 exceedances of 200 μ g / m 3  ) are also heuristic breaking sites (having at least one objective breaking year with an annual mean <60 μ g / m 3 ) as a function of site type for the Defra dataset.
Site TypeNo. Objective Breakers (% as % of Total Sites in Dataset)No. Heuristic Breakers (% as % of Objective Breakers)Mean Annual NO2 for Site Type ( μ g / m 3 )
Rural Background0 (0.0)0 (NA)9.8
Suburban Background0 (0.0)0 (NA)23.4
Suburban Industrial0 (0.0)0 (NA)22.8
Urban Background4 (6.8)3 (75.0)28.1
Urban Industrial1 (11.1)1 (100.0)23.3
Urban Traffic8 (12.1)2 (25.0)39.9
All sans Industrial12 (8.4)5 (41.7)29.3
All13 (8.4)6 (46.2)28.7
Table 3. Sensitivity test data. Summary of data for all site types in the AURN dataset, examining the cartesian product of whether the heuristic threshold is met (>60 μ g / m 3  annual mean) and whether the hourly threshold is met (more than 18 h >170 μ g / m 3 ). The last four columns show mean, minimum, maximum, and standard deviation of measured NO2 for each category (in μ g / m 3 ). * A site can be in more than one set because it can differ from year-to-year and so the total of the column exceeds the total number of sites (143).
Conditions BreachedNumber of Site Years (and %)No. Sites *Mean NO2Min NO2Max NO2Std NO2
None1476 (91.6)14125.81.959.912.2
Only Hourly39 (2.4)215030.959.27.8
Only Heuristic15 (0.9)562.560.5661.8
Hourly and Heuristic81 (5.0)875.960.3115.313.9
Table 4. Summary of data for “Traffic” sites in the UE dataset, examining the cartesian product of whether the heuristic threshold is met (>60 μ g / m 3  annual mean) and whether the hourly threshold is met (more than 18 h >200 μ g / m 3 ). The last four columns show mean, minimum, maximum, and standard deviation of measured NO2 for each category (in μ g / m 3 ). * A site can be in more than one set because it can differ from year-to-year and so the total of the column exceeds the total number of sites (1024).
Conditions BreachedNumber of Site Years (and %)No. Sites *Mean NO2Min NO2Max NO2Std NO2
None4875 (94.9)100132.14.46010.8
Only Hourly50 (1.0)2548.423.659.58
Only Heuristic159 (3.1)6366.56090.96.2
Hourly and Heuristic53 (1.0)2776.860.4138.715.3
Table 5. A table which examines how many objective breaking sites (sites with >18 exceedances of 200 μ g / m 3 ) are also heuristic breaking sites (having at least one objective breaking year with an annual mean < μ g / m 3 ), as a function of site type for the EU dataset.
Site TypeNo. Objective Breaking Sites (% as % of Total Sites in Dataset)No. Heuristic Breaking Sites (% as % of Objective Breakers)Mean Annual NO2 for Site Type ( μ g / m 3 )
Background36 (1.7)29 (80.6)17.5
Industrial2 (0.4)1 (50.0)16.4
Traffic48 (4.7)25 (52.1)33.8
All sans Industrial84 (2.7)54 (64.3)22.7
All86 (2.3)55 (64.0)21.9
Publisher’s Note: MDPI stays neutral with regard to jurisdictional claims in published maps and institutional affiliations.

