Abstract
In the face of climate change, extreme climates are becoming more frequent. There were severe droughts in Taiwan in 2020, 2014–2015, and 2002. In these years, the paddy fields were kept fallow to save water and transfer agricultural water to non-agricultural use. On the other hand, with global warming, the existence of paddy fields may be one of the natural solutions to regional temperature mitigation. This study used remote sensing to quantify the difference in temperature between paddy fields and urban areas. The result of overall surface temperature deductive analysis revealed that the temperature in the whole Taoyuan research area was 1.2 °C higher in 2002 than in 2003 because of fallowing of the paddy field, while in the Hsinchu research area, it was 1.5 °C higher in 2002 than in 2003, due to the same reason described above. In terms of the difference in land use, for the Hsinchu research area, the surface temperature deductive result showed that the average paddy field temperature in 2002 was 22.3 °C (sample area average), which was 7.7 °C lower than that of the building and road point and 4.3 °C lower than that of the bare land point. The average paddy field temperature in 2003 was 19.2 °C (sample area average), which was 10.1 °C lower than that of the building and road point and 8.3 °C lower than that of the bare land point. Then this study evaluated the economic valuation of the paddy field cooling effect using the contingent valuation method. Through the paddy field cooling effect and in the face of worsening extreme global climate, the willingness to pay (WTP) of the respondents in Taiwan for a decrease of 1 °C with regard to the regional microclimate was evaluated. It was found that people in Taiwan are willing to pay an extra 8.89 USD/per kg rice/year for the paddy for a decrease in temperature by 1 °C in the regional microclimate due to the paddy field. Furthermore, this study applied the benefits transfer method to evaluate the value of a decrease of 1 °C in the regional microclimate in Taiwan. The value of a decrease of 1 °C in the regional microclimate in Taiwan is 9,693,144,279 USD/year. In this regard, the economic value of 1 °C must not be underestimated. In conclusion, more caution is needed while making decisions to change the land use of paddy fields to other land uses.
1. Introduction
Global warming and climate change may cause severe droughts and floods, leading to famines. There were severe droughts in Taiwan in 2020, 2014–2015, and 2002. In these years, the paddy fields were kept fallow to transfer agricultural water to industrial or public sector use. Extensive conversion of paddy fields to other land use may have adverse consequences, including microclimate change [1]. A microclimate is a local set of atmospheric conditions that differ from those in the surrounding areas, often with a slight difference but sometimes with a substantial one. Because the climate is statistical, which implies a spatial and temporal variation in the mean values of the describing parameters, within a region, there can occur and persist over time sets of statistically distinct conditions. Microclimate change happens, for example, because of bodies of water that may cool the local atmosphere or because of urban areas, where concrete and asphalt absorb the sun’s energy, heat up, and re-radiate that heat to the ambient air.
With global warming, the existence of paddy fields may be one of the natural solutions to regional temperature mitigation. Yokohari et al. (2001) [2] measured air temperatures on hot days under several different residential settings and determined that there was a cooling effect of paddy fields that extended approximately 150 m into residential areas. The fact that it is flooded substantially affects surface energy balance components over paddy relative to other non-irrigated crops or even crops that are irrigated only at certain times during the growing season [3,4]. Based on regional land use data, Liu et al. (2019) [5] evaluated the land surface temperature change response to land surface biophysical process changes resulting from land use change. Land use changes (LUCs) affect the surface temperature by modifying vegetation–soil–atmosphere exchanges of water and energy [6]. Due to long-term ponding or a moist growth environment, paddy fields have the functions of man-made wetlands. Agricultural lands, green spaces, or water surfaces have relatively lower temperatures compared to peripheral areas and have a cooling effect [7,8]. Yoshida et al. (2014) [9] emphasized the need for developing adaptation measures other than land use management and for avoiding further deforestation and paddy abandonment at a regional scale to minimize LUC-induced warming. In the process of evaporation, a large amount of heat from the surrounding environment is absorbed to form the heat sink effect. If located in a metropolitan area, contrary to the heat island effect, paddy fields can functionally have a cooling effect. The cooling effect of paddy fields is more significant in the urban neighborhood and can be one of the natural solutions to global warming [10].
Concerning the current global warming issue, the existence of paddy fields is one of the ways to mitigate regional temperatures and achieve a balance in nature. With their effect put to proper use and through proper adjustment of the regional microclimate, the issue of global warming on a regional or even a global scale can be alleviated. The objectives of this study are as follows:
- Quantifying the difference in temperature between paddy fields and urban areas using remote sensing
- Quantifying the ability of paddy fields to reduce the heat island effect
- Employing the contingent valuation method (CVM) to estimate the economic value of the paddy field cooling effect
2. The Cooling Effect of Paddy Fields
The heat island effect is one of the predominant phenomena many cities in the world are facing today. The heat island effect results in energy waste and impacts the entire ecosystem, which, in turn, poses a threat to human health. For example, negligible day and night temperature differences result in reduced fruiting of tomatoes after flowering; reduced relative humidity also impacts plant growth. Take thunderstorms in summer afternoons as another example. They result in higher rainfalls in the cities compared to catchments because of the heat island effect. High temperatures in summer also result in large power consumption due to the use of air-conditioning, fans, and other household appliances to lower the indoor temperature. According to statistics, the United States uses one-sixth of its power for cooling, for which USD 40 billion is spent on electricity. With the development of urban areas, exhausts and heat accumulate, which leads to an urban heat island (UHI) effect. In contrast, urban green open spaces tend to have water readily available for evapotranspiration, and thus much less of the absorbed solar radiation is converted to sensible heat. This means that the air temperatures are typically lower than in the surrounding urban areas. Studies of varying amounts of cooling effects that these green open spaces have on adjacent urban areas were reported by Hutchison and Taylor (1983) [11].
Moreover, Thiery et al. (2020) [12] pointed out that irrigation affects climate conditions—and especially hot extremes—in various regions across the globe. Thiery et al. (2020) [12] provided observational and model evidence that expanding irrigation has dampened historical anthropogenic warming during hot days, with particularly strong effects over South Asia. The cooling effect of paddy fields is more significant in the urban neighborhood and can be one of the natural solutions to global warming. There are few studies of the cooling effect of paddy fields since it is difficult to get the temperature around the paddy fields in a large area. With the development of remote sensing technology, remotely sensed data have the attribute of an instantaneous and wide range of views. Remote sensing has the benefit of simultaneous coverage of a wide area that is irreplaceable by ground methods. Tan et al. (2011) [10] used the thermal bands of the Landsat-7 satellite dated from 2005 to 2010 and matched them with the different planting cycles of paddy to analyze and estimate the range of the cooling effect. Land surface temperatures (LSTs) were derived from the thermal and optical bands of Landsat-7. The LSTs in each of the buffer areas from the centerline of the paddy and the metro area were estimated, and the turning point in the LST–distance curve was considered the affected range of the phenomenon. Tan et al. (2011) [10] indicated that the average range of cooling effects was 110, 90, 105, and 80 m for active growth, transplant, seedling, and postharvest periods, respectively. This indicated that the lands covered with water are more effective in cooling the temperature in residential areas. During evaporation, paddy fields absorb air and thermal energy on the ground surface to reduce the temperature of the paddy fields and the air in the surroundings, which leads to a cooling effect known as the paddy sink effect, or the cooling effect of a paddy field. The temperature of the surroundings increases as the distance increases. Drawn in a temperature line chart, a paddy field appears to be a cool island erected on the hotter ocean of the artificially paved surrounding ground surface; the cooling effect is shown in Figure 1 [13].
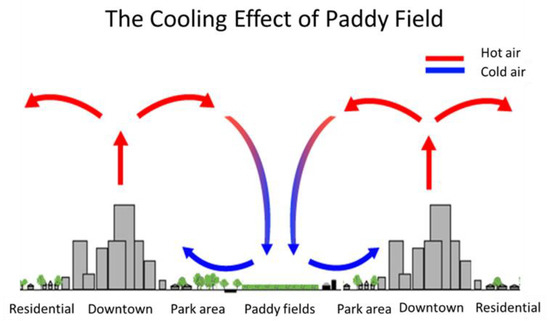
Figure 1.
Paddy field cooling effect: a schematic diagram of changes of cold air and hot air. Source: Chiueh et al. (2015) [13].
There were severe droughts in Taiwan in 2020, 2014–2015, and 2002 [14]. The severity of the droughts, according to some widely used drought indices such as the Palmer Drought Severity Index (PDSI), The Standardized Precipitation Evapotranspiration Index (SPEI) and the Standardized Precipitation Index (SPI) [15], was extreme. For example, the SPI values for 2002 were −2.04(2002, 5: SPI6), −2.12(2002, 5: SPI9), and −1.74(2002, 5: SPI12) [16]. The SPI values for 2014 were −1.36(2014, 11: SPI6), −1.02(2014, 11: SPI9), and −1.09(2014, 11: SPI12) [16]. Hung and Shih (2019) [17] estimated the Taiwan Meteorological Drought index (TMD index) category of the droughts in Taiwan in 2002 and 2014–2015 as severe. From 2020 until 2021, Taiwan has been facing severe drought; the water condition category announced by the Water Resource Agency, Taiwan, in Taoyuan, Hsinchu, and Miaoli is yellow (decompression water supply) to orange (reduced water supply) [14]. We mined the historical data in the representative drought year 2002. The amount of precipitation in the spring seasons of the years 2002 to 2003 in northern Taiwan was much lower than the regular average, which was not adequate to meet the demand of both agricultural or non-agricultural uses simultaneously. In the selected research area, the paddy field was kept fallow during drought years and no agricultural water was delivered. It is a similar situation that occurred in Taoyuan, Hsinchu, and Miaoli in 2020.
As a result, areas of 10,439 ha and 4339 ha of paddy cultivation were suspended in the spring season of 2002 in the Shimen Main Canal scheme of Shimen IA and in the Tou-Chen-Shi scheme of Hsinchu IA, respectively. The amount of water saved from the above-mentioned fallow period of paddy cultivation was shifted to meet domestic and industrial needs. The fallowed paddy area reached 24,749 ha in the Shimen Reservoir irrigation scheme of Taoyuan IA and 2897 ha in the Tou-Chen-Shi scheme of Hsinchu IA in the year 2003. In 2004, the fallowed paddy areas were 24,525 ha, 12,206 ha, and 5186 ha for Taoyuan, Shimen, and Hsinchu IA, respectively.
The practice of inundation irrigation of paddy prevails in most irrigated areas of Taiwan. Hence, the irrigation requirement for paddy is generally higher than for any non-rice crops. A certain depth of water inundation above the surface of the paddy field during the various stages of the active growth period, such as transplanting, splitting, young and normal head forming, and milky and starchy repining, is needed to maintain the normal growth of paddy. Evaporation and transpiration from paddy fields consume thermal energy from the air and the land surface. This results in a significant reduction in the temperature in the neighborhood and the mitigation of surface temperatures in the rural community and the urban area. However, for quantifying this result, a record of area-wise temperature data is needed, which is lacking in the study area. The records availed at several weather stations are deemed insufficient for undertaking a meaningful study, because such data can only be considered point-wise data. The data obtained by means of remote sensing are able to cover widespread areas and can provide area-wise simultaneous and constant periodic information. Moreover, it is easier to convert these data into digitalized form, facilitating the establishment of a data bank of natural resources.
This study adopted the thermal bands of two Landsat-7 satellite images to acquire the data necessary for the study. As for the surface temperature distribution, it was calibrated based on the physical models; accordingly, the temperature differentiations among paddy fields and wide neighboring areas were obtained. In addition, we were also able to calibrate their temperature correlations.
2.1. Research Area and Methodology
This study selected three areas, geographically adjacent to one another, all of them irrigated paddy fields. The drought spell in the same period of the years 2002 to 2003 was considered, and only the fallow status of paddy cultivation was different for the three areas. These three areas are all located in the northwest of Taiwan. The detailed location and the fallow status of paddy cultivation are described hereunder: (1) Taoyuan area: It is the northernmost area of the three study areas, and this study area covers about 25,000 ha. It was left fallow only in 2003. (2) Hsinchu area: It is located in the south of Taoyuan area; the selected study area covers about 4920 ha. It was left fallow in both 2002 and 2003. (3) Gobei water group area: It is situated inside the above-mentioned Hsinchu area. The area selected for research covers about 230 ha. The research in this area was more focused on micro-temperature variations. The micro-temperature is, as a microclimate, a local set of temperature conditions that differ from those in the surrounding areas.
The detailed locations of the research area designated in Chungli and Hsinchu in Taoyuan County and the Gobei area of Hsinchu County are shown in Figure 2 and Figure 3. The thermal bands of two Landsat-7 satellite images, taken on 28 May 2002 and 31 May 2003, with a resolution of 60 m × 60 m, were used as the basic information for the study. The research used these two basic images for inspecting general land use classification and calibrating in the field with the information obtained from paddy fields and other land use. The surface temperature was estimated or calculated by using the above-mentioned satellite images. Transforming the spectrum radiation quantity into temperature was undertaken via various radioactive, atmospheric, and geometry adjustment procedures to verify the correlation between various paddy fields and the temperatures of their ambient areas. The research procedures are shown in Figure 4 below.
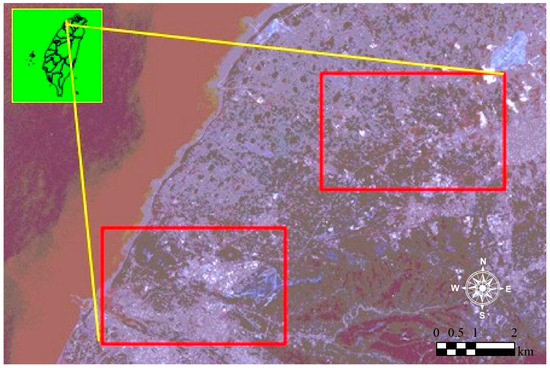
Figure 2.
Picture of Hsinchu and Taoyuan study areas.
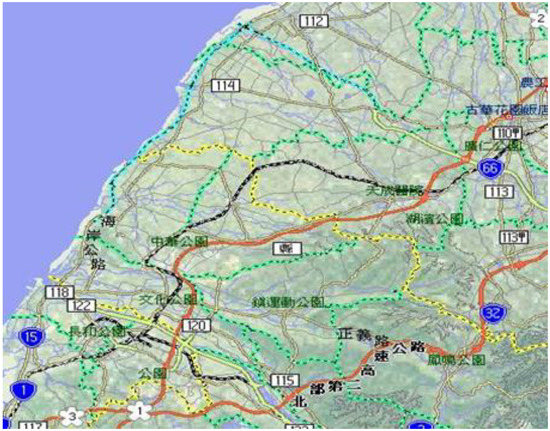
Figure 3.
Locations of research areas.
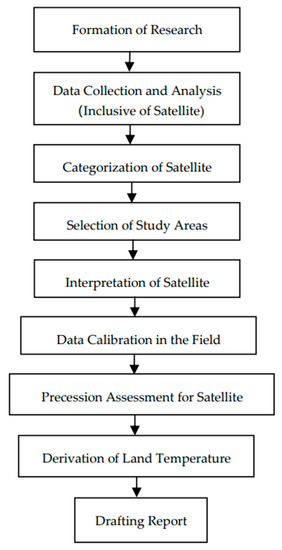
Figure 4.
Research flowchart.
2.2. Research Software and Satellite Images
The actual point land temperature records were acquired from 9 weather stations located in the study areas, namely Hsinwu, Hsinchu, Guanwu, Meihua, Chudong, Chunan, Nanzhuang, Sanyi, and Yuenli, provided by the Central Weather Bureau, Taiwan. The software programs used for image processing and Geographic Information System (GIS) analysis are ERDAS Imagine Satellite Image Analysis and ESRI ArcGIS.
The land surface temperature varies depending upon the balance of solar radiation energy absorbed by and radiated from the land or the flux of the solar energy of the land. Meanwhile, most of the solar energy gained by the wet ground would be used for water vapor circulation, and only little is used for heating the surface of the land. On the other hand, on a dry surface land, the majority of usable energy is used for heating the surface of the land and thus creates a relative higher land surface temperature. Therefore, the surface temperature may be used to help judge the surface evaporation dispersion. The radioactive quantity that an object emits depends on its temperature. For crops and bare ground, the longest wave of their emission energy is located in the thermal infrared wave band section. Therefore, the observation from the satellite telemeter on this wave band can provide information about the surface temperature.
2.3. Surface Temperature Deduction
Based on the land use classification undertaken, this research adopted the emission rate of long-wave infrared to carry out the calculations of terrestrial surface radiation temperature. The result of the calculated temperature is the ground radiation temperature derived from the Landsat-7 satellite’s sixth wave band thermal infrared image. To transfer this temperature to the actual surface temperature, the daily/hour data for calibration were obtained from the adjacent weather stations of the Central Weather Bureau, Taiwan. Each station’s actual surface temperature taken at 10:00 a.m. daily was used as the datum, and the land surface temperature was calculated based on the above-mentioned data and the Landsat-7 satellite’s sixth wave band thermal infrared image to deduce the ground radiation temperature. Finally, the average temperature difference between the ground radiation and ground surface temperatures was obtained.
Given that the land surface temperature is derived from the surface radiation temperature based on the lower-resolution Landsat-7 satellite’s sixth wave band thermal infrared image, this derivation needs to incorporate surface temperature deduction. The steps of deduction include, first, land surface classification. This step classifies the region’s land use into six major categories: paddy field, water body, building and road, upland crops, forest, and bare land. According to Planck’s law and based on the radiation temperature and the long-wave emission, the ground temperature can be calculated. As for processing the images, ERDAS Imagine Satellite Image Analysis software was adopted for the calculation. The calculation method procedures are summarized below:
- Transform the radiation correction coefficient to the atmosphere’s long-wave radiation intensity L6, TOA (mW/m2-sr-μm) by the formulawhere DN is the digital number of the image and Lmax and Lmin are the detectable maximum and minimum radiation levels in the scene, respectively.
- Use Planck’s law to transform the spectrum radiation quantity to the satellite radiation temperature Tsat (K).
- Transform the atmosphere’s long-wave radiation intensity according to the Stefan-Boltzmann law and use the survey ground emission long-wave radiation quantity information and the atmosphere’s long-wave radiation quantity obtained from the satellite image to calculate the linear regression and the ground temperature T0(°C) by the following equation:where is the long-wave emissivity of the land surface.
2.4. Ground Calibrations
An infrared thermometer (Lorton TM-900, Lorton, Taiwan) was used to measure the current location surface temperature. The advantage of this instrument is that it is able to detect the thermal radiation that is emitted by the surface of the object to be measured, and thus it can obtain the temperature readings in just a few seconds. Its temperature measurement principle is the same as the satellite’s thermal infrared image formation, but because it is indirectly estimated from the heat radiation, there might be more errors than the common mercury thermometer. Moreover, its induction efficiency could be affected depending on the time of measuring; thus, it must be adjusted before proceeding to outdoor investigations.
According to the various land use classifications, numerous investigations on current land use were conducted between May and July 2004 in Chungli, Hsinwu in Taoyuan, and the Gobei area of Hsinchu County. A total of 114 points in the Taoyuan area and 115 points in the Hsinchu research area were investigated; the details are shown in Table 1. During the investigation, different land use investigation points were selected from the research area based on a map with a scale of 1/25,000. Matching the plots of a paddy field block with satellite images, the location of the selected plot in a satellite image can be obtained immediately with the assistance of the Global Positioning System (GPS). The land use can be recorded on the field, and after the ground calibration is completed, this information can be further analyzed in the GIS to meet the needs of research.

Table 1.
Number of points of ground investigation and calibration in the research area.
2.5. Result of Analysis of the Surface Temperature
The surface temperature was obtained by using the lower-resolution Landsat-7 satellite’s sixth wave band thermal infrared image to first calculate the surface radiation temperature. Then, surface temperature deduction could start with land surface classification, where the land use of the research area was segmented into six major categories, namely paddy field, water body, building and road, upland crops, forest, and bare land, as mentioned before. Referring to the emissivities of common materials [18], the long-wave emissivity was set at 0.96 for the paddy field, 0.97 for the water body, 0.93 for building and road, 0.95 for upland crops, 0.94 for forests, and 0.93 for bare land. The radiation temperature was deduced by the thermal infrared light according to Planck’s law. Consequently, based on the radiation temperature and the long-wave emission, the ground temperature was also obtained accordingly. As for image processing, it was carried out with the assistance of ERDAS Imagine Satellite Image Analysis software.
The thermal infrared image with a 60 m resolution reveals that the points of building and road and bare land are the higher-temperature-concentration areas. The paddy field and forest points have lower temperatures, and the water body point is the lowest-temperature-concentration area. The results of the analysis are shown in Table 2 and summarized below:

Table 2.
The analyzed average surface temperatures (°C) of the research areas.
- In the Taoyuan research area, the surface temperature of the paddy field is 2.5 °C lower than in all the areas, on average, while that in the Hsinchu research area is 3.3 °C lower. These two studies show that the average paddy field temperature is 2.9 °C lower than the regional average.
- The surface temperature in the entire Taoyuan region was 1.2 °C higher in 2002 than in 2003 according to satellite analysis. The result of another analysis also showed that the temperature of the paddy field point was approximately 6.6 °C lower than that of building and road point and approximately 2.6 °C lower than that of the bare land point, on average.
- The surface temperature in the entire Hsinchu region was 1.5 °C higher in 2002 than in 2003 according to satellite analysis. Due to the fallowing in both 2002 and 2003, the surface temperature in the paddy fields was higher by 1.6 °C in 2002 than in 2003. Another analysis also showed that the temperature of the paddy field point was approximately 7.7 °C lower than that of building and road point and approximately 4.3 °C lower than that of the bare land point. In 2003, the temperature of the paddy field point was approximately 10.1 °C lower than that of the building and road point and approximately 8.3 °C lower than that of the bare land point, on average.
Figure 4 and Figure 5 show the land surface temperature of the research area. As Taoyuan and Hsinchu both are regions with a higher degree of development, which contains a few agricultural water storage ponds, these ponds have a relatively higher influence on the surface temperature. These results also show that the majority of high-temperature areas (red areas) appear in building and road and bare land points and, on the other hand, low-temperature areas (green areas) in the water body, forest, and paddy field points, as shown in Figure 5 and Figure 6 below.
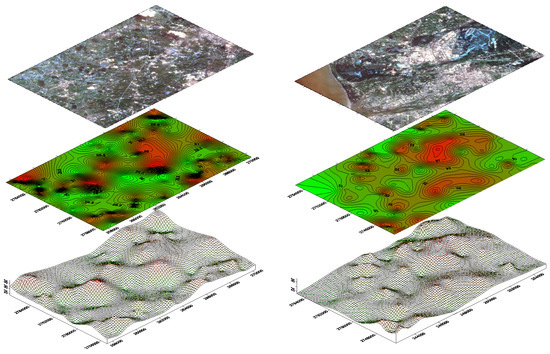
Figure 5.
Taoyuan (Right) and Hsinchu (Left) research areas’ satellite surface images and regional isothermal line maps, May 2003.
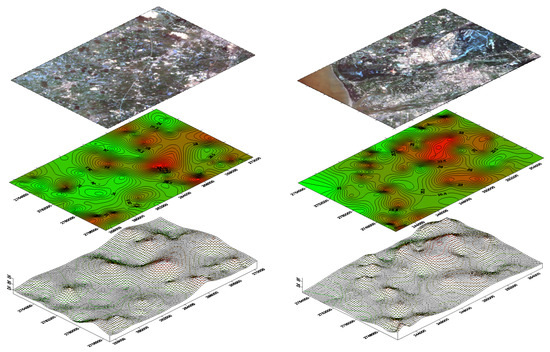
Figure 6.
Taoyuan (Right) and Hsinchu (Left) research area satellite surface images and regional isothermal line maps, 28 May 2002.
2.6. Influence of a Fallow Period of Paddy Cultivation on Temperature in a Micro-Area
A small area of the Gobei work group, located inside the Hsinchu Irrigation Association, with an irrigated area of 226 ha, was identified to be appropriate for undertaking such a study. The paddy fields were left fallow in this small area only in 2003 and not in 2002. The GIS of the Gobei work group irrigation area was overlapped with the Landsat-7 satellite’s sixth wave band thermal infrared image to undertake the process of deducing the surface temperature. During the deduction analysis, a buffer analysis method was adopted, as shown in Figure 7. The research also verified whether the above situation remains the same during the fallow period while there is no paddy in the field.
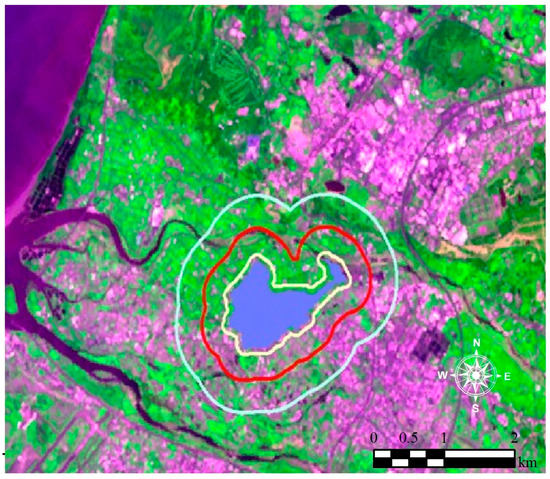
Figure 7.
Buffer analysis graph (the blue area is the group’s region; the yellow, red, and light green lines are 100 m, 500 m, and 1000 m boundaries, respectively) of the Gobei work group, Hsinchu Irrigation Association.
The results of the buffer analysis for the average surface temperature in the Gobei work group in 2002 and 2003 are shown in Table 3, and the adjusted temperature in 2002 is shown in Table 3. It is obvious that in 2002, without fallowing the paddy fields, the existence of the paddy fields had contributed to the average temperature of approximately 24.8 °C in the Gobei work group. As the areas extended away from the water group, their temperatures elevated gradually. This indicates that the land use of the areas outside the Gobei work group caused the rise in temperature. In 2003, during the fallow period, there was no solar energy absorption in the paddy fields, and thus, the ground temperature fluctuation was much higher than in 2002. This analysis proves that the existence of paddy fields, indeed, leads to a reduction in the temperature. The results of the buffer analysis can be summarized as follows:

Table 3.
Average surface temperature (°C) of the Gobei work group in the Hsinchu Irrigation Association.
- The average surface temperature in 2003 was 3.07 °C higher than in 2002.
- In the year 2002, after adjustment, the average temperature of 23.28 °C changed to 23.37 °C after 100 m buffer analysis and to 23.44 °C after 200 m. Between 300 m and 1000 m, the average temperatures were as follows: 23.57 °C, 24.06 °C, 24.08 °C, 24.09 °C, 24.16 °C, 24.20 °C, 24.27 °C, and 24.32 °C, respectively. This proves that paddy fields have the effect of decreasing the regional average temperatures of their surroundings, depending upon the man-made land use. They also have positive effects on their neighboring areas although the effect of a decrease in temperature as the distance increases is not very obvious.
- In the year 2003, the average temperature of 26.35 °C changed to 25.16 °C after 100 m buffer analysis and to 25.31 °C after 200 m. Between 300 m and 1000 m, the average temperatures were as follows: 25.31 °C, 25.98 °C, 25.27 °C, 25.39 °C, 25.73 °C, 24.87 °C, 25.13 °C, and 25.56 °C, respectively. The fallowed paddy field did not have the same positive influence on the regional average temperature.
The result of satellite image analysis shows that the average temperature of the paddy field point is 2.5 °C lower than the total average in the Taoyuan research area and 3.3 °C lower than that in the Hsinchu research area. The average temperature in these two areas of the paddy field point is also 2.9 °C lower than the total average of these two areas, whether the paddy field is located in the rural area or the urban area. This fact can also prove that paddy fields have the effect of significantly mitigating the temperatures in surrounding areas.
Given the evidence of the buffer analysis undertaken in the Gobei area, the temperature in 2002 was higher without fallow than in 2003 with fallow. Significantly, the existence of paddy fields has the effect of temperature mitigation.
3. Contingent Valuation Method (CVM)
The main purpose of the contingent valuation method (CVM) is to express people’s preference for non-market goods in monetary amounts. Chiueh (2012) [19] used the conjunction evaluation method of the contingent valuation method and analysis network procedures to evaluate the environmental multifunctionality of paddy fields in Taiwan. Chiueh and Chen (2008) [20] evaluated the environmental multifunctionality of paddy fields in Taiwan by the CVM. However, there is a lack of literature on economic benefits that focuses on the evaluation of the paddy field cooling effect. The paddy field cooling effect cannot be categorized as general wealth and goods in the sense that there are no real markets or transactions. Therefore, its economic value cannot be determined through direct observations of market prices or the number of transactions. In this paper, the CVM was adopted to evaluate experts’ evaluations of the paddy field cooling effect.
3.1. Theoretical and Empirical Model of the Contingent Valuation Method (CVM)
The theoretical and empirical model is as follows:
Y (Q0, Q1, S) = E (Q0, U0, S) − E (Q1, U1, S).
Y (Q0, Q1, S) is the bidding function of the benefits of the paddy field cooling effect and E (Q0, U0, S) is the expenditure function. In Equation (1), U0 is the utility function before the benefits of the paddy field cooling effect change, Q0 refers to the current benefits of the paddy field cooling effect, Q1 refers to the decrease in the benefits of the paddy field cooling effect for every degree Celsius increase after the cultivation land area is reduced, and S is the price vector of market wealth and the vector of personal socioeconomic characteristics, wherein
where SO is the vector of personal socioeconomic characteristics, PW is the product price related to the benefits of the paddy field cooling effect, and PX is the price of products from other markets.
S = S (PW, PX, SO),
If the price offer provided by the CVM questionnaire is T dollars, then
Y (Q0, Q1, U0, S) ≥ T.
The respondents will tick this price offer, the probability of which can be expressed by Equation (6):
where Y * is the observable component (observable component) and u is the observed random component, as shown in Equation (7):
Pr = Pr [Y * (Q0, Q1, U0, S) − T > u],
Y (Q0, Q1, U0, S) = Y * (Q0, Q1, U0, S) + u.
The bidding function is estimated through the logistic model:
Assuming u is the logistic distribution, the empirical results can be estimated through the logistic model [21], as shown in Equation (8):
P (Y) = [1 + e − [Yi − Ti]] − 1.
The same method as the Probit model can also be adapted to obtain
where Yi * is the price experts are willing to pay for the benefits of the paddy field cooling effect and Xi is the relevant independent variable of the experts’ willingness to pay for the benefits of the paddy field cooling effect.
Yi * = Xi′ B,
3.2. Questionnaire and Sampling Design
The first part of the questionnaire examines the respondents’ knowledge and their degree of emphasis on the benefits of the paddy field cooling effect. The second part of the questionnaire covers descriptions of the hypothetical market through the CVM and the price inquiry questions. The hypothetical Situation of the hypothetical questions are as Figure 8.
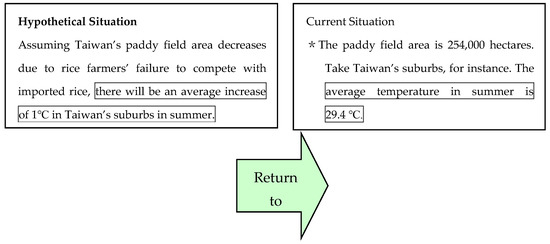
Figure 8.
The hypothetical Situation of the hypothetical questions.
The respondents were then asked, “If Taiwan’s paddy field area decreases due to rice farmers’ failure to compete with imported rice, which results in an average increase of 1 °C in Taiwan’s suburbs in summer if every kilogram of Taiwan rice is $______ more expensive than imported rice that has the same quality as Taiwan rice, will you be willing to continue buying local rice so that the regional temperature can be decreased by 1 °C to return to the current standard?” (The current average price is provided to respondents for reference). In the last part of the questionnaire, the socioeconomic variables of the respondents were inquired after to facilitate data analysis.
3.3. Sampling Design and Empirical Results
Since the paddy field cooling effect is not common knowledge the general public is familiar with, to correctly evaluate the paddy field cooling effect and the benefits of reducing the temperature by 1 °C, purposive sampling was adopted in this study to select experts and scholars for interviews. The questionnaire copies were distributed to supervisors engaged in paddy business execution and related research fields from the Water Resources Agency, the Ministry of Economic Affairs, and the Council of Agriculture, Executive Yuan; scholars from water fields; and scholars from agricultural economics fields. As for the questionnaire interview method, the questionnaires were sent by mail on 23 August 2010, and the questionnaire recovery work was completed on 17 September 2010. Valid questionnaire recovery rates are usually low for interviews sent by mail, but since the experts selected for this study were all concerned with the issue, the questionnaire recovery rate of the questionnaires sent by mail reached 50% or higher, and the valid questionnaire recovery rate exceeded 40%. The sampling design, distribution dates, questionnaire recovery rates, and the descriptive statistics of the valid questionnaire are shown in Table 4; the descriptive statistics of the samples are shown in Table 5.

Table 4.
Sampling design and valid number of questionnaire copies.

Table 5.
Descriptive statistics of questionnaire empirical results.
Empirical results, as shown in Table 6, indicate that the more information about the paddy field cooling effect the respondents got, the more the WTP there was to maintain the benefits of the paddy field cooling effect.

Table 6.
The empirical results of the LOGIT model.
3.4. The Economic Value of the Paddy Field Cooling Effect in Taiwan
Based on the estimate results, it was found that the respondents in Taiwan are willing to pay an extra 8.89 USD/per kg rice/year for paddy to decrease the temperature by 1 °C in the regional microclimate due to the paddy field, thus indicating the great concern for the issue of increasing temperatures. In this regard, the economic value of 1 °C must not be underestimated. In conclusion, more caution is needed while making decisions to change the land use of paddy fields to other land uses.
3.5. The Value of a Decrease of 1 °C in the Regional Microclimate in Taiwan by Applying the Benefits Transfer Method
This study applied the benefits transfer method with the respondents’ willingness to pay for preventing a 1 °C increase in temperature within the region as the basis. The hypothetical premises of the model are (1) showing balanced market supply and demand, (2) showing the value of evaluation through wealth or services the general public is familiar with, and (3) regardless of the distance between household units and paddy field areas, showing that the cooling effect of paddy field areas is the same on all household units.
The calculation model is as shown in the following equation:
Value of decrease:
where
1 °C = WTP * H * R,
Value of a decrease of 1 °C: the value of a decrease of 1 °C in the regional microclimate in Taiwan.
WTP: the respondents’ willingness to pay in order to prevent a temperature increase of 1 °C. According to the empirical results in this survey study, the respondents are willing to pay USD 8.89 per kilogram of rice per year.
H: population of the region affected.
R: average kilograms of rice consumed per person each year.
In this study, through the paddy field cooling effect and in the face of worsening extreme global climate, the WTP of the respondents in Taiwan for a decrease of 1 °C with regard to the regional microclimate was evaluated. It was found that the economic value of a temperature decrease of 1 °C in the regional microclimate amounted to approximately 9,693,144,279 USD/year (shown in Table 7), thus indicating the general public’s great concern for the issue of rising temperatures.

Table 7.
The Economic Value of a temperature decrease of 1 °C in the regional microclimate in Taiwan.
4. Conclusions
In the face of the global warming problem, the existence of paddy fields may be one of the natural solutions to regional temperature mitigation. Paddy cultivation, compared with other vegetation, may have more functions, for example, related to production, ecology, and social lives. The study of the effect of temperature mitigation induced by fallowing paddy fields analyzed the paddy field cooling effect, evaluated the economic valuation of the paddy field cooling effect by the contingent valuation method, and applied the benefits transfer method to evaluate the value of a decrease of 1 °C in the regional microclimate in Taiwan. The following conclusions are drawn:
- The result of overall surface temperature deductive analysis revealed that the temperature in the whole Taoyuan research area was 1.2 °C higher in 2002 than in 2003 because of fallowing of the paddy field, while in the Hsinchu research area, it was 1.5 °C higher in 2002 than in 2003, due to the same reason described above.
- In terms of the difference in land use, the result of surface temperature deduction showed that the average paddy field temperature in 2002 was 25.0 °C (sample area average), which was 6.6 °C lower than that of the building and road point and 2.6 °C lower than that of the bare land point. The average paddy field temperature in 2003 was 23.6 °C (sample area average), which was 7.2 °C lower than that of the building and road point and 8.3 °C lower than that of the bare land point.
- As for the Hsinchu research area, the surface temperature deductive result showed that the average paddy field temperature in 2002 was 22.3 °C (sample area average), which was 7.7 °C lower than that of the building and road point and 4.3 °C lower than that of the bare land point. The average paddy field temperature in 2003 was 19.2 °C (sample area average), which was 10.1 °C lower than that of the building and road point and 8.3 °C lower than that of the bare land point.
- After adjusting for average differences, the average temperature of the Gobei work group was 23.28 °C in 2002, which was 3.0 °C lower than in 2003. Using the Gobei area as a datum, by applying the GIS to undertake buffer analysis from 100 m to 1000 m, with every 100 m as a buffer unit, surface temperature calculations showed that the regional average temperature was lower in the paddy fields in 2002 and higher during fallow. This is the positive effect on the temperature of the surrounding areas under the existence of paddy cultivation.
- This paper unambiguously concludes that the shift of agricultural water resources to meet the needs of the non-agriculture sector by practicing fallowing of paddy fields is not only at the cost of interrupting the agricultural production but also at the cost of sacrificing the comfort of people in the hot season.
- By using the CVM model, it was found that the respondents in Taiwan are willing to pay an additional 8.89 USD/per kg rice/year for the paddy to decrease the temperature by 1 °C in the regional microclimate due to the paddy field cooling effect.
- Applying the benefits transfer method, it was found that the economic value of a temperature decrease of 1 °C in the regional microclimate in Taiwan amounted to 9,693,144,279 USD/year.
- If the paddy fields near urban areas are converted to built-up areas continuously, the urban heat island effect may become more significant, along with other harmful results, such as concentrated rainfall, floods, droughts, and harvest shortfall. In conclusion, more caution is needed while making decisions to change the land use of paddy fields to other land uses.
Author Contributions
Conceptualization, Y.-W.C. and C.-H.T.; methodology, Y.-W.C. and C.-H.T.; software, C.-H.T. and Y.-W.C.; validation, C.-H.T., Y.-W.C. and H.-Y.H.; formal analysis, Y.-W.C., C.-H.T. and H.-Y.H.; investigation, Y.-W.C. and C.-H.T.; resources, C.-H.T. and Y.-W.C.; data curation, C.-H.T. and Y.-W.C.; writing—original draft preparation, Y.-W.C. and C.-H.T.; writing—review and editing, Y.-W.C.; project administration, C.-H.T. and Y.-W.C.; funding acquisition, C.-H.T. and Y.-W.C. All authors have read and agreed to the published version of the manuscript.
Funding
Ministry of Science and Technology, Taiwan and Council of Agriculture, Executive Yuan, Taiwan.
Institutional Review Board Statement
Not applicable.
Informed Consent Statement
Not applicable.
Data Availability Statement
The data presented in this study are available on request from the corresponding author.
Conflicts of Interest
The authors declare no conflict of interest.
References
- Cheng, K.S.; Su, Y.F.; Kuo, F.T.; Hung, W.C.; Chiang, J.L. Assessing the effect of landcover changes on air temperature using remote sensing images—A pilot study in northern Taiwan. Landsc. Urban Plan. 2008, 85, 85–96. [Google Scholar] [CrossRef]
- Yokohari, M.; Brownb, R.D.; Katoc, Y.; Yamamoto, S. The cooling effect of paddy fields on summertime air temperature in residential Tokyo, Japan. Landsc. Urban Plan. 2001, 53, 17–27. [Google Scholar] [CrossRef]
- Terjung, W.H.; Mearns, L.O.; Todhunter, P.E.; Hayes, J.T.; Ji, H.-Y. Effects of monsoonal fluctuations on grains in China. Part II: Crop water requirements. J. Clim. 1989, 2, 19–37. [Google Scholar] [CrossRef]
- Tsai, J.L.; Tsuang, B.J.; Lu, P.S.; Yao, M.H.; Shen, Y. Surface energy components and land characteristics of a rice paddy. J. Appl. Meteorol. Climatol. 2007, 46, 1879–1900. Available online: http://www.jstor.org/stable/26172104 (accessed on 25 January 2021). [CrossRef]
- Liu, T.; Yu, L.; Zhang, S. Land surface temperature response to irrigated paddy field expansion: A case study of semi-arid western Jilin Province, China. Sci. Rep. 2019, 9, 1–8. [Google Scholar] [CrossRef] [PubMed]
- Kalnay, E.; Cai, M. Impact of urbanization and land-use change on climate. Nature 2003, 423, 528–531. [Google Scholar] [CrossRef]
- Sun, C.Y. The relationship between green roofs and the thermal environment in Taipei city. WIT Trans. Ecol. Environ. 2010, 138, 77–88. [Google Scholar]
- Chen, Y.C.; Tan, C.H.; Wei, C.; Su, Z.W. Cooling Effect of Rivers on Metropolitan Taipei Using Remote Sensing. Int. J. Environ. Res. Public Health 2014, 11, 1195–1210. [Google Scholar] [CrossRef] [PubMed]
- Yoshida, R.; Iizumi, T.; Nishimori, M. Impact functions for land-use-induced surface warming, and their applications in uncertainty analysis. Clim. Res. 2014, 59, 77–87. [Google Scholar] [CrossRef][Green Version]
- Tan, C.H.; Chu, T.W.; Jao, C.C. Cooling effect range assessment of paddy fields in urban neighborhood by Landsat thermal imagery. In Proceedings of the 32nd Asian Conference on Remote Sensing, Taipei, Taiwan, 3–7 October 2011; pp. 1857–1862. [Google Scholar]
- Hutchison, B.A.; Taylor, F.G. Energy conservation mechanisms and potentials of landscape design to ameliorate building microclimates. Landsc. J. 1983, 2, 19–39. [Google Scholar] [CrossRef]
- Thiery, W.; Visser, A.J.; Fischer, E.M.; Hauser, M.; Hirsch, A.L.; Lawrence, D.M.; Lejeune, Q.; Davin, E.L.; Seneviratne, S.I. Warming of hot extremes alleviated by expanding irrigation. Nat. Commun. 2020, 11, 1–7. [Google Scholar] [CrossRef] [PubMed]
- Chiueh, Y.W.; Tan, C.H.; Hsu, H.Y. How much does 1 degree Celsius worth? -The economic value of paddy field Heat Sink Effect evaluate by the Contingent Valuation Method. In Proceedings of the International Commission on Irrigation and Drainage 2015, 26th Euro-Mediterranean Regional Conference and Workshops Innovate to improve Irrigation performances, Montpellier, France, 12–15 October 2015. [Google Scholar]
- Water Resource Agency. Available online: https://www.wra.gov.tw/cl.aspx?n=18763 (accessed on 19 February 2021).
- Ajaz, A.; Taghvaeian, S.; Khand, K.; Gowda, P.H.; Moorhead, J.E. Development and evaluation of an agricultural drought index by harnessing soil moisture and weather data. Water 2019, 11, 1375. [Google Scholar] [CrossRef]
- Lian, C.S.; Cheng, K.S.; Jheng, K.S.; Chen, P.Y.; Shen, L.Y. Establishment of the Meteorological of Drought Indicators in Taiwan and Case Analysis of Events. In Proceedings of the 2018 Weather Analysis and Forecast Conference, Central Weather Bureau, Taipei, Taiwan, 11–13 September 2018. [Google Scholar]
- Hung, C.W.; Shih, M.F. Analysis of Severe Droughts in Taiwan and its Related Atmospheric and Oceanic Environments. Atmosphere 2019, 10, 159. [Google Scholar] [CrossRef]
- Campbell, J.B. Introduction to Remote Sensing; The Guilford Press: New York, NY, USA, 1987; p. 203. [Google Scholar]
- Chiueh, Y.W. Environmental Multifunctionality of Paddy Fields in Taiwan—A Conjunction Evaluation Method of Contingent Valuation Method and Analytic Network Procedures. Environ. Nat. Resour. Res. 2012, 2, 114–127. [Google Scholar] [CrossRef][Green Version]
- Chiueh, Y.W.; Chen, M.C. Environmental multifunctionality of paddy fields in Taiwan: An application of contingent valuation method. Paddy Water Environ. 2008, 6, 229–236. [Google Scholar] [CrossRef]
- Cameron, T.A. A new paradigm for valuing non-market goods using referendum data: Maximum likelihood estimation by censored logistic regression. J. Environ. Econ. Manag. 1988, 15, 355–379. [Google Scholar] [CrossRef]
Publisher’s Note: MDPI stays neutral with regard to jurisdictional claims in published maps and institutional affiliations. |
© 2021 by the authors. Licensee MDPI, Basel, Switzerland. This article is an open access article distributed under the terms and conditions of the Creative Commons Attribution (CC BY) license (http://creativecommons.org/licenses/by/4.0/).